Today is Econ Friday, the admin day I have to create a short (ish) update about the US economy, stock market valuations, corporate profit growth, and of course any updates necessary or useful to understand the AI boom.
For good or ill, the AI boom is driving the economy, the stock market, and all the major narratives, so understanding it is what my ZEUS family (and GNG) requires.
I have a few hours before my final meeting of the day, so let me share with you the most important news about the economy this week (including market valuations, profit growth, and all the fundamentals that determine whether the next correction is V-shaped).
Fact 1: Jobs Report Not Surprising: Here’s What You Need To Know
I left these first 2 facts to the end, and I have to leave for my final appointment, so here are the pure facts.
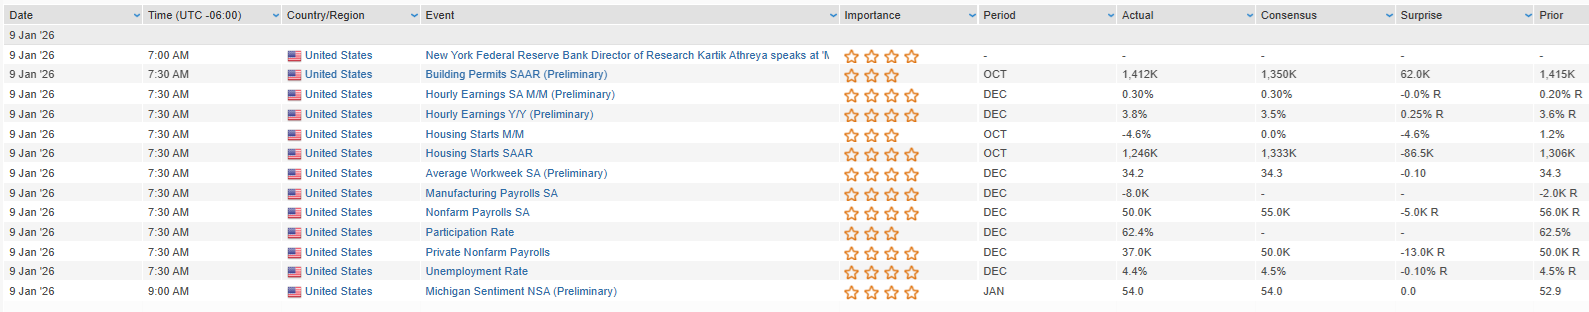
50K vs 55K expected with a 4.4% unemployment rate vs 4.5% expected and wage growth of 3.8% vs 3.5% expected.
Next week I’ll talk about the job market. But TRUST ME, you want to get to Facts 3 through 6 because that’s what really matters.
Fact 2: Economic Growth Continues To Confound (But Also Delight)
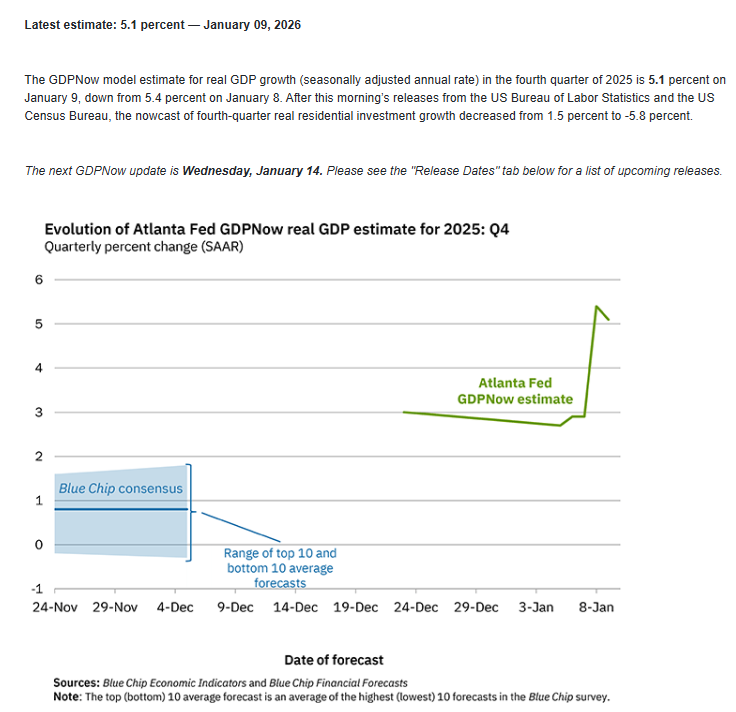
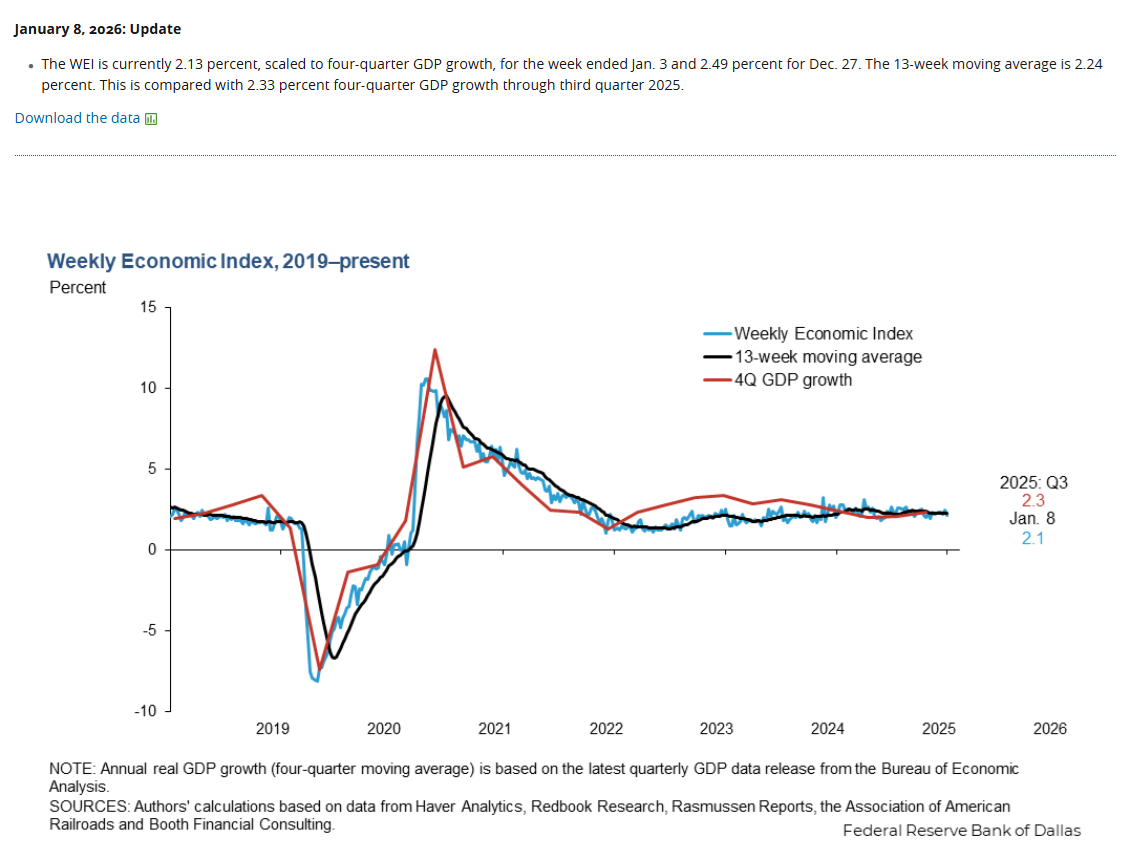
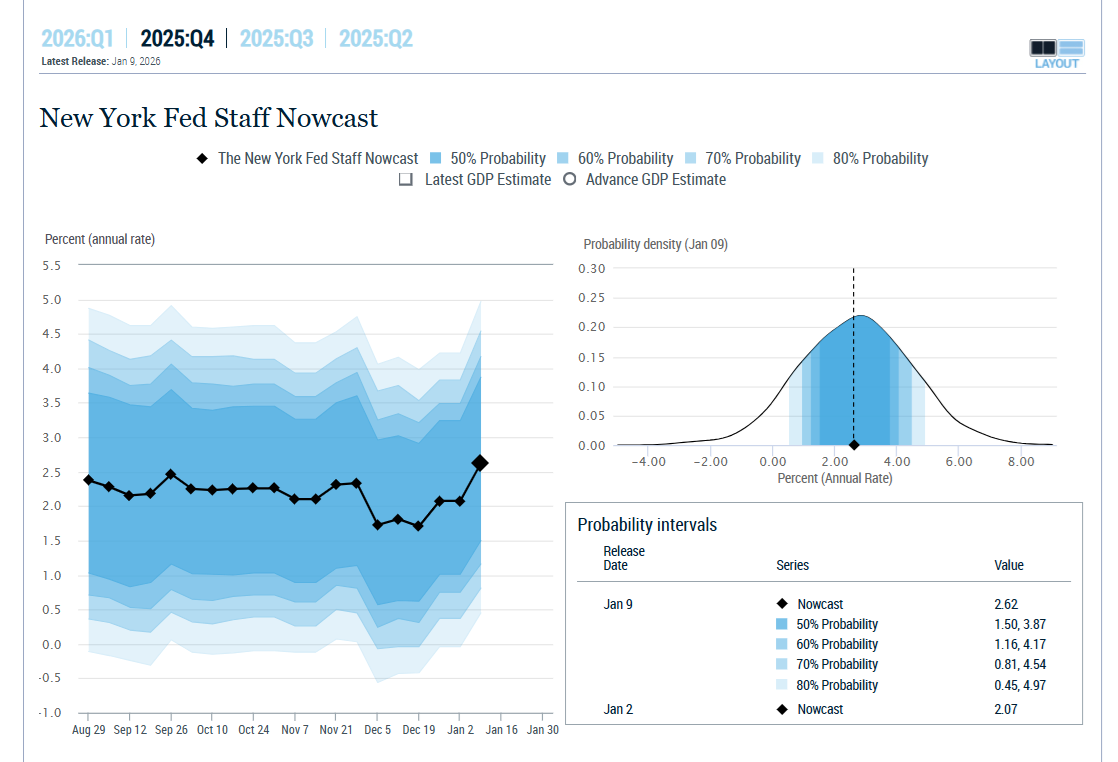
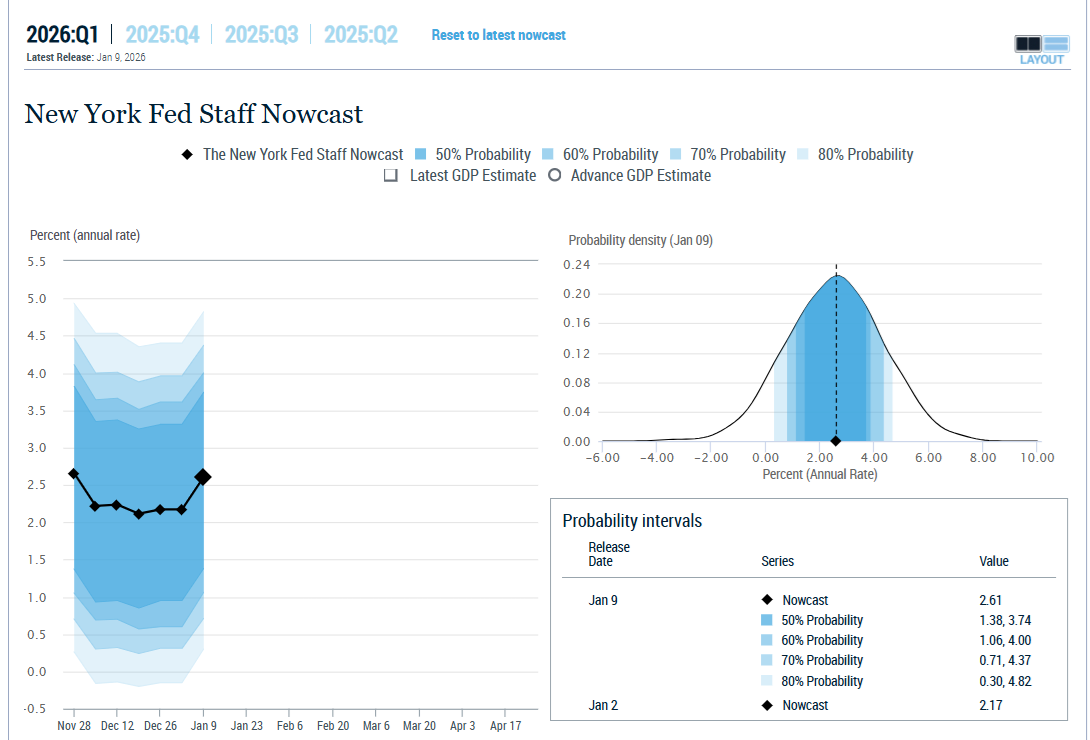
I don’t have time to go into details, BUT I can confirm that all the data I’ve seen (in the charts I review each night) confirms that the economy is NOT growing at sub 1%.
Those economists’ estimates will start to rise to catch up to the hard data, because the economy is growing at 2.1%+ based on everything we can actually see in terms of consumer spending and all the hard data.
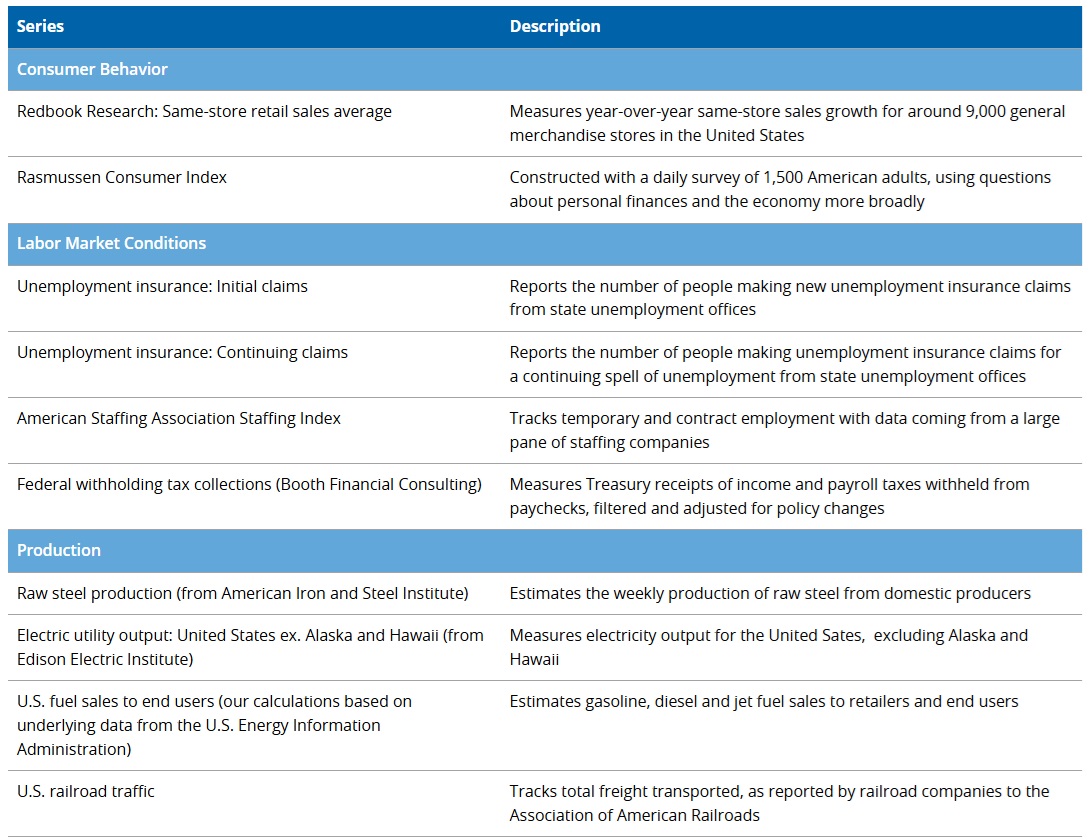
Scott Gallow, Don’t Quote Me Hamburger Helper Sales or Sentiment Surveys When We Have Daily Payroll Tax and Weekly Steel, Electricity, and Gasoline Consumption Data and Railroad and Trucking Data😉😂
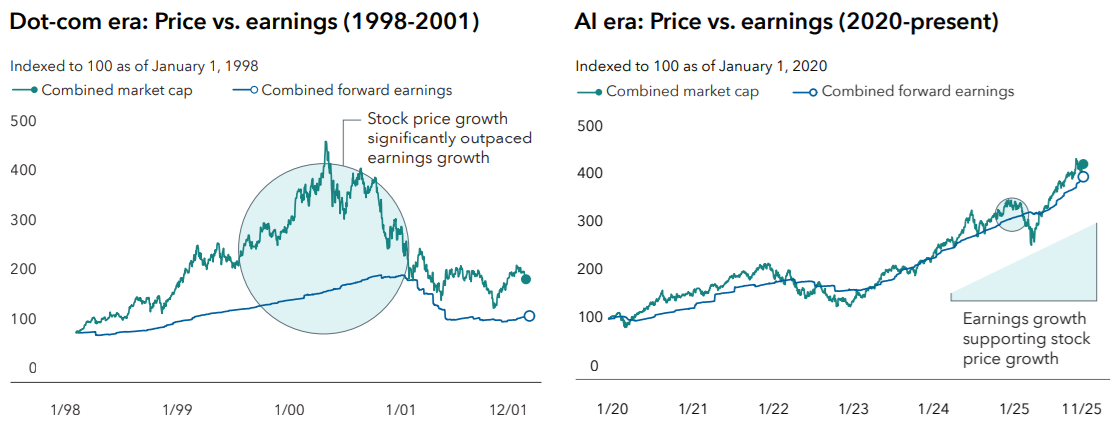
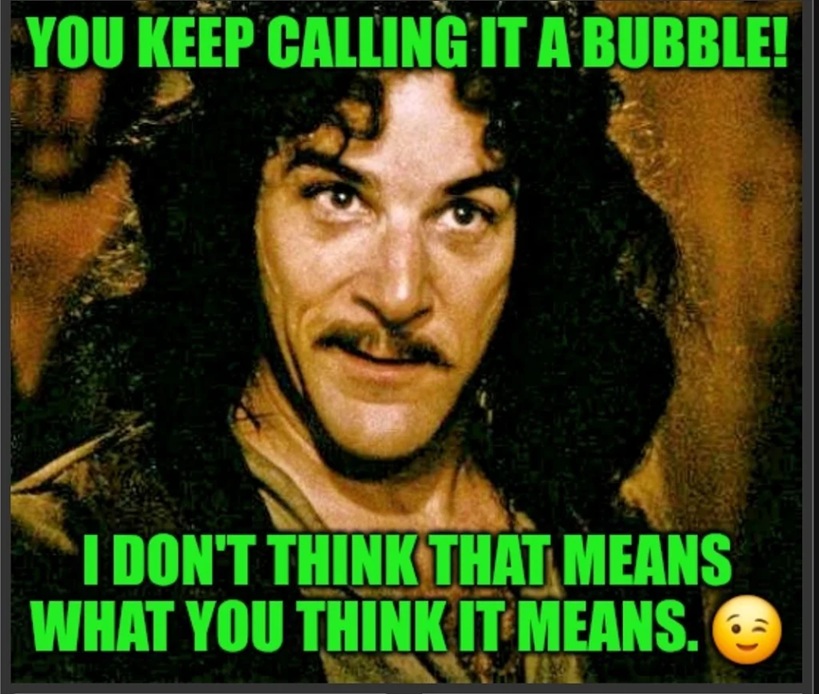
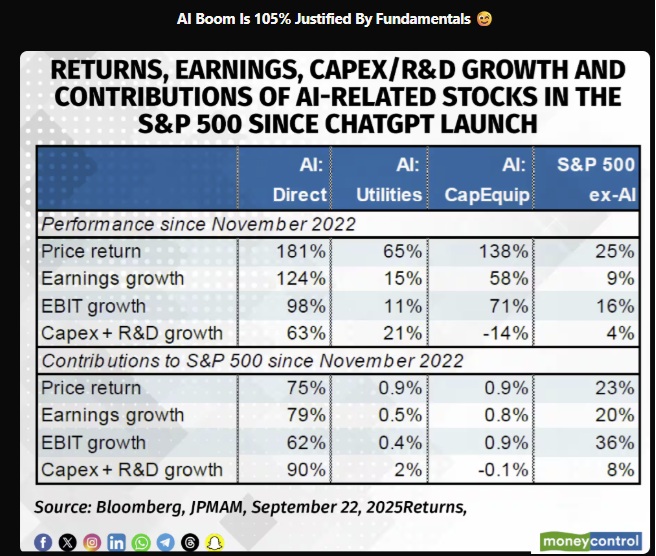
\Fact 3: The “AI Bubble” Is Still NOT A Bubble
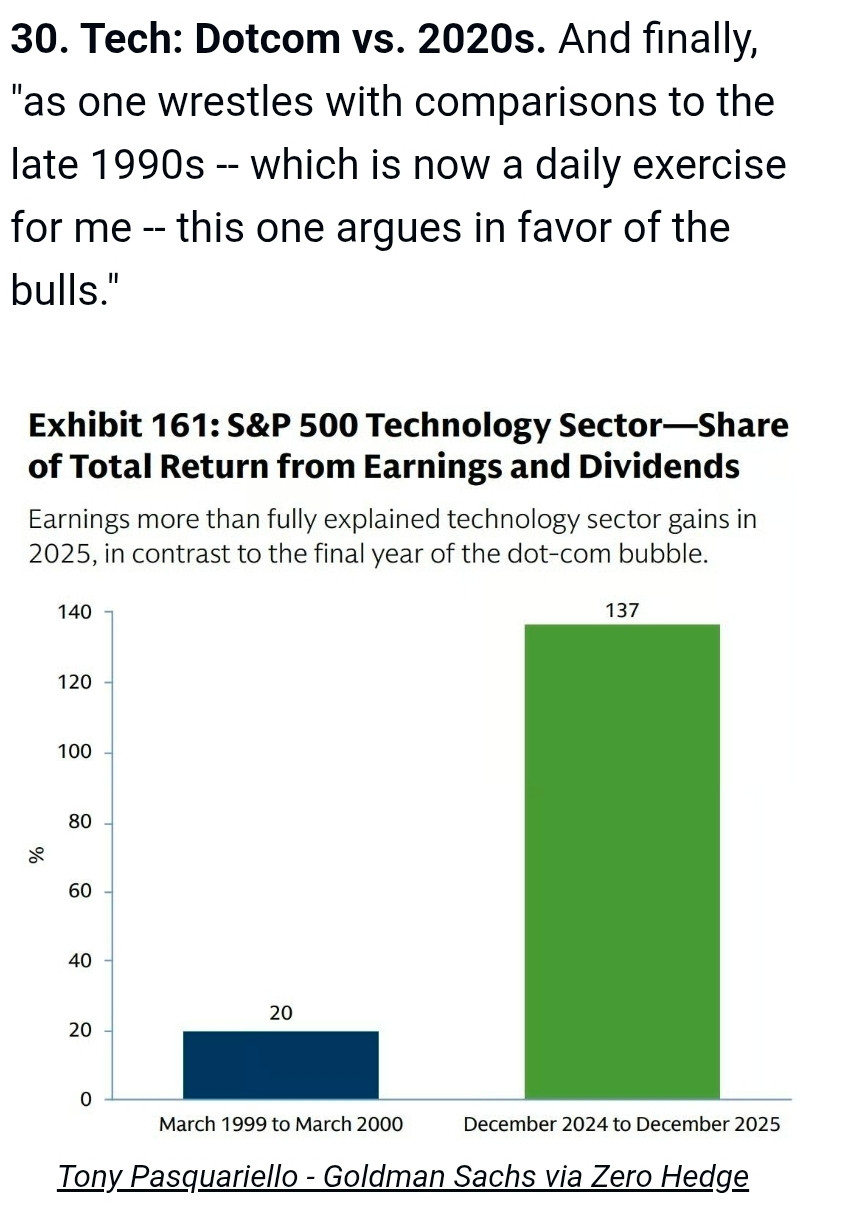
This is not a tech bubble, unless you think that 137% of returns being explained by earnings and dividends is a bubble.
Do you know what this actually means?

And how unsustainable is the AI boom?
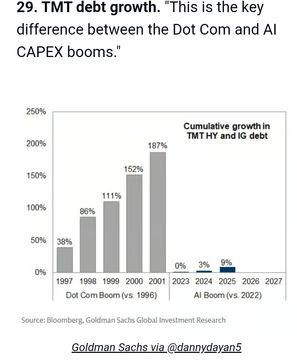
Debt? Of course, some companies are taking on debt, but remember that the Mag 7 are the richest companies in the world.
More cash than debt, and Goldman estimates that the Mag 7 have $1.5 trillion in borrowing capacity while maintaining their current credit ratings.
If something isn’t sustainable, it can’t go on forever and won’t. If something is sustainable (and net beneficial), then it will continue forever.
The “AI Bubble” Might Last Until 2047, “Just” Another 21 Years Until It Pops!😉😂🥳
Fact 4: Market Valuations (Newest PEGY Analysis Shows The Market Even More Undervalued) Record Highs But Bear Market Low Return Potential!
Yes, free cash flow per share is growing so strongly right now that even at record highs, the market is bear market low undervalued!
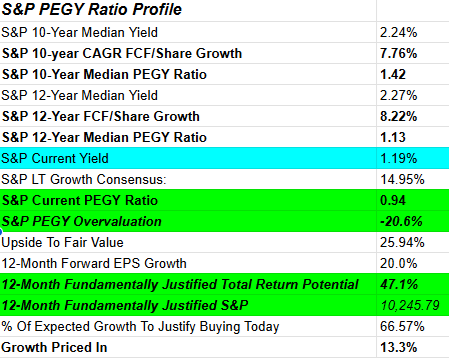
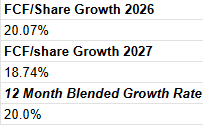
After updating the latest 10- and 12-year FCF/share growth rates (since its a new year), we can see that the historical FCF/share growth rates I had to quadruple-check.
EPS Growth Is Amazing, BUT FCF/Share Growth Is Even Better!
I had to reset the valuation to the more conservative 12-year median because, based on the 10-year median, the market is 33% undervalued (same undervaluation as the 2009 GFC lows).
So, using the more conservative 1.13 historical PEGY (based on free cash flow instead of earnings), we get a 21% discount on the market today (if the growth rates are achieved). Which would be equal to the discounts at the Oct 2022, March 2020, and April 2025 lows.
Yes, free cash flow per share is growing so strongly right now that even at record highs, the market is bear market low undervalued!
Alright, but what if our model is wrong? The math is correct, but what if the model is wrong?
Morningstar’s bottom-up discounted cash flow analysis, based on all their analyst-derived (and growth-adjusted) fair values for the S&P, Nasdaq, and Mag 7, shows a modest discount to fair value.
So either way, NOT A BUBBLE. Unless you completely ignore growth and assume that the growth rates will fail to materialize, and simply revert back to the 50-year average of 6.5% for EPS and 5.5% for FCF/share.
S&P Bottom Up Consensus Growth Rates
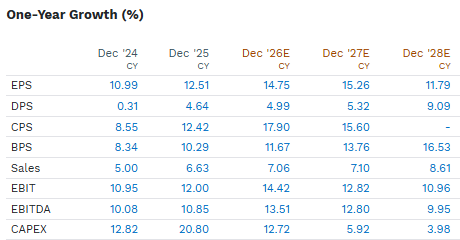
Growth estimates for 2028 were 10.2% at the start of the year. One week later, they are over 11%. Cash flow growth rates are even stronger, and free cash flow per share is even stronger (thanks to buybacks).
And those capex estimates? They keep rising
Historical S&P Growth Rates
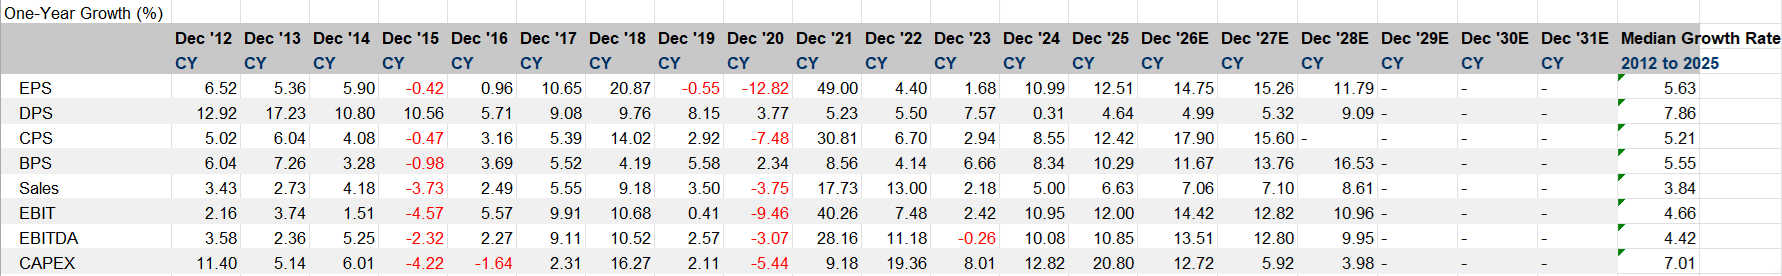
In the last 13 years, we’ve never had more than 2 consecutive years of EPS growth. But in 2026, we’re expected to hit 3 years; in 2027, 4 years; and in 2028, 5 years.
Never in history has the S&P delivered 5 consecutive years of double-digit earnings growth.
The median growth rate since 2012 is 6%, due to earnings recessions.
And right now, we’re facing a potentially unprecedented earnings and free cash flow boom. And people are SO worried about bubbles, and the wall of worry, that valuations are not extreme at all, unless you 100% ignore objectively excellent earnings that companies keep beating quarter after quarter.

Fact 5: Corporate Profits Update: You Know The Stuff That Drives 97% Of Growth?
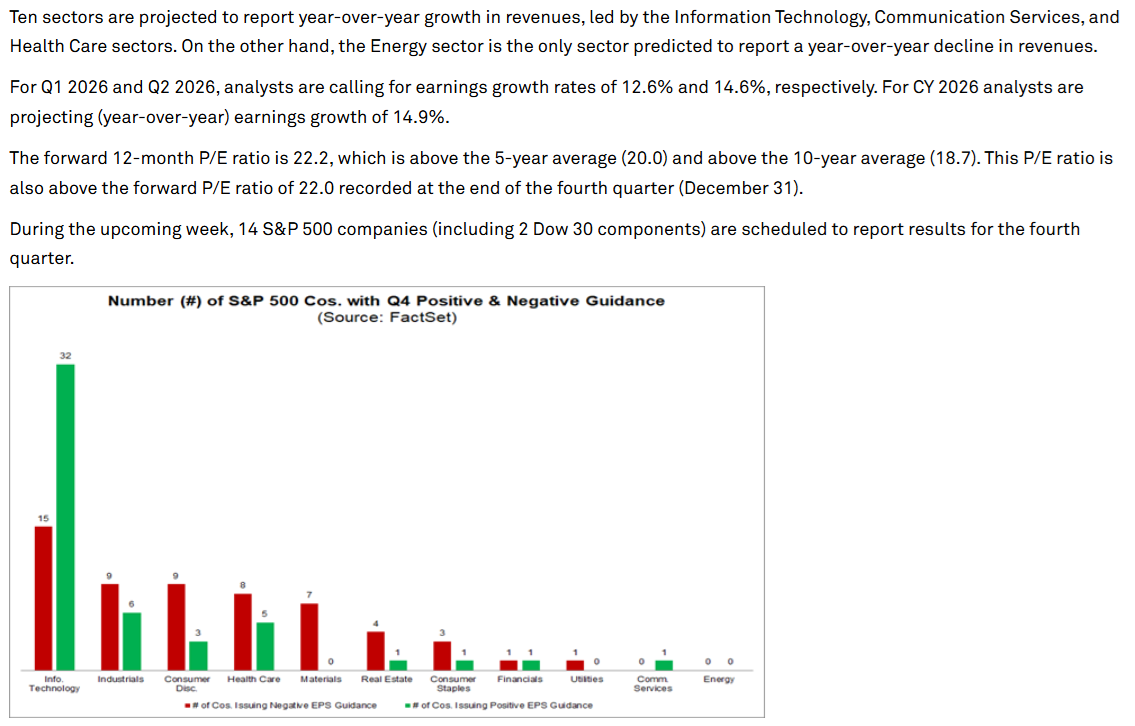
Earnings season starts next week with a modest 14 companies (though banks and airlines are economic harbingers).
End of the month is tech earnings week, the only one that REALLY matters in the age of AI. 😉
As far as the S&P is concerned.
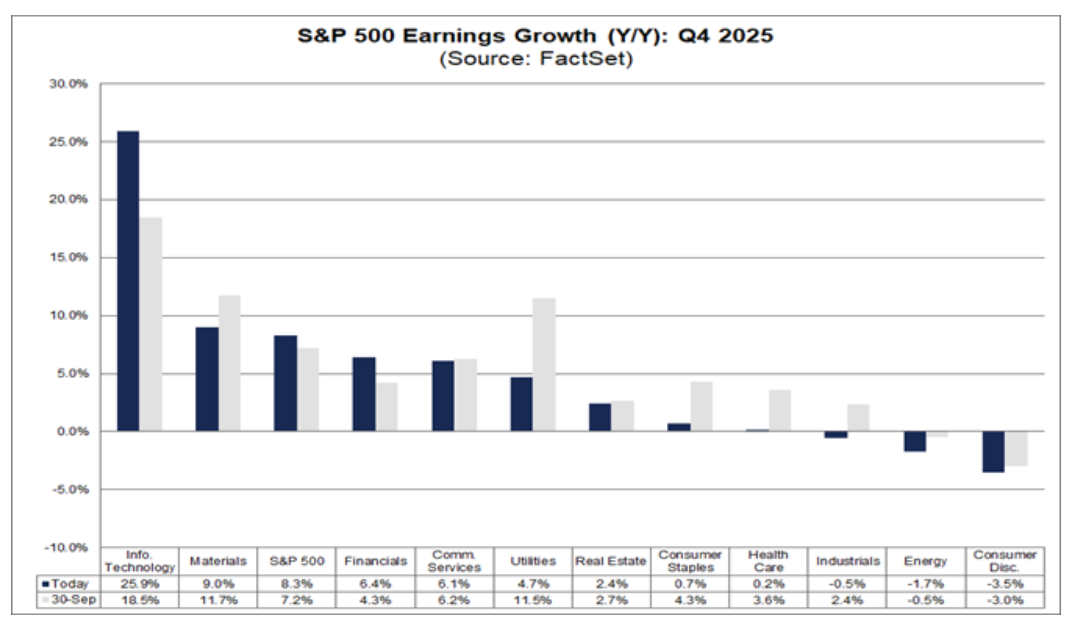
After 29% EPS growth in Q3, tech is expected to report 26% growth in Q4, vs estimates of “just” 18.5% EPS growth 3 months ago.
The S&P’s growth is expected to be 8.3% (up from 7.2% 3 months ago), with tech pretty much driving all growth and every other sector lagging.
92% of Growth Spending is in AI…So, where is all the growth? From the sectors’ spending on growth.
Q4 2025 S&P Consensus Growth
In Q4, pretty much only tech and basic materials are seeing margin growth. Stop being befuddled by why tech keeps going up. Earnings growth of 27% per quarter for the last 2 quarters MIGHT have something to do with it😉
Fact 6: Monte Carlo Simulations For S&P & This Week’s Rolling Guess ETF!
While Monte Carlo simulations are not “crystal balls,” they are the “least stupid” way to estimate what the stock market might do in the short to medium-term. Since people will never stop asking, “What do you think happens next?” here are the statistical probability curves.
In addition to the S&P, which I can run each week (because that’s what “the market” means in the media and to most people), I can also do a weekly “guest ETF” starting with the Nasdaq this week, and then proceeding with popular ETF strategies like:
The Mag 7 (MAGS)
High-yield stocks (VYM and SCHD)
value stocks (VFLO)
Dividend stocks (NOBL and DGRW)
even sector ETFs
It’s a fun and “least stupid” way of seeing what is most likely in the short to medium-term (limited to monthly, 3-month, 6-month, and 12-month) outlook for the sake of convenience.
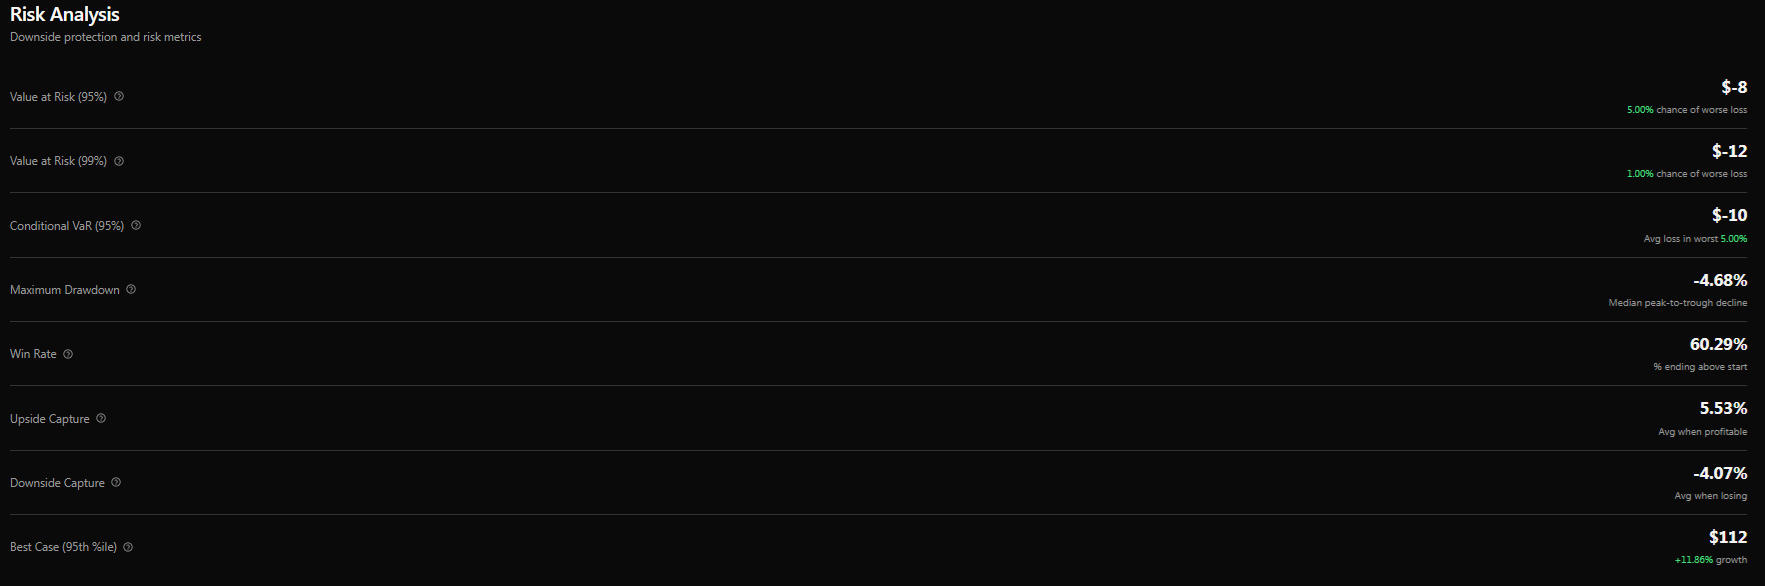
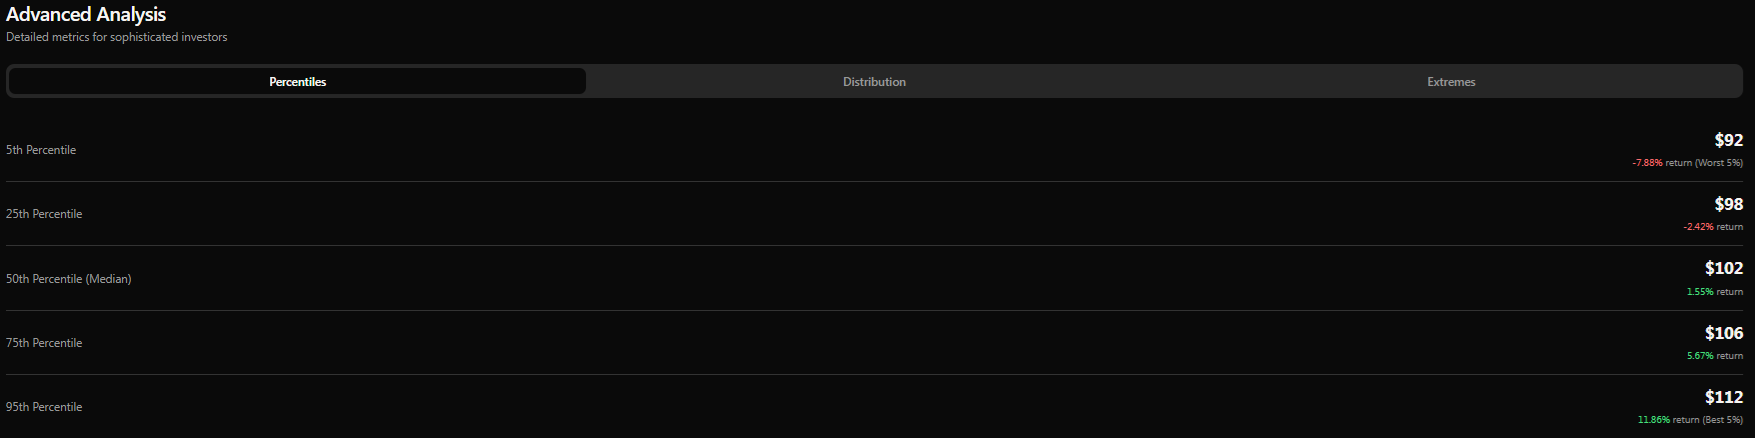
S&P 1 Month: 60% Chance Of A Market Gain
S&P 3 Month: 66% Chance Of A Market Gain
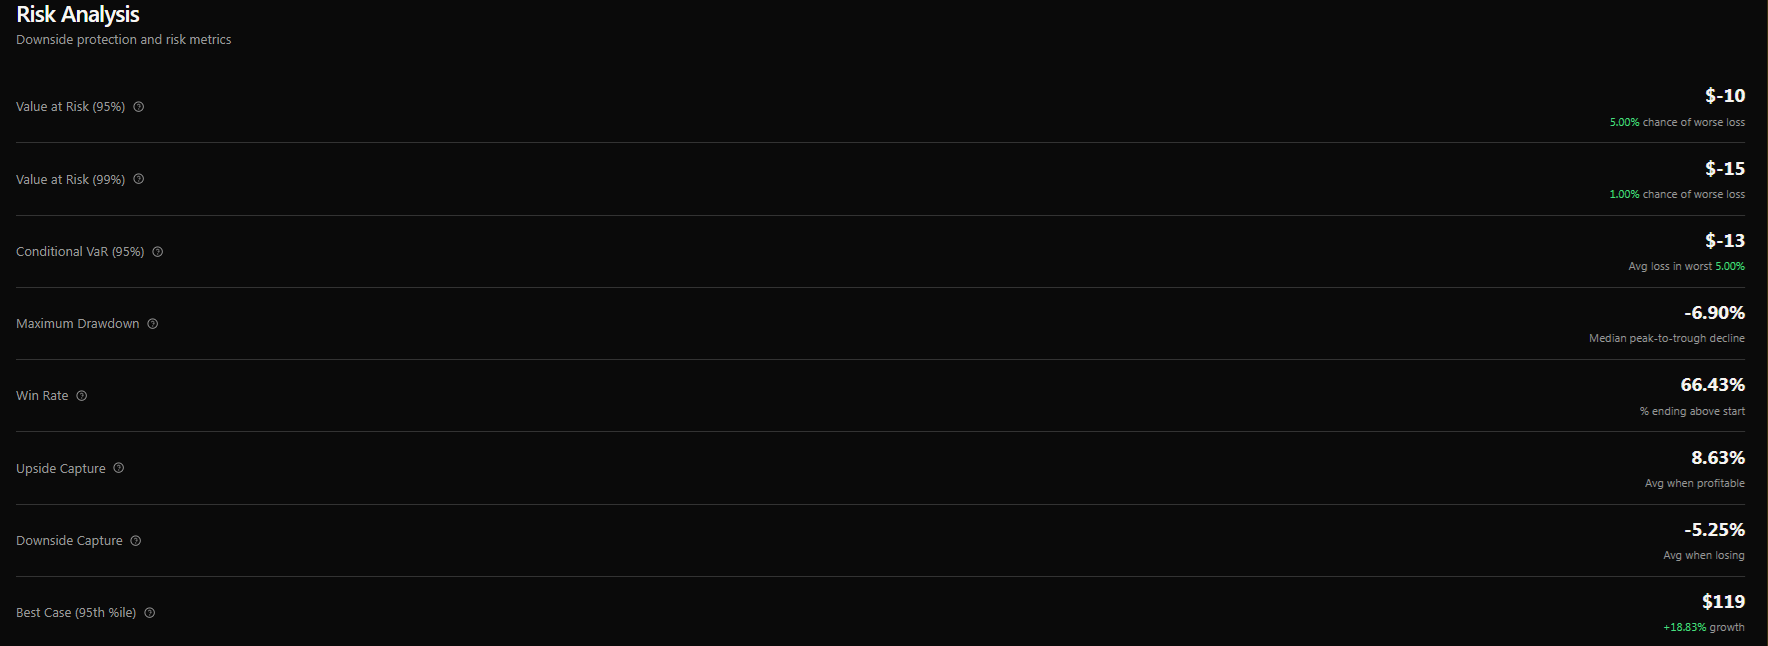
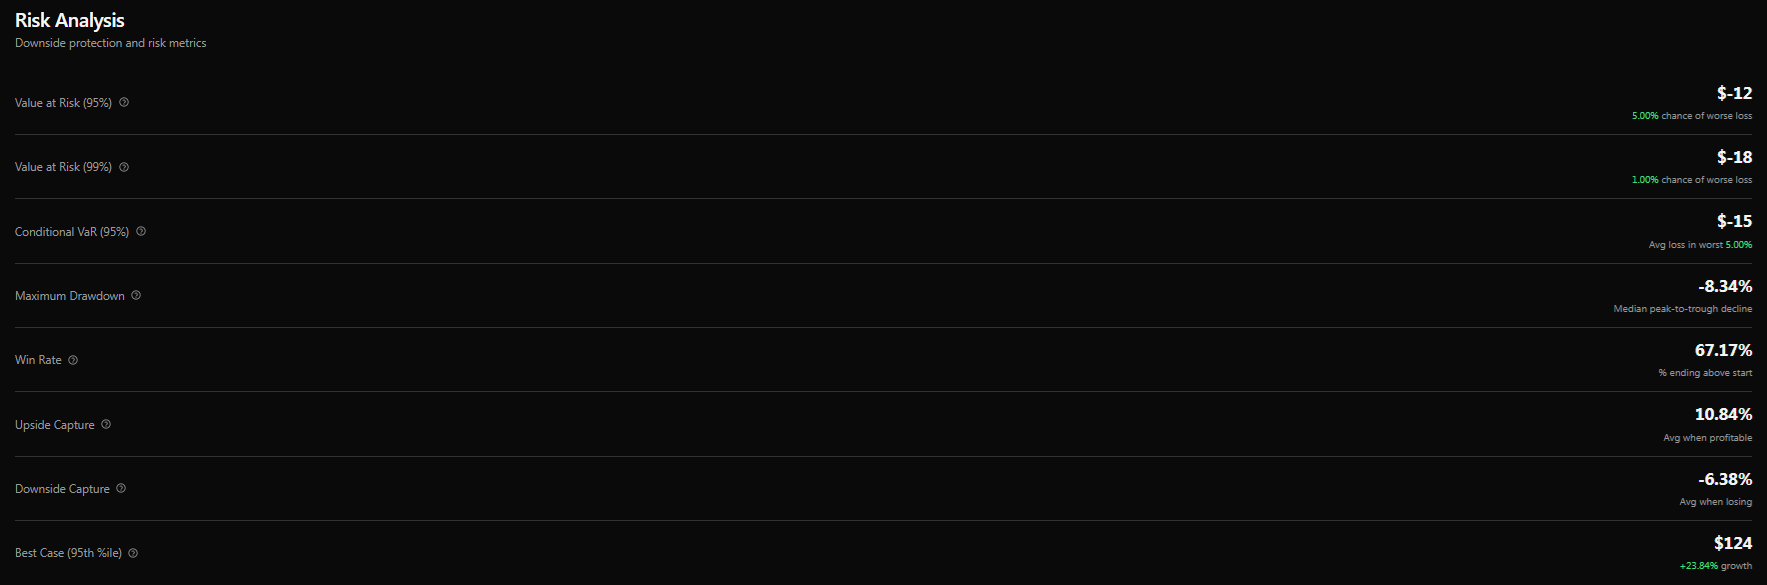
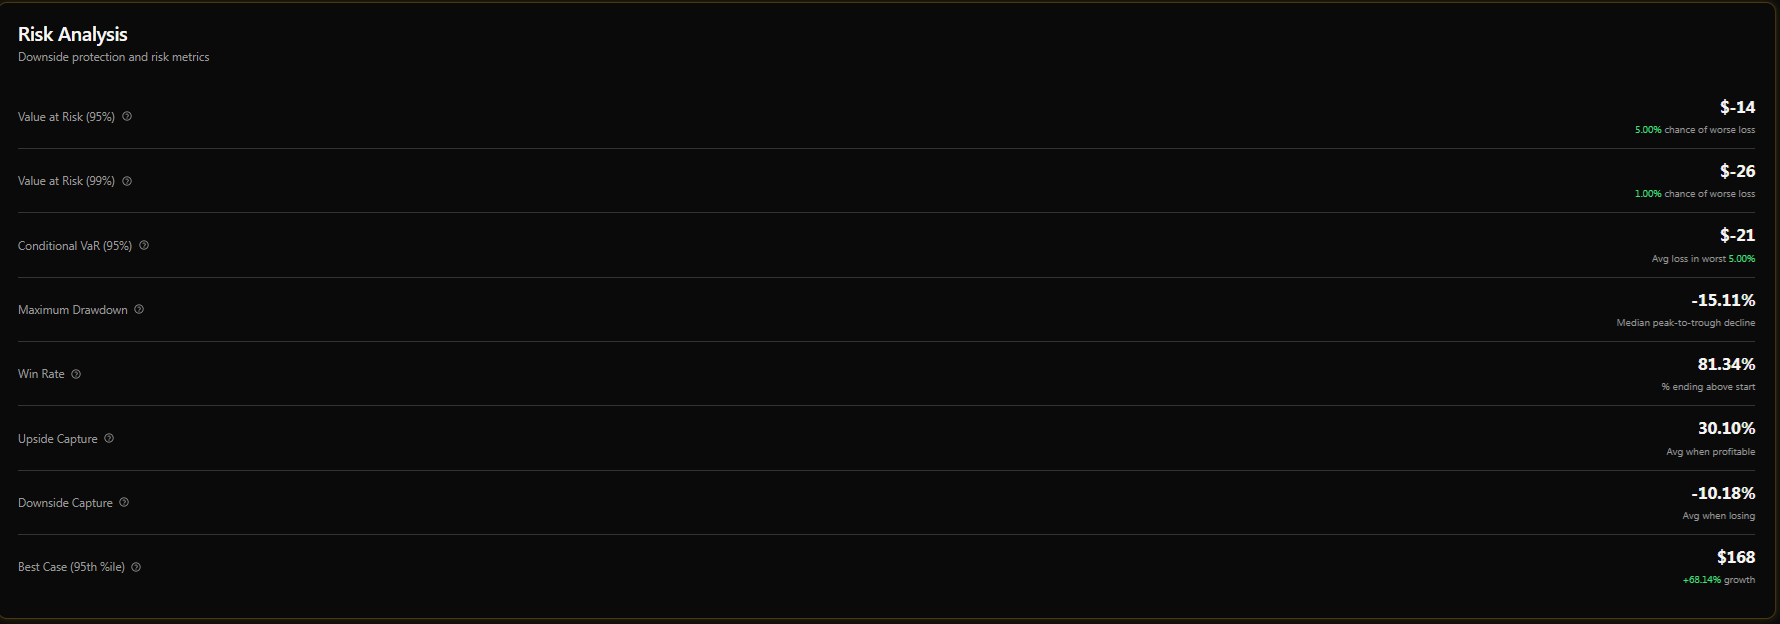
What this is saying is that based on 20 years of market history, the “very bad month” or tail-risk (conditional value at risk) is 13% (average of 5% worst months is a 13% decline).
The average of 1% worst months? -15% decline.
So, given current economic and market conditions, the most likely outcome is a gain, with 66% chance that stocks are up in the next 3 months.
In simulations where stocks are up, they average an 8.63% gain, and when stocks are down, a -5.25% average decline.
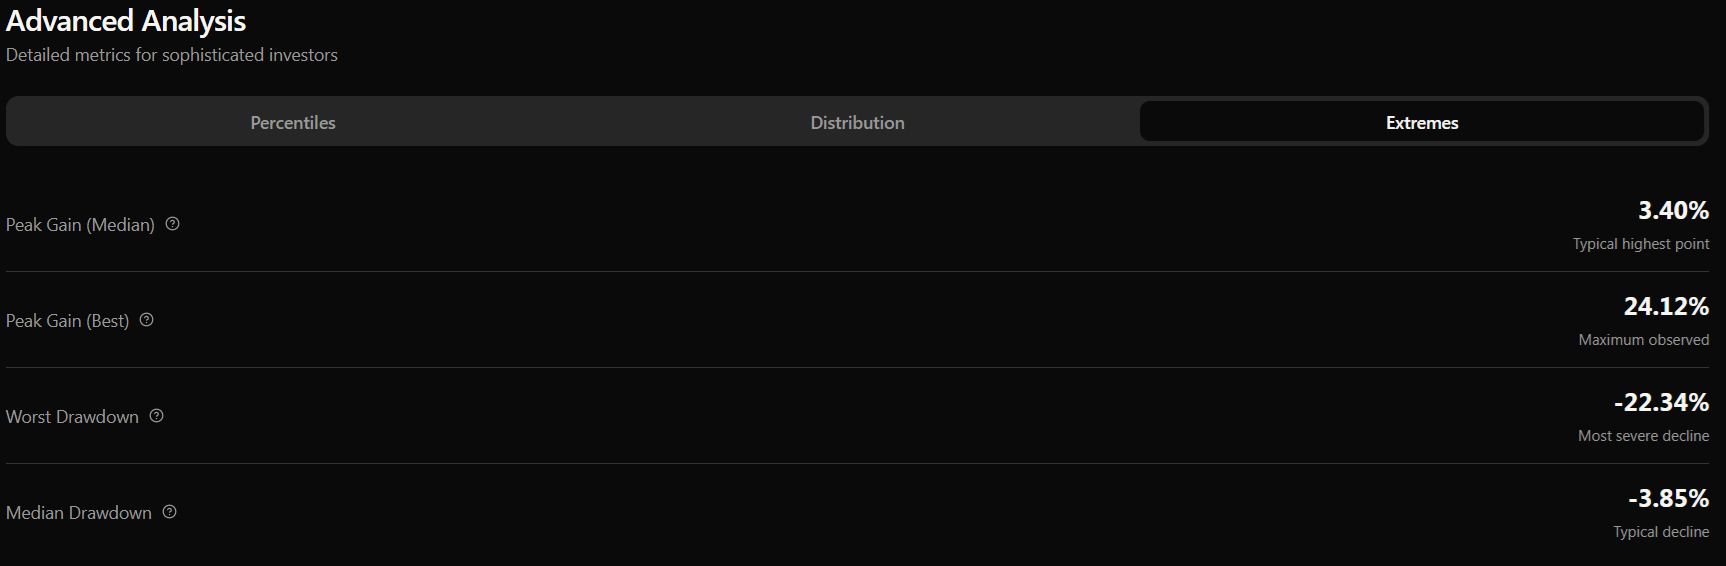
The most common decline over 3 months is a 6.9% pullback.
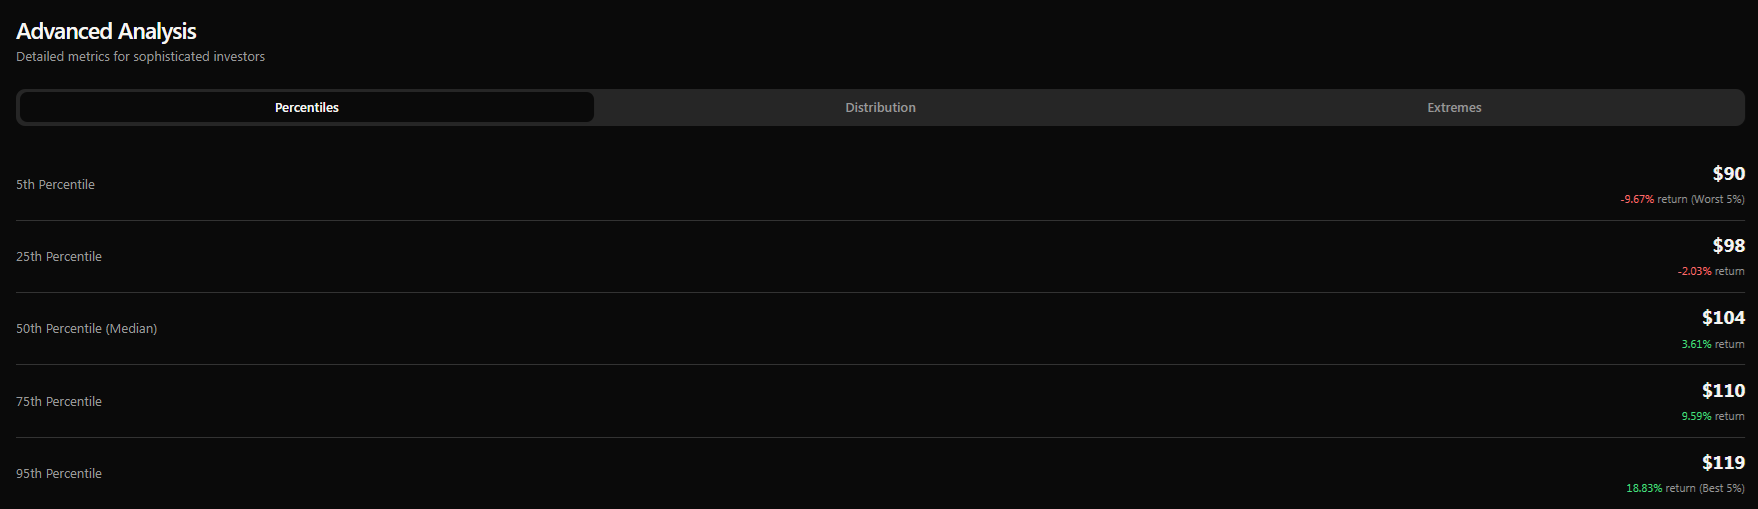
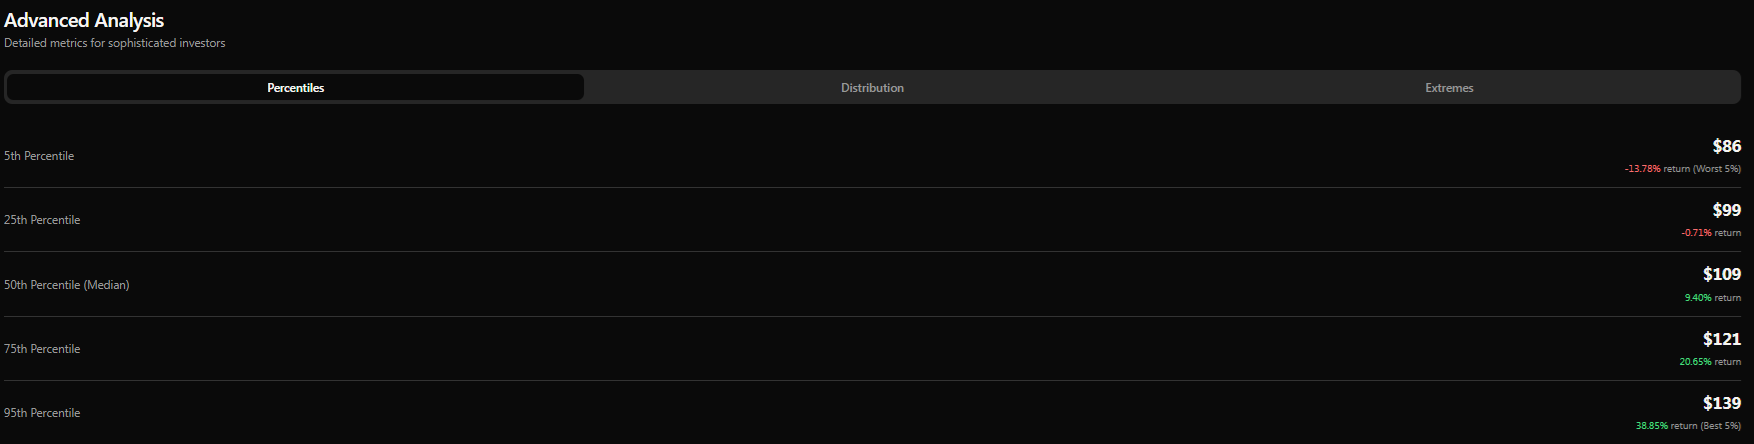
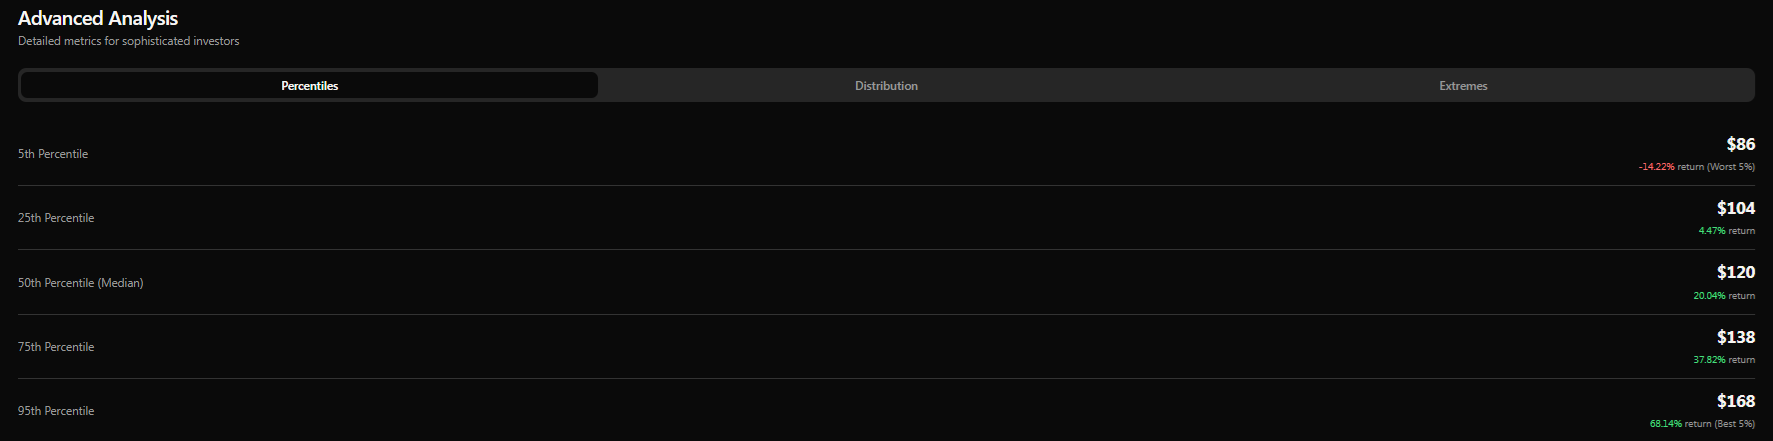
The most likely outcome is a 3.6% gain, with a 25% chance of a nearly-double-digit gain and a 25% chance of a 2% decline.
The risk is to the upside, with a 5% chance of a 10% decline and a 5% chance of a nearly 20% gain.
Almost 2:1 short-term reward/risk ratio.
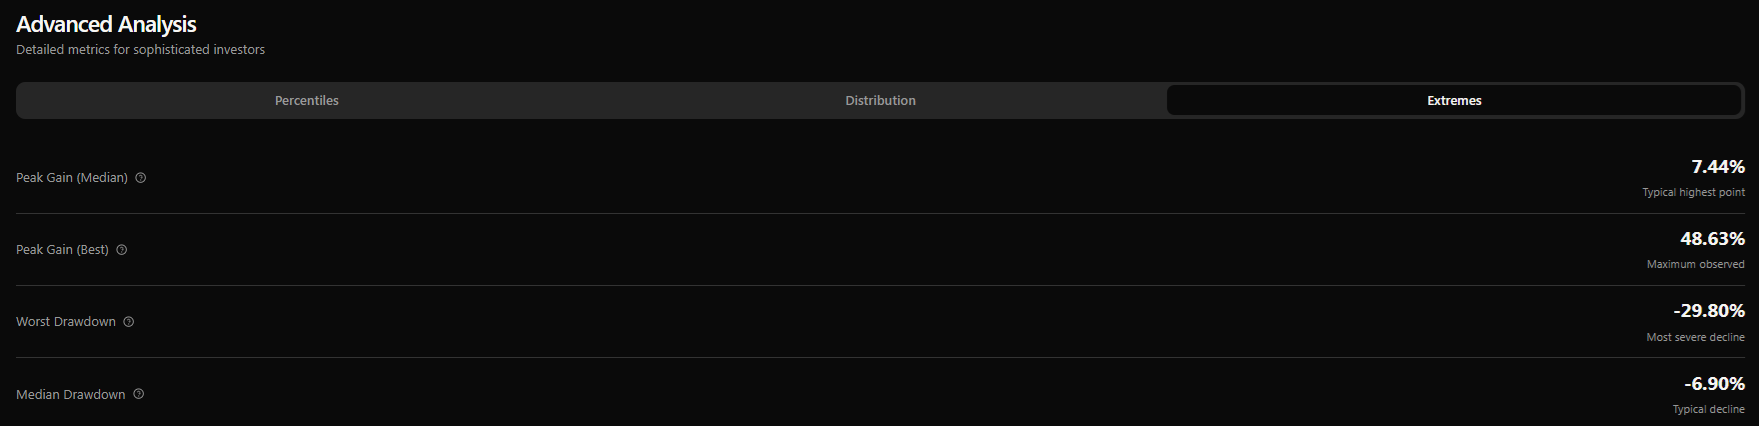
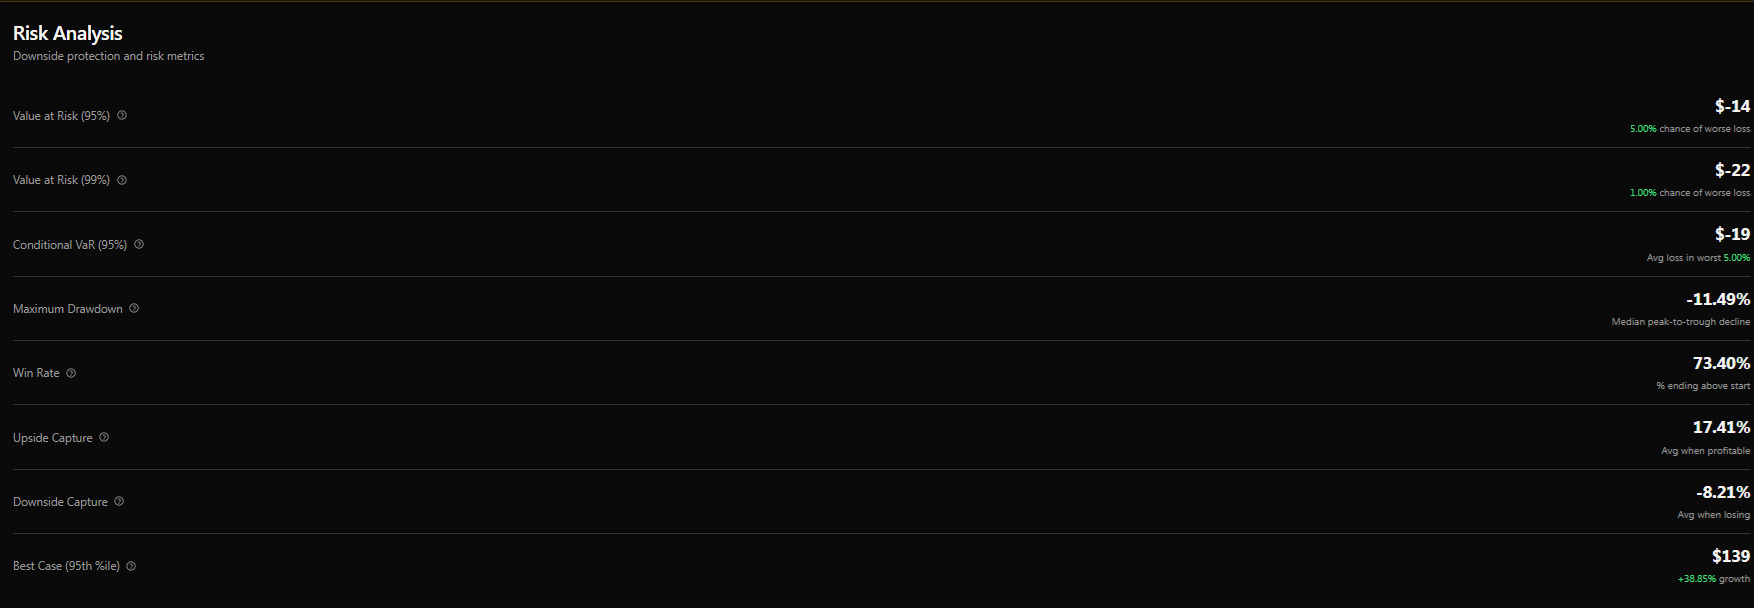
S&P 6 Months: 72% Chance Of A Market Gain
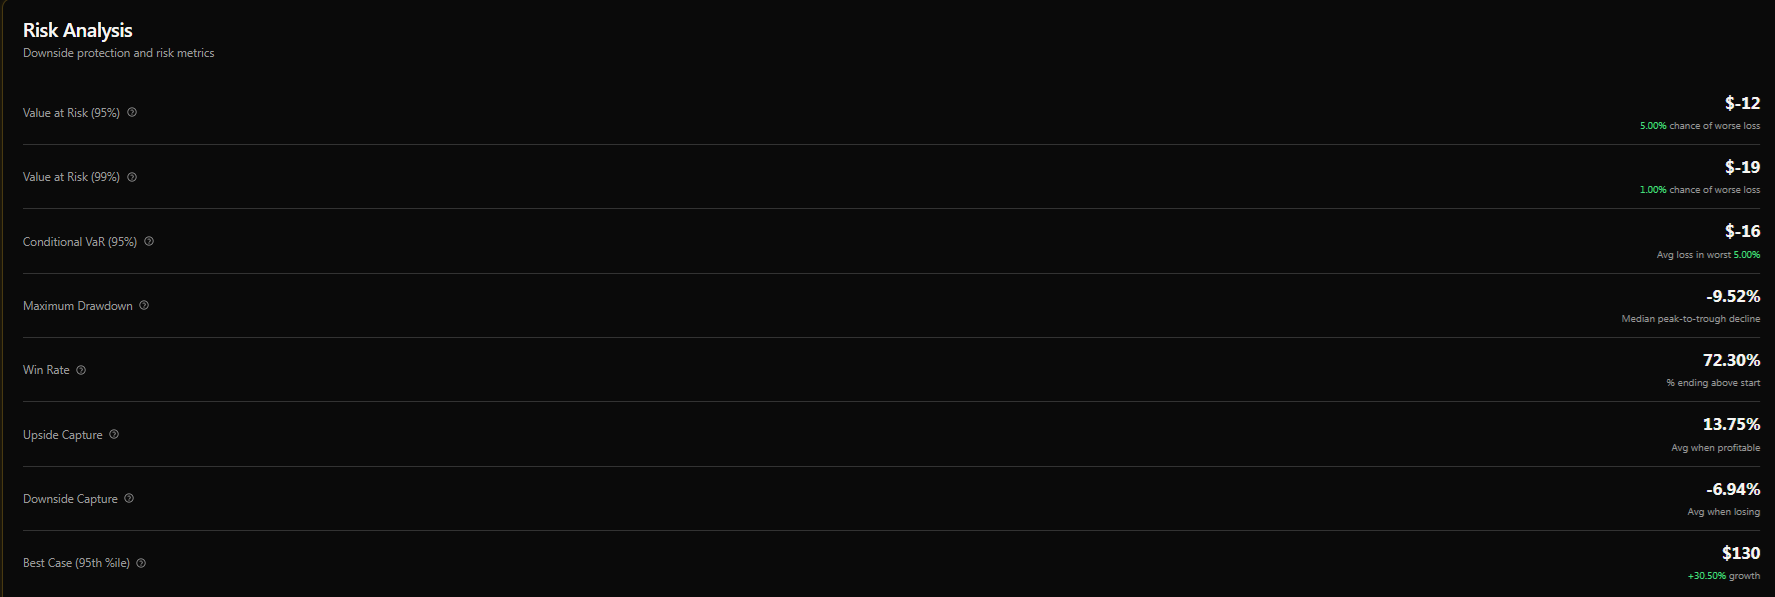
In a 1% worst-case scenario, stocks fall 19% over the next 6 months, and in a 5% worst-case scenario, a 16% decline.
But 72.3% probability that stocks go up, and on average, if they go up, they go up 13.8% of the time, and on average, if they are down, they are down just 7%.
Again, 2:1 reward/risk ratio.
The most common decline over the next 6 months, based on 100,000 Monte Carlo simulations, is a 9.52% decline, so a typical correction.
Remember that since 2020, we’ve averaged a correction every 6 months, and since 2009, every 6.2 months (historically every 8.5 months). They have become more frequent, but no more extreme, and V-shaped recoveries within 1.55X the length of the decline.
S&P 12 Months: NA Due to Technical Difficulties
Last week, 16% 50th percentile return with 20% annual volatility (2 corrections)
Nasdaq 1 Month: 60% Chance Of Gains
The reward-to-risk ratio is slightly worse on tech (due to higher volatility), but overall, it is still a 60% probability of gains in the Nasdaq.
1.55% most likely monthly return on the Nasdaq vs 1.15% on the S&P.
5% chance of a 8% decline vs 5% chance of a 12% gain.
1.5:1 reward/risk ratio on the more volatile Nasdaq.
Nasdaq 3 Month: 60% Chance Of Gains
67% chance of a gain, with the reward/risk ratio getting slightly better.

The reward/risk ratio for the Nasdaq is 2:1 over the next 3 months. 5% risk of a 12% decline and a 5% risk of a 24% gain. With a base-case of 4.6% gain.
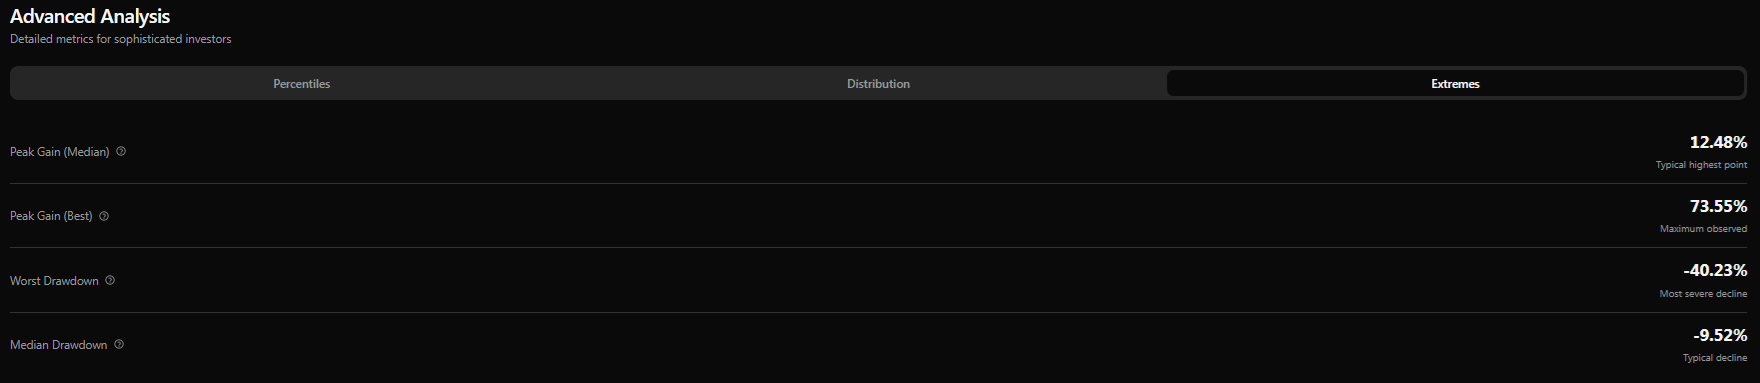
Nasdaq 6 Month: 73% Chance Of Gains
A slightly better than 2:1 reward/risk ratio over the next 6 months with gains of 17% (on average) vs losses of 8%.
The reward/risk ratio keeps improving with a 5% chance of a 39% gain vs a 5% chance of a 14% decline.
The base case is a 9.4% gain over the next 6 months, with an 11.9% most common peak decline.
Nasdaq 12 Month: 81% Chance Of Gains
The reward/risk ratio for the Nasdaq over the next 12 months is 3:1.
In the simulations, when QQQ went down, it fell 10% on average, vs 30% gains when it went up (81% of the time).
The base-case is a 20% gain on the Nasdaq (15.6% peak decline) with a 5% change of 14% declines by the end of 2026 and a 5% chance of a 68% melt-up.
Reward/risk ratio is 4.85 in the extreme tail scenarios.
So, as we just saw, a likely VERY good year for tech.
20% Gains Driven by 19% EPS Gains And 22% Cash Flow Gains
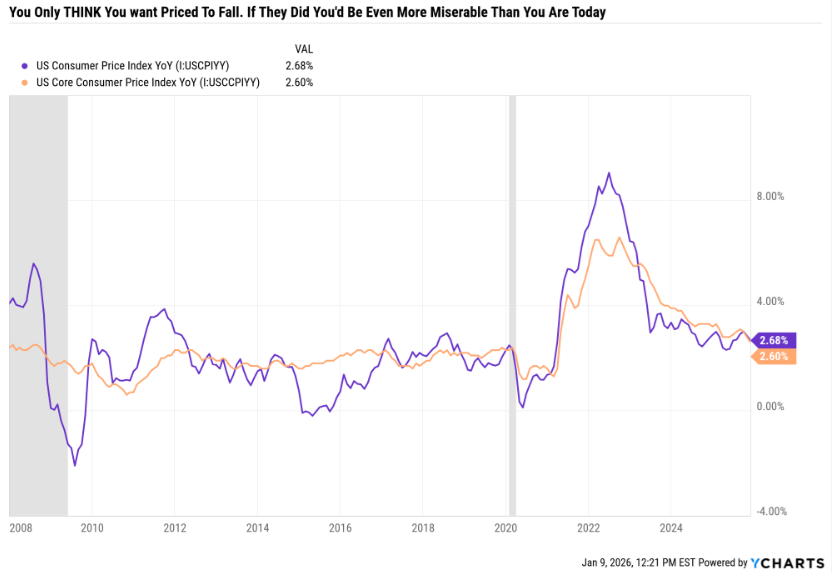
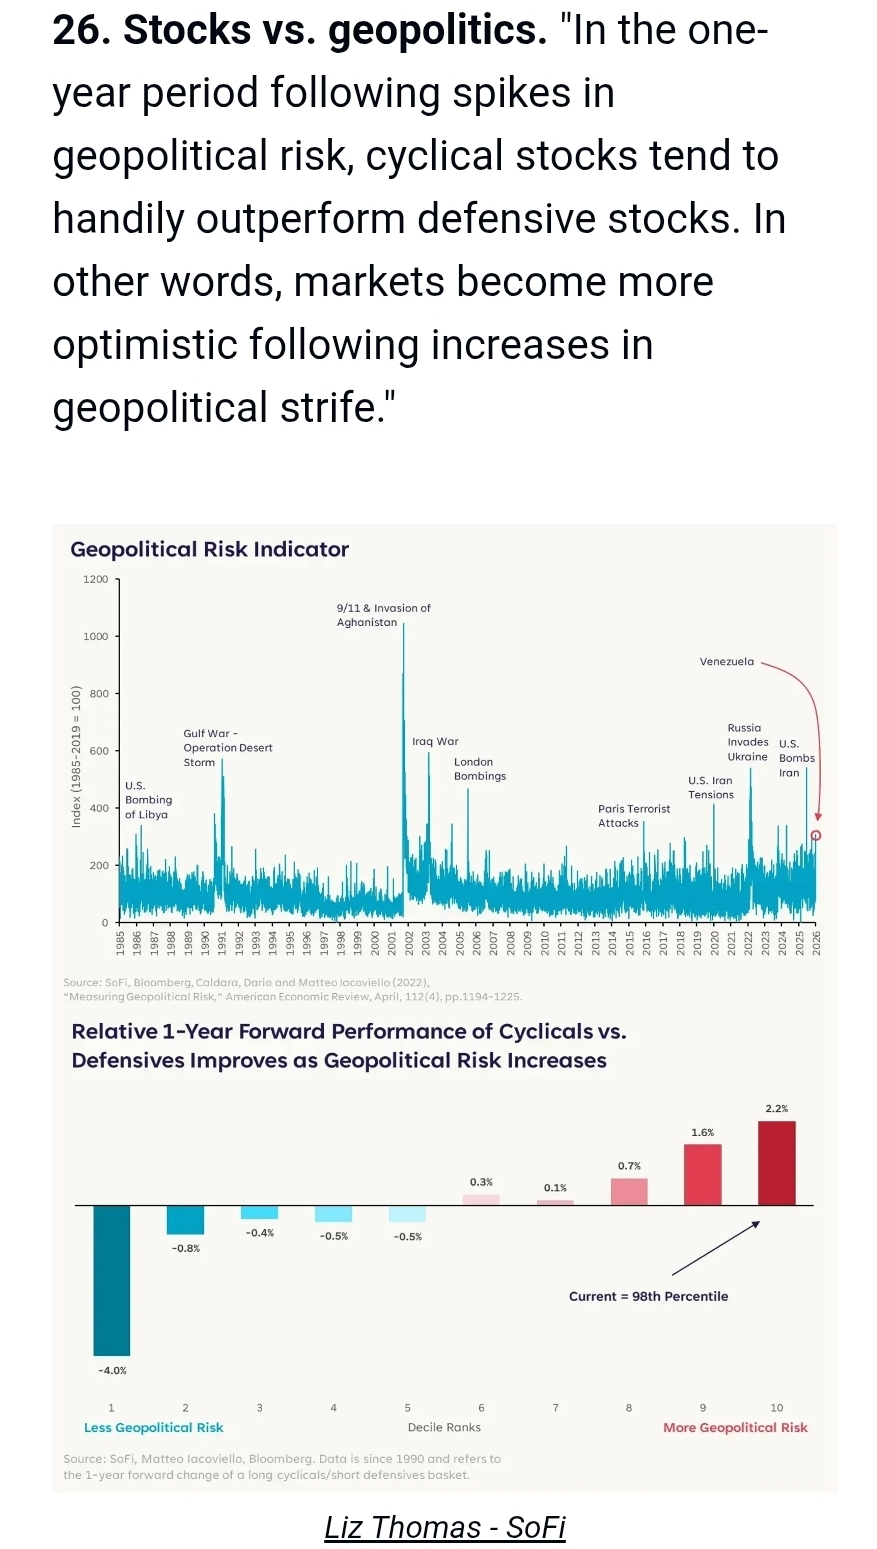
Fact 7: Inflation (What Has Everyone Upset And Miserable
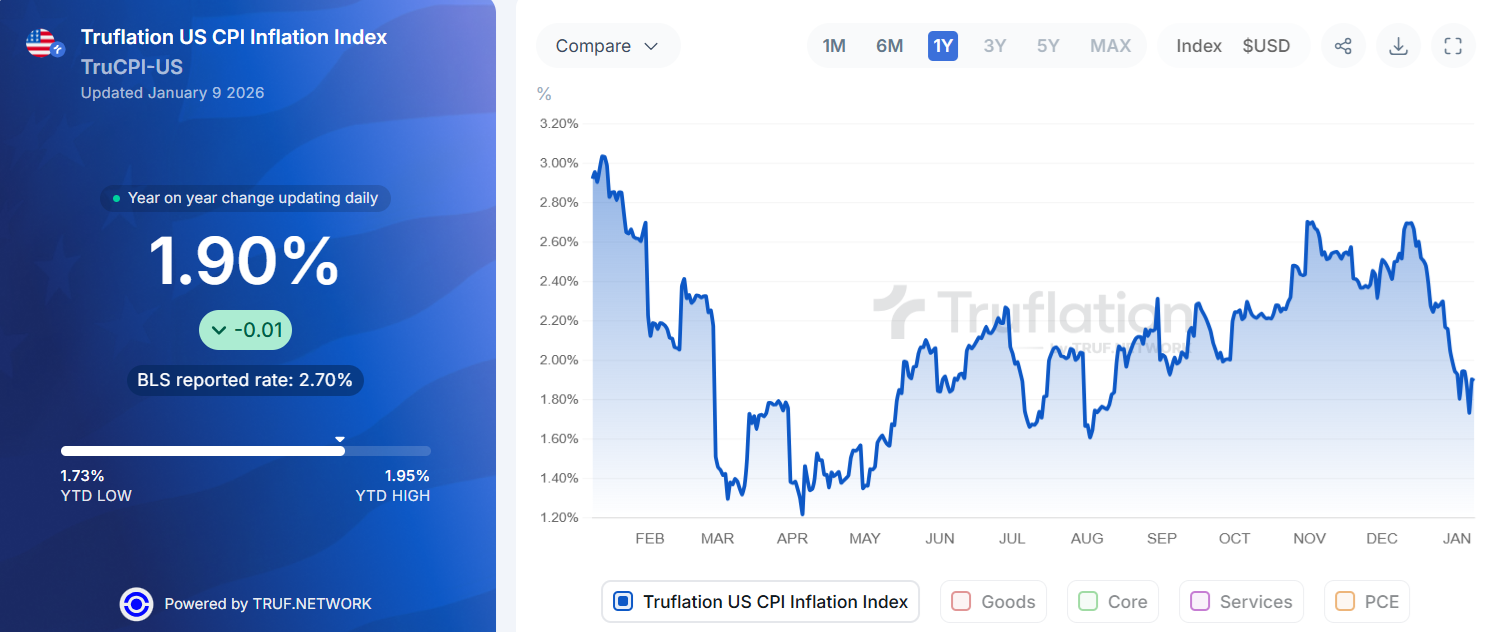
Truflation is based on 18 million daily prices from the most accurate private sources of pricing data.


So, yes, this is pretty reliable data, and here is why people WILL NEVER stop being upset about the “great inflation”.
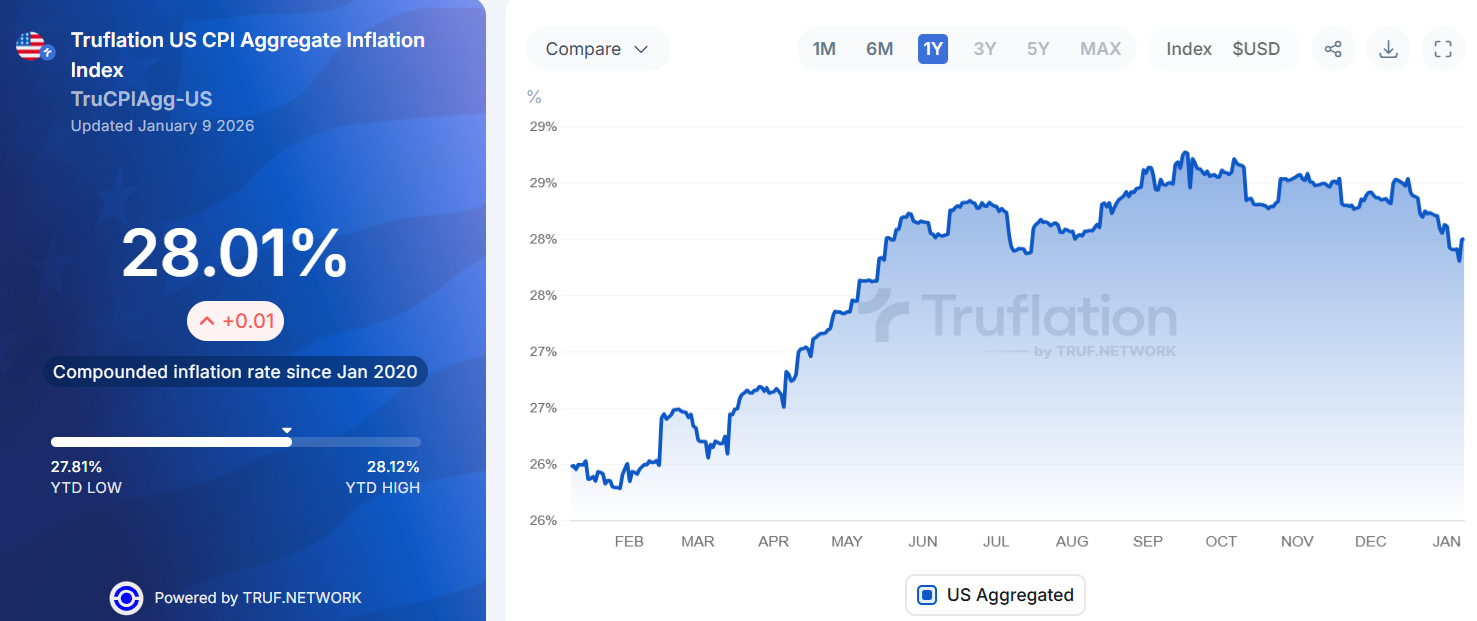
Prices are up 28% in 5 years, and even though wages have also been rising, people FEEL like they are being cheated.
My local media took Xcel Energy to the woodshed for proposing 13% rate increases over 2 years.
It would represent a 13% price increase over 5 years (since rate cases aren’t every year).
Prices over the last 5 years are up 28%.
Xcel CANNOT have “gouged” consumers by raising prices half as much as their own costs went up.
The same with Grocery prices.
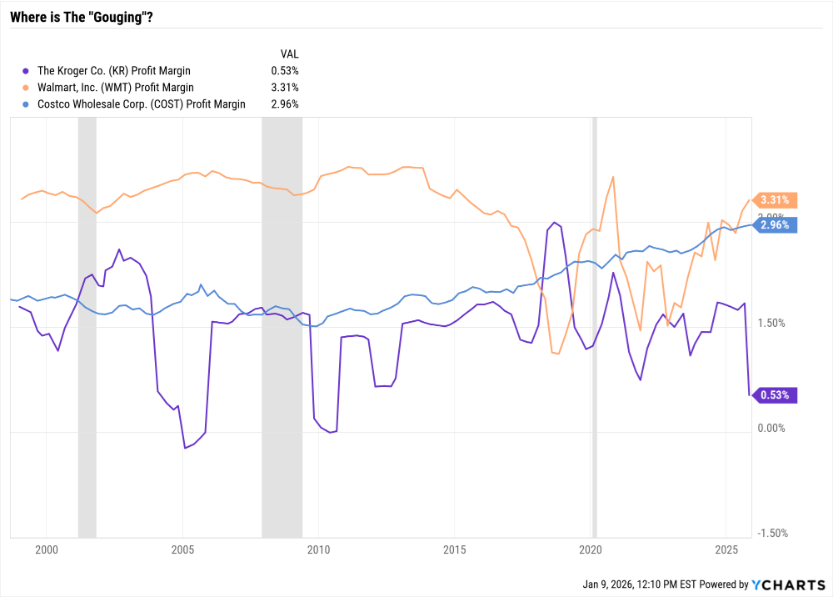
There was no gouging during the great inflation. Walmart’s margins merely reverted to their long-term average after being cut in half.
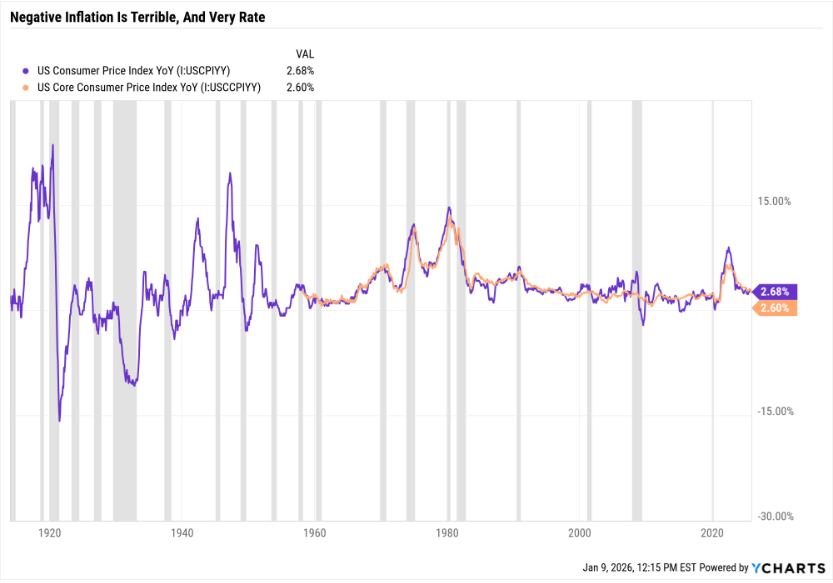
Notice that even in recessions, inflation doesn’t go negative. The times it does? During the Great Depression and in the darkest days of the GFC.
When Inflation Is Negative, NO ONE Is Happy!
Remember that even when employment is 90%, and unemployment is 10%, it’s not like the 90% of people with jobs are celebrating wages and falling prices. When unemployment is 10% everyone is worried about losing their jobs and everyone is miserable.
Since 1913, the average US inflation-adjusted GDP growth is 3.0%.
The average inflation is 3.3%.
Growth creates its own inflation.
If we have 4% growth, and 4% inflation, and wage growth is 5% per year, what is the result?
That’s a better economy than a 2% growth, 2% inflation with 3% wage growth, because the job market is stronger, and anyone losing a job can find one more easily.
DO NOT pray for low rates, slow growth, and low inflation, because that is not a healthy way to earn stock market returns.
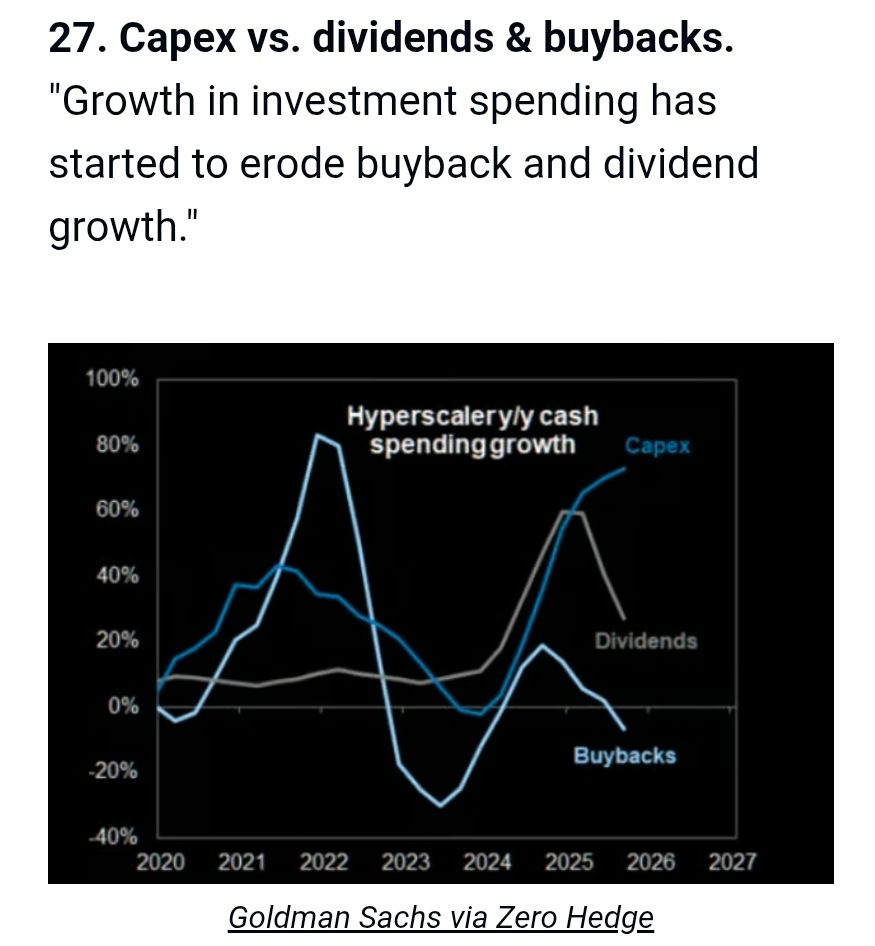
Even if buybacks are falling, growth spending is GOOD. It means more growth in the future. More long-term profits (and thus more buybacks and dividends at some point).
Let’s stop pretending that the 2010s period of ZIRP, with companies borrowing to buy back stock to boost EPS, was some kind of good thing, even if it was an easy way to make money in stocks.
Fact 8: The Fed (Because People STILL Think This Matters More Than It Really Does😉😂
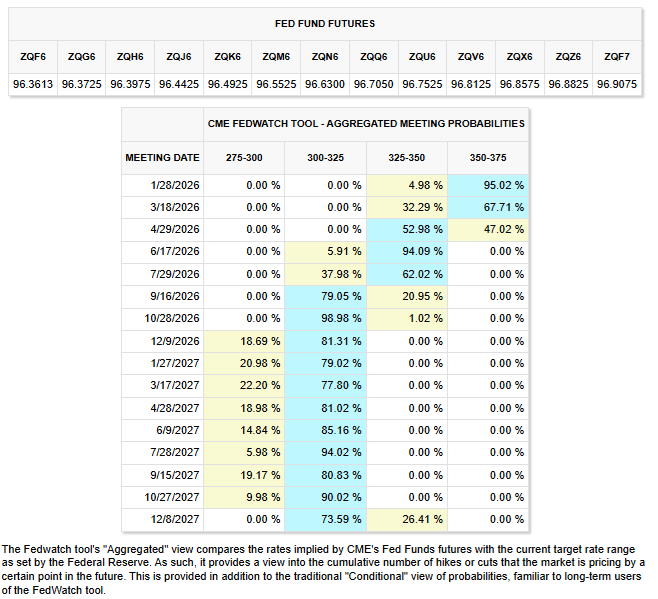
The bond market is now pricing in the Fed not cutting until April, followed by one final cut in September, before rates normalize at 3.13% long-term.
The Fed’s stated long-term policy is that it believes the neutral interest rate is 0% to 1% above the rate of inflation.
So that would imply 2.63% CPI and 2.13% Core PCE (based on these bond market probabilities).
The average historical inflation-adjusted Fed fund rate since 1929 is 0.4%, so a 0.5% “neutral rate” is historically consistent.
The bond market is saying it believes the Fed’s 2% inflation target is on track.
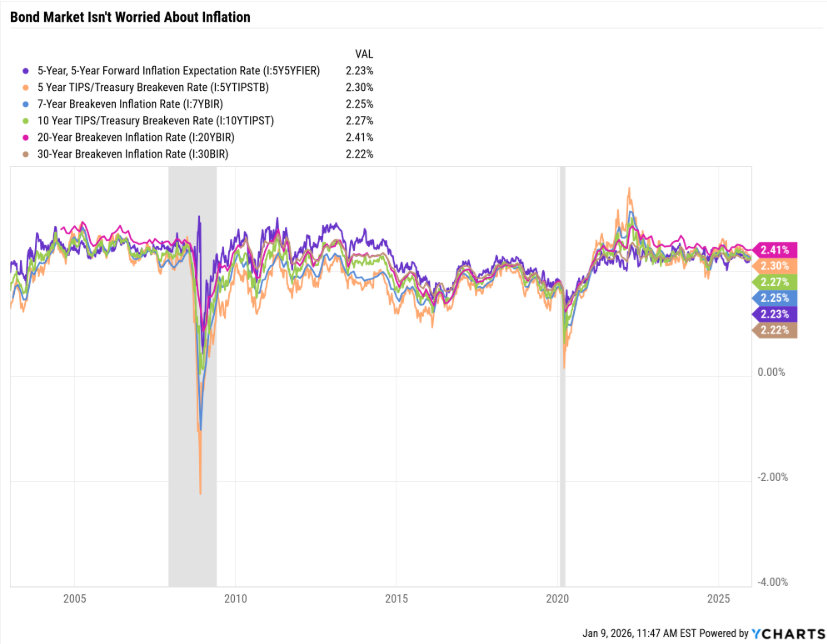
As we saw with real-time inflation, based on 18 million daily prices, which is very accurate (replace the owner equivalent rent with real-time housing prices and you get a near-perfect match between CPI and Truflation) inflation is not a problem.
People will be traumatized by it forever, but it’s not a problem since prices are no longer rising faster than wages, nor are they rising quickly.
Fact 9: Year To Date Update (Because Math Is Cool And Fun😉
Everyone Is Making Money So Far😉😂
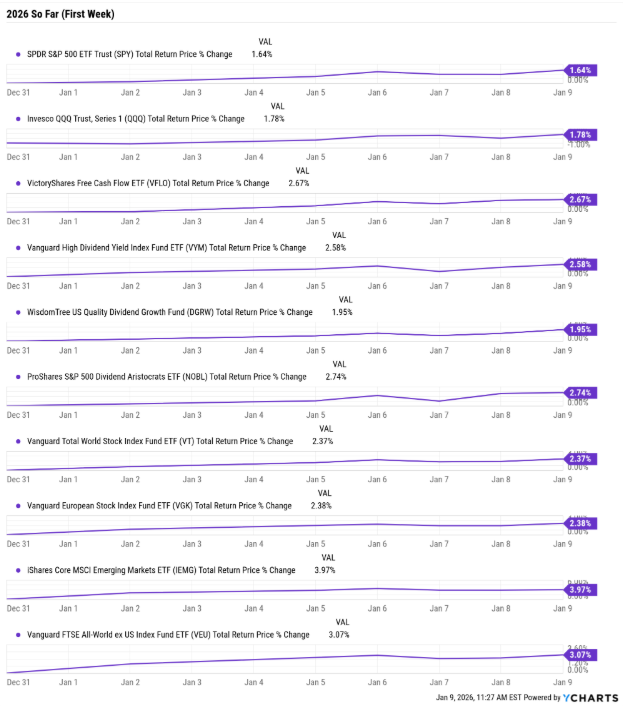
There is not much of a difference so far between US stocks and international, though international continues to outperform, as does deep value (VFLO).
Dividend stocks are slightly outperforming the broader US market.
ZEUS Update
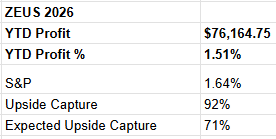
Plaid integration should be ready next week and Connor tells me we’ll be able to track these stats with perfect accuracy (automatically) which will save me some spreadsheet time.
From Dec 2025 Through Jan 8th 2026
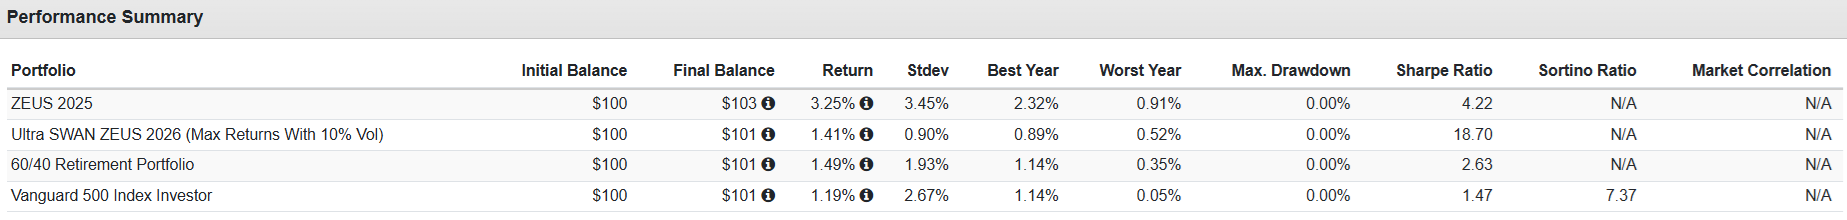
Unfortunately, Portfolio Visualizer isn’t able to fine-tune a backtest to the day, so this is the best statistical analysis I can do. As you can see, ZEUS is doing the best (as it was designed to) while Ultra ZEUS is being the lowest volatility (as it was designed to).
The volatility over this 5-week period is very low (as you’d expect during a Santa Rally period).
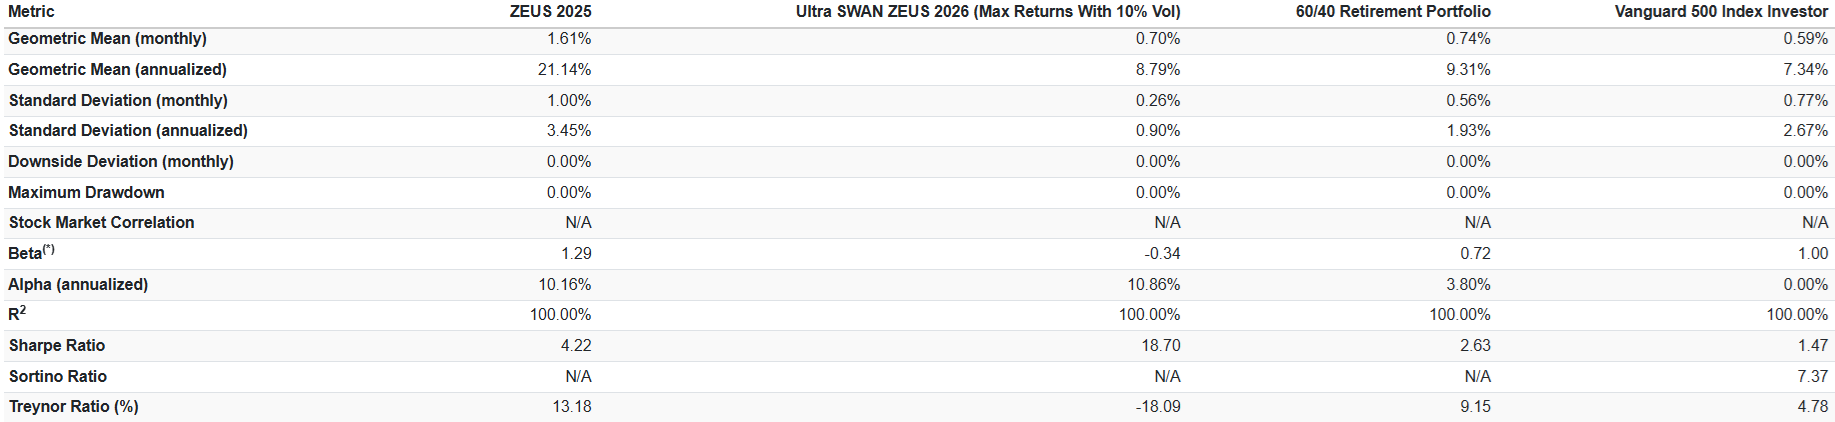
The annualized monthly returns after a week can’t really tell us anything, but it’s still cool to see the volatility stats (as imperfect as they are at this point).
Everyone Is Making Money! 😉😂
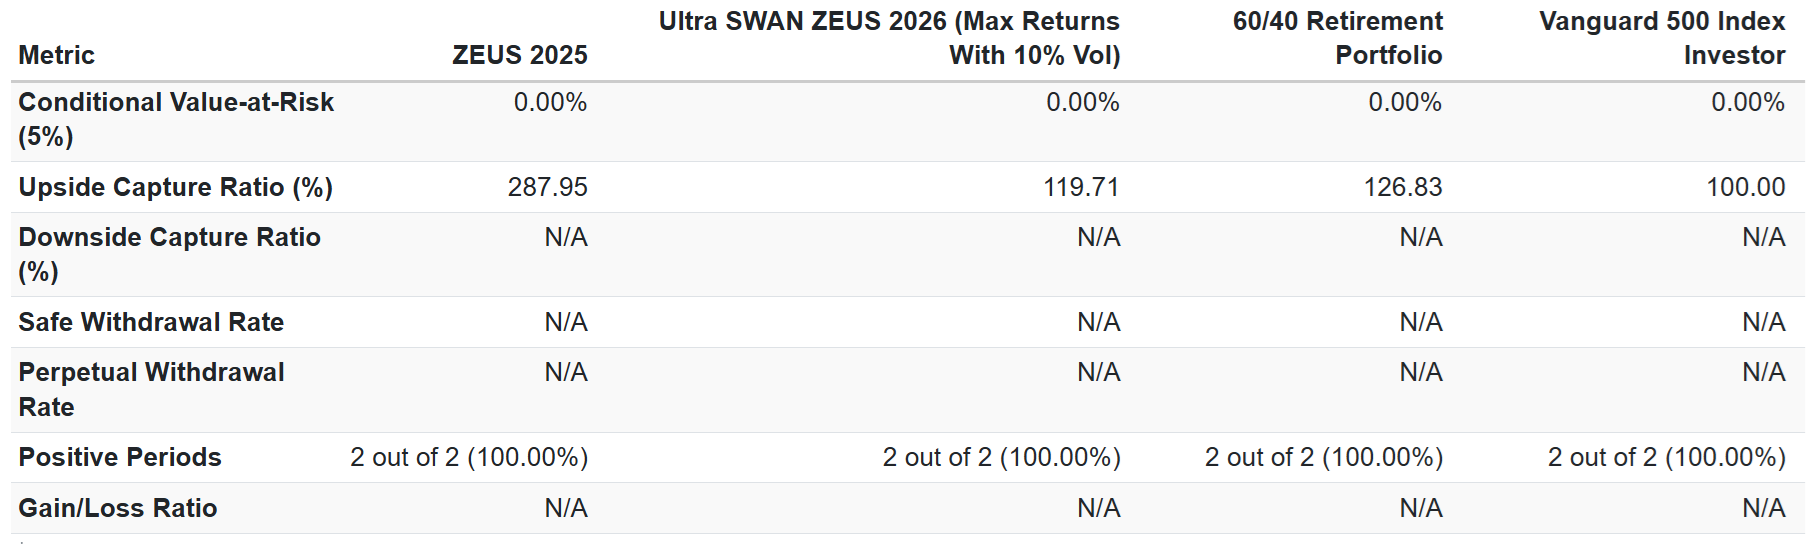
Once January is over, we’ll be able to track the entire 2026 performance (dropping Dec 2025), though we won’t be able to see the downside capture ratios until we have a down month for the market.
Bottom Line: The Fundamental Outlook Is Strong, Improving, And This Year’s Bull Market Is So Far Looking Like 2017
So far, it’s been a very low-volatility year, much like 2017. If that were to continue, it would represent the best-case scenario, because everyone is so worried about EVERYTHING that we can’t get a bubble, even though earnings growth is expected to accelerate to 17.5% by Q4.
In other words, calm down, everyone, and remember that the “vibes” and your FEELINGS are lying to you. The actual hard data, the facts, the math? It shows that…
Happy weekend, everyone! 😉😂🤣🤗🥳🫂🖖