I am so excited to share today's research with you, BECAUSE it's precisely the kind of nerdy, chart-filled news that is hiding in plain sight and could have enormous ramifications for our cherished subscribers like you.
I’ve been working on this for 5 days now, and the GNG launch is why I haven’t been able to publish it until today.
The basic idea for this report was discussed last Thursday, and I’ll be doing several articles surrounding this critical thesis.
Please remember that I am NOT a market timer! I do not advocate it because it doesn’t work.
What I want to do, in explaining what MIGHT go wrong, is to prompt a correction and prepare you, emotionally, financially, and even spiritually (if you’re a spiritual person), for scary headlines.
For example, right now things FEEL like they are in a bubble. Headlines are screaming bubble! And if we get a completely normal correction? 10% to 15%? Then the people who are telling you how the market is a crash waiting to happen, will tell you that “this is just the beginning of the reckoning I’ve been prediciting the entire time”!
Consider a 40% market correction, which most people would consider a severe bear market or “crash”.
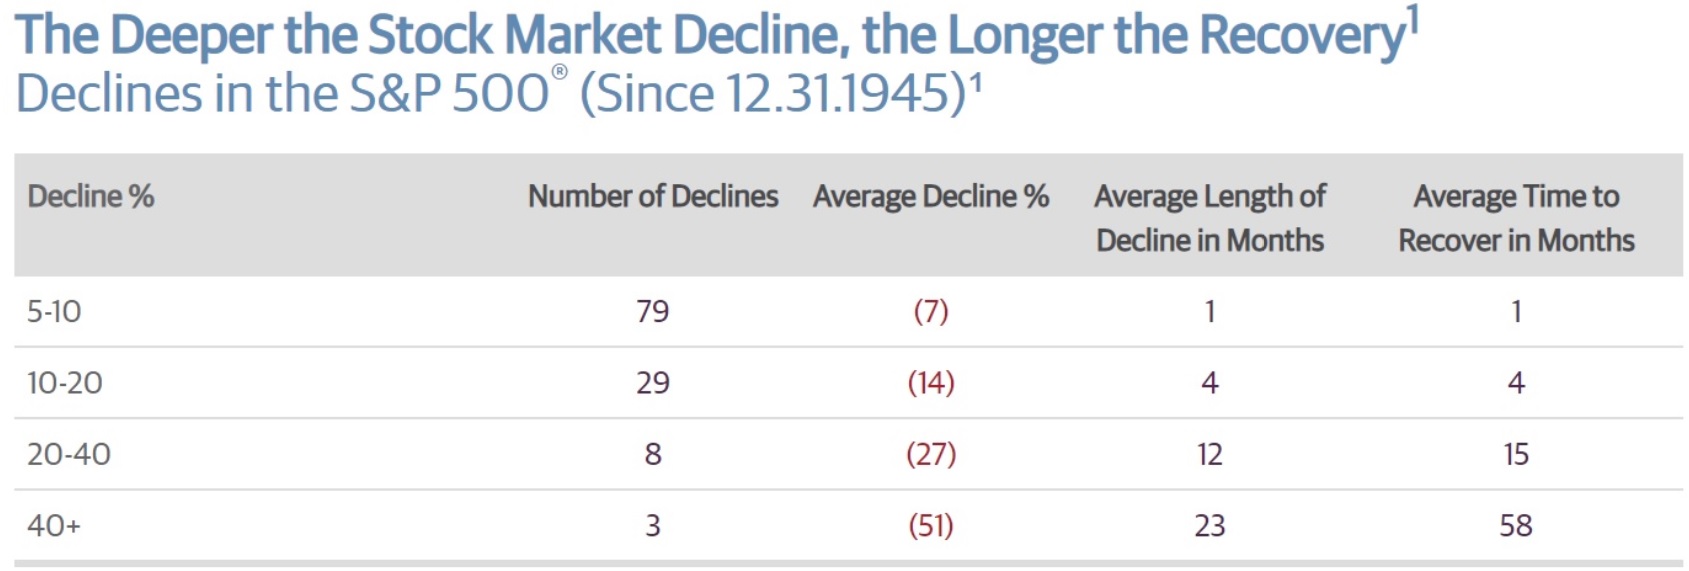
A 5% to 10% pullback isn’t scary…except that stocks rarely fall 5% to 10% without scary headlines. A 10% correction? No sweat. But a 20% bear market? Well, that might cause you some financial worries, if you’re retiring soon (for example).
And a 50+% crash? Like we had in 2000 and 2008?
Well, if stocks are down 40%…a “crash” by most people’s definitions, a 50% decline is another 17% decline!
A 40% decline is 0.6X, and to get to 0.5X requires another 17% decline (0.6X 0.83)
If stocks are down 50%, it takes another 20% decline to hit -60% (similar to the 58% decline during the GFC).
In other words, a 40% “market crash” needs another 33% decline to hit -60%.
Why This Matters In All Corrections
People like Jermemy Grantham and others who have been predicting a 50% or 60% crash (Robert Kiyosaki has been predicting 90+% crashes for over a decade) will NEVER EVER tell you that stocks are undervalued, even if they are.
If stocks were down 40%? They would say, “This is likely a 60% crash, so stocks have another 33% to go”.

Here is the latest S&P PEGY analysis, showing that, given current FCF/share growth estimates, the market is still historically undervalued.
Does that mean stocks will go up? Will stocks be up 33% in the next year?
NO, it means that IF and only IF today’s growth expectations are met…and next year the growth expectations for the next 3 years are the same as today’s (14.1% CAGR), then IF the market is at 9180 (up 33%) it would be 100% justified by today’s fundamentals.
Or, as I like to joke, IF and only IF today’s expectations are realized and the growth outlook remains steady, then a 33% gain in the S&P 12 months from now would be luck… fundamentally justified luck (and not a bubble).

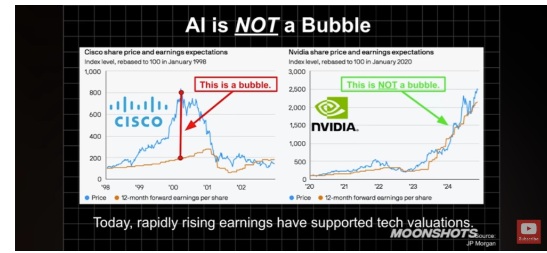
OK, but what about the Nasdaq? Surely THAT is in a bubble?

Actually, the Nasdaq's growth rate is 66% above its 14-year median, so unless you think a 1.06 PEGY is a “bubble,” no, the Nasdaq is just as undervalued as the S&P, and at least based on historical growth-adjusted, cash-adjusted earnings.
No matter how crazy numbers might seem, if the fundamentals back them up, it’s not a bubble.
OK, but let’s get back to our following correction scenario…
What You Need To Know About The Next Correction (Whether It’s This Year Or Next Year)
Imagine stocks are down 10% — scary headlines! Stocks have 20%, 30%, even 40% more to fall!
How are you going to react as an investor if you think that stocks are STILL highly overvalued and have a lot more to drop? Are you going to buy anything?

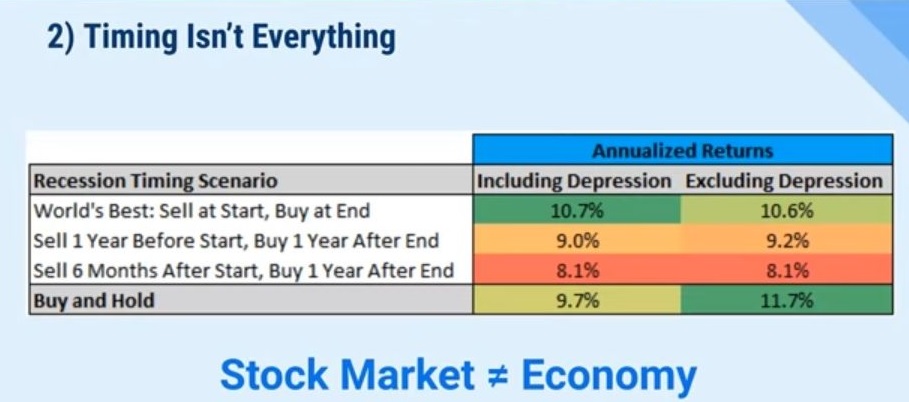
Market timing is so dangerous that it can literally wipe out all the gains, and then some, of long-term investing. If you miss the single best days, 80% of which occur within 2 weeks of the worst days, you might as well not invest at all.

Now imagine if you’re a GNG Research member and you know that, based on historical PEGY analysis, the S&P is actually undervalued.
And it’s now down 10%… so its’s 24% historically undervalued.
By the way, on October 12th, 2022, at the lows (a 28.5% peak decline in the S&P, the historical median bear market decline since 1985), the stock market was 20% historically undervalued.
In the April 7th low? About 20% as well (Morningstar estimated 17% based on discounted cash flow analysis).
So, thanks to faster growth expectations (that companies are delivering on, with 85% beating expectations so far this earnings season), the market would be…after just a 10% correction, more undervalued (historically speaking) than it was in the Oct 2022 lows or the April 7th 2025 low.
What if we have a 15% correction? Or a 20% growth scare correction (like Dec 2018 or April 2025)?
A 15% correction (which sometimes occurs outside of a growth scare) would leave the market 28% undervalued.
And a 20% bear market? That would be a 32% historically undervalued market IF growth estimates hold up (because we don’t actually get a recession).
Context makes all the difference (Bloomberg’s catch phrase), and it’s true! Did you know that on March 9th, 2009, after the 58% GFC crash, stocks were…33% historically undervalued!
If we get another 20% growth scare correction (a mild bear market) from today’s levels, if we avoid recession and growth estimates hold, stocks wouldn’t just be “fairly valued” as many might say…they would be March 2009 cheap!
In a 20% bear market (which could happen if we get a growth scare) stocks would likely be so undervalued that the following year would be “SHOCKING” but only to those who are convinced that the market is in a tech bubble like mania that has to end in tears.
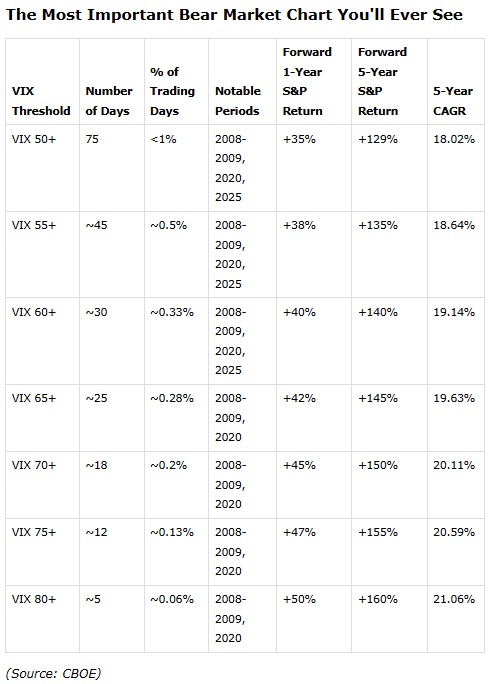
If we get a 10% to 15% correction (which doesn’t require an economic growth scare) or a 15% to 20% growth scare correction (like 2018 and 2025) I will be here, with the charts, and tables, and data confirming whether or not it’s time to be opportunstically buying (while still uncertain about what might happen next, like Oct 2022) or a table pounding “Shut up and buy something smart and you’ll thank me in a year! VIX 60! Don’t Overthink it! Buy, and if the world doesn’t end, you’ll be glad you did! And if it does, we’ll be too dead to care!😂”
OK, so now with that out of the way, here’s what I discovered last week that could create something that has never happened before.
Two 20% corrections within a year.
With 2 V-shaped recoveries that end the year at record highs.
Why The Government Shutdown Will Likely Set A Record
I spend hours each day studying necessary economic charts and listening to trusted experts discuss the economy, secular trends (like AI), and finance... because, from time to time, something like THIS happens.
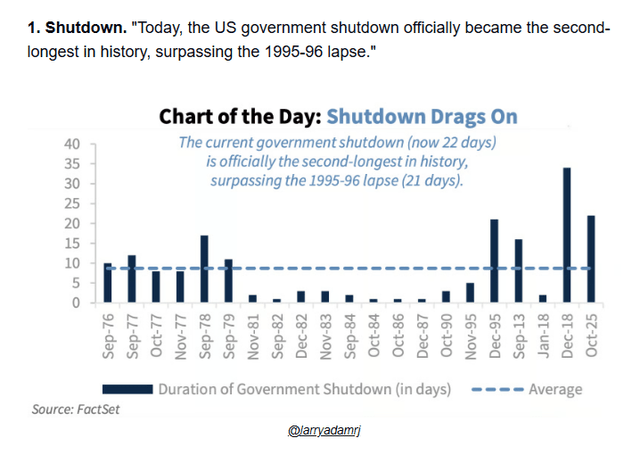
Shutdowns don't usually matter to the stock market... except this one is special.
The stock market basically ignores shutdowns for good reason.

Half the time, stocks are up during shutdowns, and the median return (average length of a shutdown) is 7 days. In fact, in 70% of shutdowns, the stock market goes up.
When the government shuts down, any missed payments to Federal workers become back pay that is paid as soon as the government reopens.
So damage is usually small and almost entirely reversed.
Why This Time Is Different
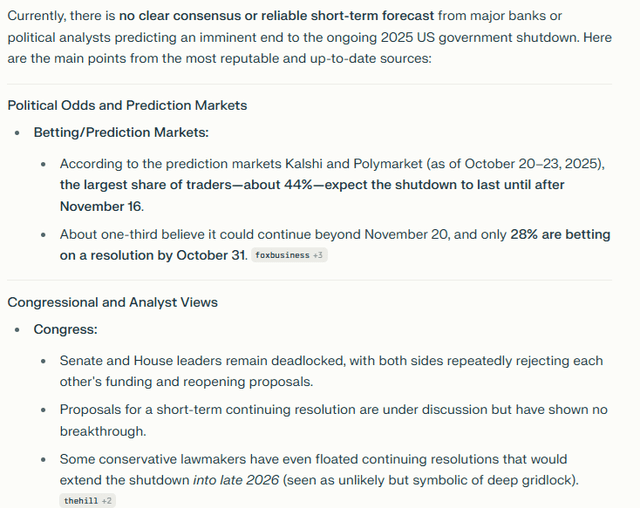
There is no clear timeline for resolving this shutdown, and betting markets say there is a 77% chance it will last into November and about a 33% chance it will last until Thanksgiving.
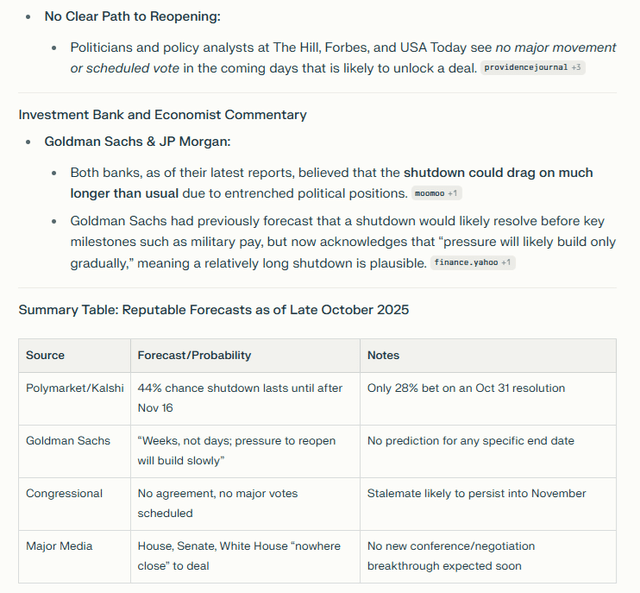
Experts like Goldman and JPMorgan say that this is likely to last for weeks.


OK, so what does this mean for the economy?
On November 1st (the 100% China tariff increase date that probably won’t happen), we'll be at 32 days, the 2nd-longest shutdown in history.
Thirty-six days is on Nov 5th, breaking the record.
Betting markets now think the most likely outcome is that it will last for at least 2 to 3 weeks.
That would be a 6- to 8-week shutdown... so what is the economic impact?
And Here's Why That Might Cause A Bear Market (With A Fast V-Shaped Recovery)
The shutdown means that most government workers are on furlough, not collecting pay, but will get back pay when the shutdown ends.
Contracts won't get backpay, and businesses that have government workers and contractors (about 2X as many contractors as government workers) as customers will suffer permanent revenue loss.
So what kind of damage are we talking about here?
How long until a government shutdown triggers a growth scare? A recession?
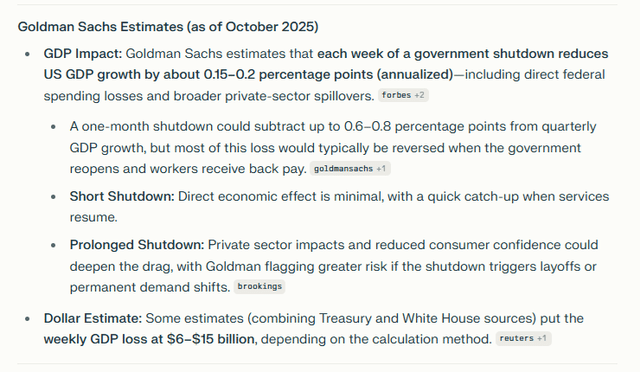
Goldman estimates that a 6-week shutdown will hurt GDP growth by around 0.9% to 1.2%, with most of that growth coming back as workers receive back pay.
Some permanent damage will occur, and the longer it persists, the more permanent it becomes.
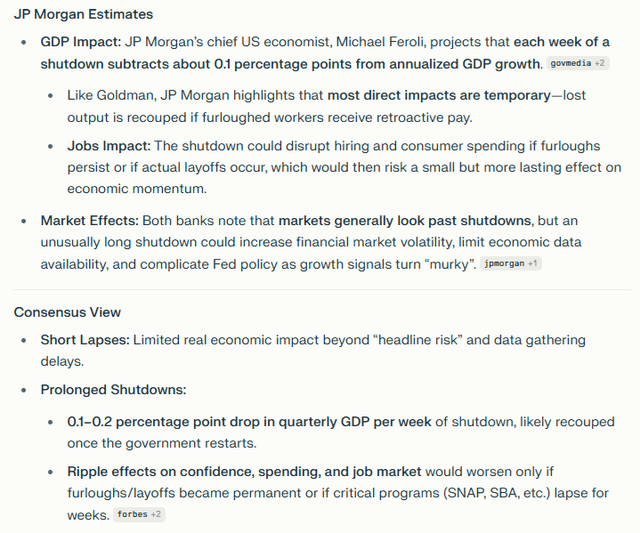
JPMorgan's economists estimate 0.1% per week.
OK, so what does this mean for investors?
What This Means For Investors (Shocking But Potentially Enriching News!)
-
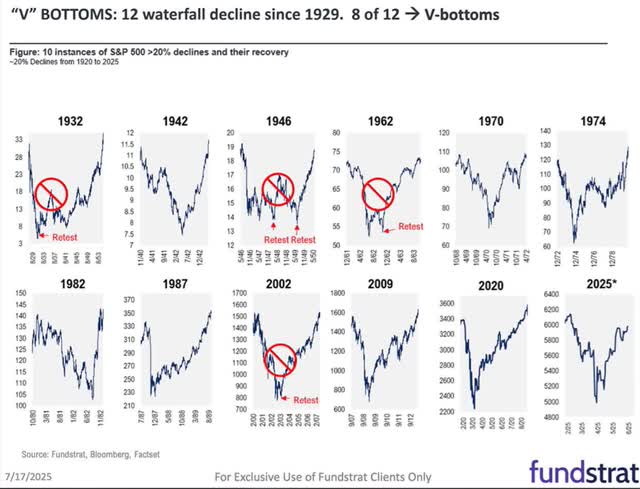
Remember this fascinating chart from Tom Lee? The one that shows that, since 1929, unless there was a recession, every waterfall correction was a V-shaped recovery?
1.4X to 1.7X (1.55X average) recovery time.
If stocks fall for 2 months, they take 3 months after bottoming to recover to new record highs.
Here’s some more proof, courtesy of our friends at Ritholtz and Exhibit A!

So, to answer the question about a potential correction (one is coming at some point), we need to know how fast the economy is growing now.
Real Time GDP Update
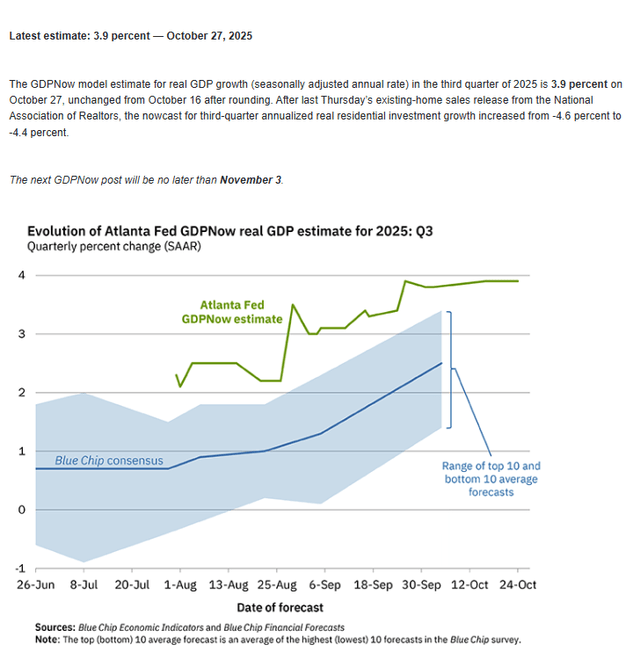
The Atlanta Fed GDPNow tracker updates periodically, but is very useful because it tracks the blue-chip economist consensus.
You can see how economists have been aggressively raising growth estimates for this quarter.
Lots of economic reports are coming in better than expected.
However, job data is unavailable due to the shutdown.
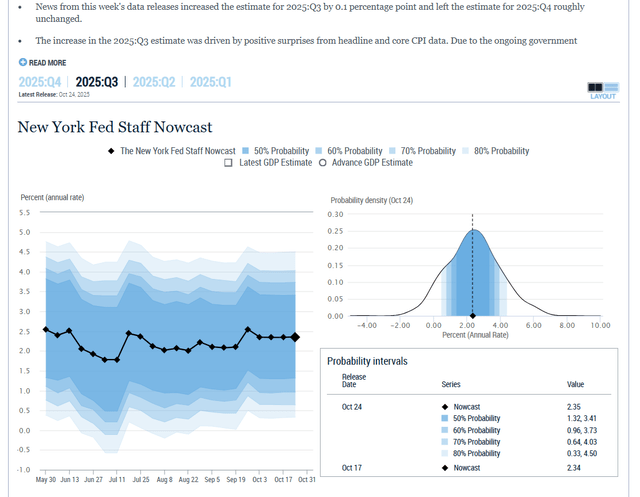
The New York Fed GDP nowcaster provides the full range of potential growth rates, which is very useful in estimating the probability of a growth scare.
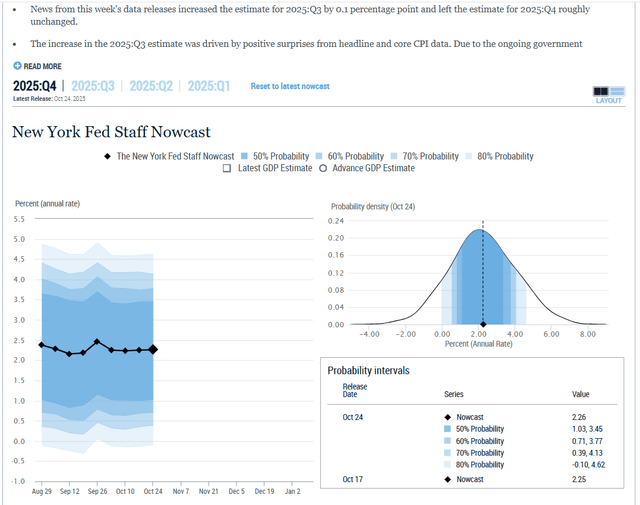
The NY Fed is also forecasting 2.2% growth for Q4, which runs through the end of the year.
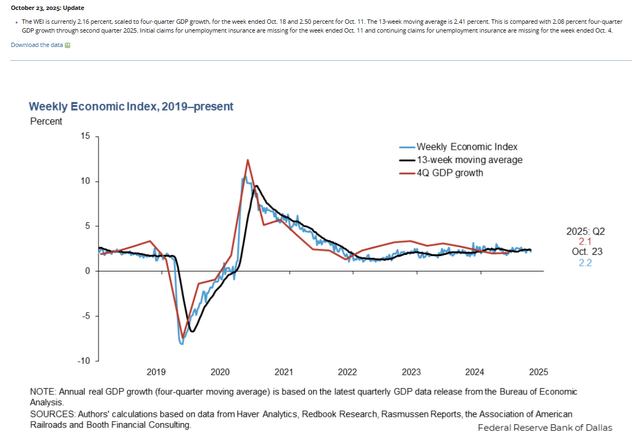
The Dallas Fed's weekly economic index is my favorite "gold standard" real-time GDP tracker.
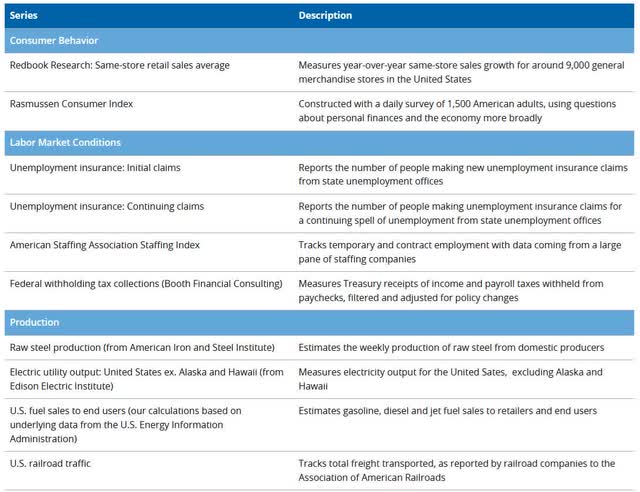
It uses 10 daily or weekly data series from direct economic growth inputs.
In other words, when Scott Galloway talks about rising Hamburger Helper sales, does that indicate that consumers are stressed and that recession risk is rising?
Schwab considers growth below 2% a potential growth scare for stocks.
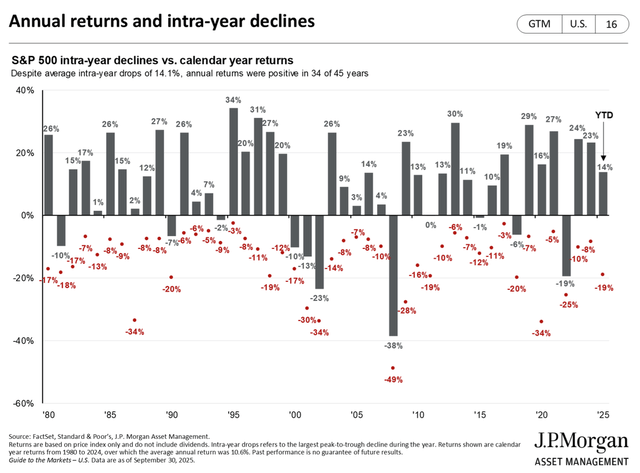
In other words, when growth is above 2%, if stocks are in a correction, it's just a normal, healthy correction. Since 1980, the average peak decline has been 14.1%.
However, if growth is less than 2% and falling? Then we are in a growth scare, and a 10% to 15% correction can turn into a 15% to 20% correction, as we saw in 2018 (-20% bear market in Dec) and in 2025 (-21.3%) at the peak on April 7th.
No Recession (Just 75% probability of one at peak panic) = V-shaped recovery
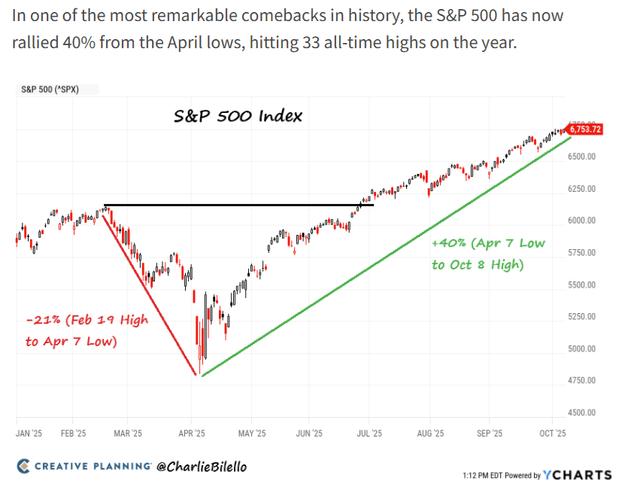
The stock market is up 40% from the April 7th lows when the VIX hit 60.
And yet, many Americans are surprised. They think we’ve been in a recession for months, and some believe it's been going on for over a year.
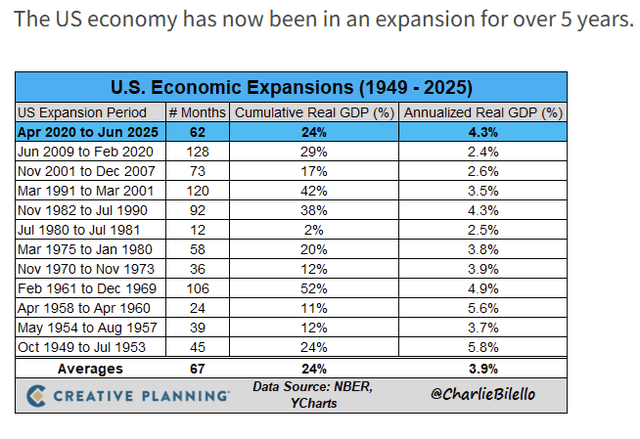
It’s actually the fastest economic growth in 35 years. And remember, GDP is ALWAYS reported adjusted for inflation. So it’s not higher prices juicing the growth, it’s consumer spending and AI spending.
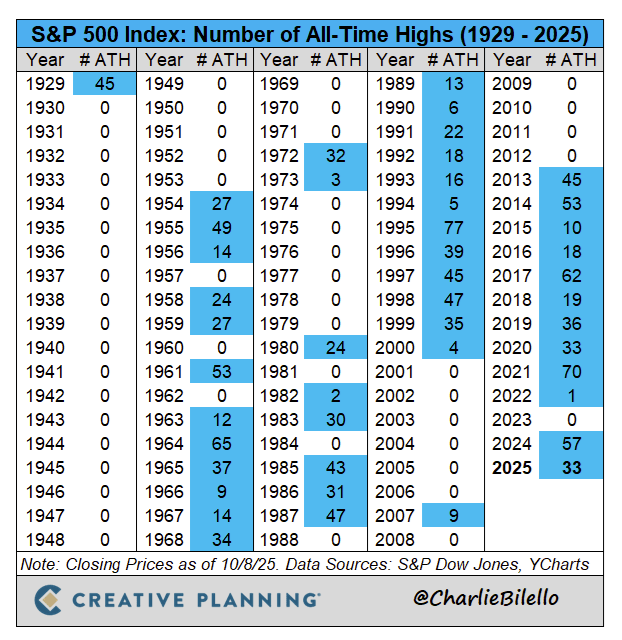
We keep hitting record highs, and it understandably befuddles many investors.
Aren’t tariffs higher? Yup, 15% global-weighted, rising to 30% if the 100% higher China tariff threat takes effect on Saturday, November 1st.


The peak impact from tariffs is expected in mid-2026. Usually, a 1.1% hit to growth would put it at 0.7%, well into a growth scare. BUT let’s not forget about rate cuts and tax cuts, which the economist consensus estimates will add 0.6% worth of growth (0.3% from each).
So that’s a -0.5% peak tariff impact IF they continue at current levels. Remember that we’re currently running 2.2% growth according to the NY Fed and Dallas Fed.
So while a 0.5% impact COULD bring us into a growth scare correction next year, it’s the government shutdown that could threaten a bear market this year.
That’s because in a worst-case scenario, the shutdown combines with the tariffs to generate a -1% growth headwind PLUS a 45-day shutdown (-0.96% Goldman/JPMorgan consensus) or -2% GDP headwind.
That would be 0.2% to 1.9% GDP growth, depending on whether the Atlanta Fed or the NY/Dallas Fed is correct.
Either way, it’s below Schwab’s 2% growth scare threshold, which means that IF we get a correction this year, it could become a growth scare 15% to 20% bear market.
Bottom Line: We MIGHT Be Headed For A Growth Scare Correction This Year, BUT If We Do It’s Likely Another V-Shaped Recovery
How will we know if the government shutdown is really impacting?

We’ll see it in real time (or as close as we can get) in Bank of America's weekly credit card spending data. Retail sales data from Redfin, and of course, overall growth via the Dallas Fed Weekly Economic Index.
I promise you that each day, as I update the Master List spreadsheet I promised members I would (for the latest growth and earnings estimates, plus the PEGY upgrade), I will stay on top of the most important charts.
Not just because geeking out about sexy, sexy charts is a passion of mine😉, but because knowing the key details about the economy and market valuations can make all the difference.
It’s the difference between being excited in a 15% correction later this year (or next year) and being terrified that “the big one is here!”
If the data says we should be concerned, then I will always tell you. If the data says that everyone is overly apprehensive about risks that we’re overcoming? THAT, my friends, is the opportunity for maximum profit.
When you’re a disciplined financial scientist, you don’t have to pray for luck on Wall Street, because you make your own.
