Mini-Update
Wednesday is Christmas Eve, and my family celebrates both Christmas Eve and Christmas Day (actually, because my sister left for her honeymoon on the 23rd, this year we’re celebrating Christmas 3 days🤗)
So what I’m trying to do (given the holiday-shortened week, with Connor leaving for a MUCH-needed (and more than earned) 5-day weekend), Sleep is still a thing, people! 😉😂🤣) is to get a short Part 5 of this mega report out today, BEFORE I have a ZEUS optimization meeting where he uses the new tools to improve a critical aspect of the ZEUS LEGACY family charity hedge fund.
I’ll be trying to get out two shorter articles today. Then I will get another article out on Friday (hopefully a screening article if all the calibrations are done) if not I have a really valuable article planned.
I’ll do my best, but this meeting with Connor is VERY important.
The How To Grow Rich In 2026 Series
Part 1: 3 Shocking Facts Smart & Safe Investors Need To Know
What you need to know about market valuations and earnings.
Part 2: 5 Delightful Economic Facts Smart Investors Can Profit From in 2026
What you need to know about the economy, including current growth rates (2.3%) and likely 2026 growth acceleration.
Part 3: 3 Incredible (But True) Facts About The "AI Bubble" That Smart Investors Need To Know For 2026
AI update, and why the “AI Bubble” likely isn’t one and might be the beginning of a 22-year growth cycle.
Part 4: What's the Stock Market Likely to Do In 2026? The Answer Will Surprise, Delight & Maybe Shock You (Incredible New Portfolio Tools! THIS Is Why You Want to Sign Up For A Free Trial Today😉🥳)
Part 5: How to Use Our New Tools To Help Your Family Grow Rich In 2026
There are SO Many cool things I plan to do with our new Monte Carlo tool (and all our upcoming tools), BUT as you can imagine, it’s a REALLY hectic week, so today’s shorter article is designed to answer a question that I’m sure a lot of you have.
What’s the Big Deal? How Does This Help My Family Live Better?
There are two really cool things I learned about this Monte Carlo tool that I want to share, that will hopefully delight, amaze, and enrich your lives and make your family more secure.
Use One: Budgeting For Retirement (Or Financial Goals)
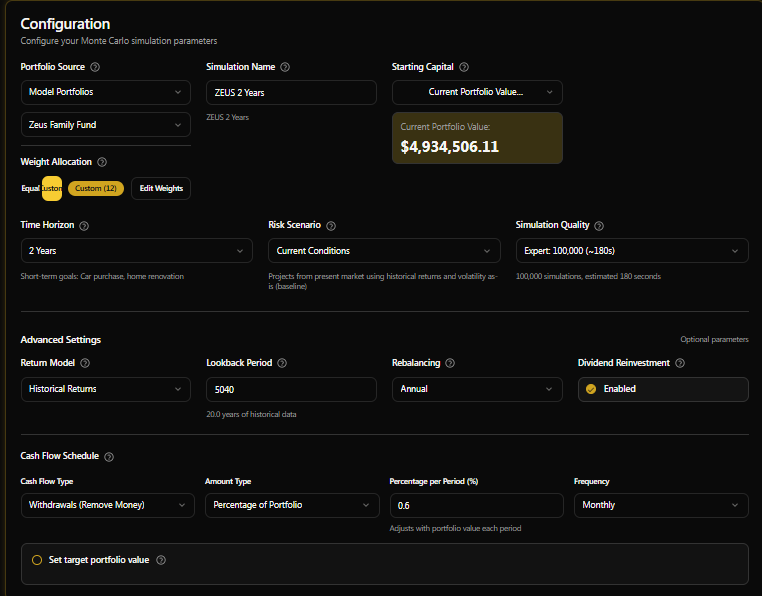
One of my favorite uses of the new GNG Monte Carlo suite is that you can select cash flow withdrawals, either fixed amounts (including inflation adjustments, like the 4% rule) or a % of the portfolio.
Right now, it costs 58 basis points per month from ZEUS to balance the books at GNG, so that’s why I’m using a 60 basis point monthly withdrawal rate.
You can see how I set up the simulation for 2 years, with annual rebalancing.
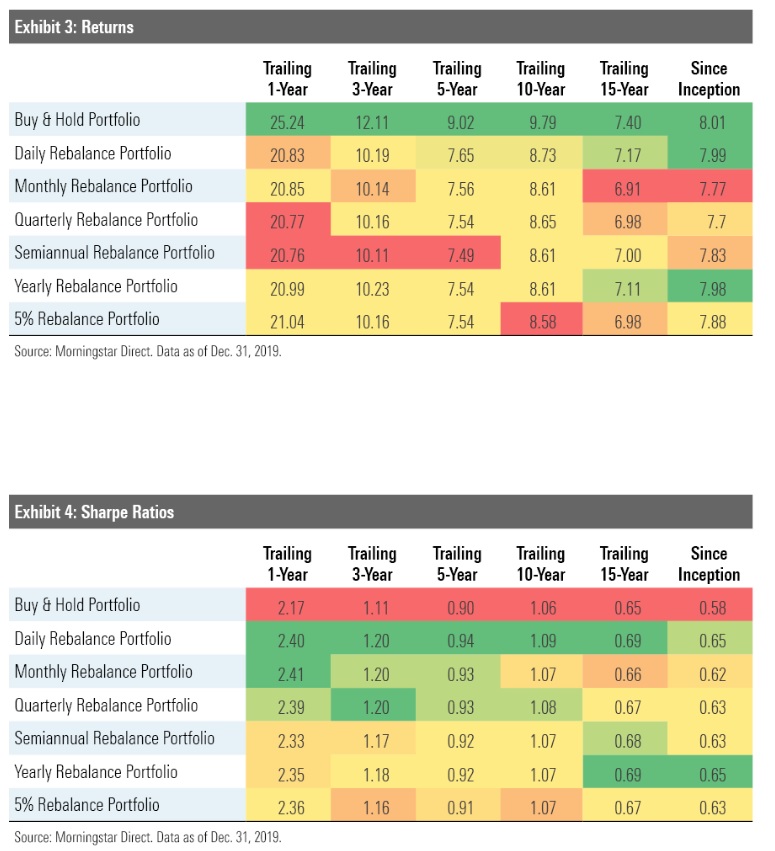
Annual rebalancing is historically the most effective and tax-efficient, plus its also convenient.
OK, so let’s take a look at the results, so you can see how these tools can help YOU plan for your financial needs.
2 Year ZEUS Analysis And The Lessons It Can Teach You About Your Own Financial Future
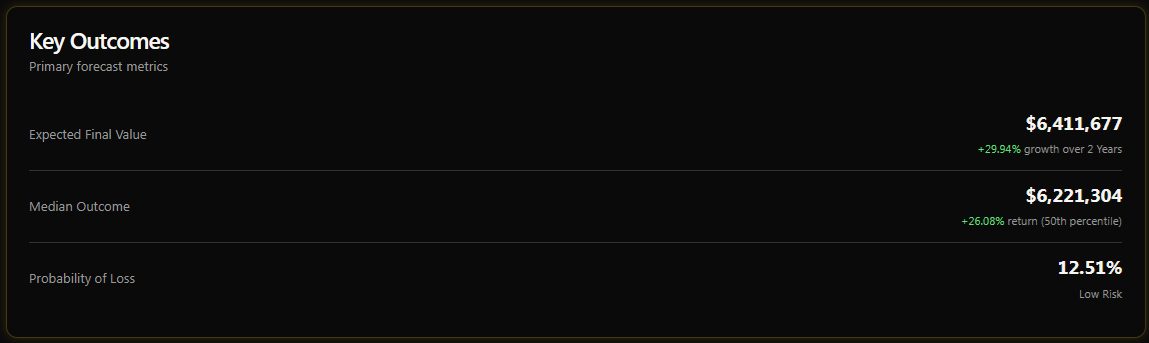
The basic summary looks good, with a final value of $6.2 to $6.4 million expected and a 87.5% probability of a gain in the next 2 years.
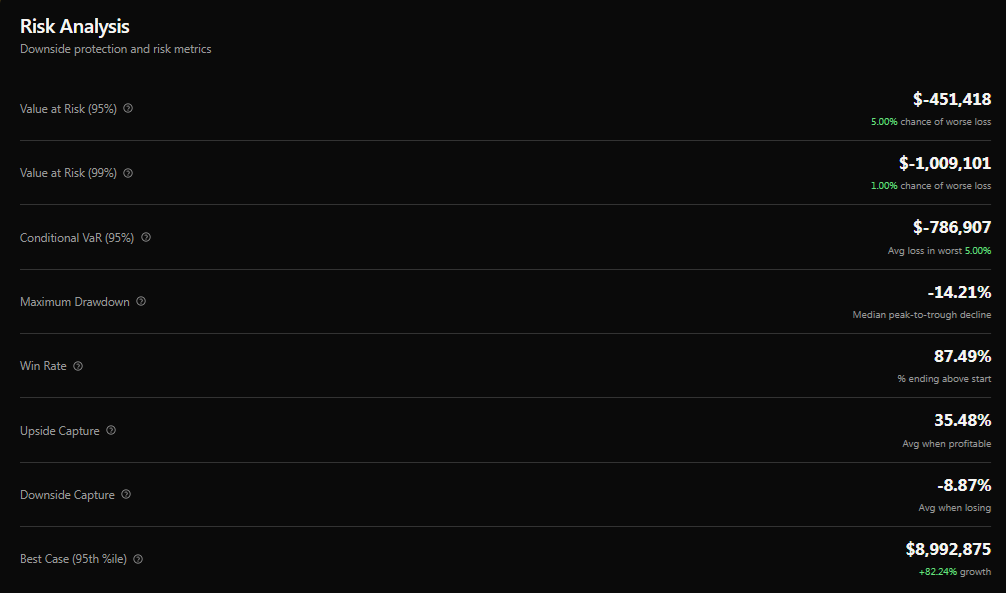
A 14.21 peak median decline is what we should expect at some point in the next 2 years, which is helpful for business risk planning and of course my favorite metrics of all, the upside and downside capture ratios (35% of the market’s upside in a rising market and -9% of the downside, meaning a modest gain, in a falling market).
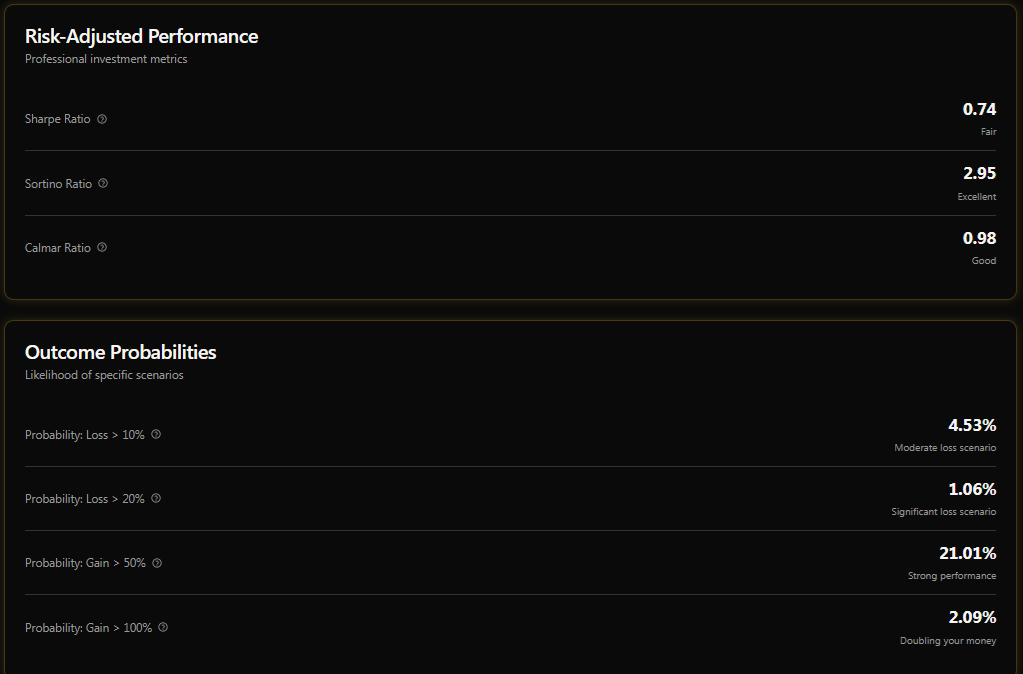
The probability of doubling ZEUS is 2X greater than the risk of losing 20%, which is pretty great.
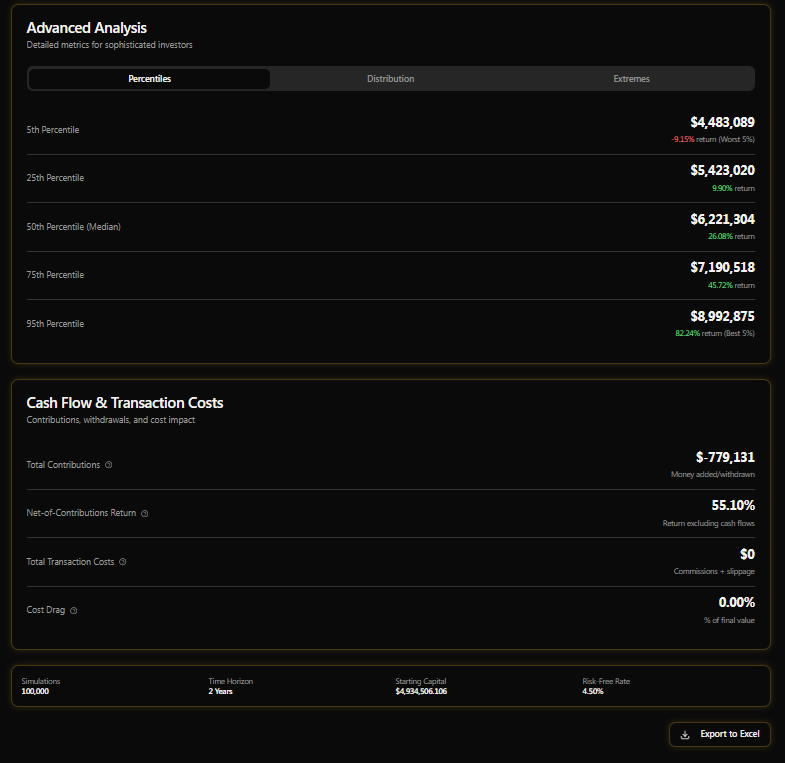
And here’s the money shot, the reason that I LOVE this initial version of the Monte Carlo tool for my family’s needs (and yours!).
Those returns? What is the probability of the portfolio value? That’s factoring a 0.6% monthly withdrawal rate, totalling almost $800K over the next 2 years.
That means a gross return is 55.1% (excluding withdrawals) or a 24.5% CAGR total return base case.
Morningstar’s 5 Year Forecast: 23% total return potenital + 2% annual valuation boost = 25% CAGR
So, yes, the math isn’t just compelling because our Monte Carlo tool says we’ll most likely deliver Buffett-like returns over the next few years, but it also aligns with fundamentals, as confirmed by Morningstar (and FactSet).
When it comes to my family’s future (and our company’s), I don’t speculate; I make darn sure to double-, triple-, and even quadruple-check my facts, reasoning, and math.
So now let me show you what is REALLY cool about planning future spending!
10 Year Simulations! Highly Useful For Retirement Planning!
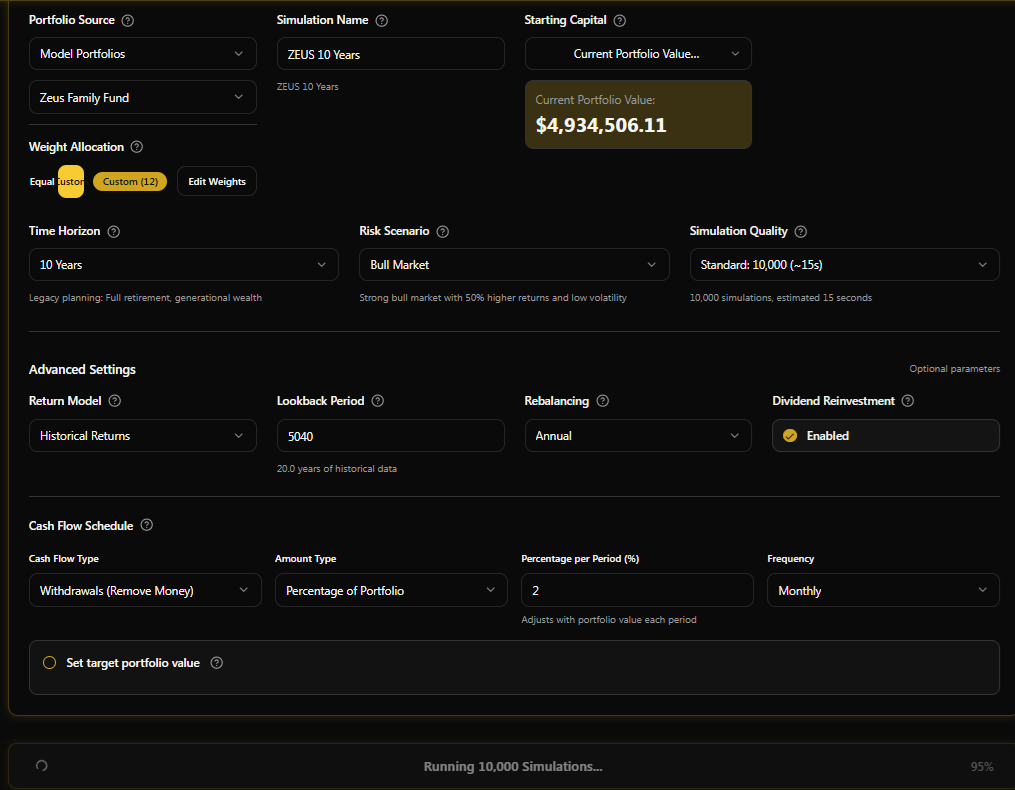
We have income-growth forecasting tools coming soon, but let me show you how I can use a 10-year ZEUS simulator with the 11% max withdrawal risk cap (that AGIOS estimated is optimal for our needs), and how YOU can potentially use this tool for financial planning.
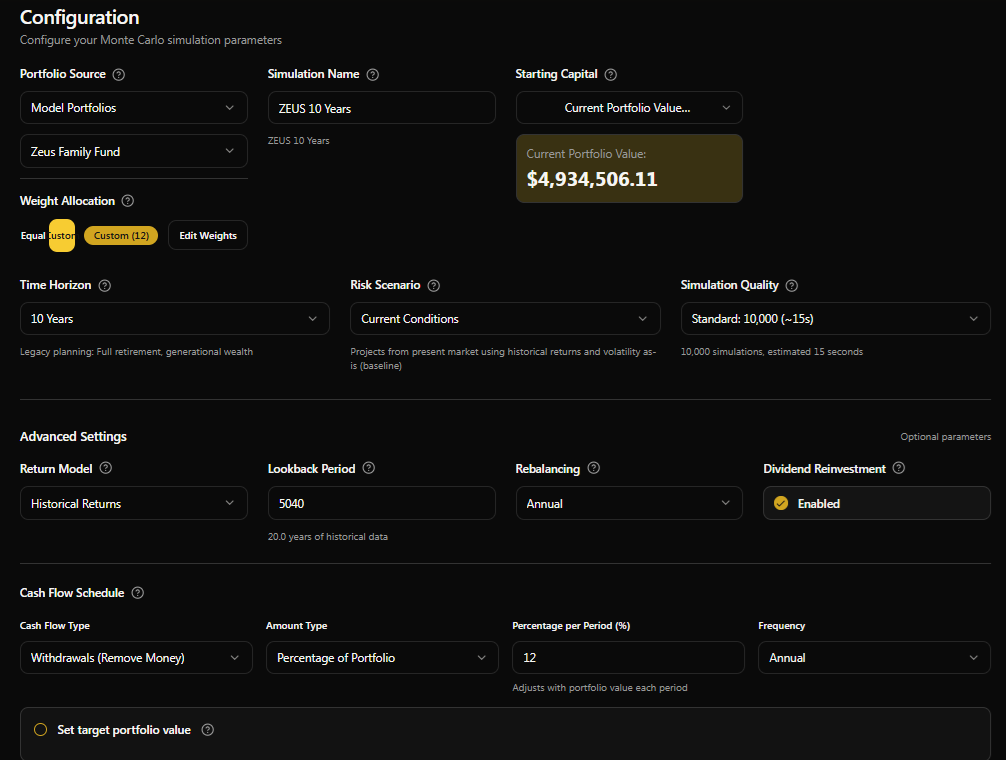
Due to technical limitations at the moment, I had to limit the simulations to 10,000 to make the system run, but the principles for using the tools remain the same.
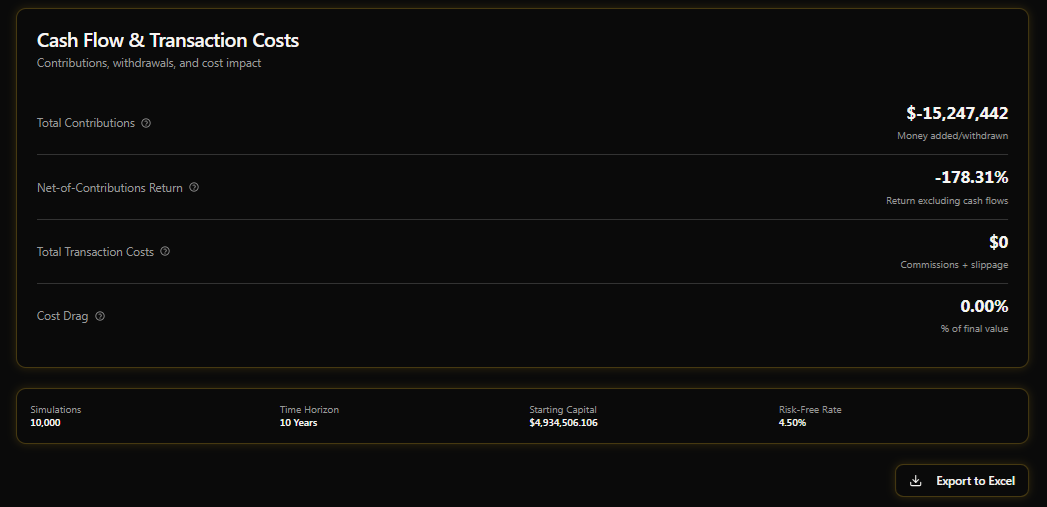
I wanted to showcase how a 12% annual withdrawal rate (3X the 4% rule) and equal to 1% per month on average, results in a VERY high amount of cash flow used for business expenses, supporting family, and donating to charity.
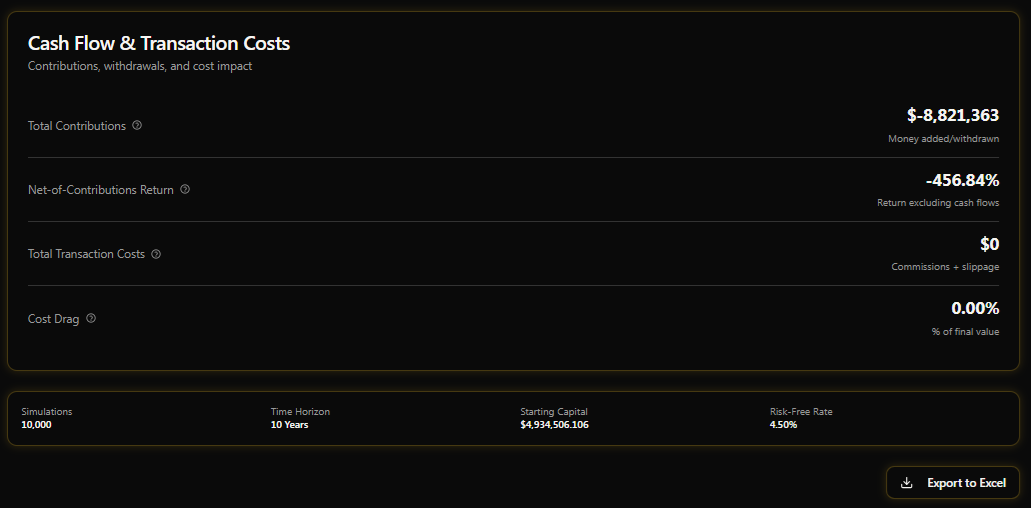
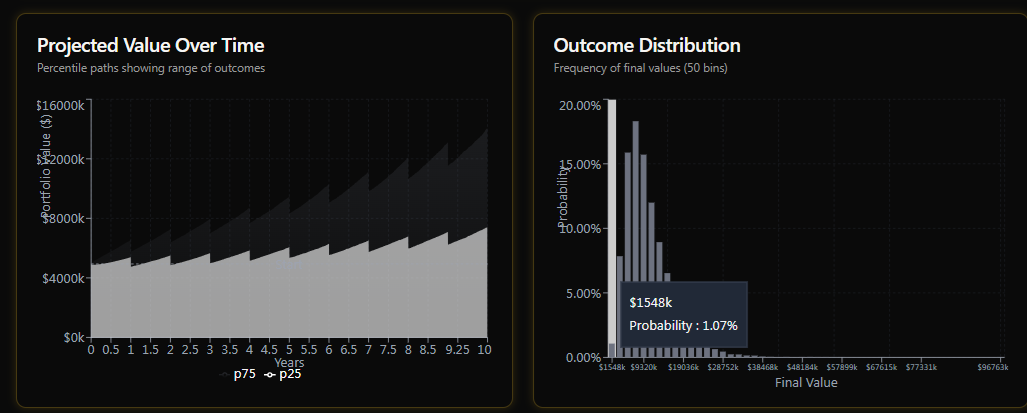
In fact, over the next decade, the base-case total withdrawals are almost $9 million or nearly $1 million per year.
OK, so now let me show you something REALLY cool!
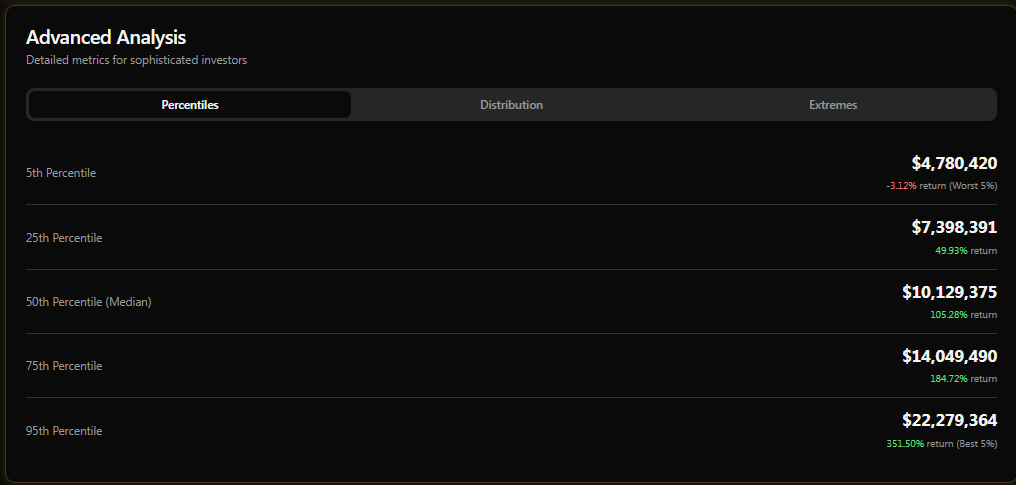
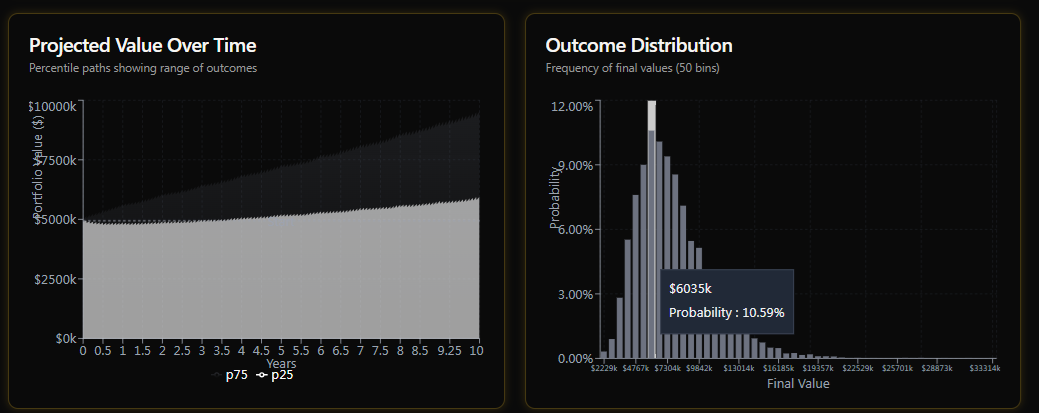
So, even with $9 million in withdrawals over 10 years, the probability of the portfolio increasing in value is over 100%.
The most likely outcome is 347% returns over 10 years (excluding the withdrawals), which is 19% CAGR, which is the base-case 1-year return from yesterday’s report, and slightly above the historical ZEUS returns of 13% to 14% CAGR since 1990.
ZEUS Strategy Returns Since 1990
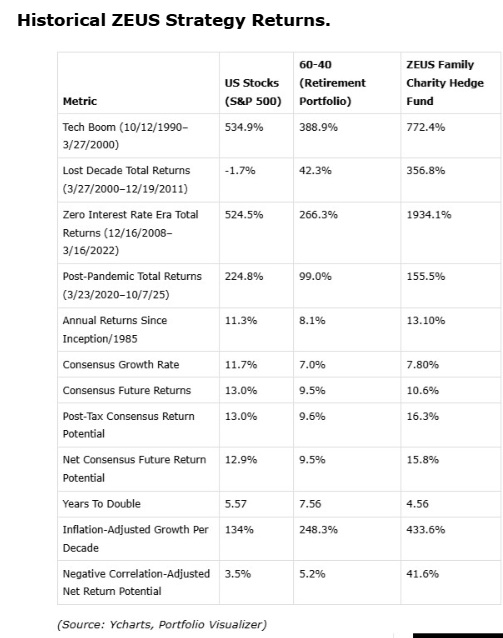
It’s also what the FactSet consensus expects and what Morningstar expects, AND what ZEUS has done since inception.
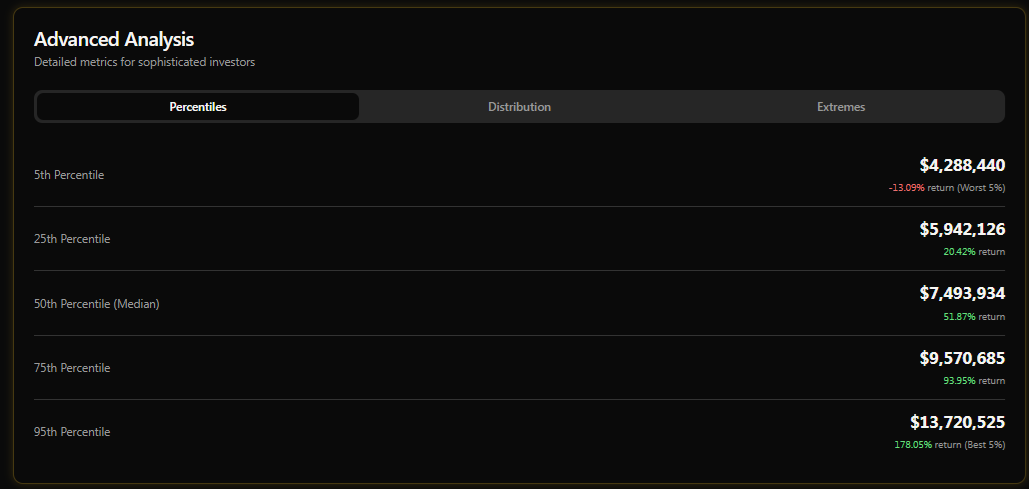
So $9 million in probable withdrawals (3X the 4% rule), AND the most likely outcome is that the portfolio still doubles.
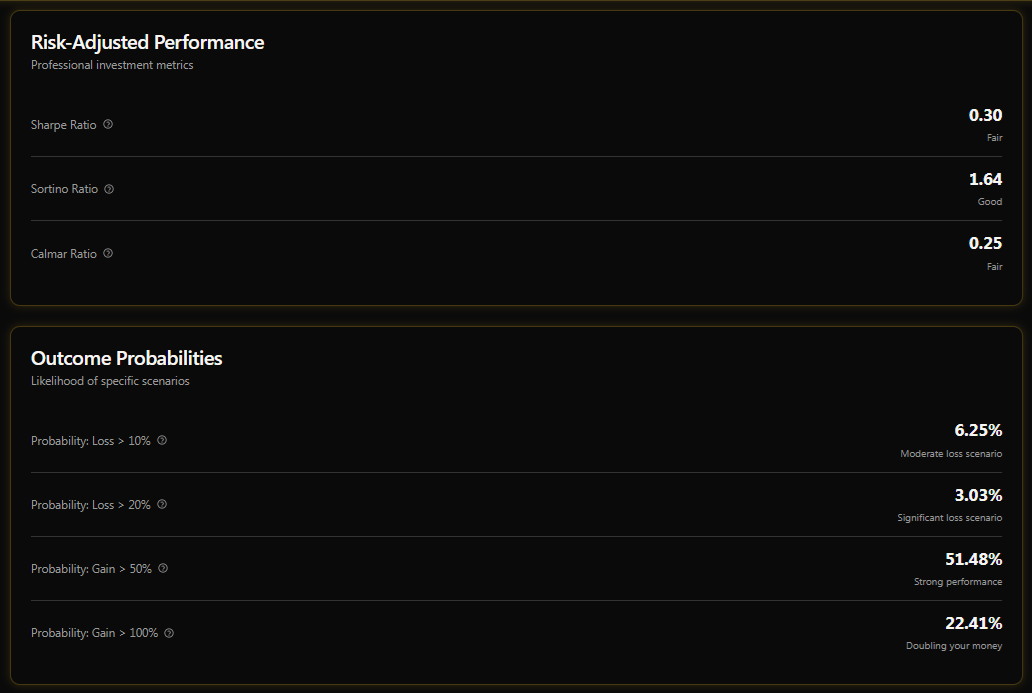
Probability Of Running Out of Money…Even With A 12% Annual Withdrawal Rule? Zero
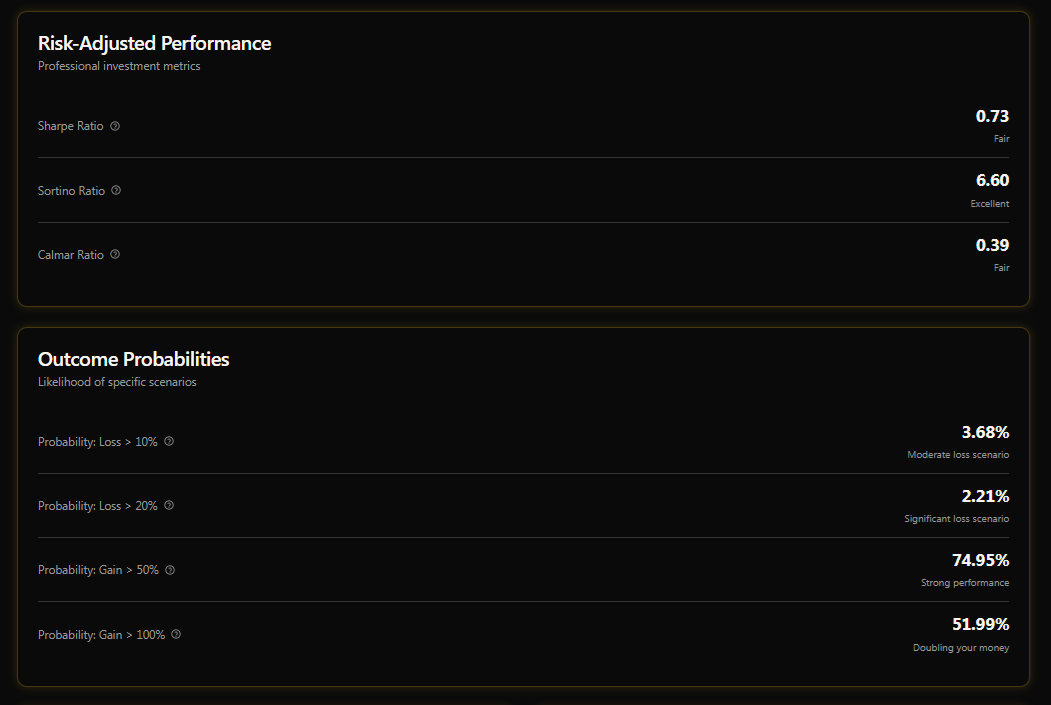
The probability of ZEUS doubling over the next decade, even with my family withdrawing 12% per year, is around 52%, which is 25X the risk of a 20% decline in value.
How Big Of A Peak Decline Am I Likely To Face With A 12% Annual Withdrawal Rate? 32%…The Average Recessionary Bear Market Decline In The S&P (With A Zero % Withdrawal Rate)
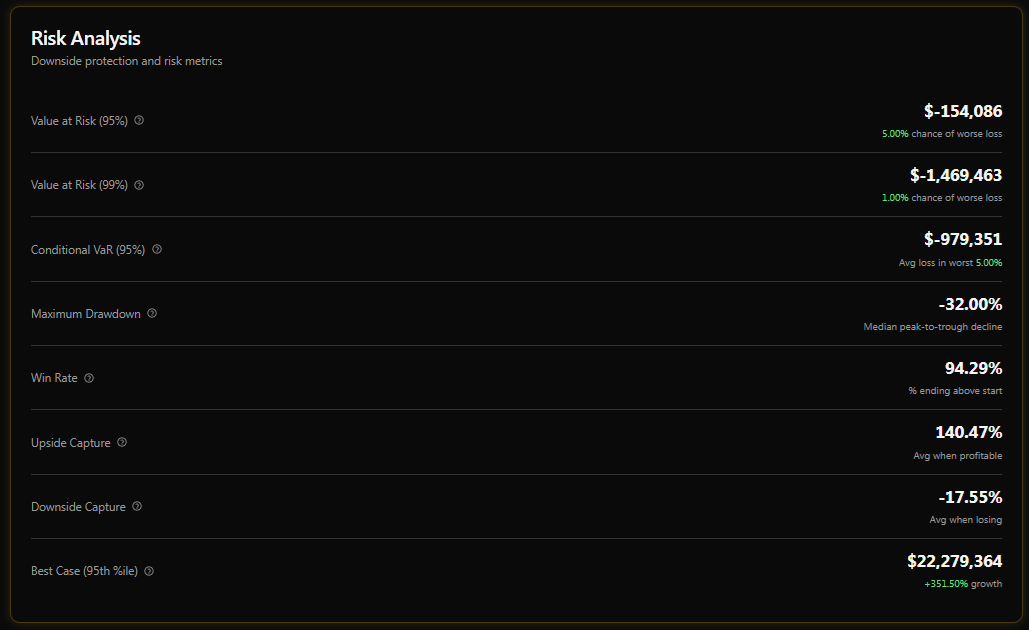
How much of a decline are we likely to face, including 12% withdrawal rates? A 1% worst case scenario? Now we have an answer.
How Much Can You Safely Withdraw? Our Monte Carlo Tool Can Help!
We’re going to update a future version of our tool to calculate the safe withdrawal rates for maintaining a steady inflation-adjusted portfolio balance, but also a “What if you want the portfolio to decline by X% over the time frame?
In other words, if you want to “Die with zero,” you will be able to estimate safe withdrawal rates, and even if you want to reduce the portfolio by 50% over a decade, you will be able to see what withdrawal rate could be optimal each decade.
Or to put another way, what if you double, or triple your withdrawal rate?
Do you think doubling or tripling your retirement income might be helpful to you? To your family’s standard of living?
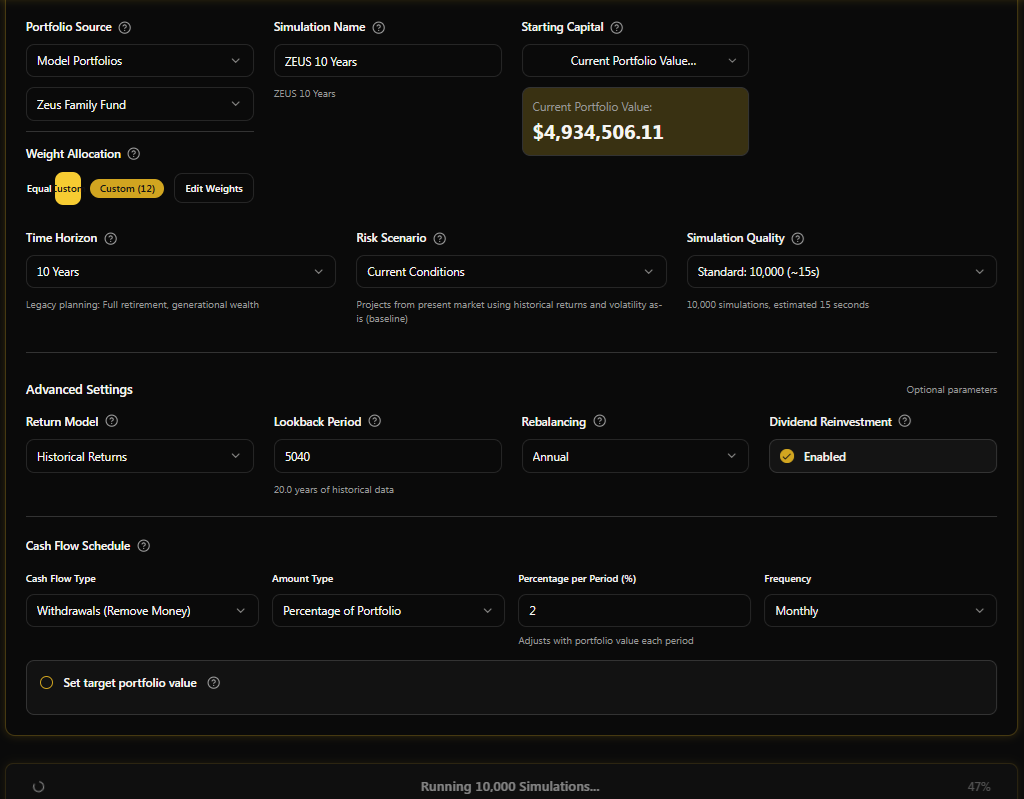
OK, let me show you what happens if we crank up the withdrawal rate to 24% per year. That’s above the 19% CAGR base-case forecast for the next decade.
In fact, I’ll take out 2% per month, which really messes up the compounding BUT generates rivers of cash!
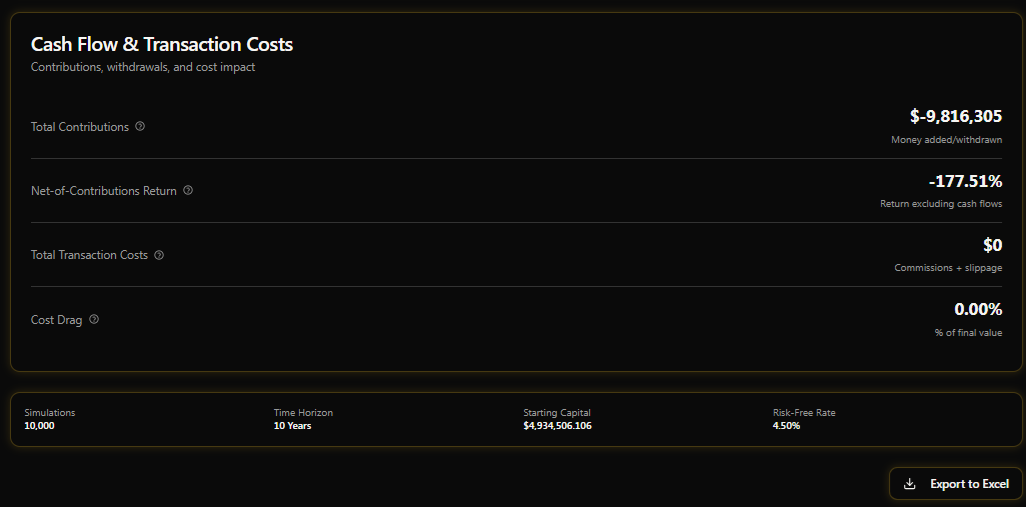
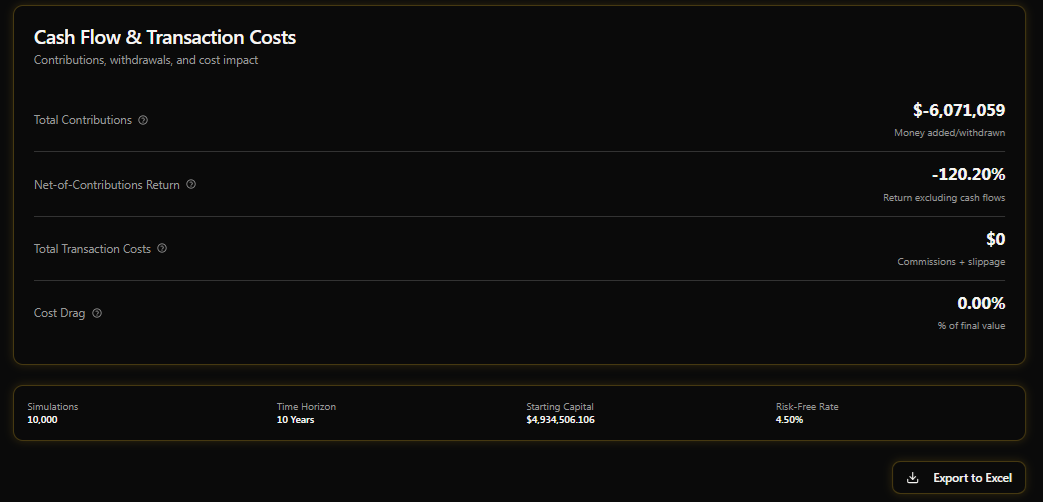
The amount of withdrawals ends up slightly higher (by about 10%) but you can see the total return is around 3X lower (due to the high amounts we’re taking out every month).
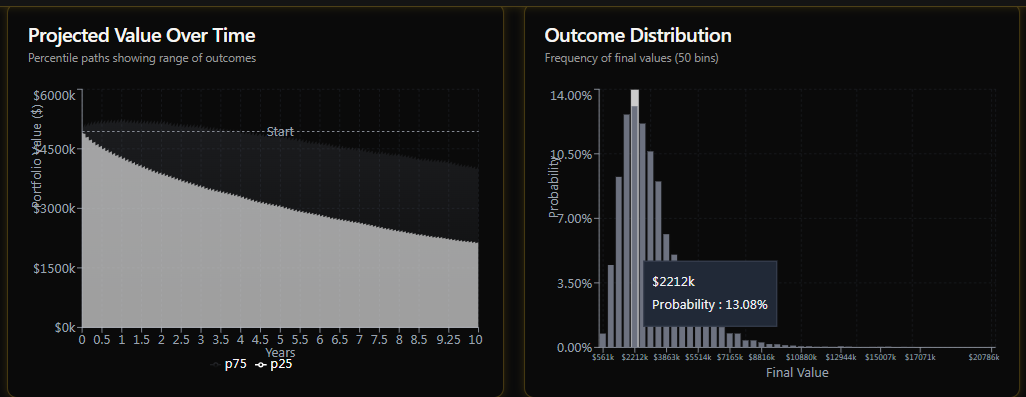
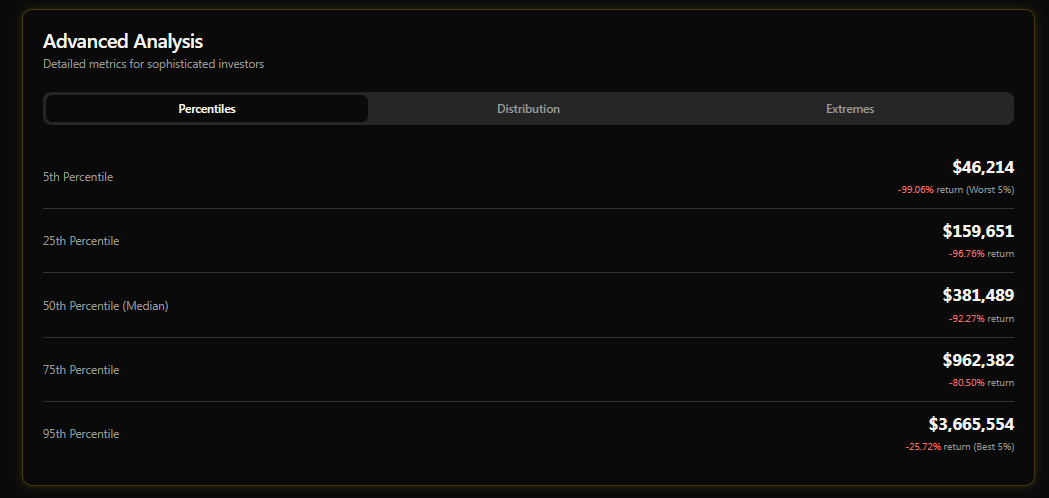
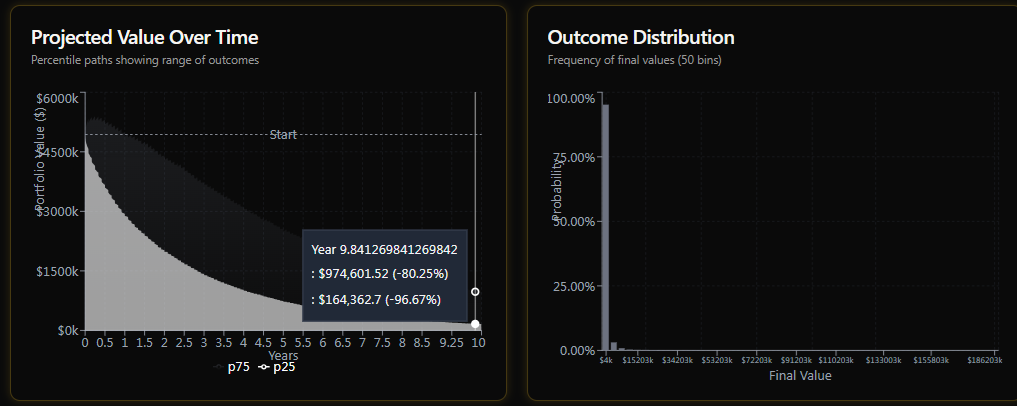
The most likely outcome is that this very high monthly withdrawal rate reduces the portfolio value by 40% over the next decade, but generates a very high standard of living in the initial years (like if you’re retiring and want to live it up before you get older and can’t enjoy your money).
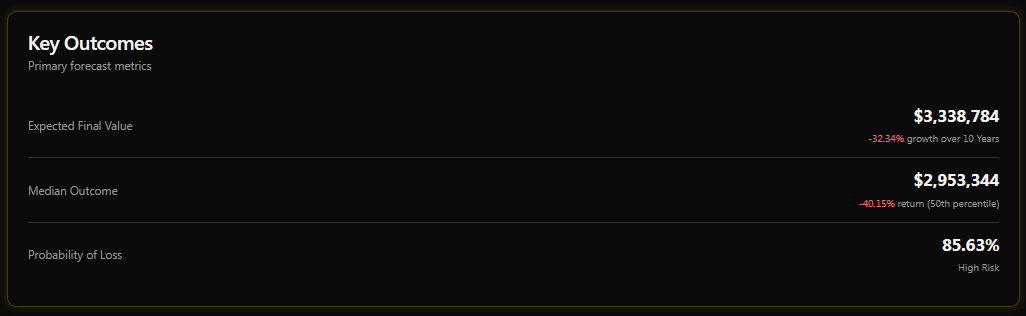
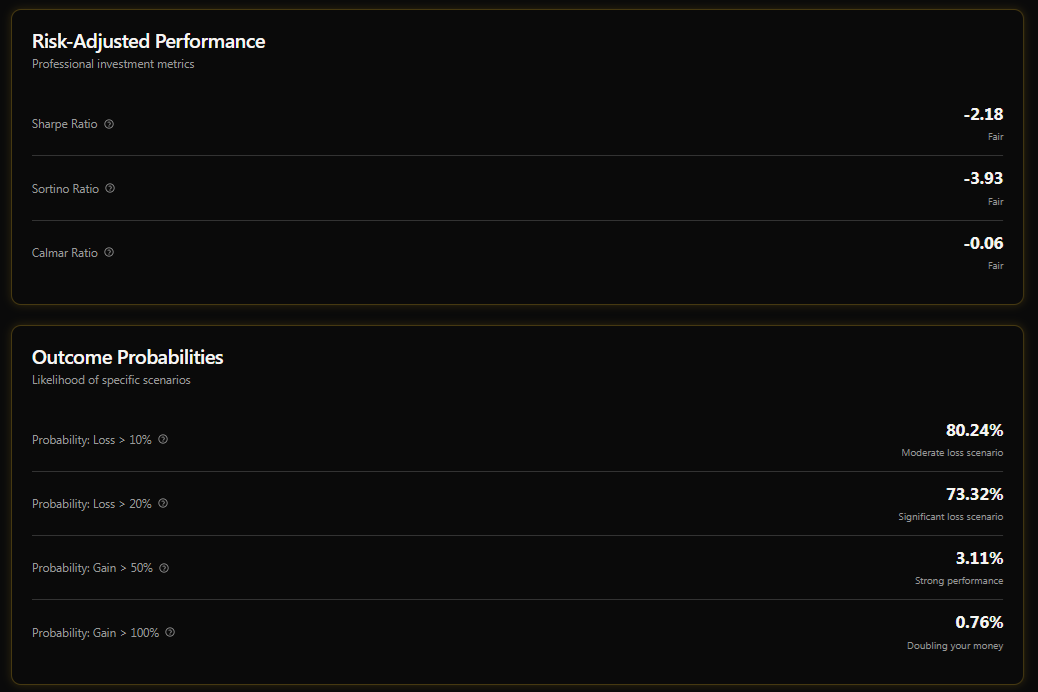
You can see that if our goal is to take out as much as possible and reduce portfolio value over time (the “You can’t take it with you” school of thought), then we now see the probabilities of achieving our goal.
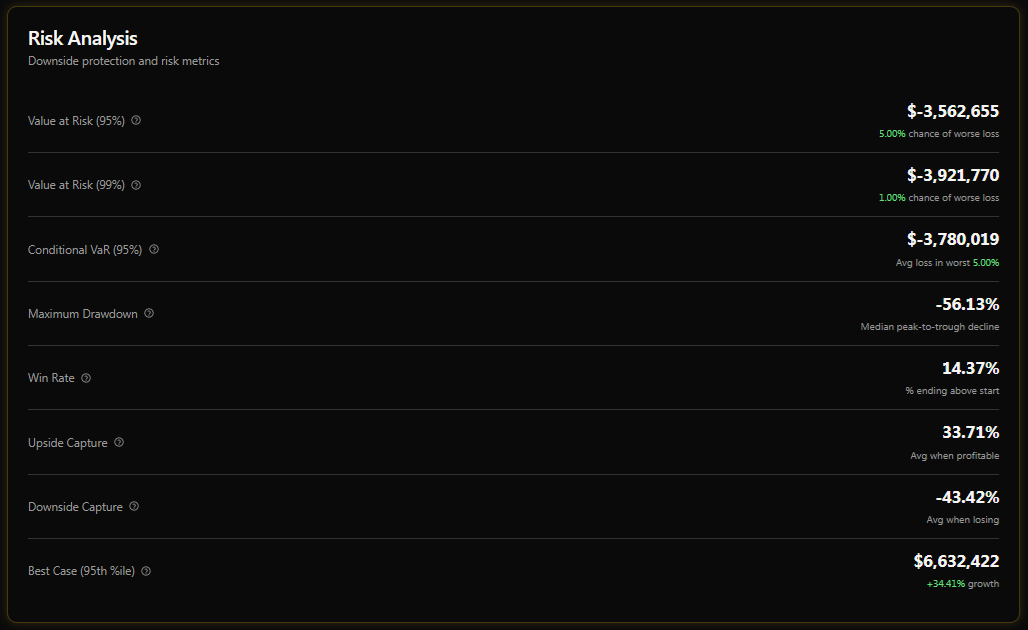
The most likely peak decline is 56%, including our 24% annual withdrawal rates, and remember, the goal was to cut the portfolio value in half. To show how this tool isn’t just for nerds like me who want to build perpetual trusts for their family.😉

Stress Testing Different Scenarios!
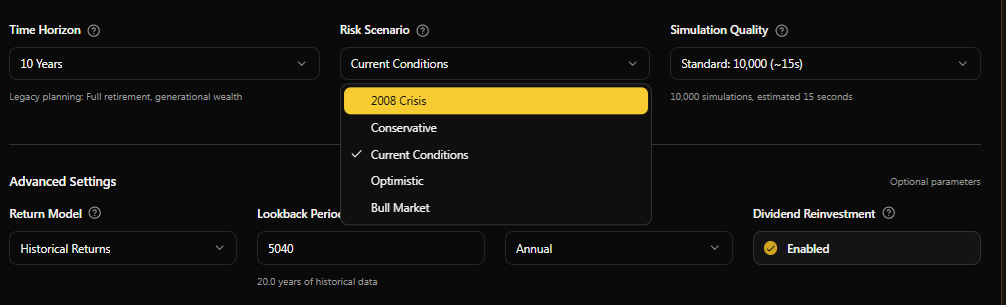
Wonder what might happen if we get another financial crisis?
Well, now you can stress test for that!
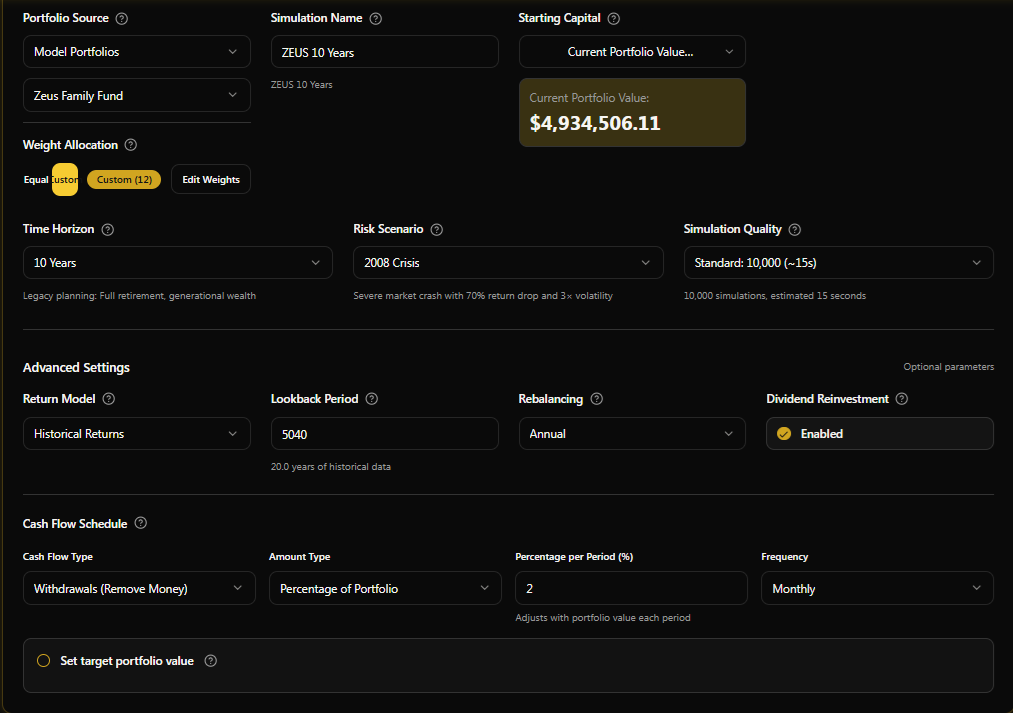
Let’s still use a crazy 2% per month withdrawal rate to see what the probability is of completely running out of money in a worst-case GFC 2.0 style meltdown.
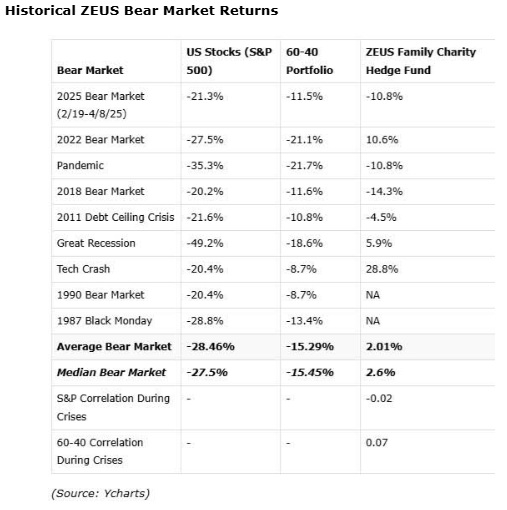
A 40% reduction in total withdrawals in the worst-case scenario (because ZEUS went up 9% in the GFC, remember, it’s designed to thrive in severe bear markets)😉.
But still, if you exclude withdrawals, it’s an 8.2% CAGR total return (better than the 60/40’s historical 7%) even in a lost-decade, GFC-style crash.
So, in this worst-case scenario, with a 2% monthly withdrawal rate, the portfolio’s chance of completely failing (running out of money) is less than 5%.
OK, but what is the opposite of what is above? A bullish, AI boom scenario?
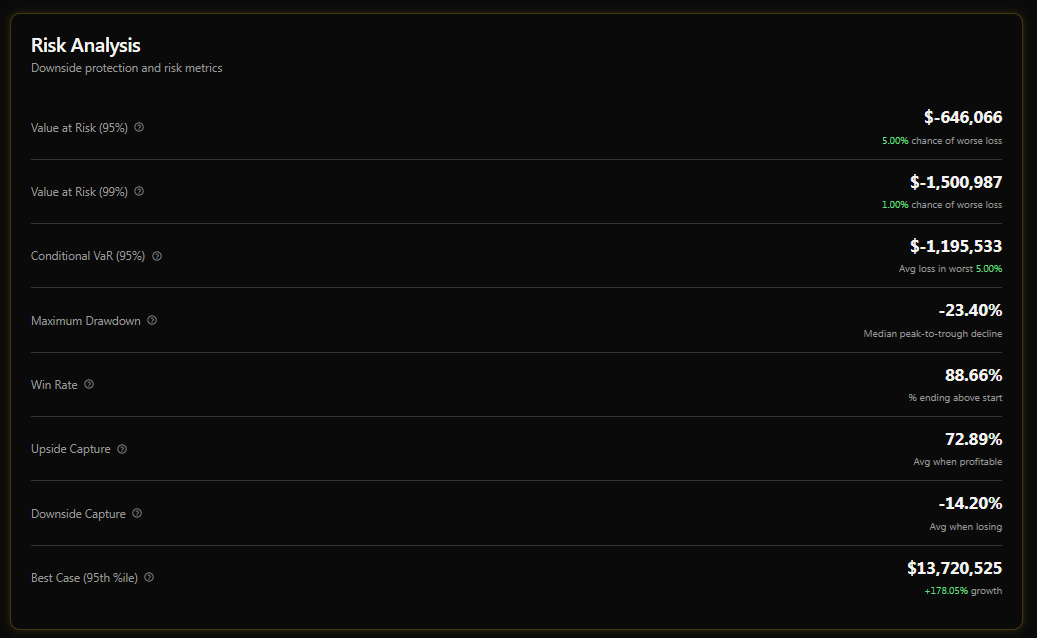
Stress Testing The Best Case Scenario!
OK, so now what kind of withdrawals might we be looking at with a crazy 2% per month withdrawal rate?
In a bull market scenario (the AI age of abundance), we can take out 3X what we started with and still achieve an almost 11% CAGR! Even with 1/50th of the portfolio withdrawn every month.
The probability of doubling the portfolio is about 7X larger than it shrinking by 20% or more even with a 24% annual withdrawal rate (with the most compound negative withdrawal schedule possible) in this bull market scenario.
The most likely outcome in an AI boom scenario is that even with absurdly high withdrawals, the portfolio still goes up in value (by around 50%).
With a 24% annual withdrawal rate, in an AI boom scenario, the peak decline (median scenario) is just 23.4%.
Now, do you see the power of this tool?
You can use it to see how different scenarios are likely to affect your standard of living (and emotional well-being) in the coming decade.
You can see how different withdrawal rates and schedules will be able to alter your inflation-adjusted income.
And that’s before we unveil the income modeling features that are coming soon!
Now do you see why we are so excited! Because we’re fundamentally financial nerds who like building cool stuff and helping families achieve their financial dreams!