I finally have a full day without meetings (1 today, but close enough😉) to do a deep dive into Simplify Managed Futures, the single biggest holding in the ZEUS family fund.
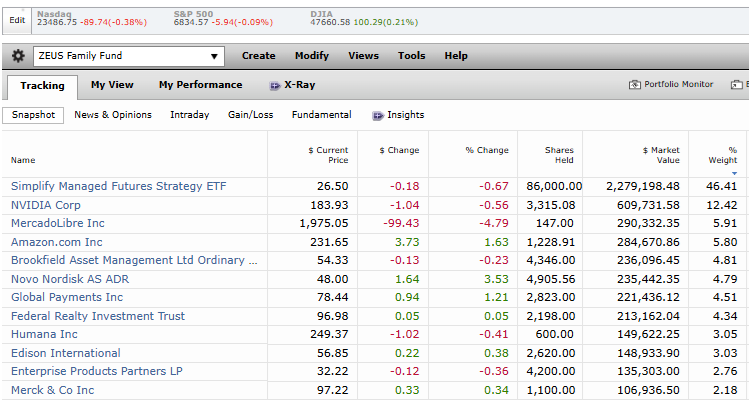
A lot of people own CTA (probably because I do), so I owe it to them (and my ZEUS family) to make sure the facts haven’t changed about the gold standard of asset hedging.
CTA is 50% long or short on bond futures and 50% long or short on commodity futures (roughly; at any given time, it can be different).
ZEUS selected CTA as its hedging asset because of the “magic” power of asset allocation like this.
25% bonds (long or short)
25% commodities (long or short)
25% growth stocks (long only)
25% value stocks (long only)
While technically three asset classes, historically these 4 buckets act like 4 asset classes, rising and falling at different times (but generating positive returns in each bucket over time).
Why My Family Trusts The ZEUS System
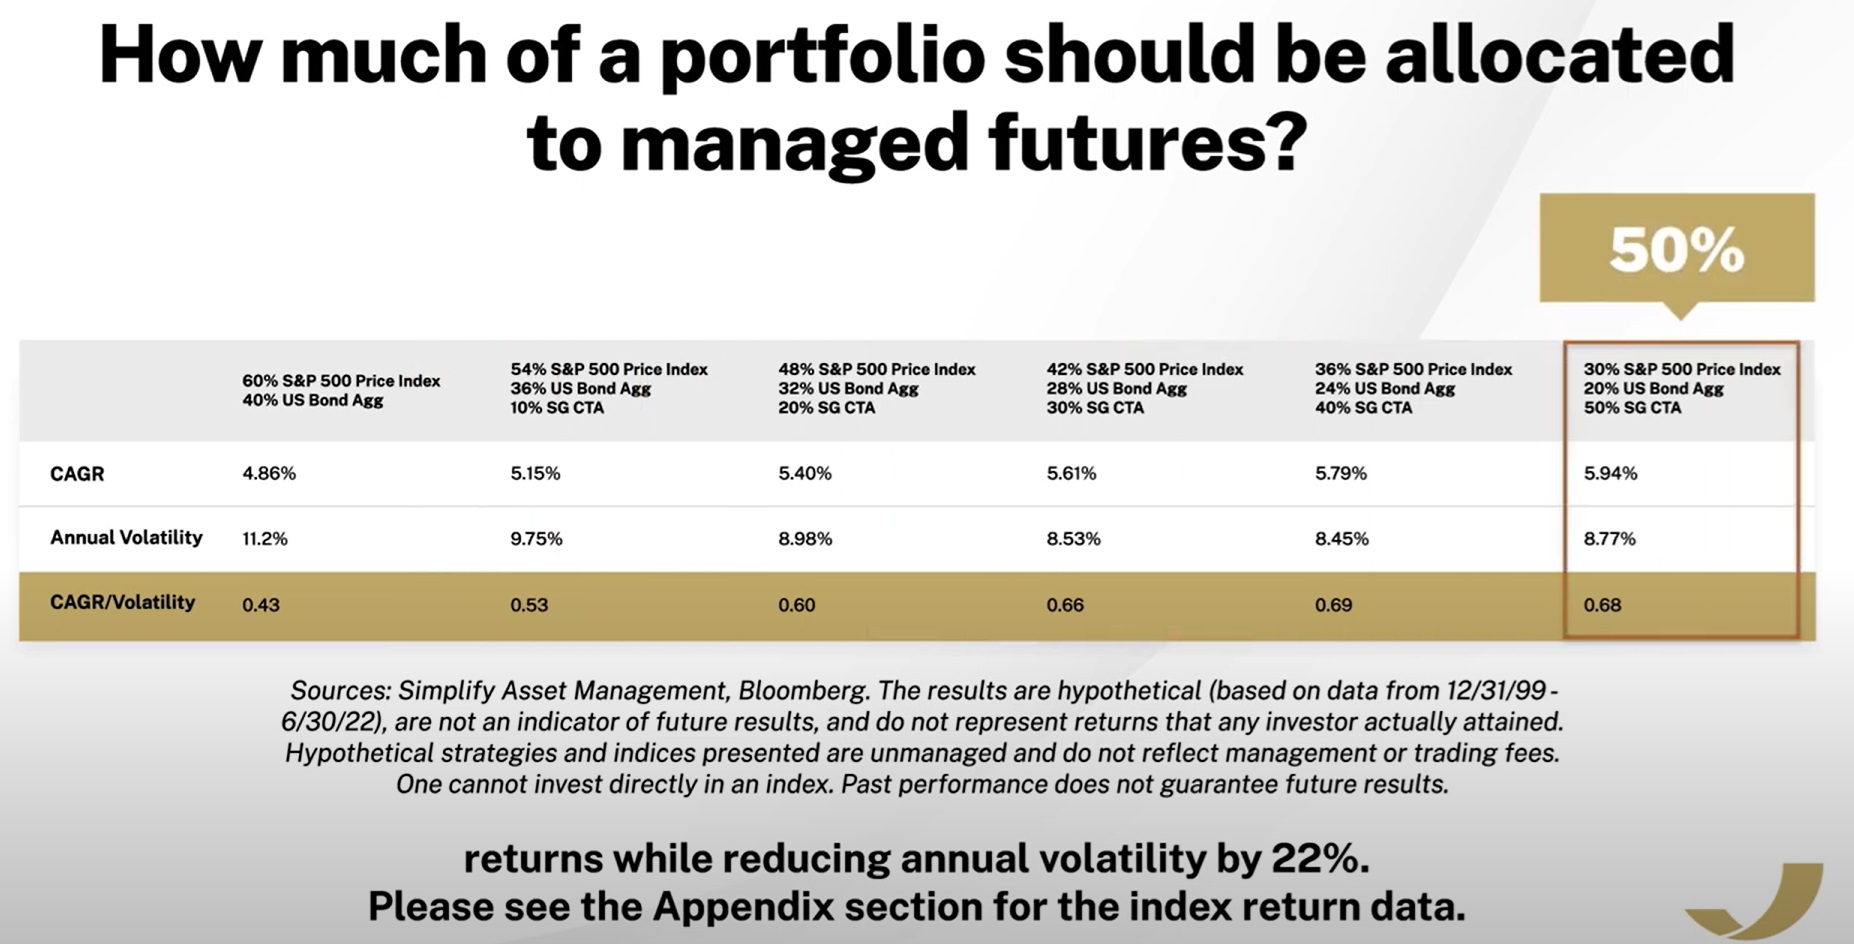
The “Magic” Ultra Low Volatility Portfolio Strategy
But it’s not just about minimizing volatility, it’s about maximizing total return consistency over time, across different market and economic regimes.
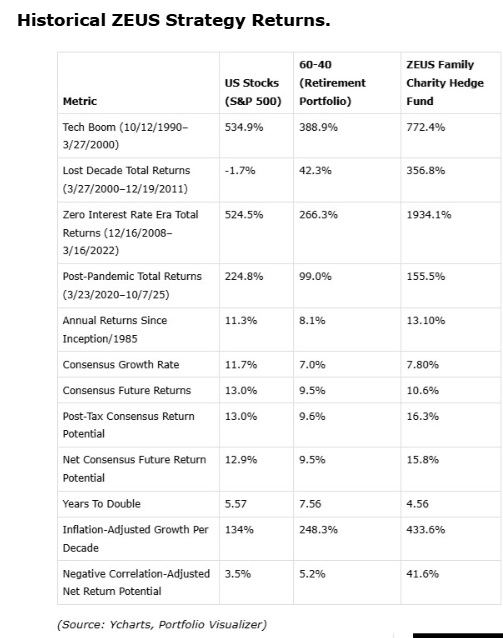
Historically, the Nasdaq has done 13% to 14% CAGR for the last four decades, and for a 50% equity portfolio to keep up with that, while delivering super low volatility (MOST OF THE TIME) that is quite extraordinary.
What’s The Matter With Simplify Managed Futures?
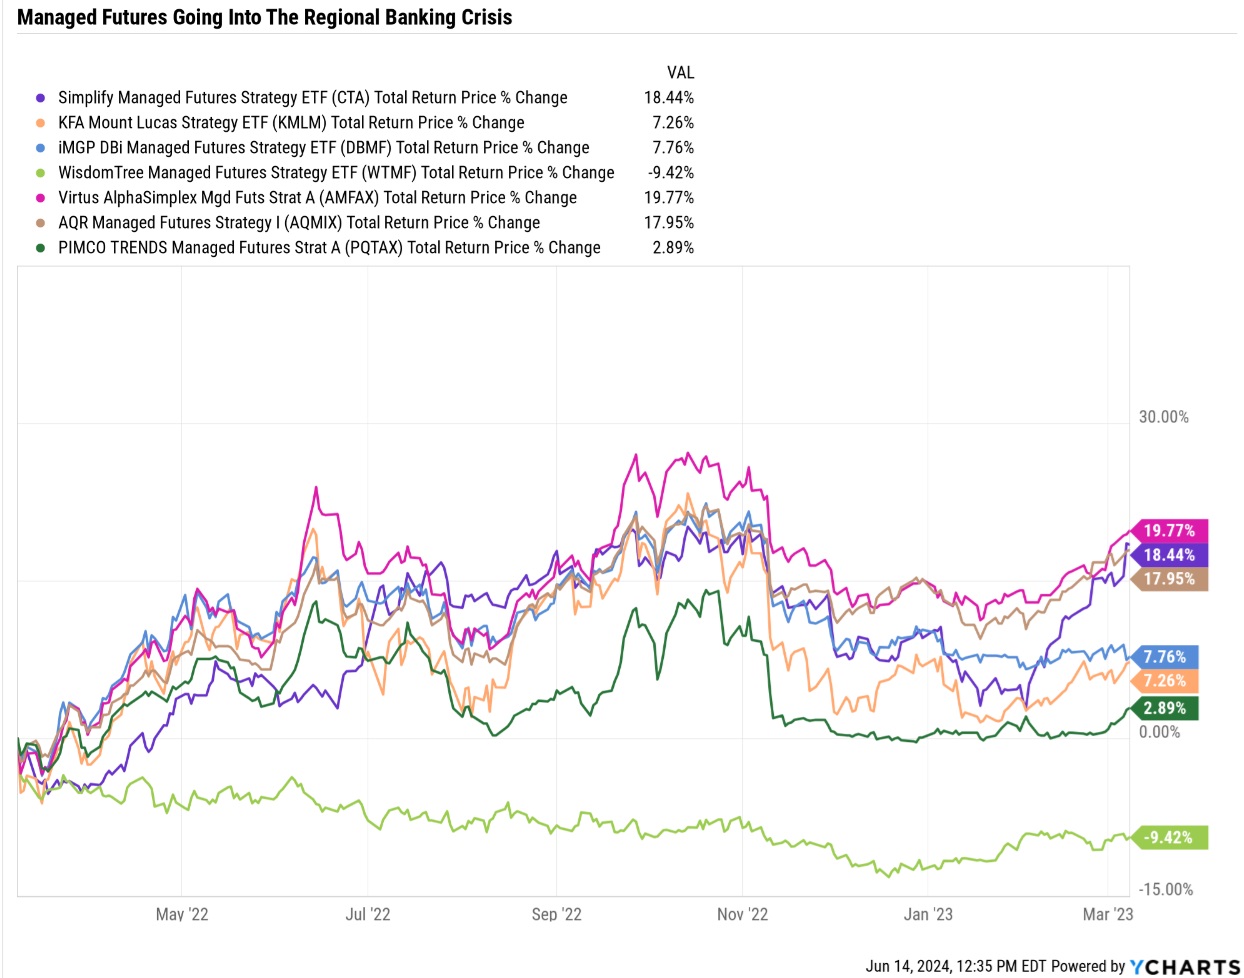
CTA was a 5 Star 5-Star-rated managed Futures ETF for the first 3 years (once the rating became established after 3 years), but lately, investors (such as myself) have noticed that CTA hasn’t been doing as well.
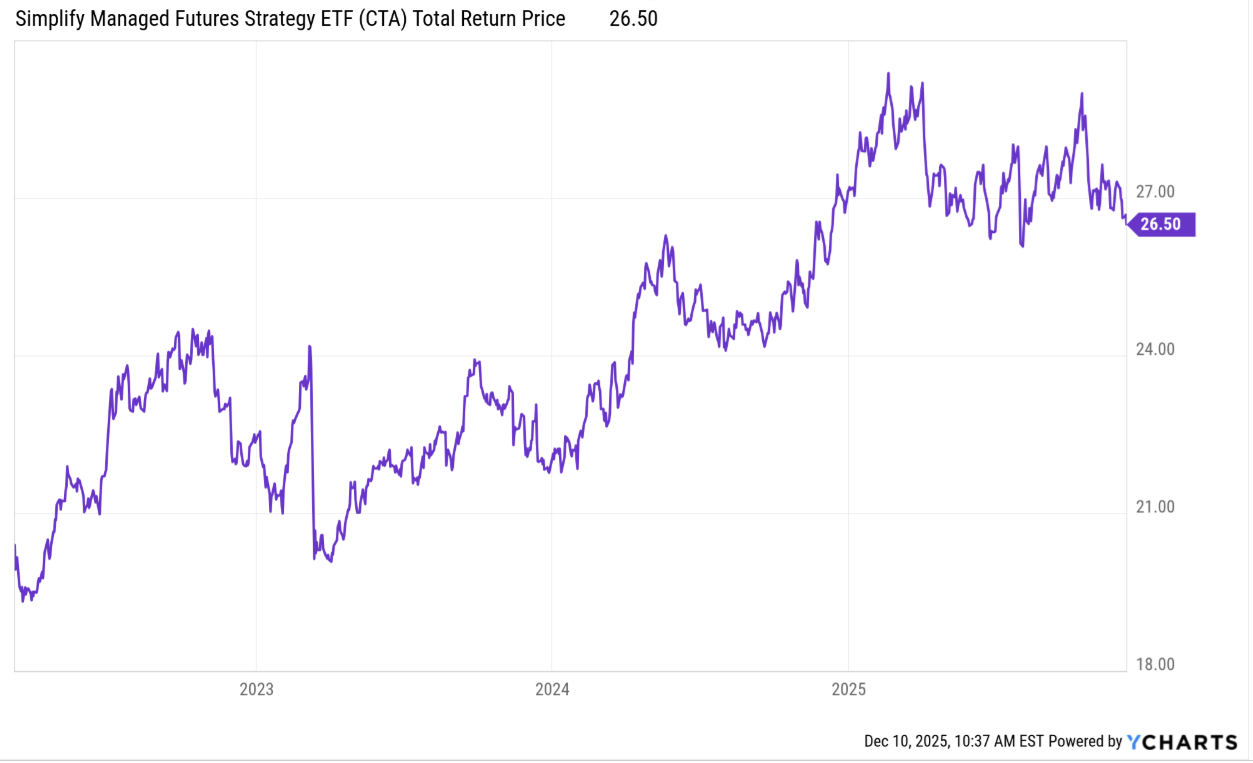
CTA has been flat for a year, and what about its peers?
So to answer the question of whether or not CTA remains a gold standard hedging choice, let’s zoom out and take a look at managed futures in particular, and why they are worth owning long-term, and what makes Simplify Managed Futures unique, and then look at the data and see whether CTA’s “thesis is broken” or if this weak period is normal or a sign its algorythms have broken.
Fact 1: What Are Managed Futures
Managed futures means a fund or ETF that is going long or short various asset classes, usually four.
Stocks
Currencies
Bonds
Commodities
Historically, these asset classes have been non-correlated, meaning they move up or down independently of one another.
This creates diversifying benefits, the so-called “only free lunch on Wall Street”.
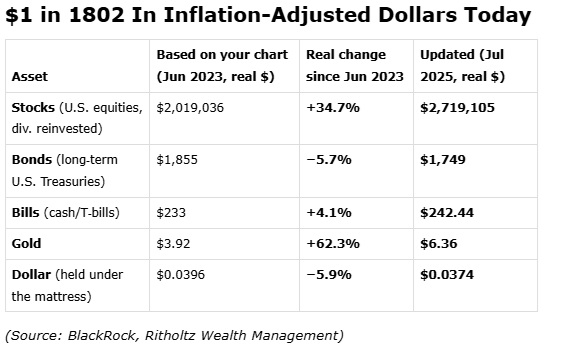
Over the long term, Simply Rebalancing Non-Correlated Assets Generates “Free” 2% to 3% returns.
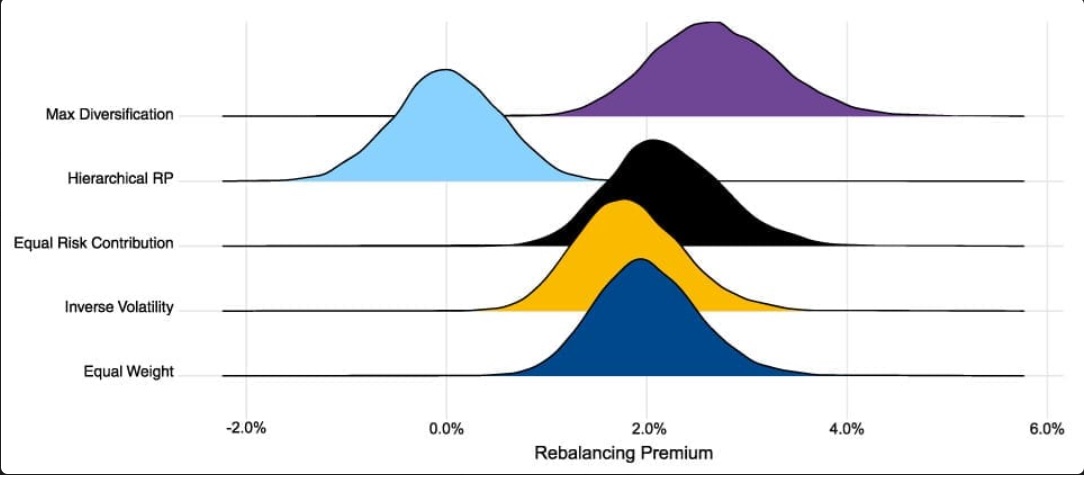
But of course, the value of diversification isn’t just about “free returns,” it’s about lower volatility so you can sell assets to raise funds at a profit, in a stock market correction.
Consistency & Reliability Are The New Hotness 😉

This chart from Ray Dalio’s Bridgewater shows the benefits of non-correlated assets (and why hedge funds exist). The more non-correlated assets you have, the lower the annual volatility (standard deviation). The US stock market has a historical volatility of 15%. So think of it as “in any given year, the stock market can fall 15% for no good reason”.
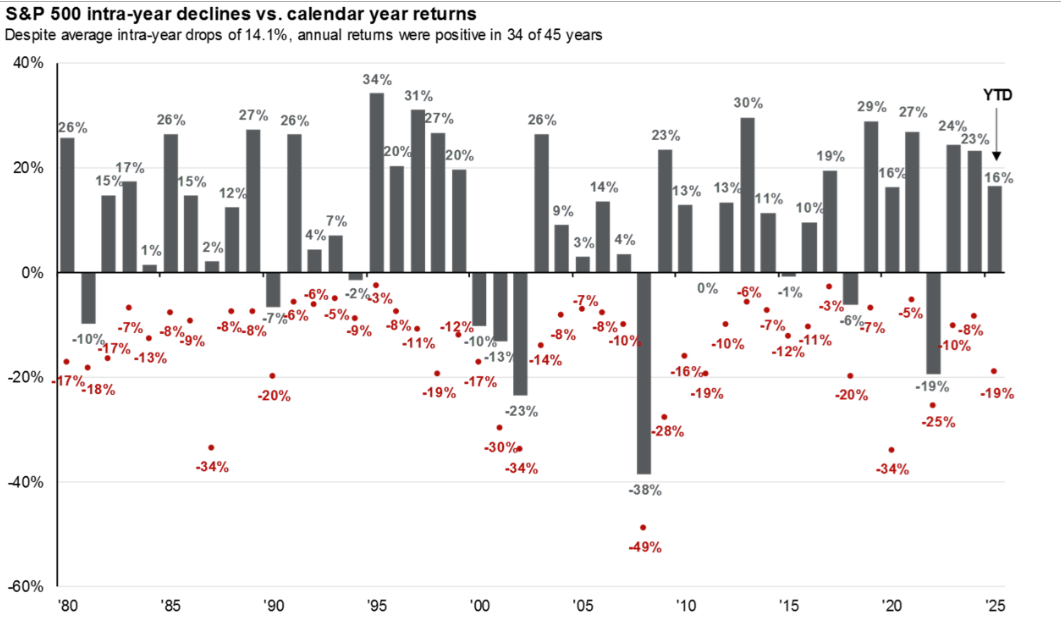
In fact, the average peak decline in the stock market since 1980 is 14%, even though the market is up 75% of the time. And guess what? The median gain in a positive year? 20%.
In fact, the stock market is 1.5X more likely to go up 20% in any given year than go down by any amount.
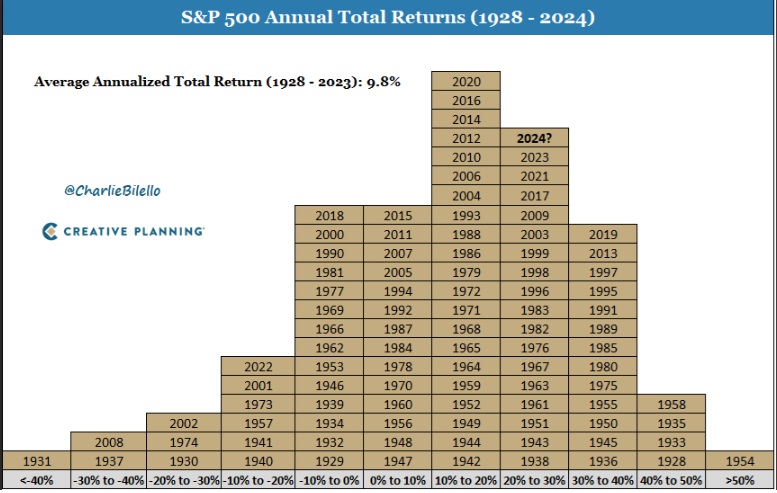
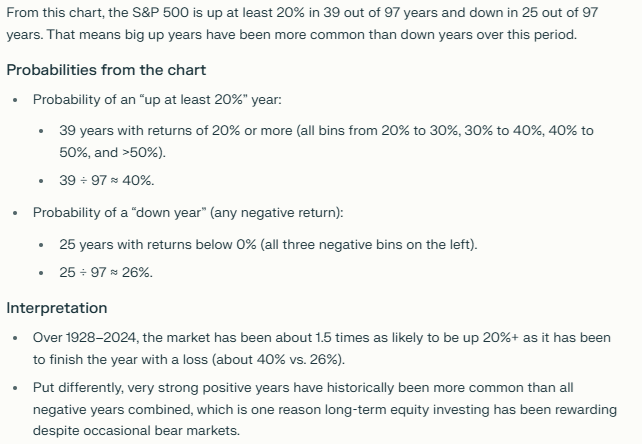
40% of all years the stock market is up at least 20%, so years like 2023 and 2024 are not actually a sign of a bubble; they are quite common.
“A 6 Foot Man Can Drown Crossing A River That’s 3 Feed Deep…On Average,” Howard Marks
This is the reason that not everyone owns 100% stocks all the time. Just because stocks, on average, do 10% per year over time and are 76% likely to go up in any given year, doesn’t mean that you can’t go bankrupt personally due to “sequence of return risk”.
In other words, if you have the bad luck of retiring at the stock market bubble peak of 2000? And then the stock market suffers a 37-month bear market where stocks spend 3 years falling 52% and tech stocks 82%? That’s the kind of bad luck that can destroy your financial goals.
The same is true of the “lost decade” of the 2000s, when a 50% crash bookended the start of the decade and then a 58% crash the end of the decade.
The Nasdaq, from the March 2000 bubble top, adjusted for inflation, took 15 years to break even if you had the bad luck of being 100% Nasdaq at the peak of the bubble.
Now Do You See Why Institutions Like Pension Funds & Endowments, & Sovereign Wealth Funds Aren’t just 100% stocks?
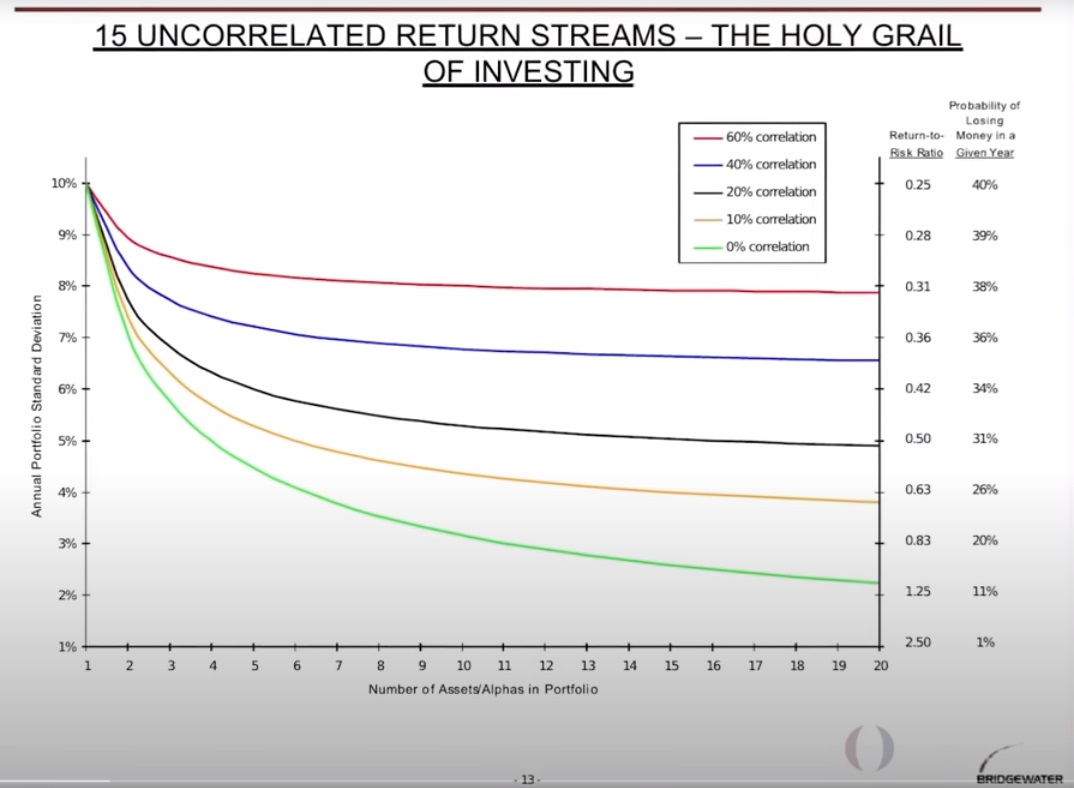
Now, of course, this chart doesn’t literally say “There are 20 perfectly non-correlated asset classes that can generate sub 3% annual volatility and have a 12% probability of losing money in any given year,” it’s a hypothetical statistical chart. You can see how even a 10% correlation between 20 asset classes increases the annual volatility from 2.5% to about 4% and increases the risk of losing money in any given year by about 100% (from 12% to about 25%).
Most asset classes are more correlated (because any long-only asset class, like art, wine, collectibles, barrels, ect, is funded with stock market gains and if you have even 20 asset classes that are 60% correlated to each other you can see how the risk of losing money in any given year suddenly rises to close to 40% (vs 26% for the stock market).
Enter Managed Futures
Managed futures, primarily trend following systematic funds, have historically delivered long-term returns on par with the stock market…BUT at different times than the stock market.
And that’s why, historically, over the last 50 years or so, managed futures have created a very reliable and effective way of controlling volatility in one’s portfolio.
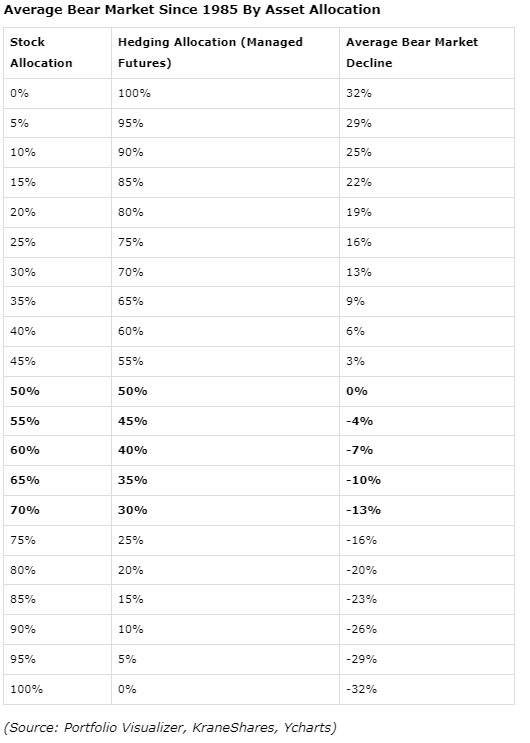
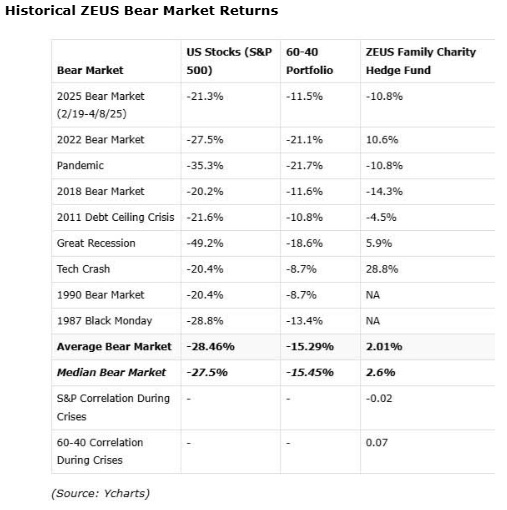
Since 1985, a 50% stock, 50% managed futures portfolio has averaged a peak decline of 0% at the stock market’s bottom (peak panic, when correlations go to 1 due to global margin calls).
Also, Highly Effective Over The Last 25 Years
OK, but why trust 50% of ZEUS to one ETF? To answer that, let’s consider Simplify Managed Futures Itself.
What Makes Simplify Managed Futures (CTA) Unique?
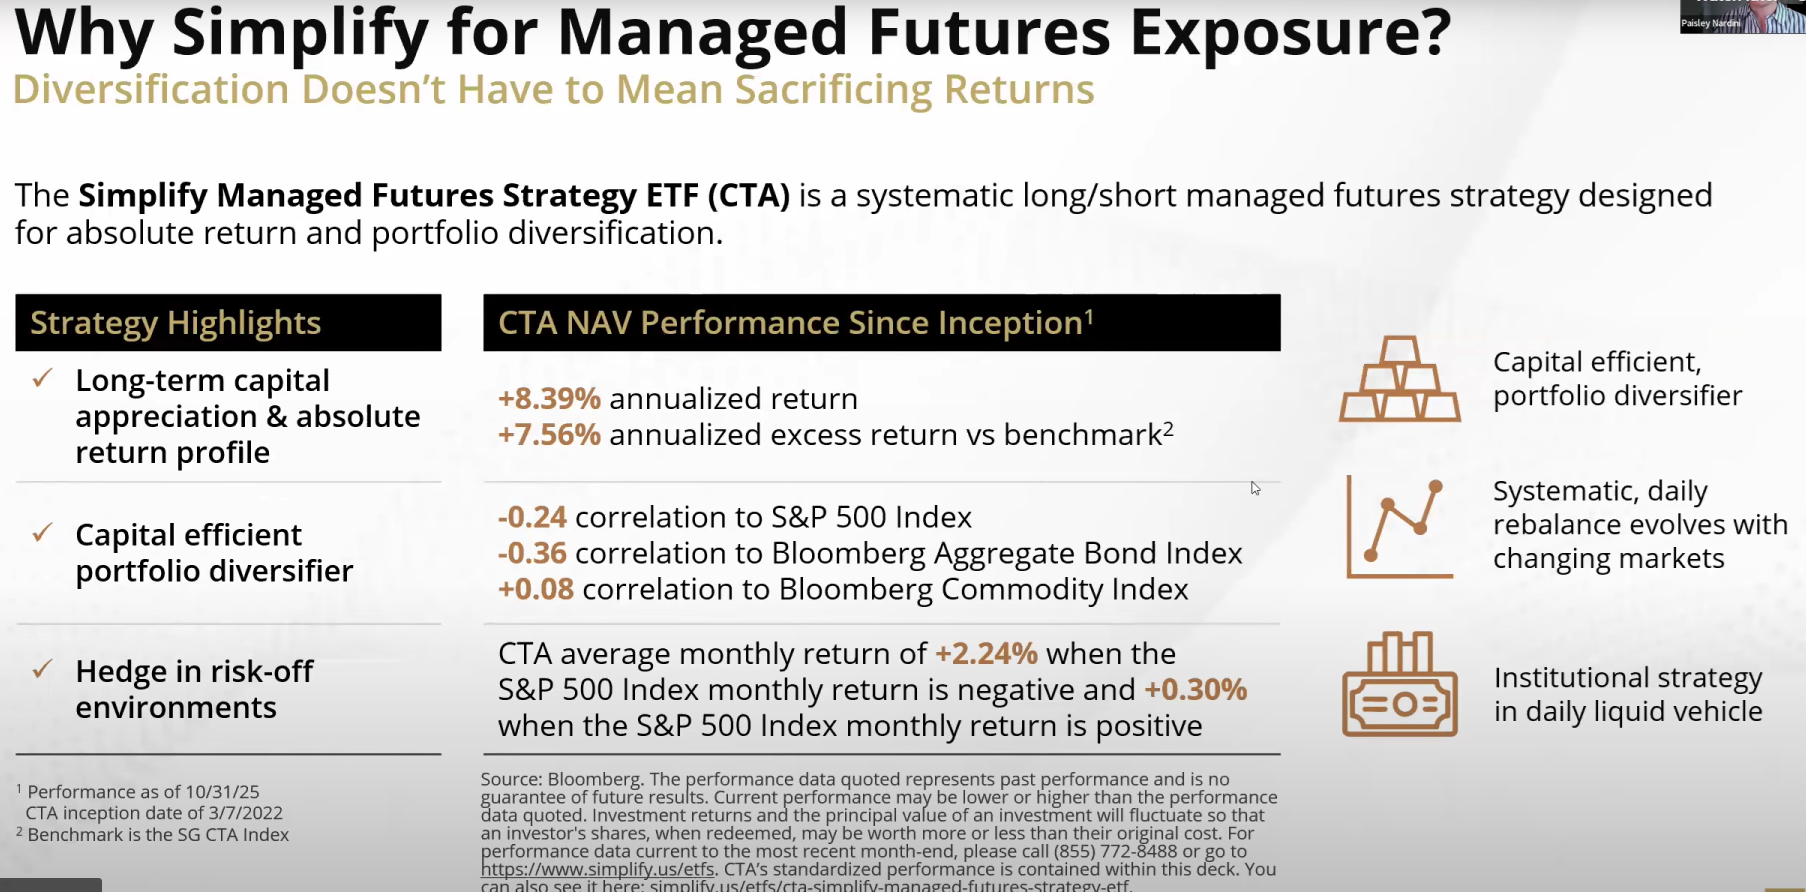
CTA has outperformed managed futures (Soc Gen CTA index) since its March 7th, 2022 inception (start of the 2022 bear market). Managed futures, as a group, have actually lost about 1% per year, while CTA has achieved an 8.4% CAGR.
Most importantly, its correlation with the stock, bond, and commodity markets has been very low. AND in months when the market is up, CTA averages a modest positive gain; in months of negative stock returns, the returns average 2.24%.
What makes CTA unique is primarily two factors. First, it doesn’t use equity or currency futures, because while highly liquid, their research indicates that these asset classes don’t trend as cleanly.
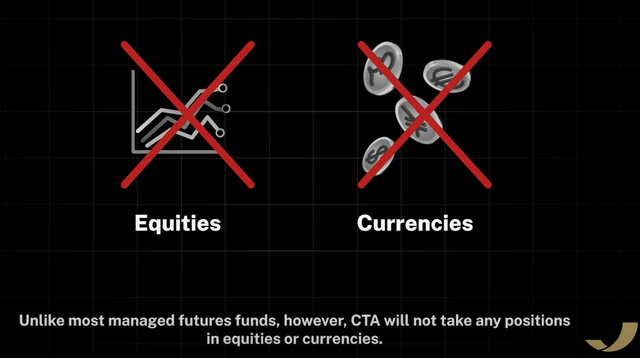
For example, currency prices can crash or soar on political news, and of course, so can stock prices. So imagine if the stock market is rallying steadily and the trend following strategy makes a managed futures ETF more and more long stocks…and then we get a sudden shock triggering a bear market?
This is why CTA has historically had the best downside capture ratio.
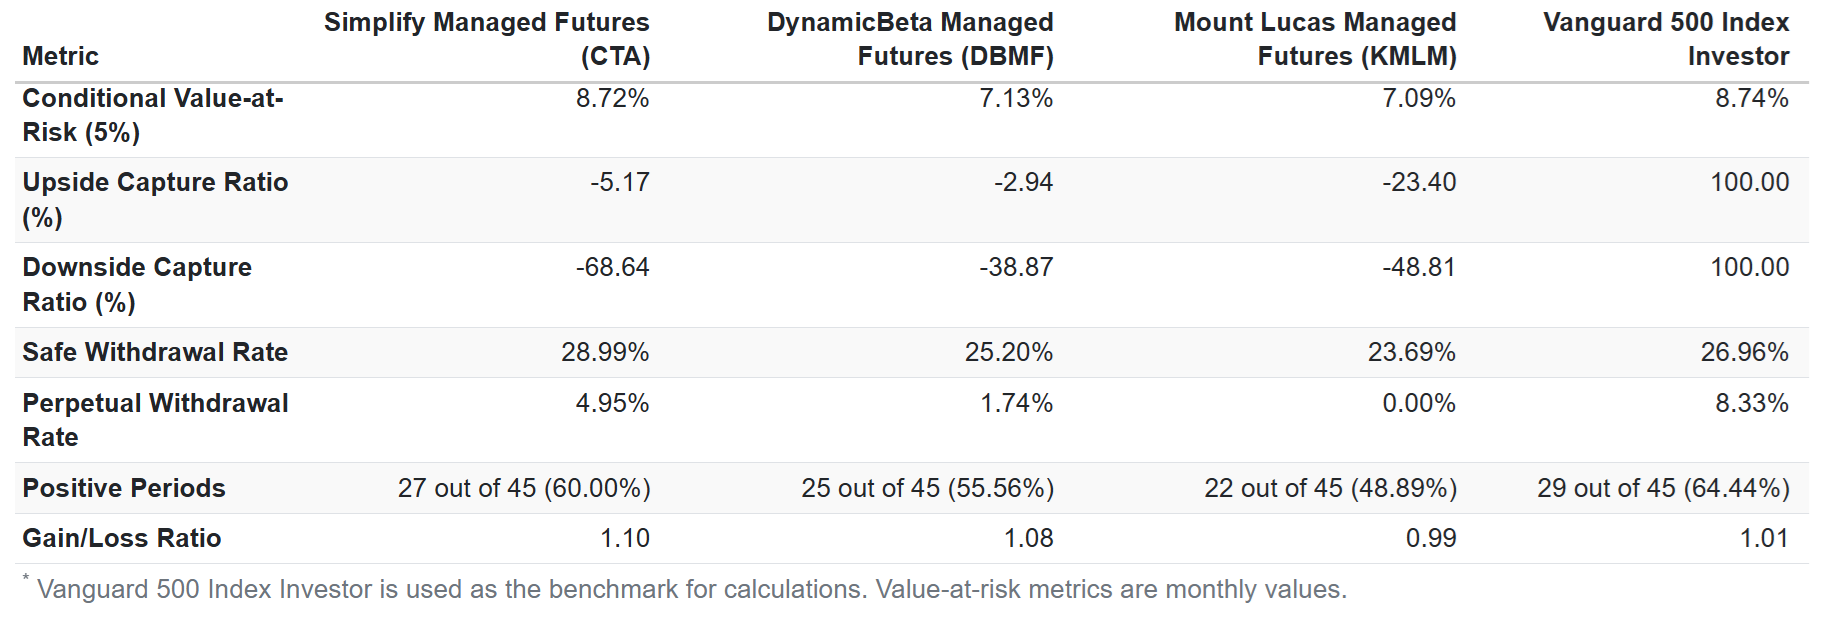
The downside capture ratio is the % of the market’s downside captured in a falling market. The more negative the ratio, the more an ETF is likely to rise in a falling market.
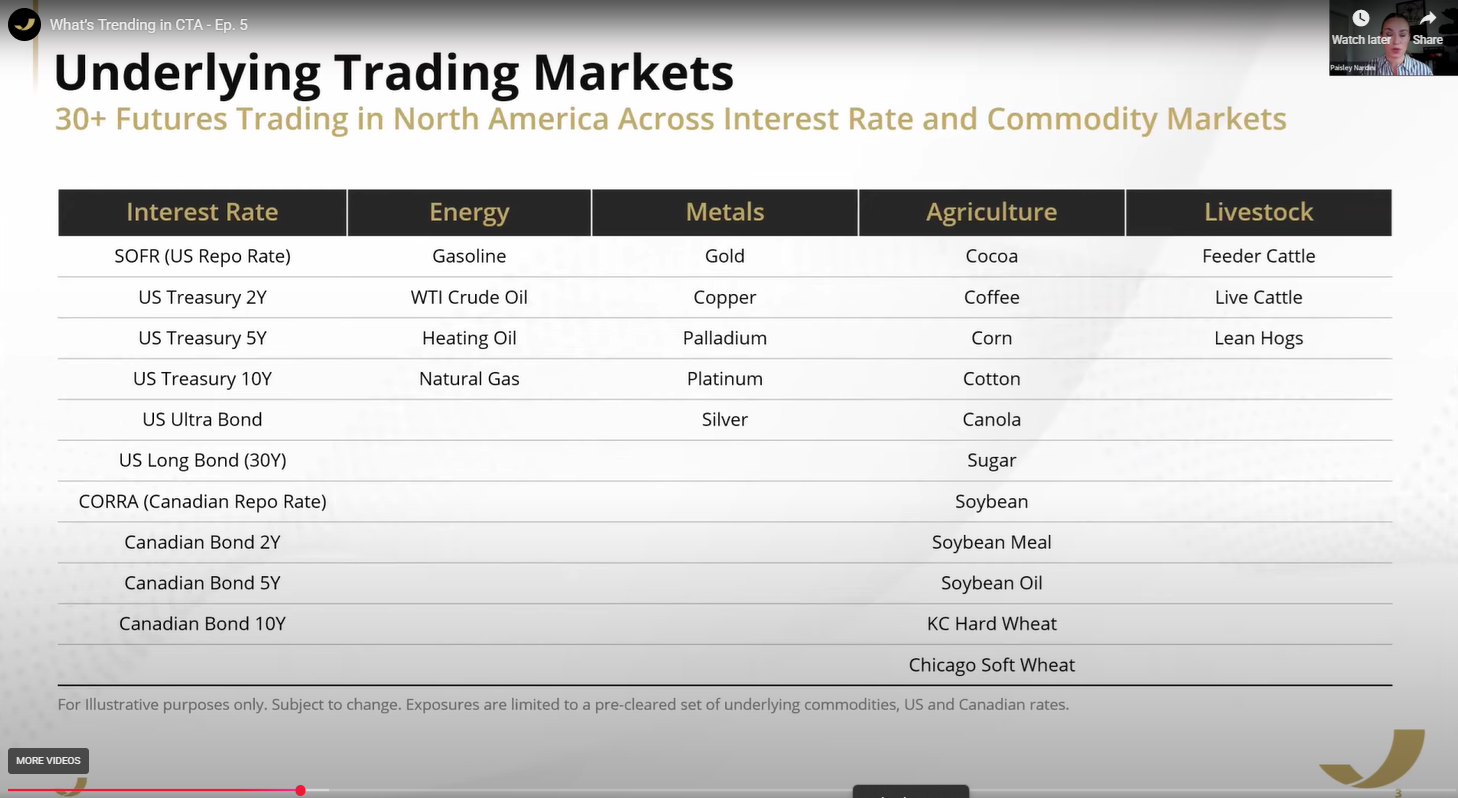
CTA focuses only on US and Canadian interest rates and commodity futures contracts and uses four algorithms to tell its rules-based systems whether to go long or short a particular futures contract and by how much.
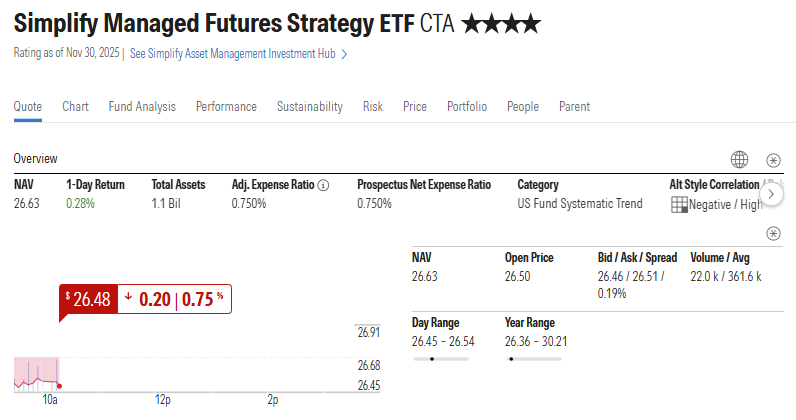
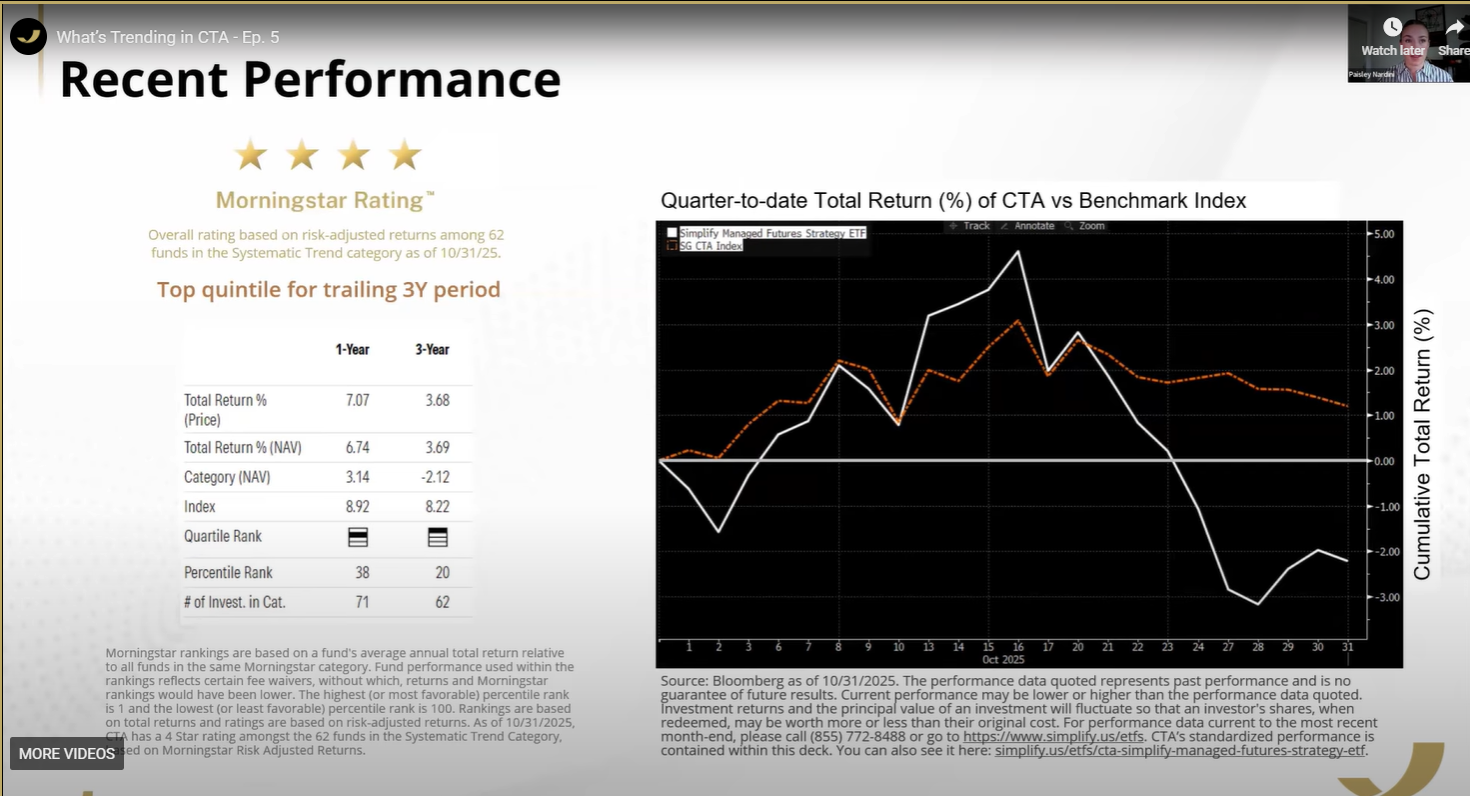
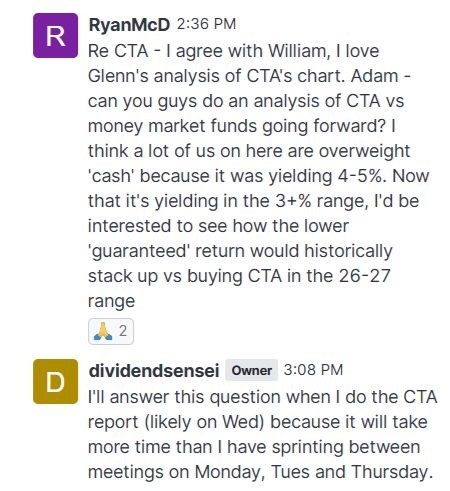
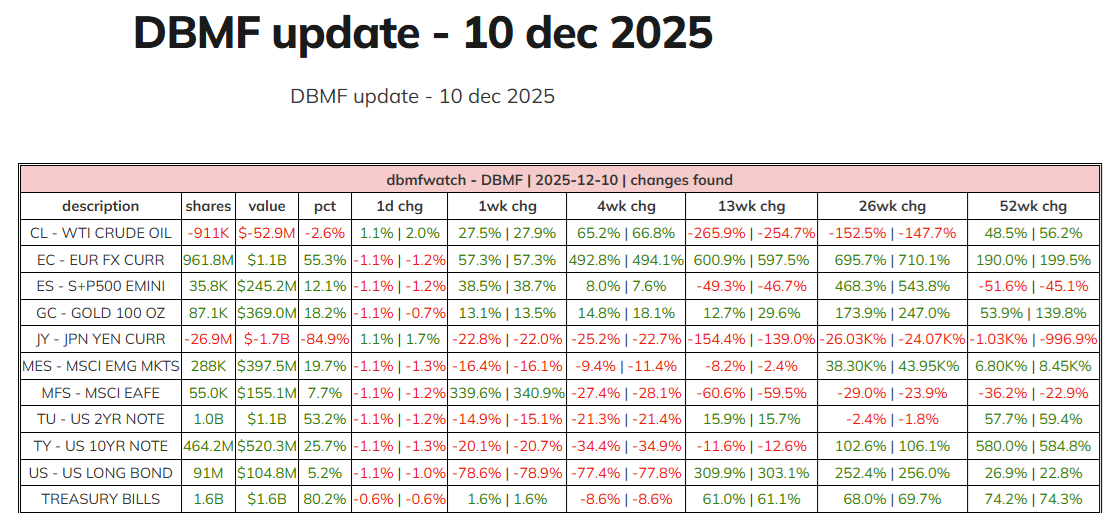
This Is What CTA Looks Like Right Now (Dec 9th, 2025)
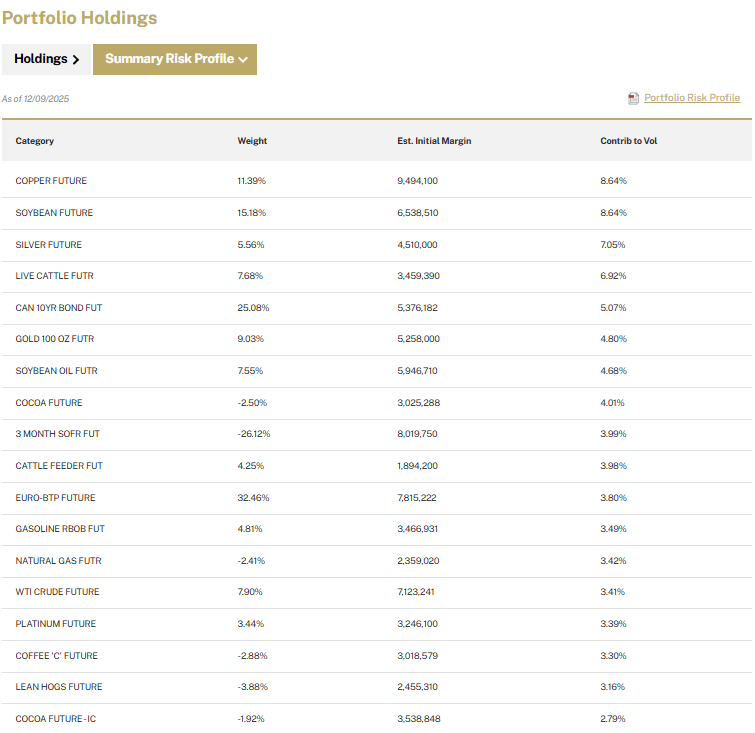
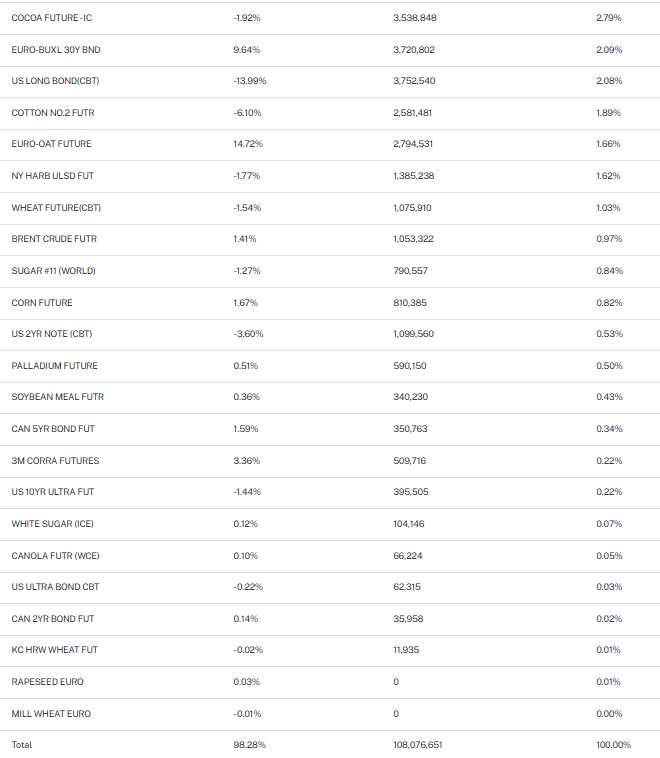
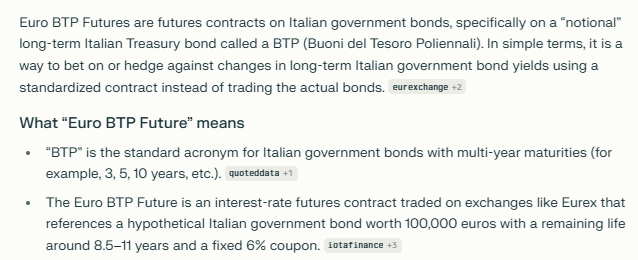
CTA has added about eight new contracts recently, including European futures for Mill Wheat, Rapeseed (Canola oil), sugar, Brent crude (international oil price), Euro Oats, and European interest rates (BTP future).
Despite a relatively bad year (up 1.8%) CTA’s overall returns are still better than peers, being in the top 38% of peers in the past year and top 20% in the past 3 years.
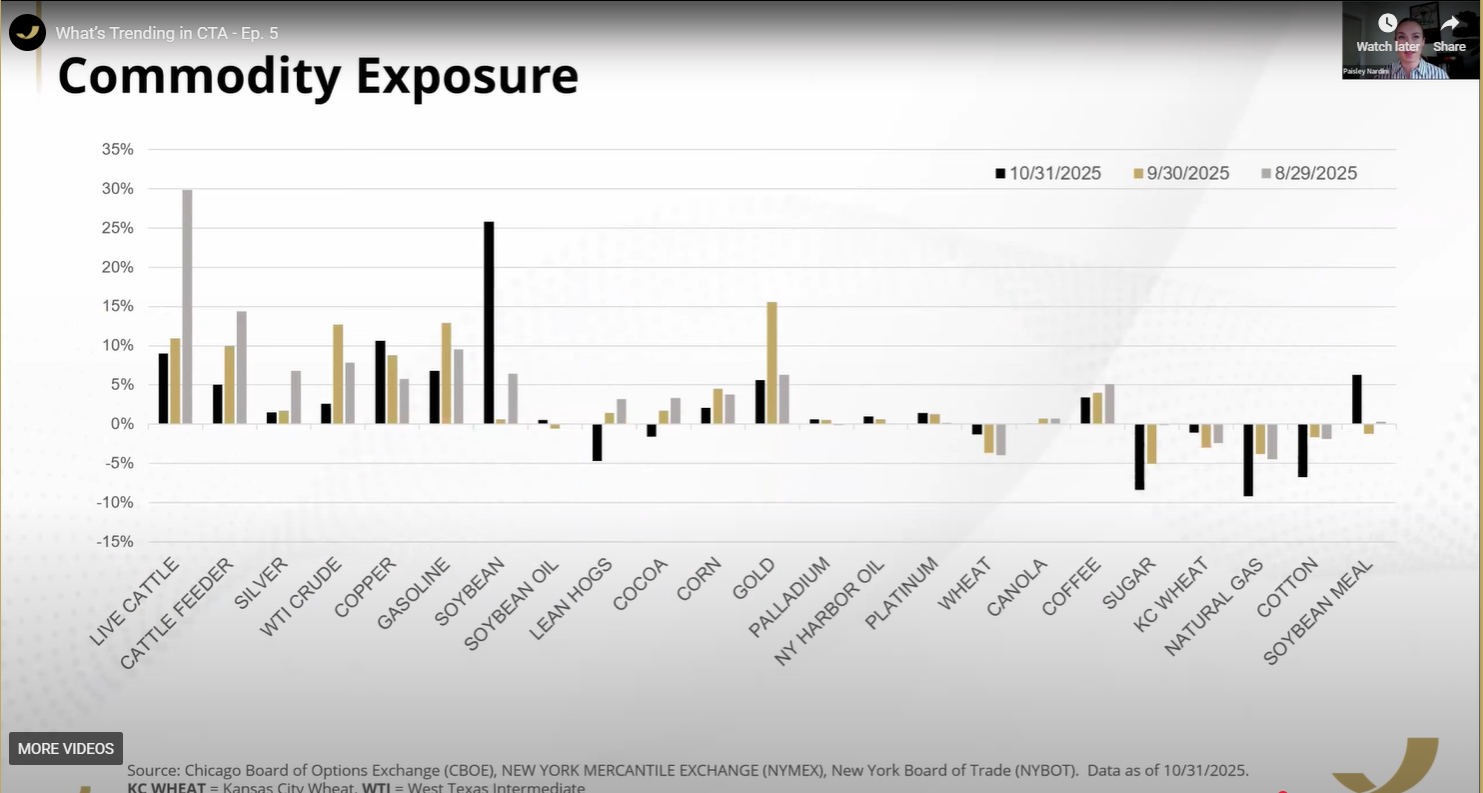
What’s Been Helping And Hurting CTA This Year?
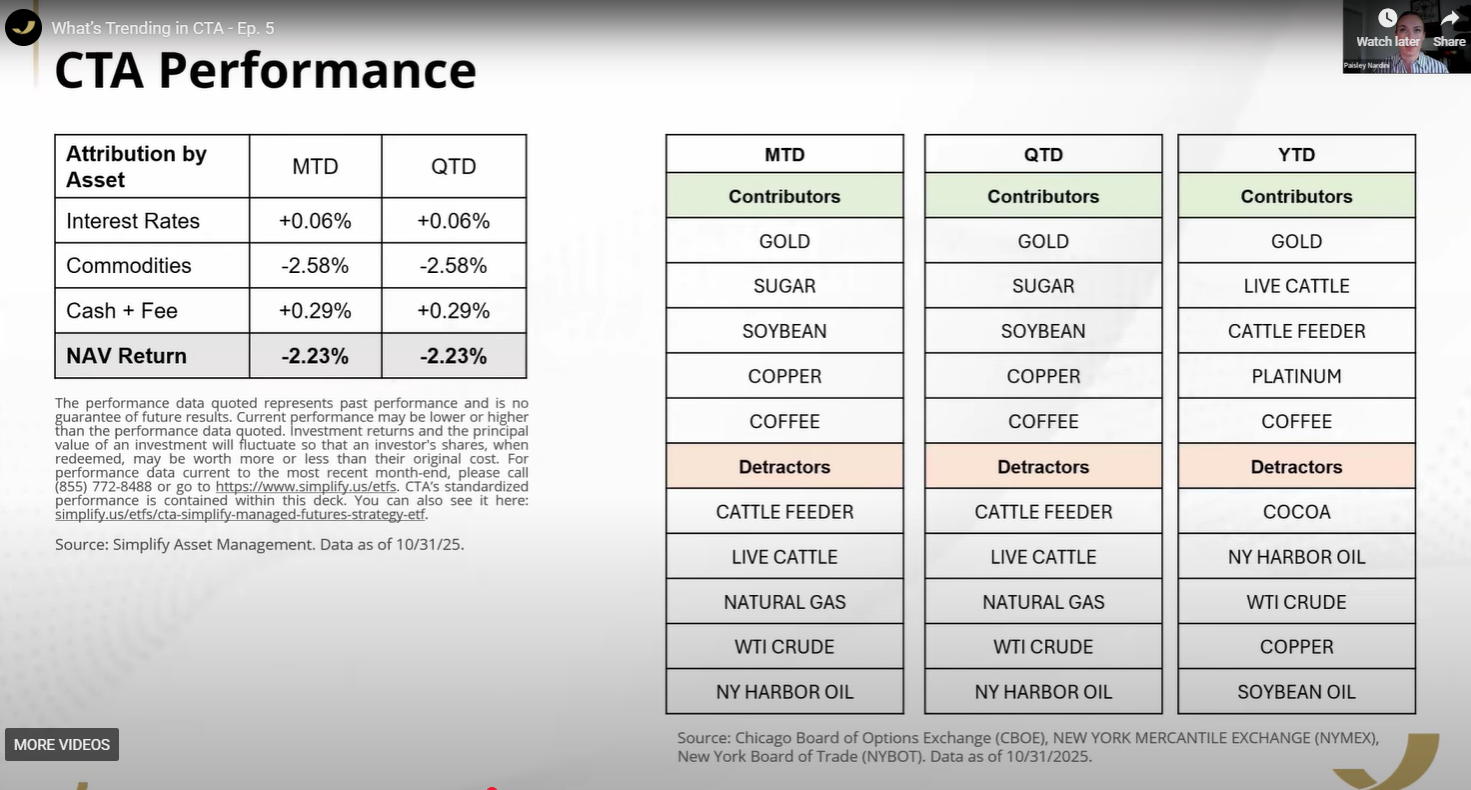
It’s been commodities that have been hurting CTA this quarter, specifically Cattle Feed, Live Cattle, and energy prices.
So why does CTA suffer more than its peers? Because it’s 50% commodities (baseline) vs 25% for most other managed futures funds.
A more concentrated managed futures portfolio will naturally be hurt more if the specific commodity trends suddenly reverse.
This year has been very volatile for commodity prices due to tariffs. For example, at one point, 50% tariffs on Aluminum were about to go into effect, and aluminum prices rallied for weeks going into the inception of these historically high tariffs. And then at the last minute, the White House announced that 90% of aluminum would be exempted, and Aluminum prices fell 22% in a single day.
You can see how, in a period of intense headline volatility, when commodity prices move like this (rather than supply vs. demand swings), an ETF like CTA (and managed futures in general) can struggle to find consistent trends to profit from.
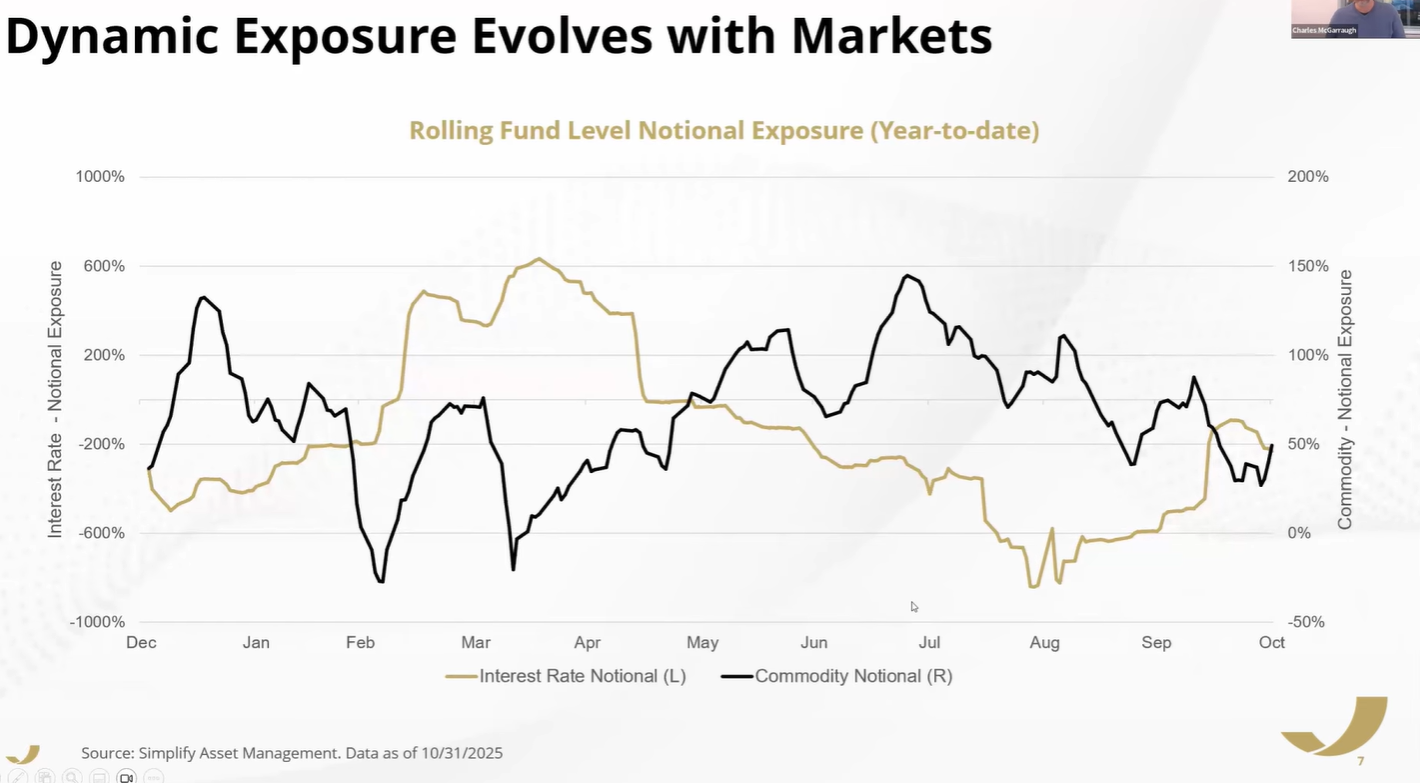
Remember that managed futures naturally include leverage (due to the use of options), and so the amount of exposure to any position can be highly dynamic.
Going into the year, CTA was very long commodities (due to strong economic signals driving up commodity prices, creating strong, clean upward trends for most commodities).
And then commodity prices reversed during the start of the trade war, and recovered going into July (the end of the 3-month pause that began on April 9th).
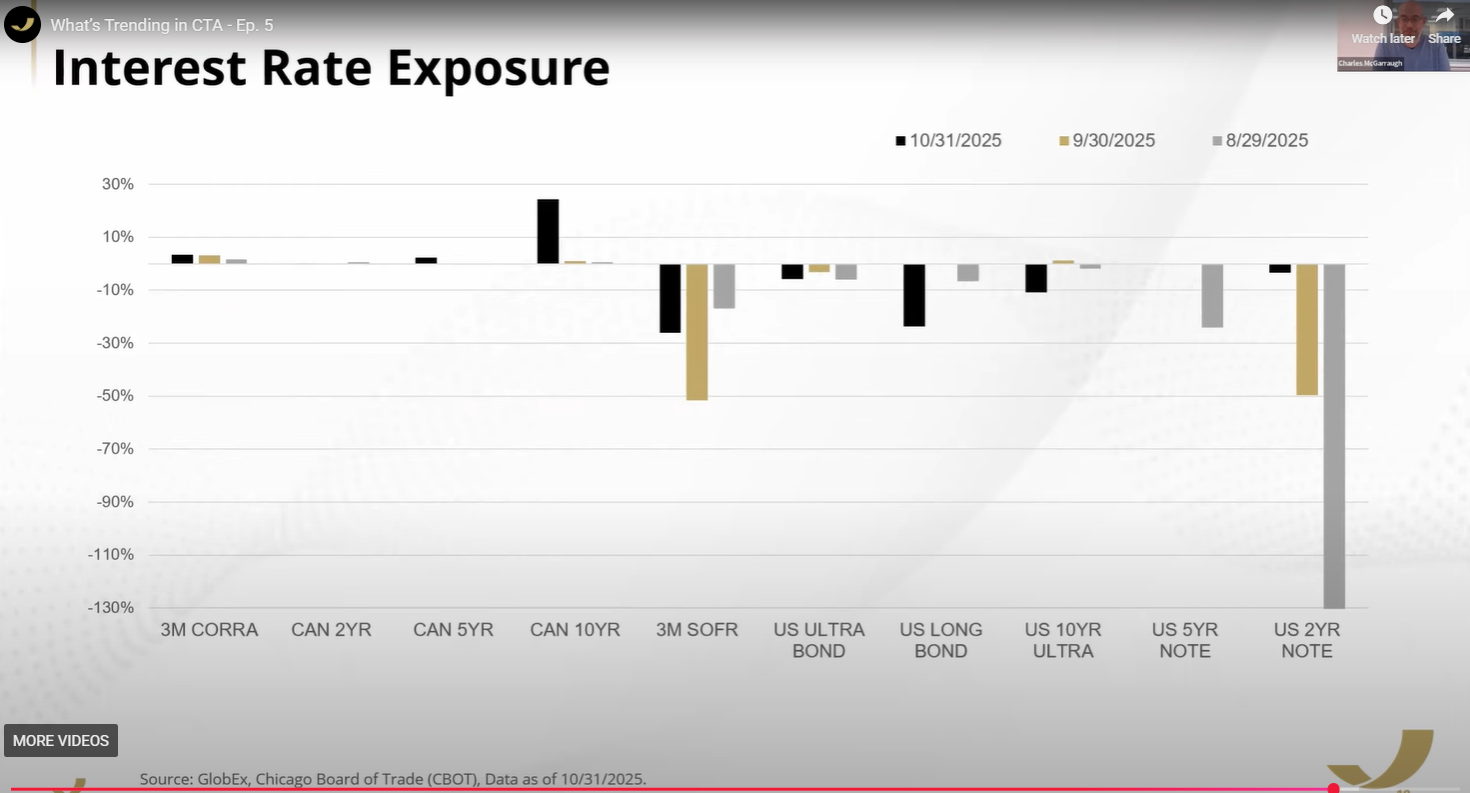
Commodity prices have been generally trending lower (largely due to energy prices falling) while interest rates spiked to about 600% exposure when CTA was hedging against a recession.
According to betting markets, recession risk peaked around 75% on April 9th.
Being long bonds ahead of a recession is a smart call (though CTA is 100% algo-driven, so no human manager is actually making any calls at all) and shows why CTA is historically a very strong hedge in a growth scare bear market.
2022 Growth Scare Bear Market
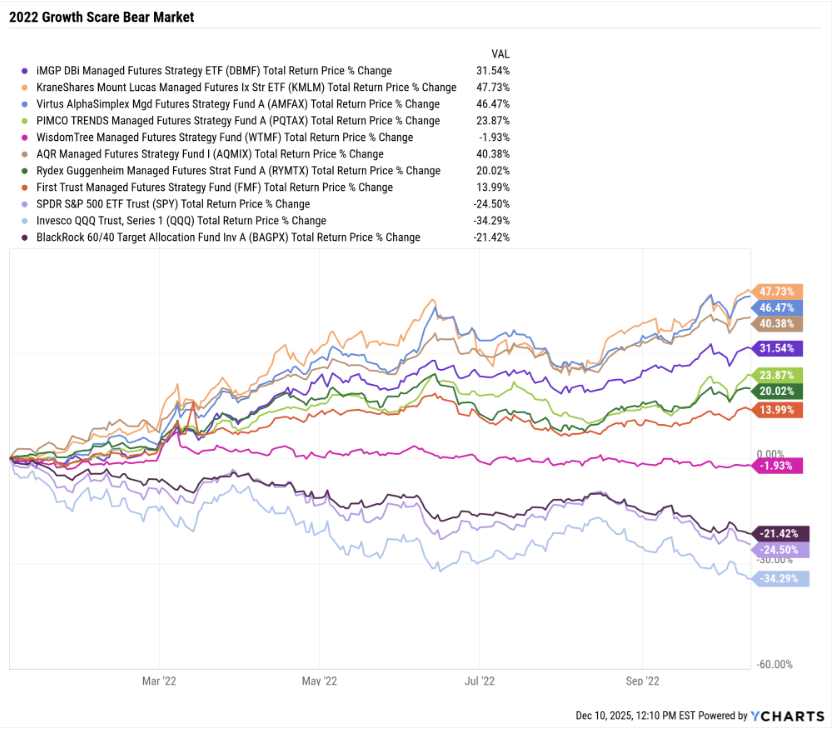
2022 Growth Scare Bear Market (CTA Inception, March 7th, 2022)
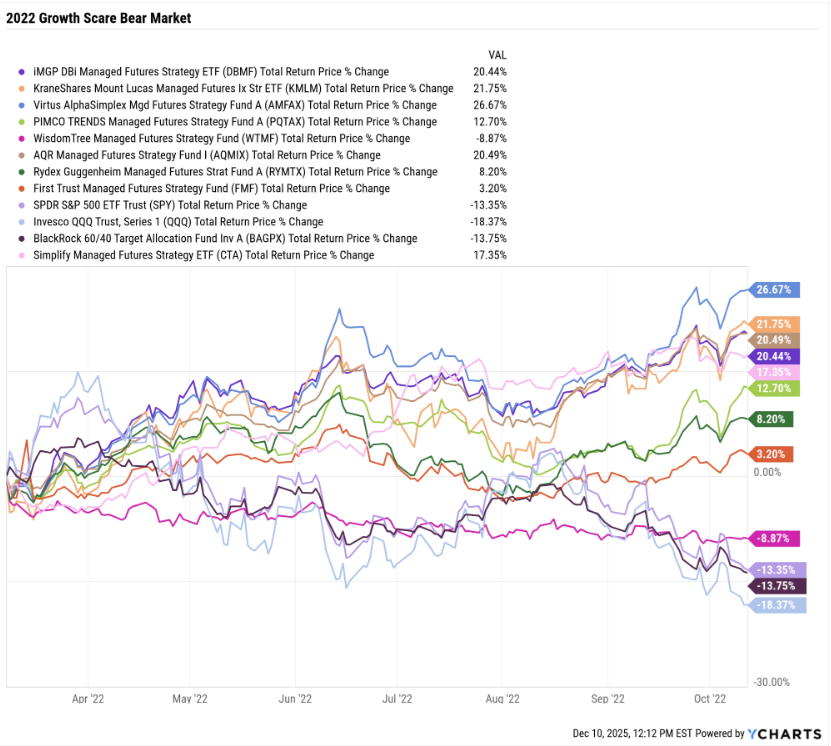
Why do managed futures do best in a prolonged bear market like we had (10 months from peak to trough)? Because that’s what allows trends to form.
Think about it. What caused the 2022 bear market? Inflation is causing the Fed to raise rates at the fastest rate in 42 years. The Ukraine invasion caused commodity prices to spike (Oil hit $130 briefly), and that also added to the inflation spike (9.2% officially max inflation in June 2022, but truflation recorded 11.6% on June 16th, 2022).
So what happened during the 2022 bear market? Bonds faced their most significant and worst (and longest) bear market in US history.
So all managed futures went super short bonds.
Commodities started the year rallying hard (Ukraine invasion), but later commodity prices reversed. BUT recession fears caused prices to start falling in unison (a new trend to follow).
In a recession? Bonds normally go up, and the US dollar goes up, other currencies fall, commodities fall, and stocks fall.
For managed futures, as long as there is a prolonged bear market of almost any kind, asset classes will synchronize and trend in logical directions.
Recession = bonds up, dollar up, stocks down, and commodities down (for example).
And that’s why the longer the correction lasts, the better managed futures do.
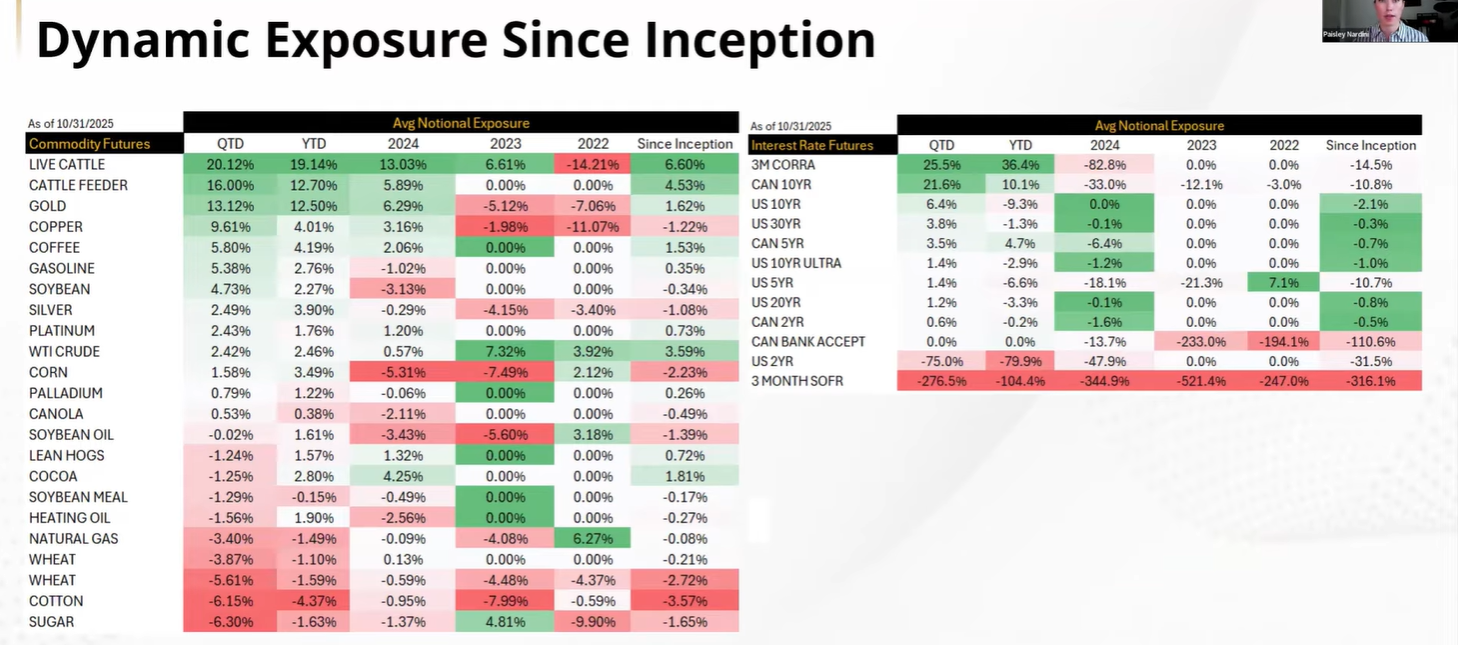
Here’s an example of how CTA has changed its exposure over time to various futures contracts. When Live Cattle went on a historic run, CTA locked onto it and, at one point, was 36% cattle and cattle feed.
And then President Trump reduced tariffs on Argentinian beef in order to lower prices, and cattle prices crashed.
Even with bond yields normalizing in recent years, CTA’s historical exposure to interest rates is slightly negative due to the historic bond bear market.
If a trend reverses very cleanly, like nat gas going into a bubble and then popping and crashing, CTA is able to go from max long (up to 30% volatility in one contract is the risk cap) to neutral in about 2 weeks and within 3 weeks it will be slightly short and within a month start to aggressively short a crashing commodity.
BUT what can sometimes happen is a tech-bubble-style price crash.
The 2000 to 2002 bear market lasted 37 months, with 7 bear-market rallies.
In other words, what happened with Cattle (which has been crashing but not in a straight line down) is that CTA’s algo has gone from max 30% live cattle to just under 10%, but the ETF hasn’t benefited from its normal fast rate of adaption.
CTA uses many trend periods, BUT they usually average an effective 2-week look-back period IF the trend is clean (no whipsaws).
The beauty of managed futures is that they are dynamic, so that, over time, as the economic and market conditions change, they change with the market. The downside is that whipsaws can happen, especially at extremes like the beginning or end of a bull or bear market in a particular commodity or interest rate.
The Downside Of Trend Following: Sometimes Trends Break Immediately
What we see in this chart is that going into the market bottom on October 12th, trends were strong, and managed futures peaked as much as +48% for some funds.
And then the market bottomed, and all trends reversed hard and fast, and so managed futures sold off.
CTA saw the smallest losses (due to the 2-week average effective look-back window, it pivots fast) and began to recover going into March of 2023.
Bonds resumed selling off due to fears about a “hot economy” and another inflation scare.
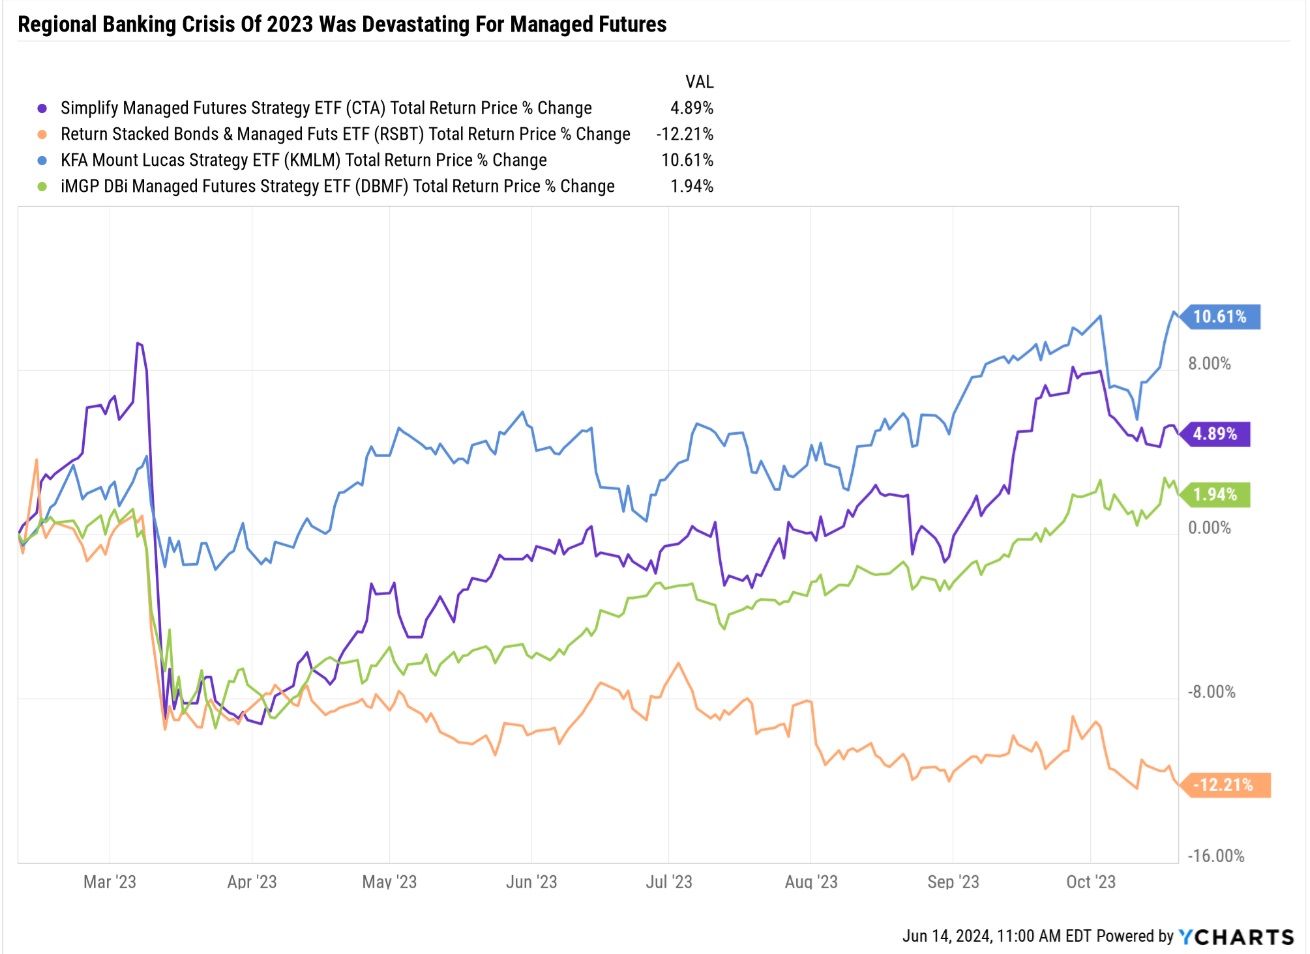
Regional Banking Crisis: Worst Week in Soc Gen CTA Index History
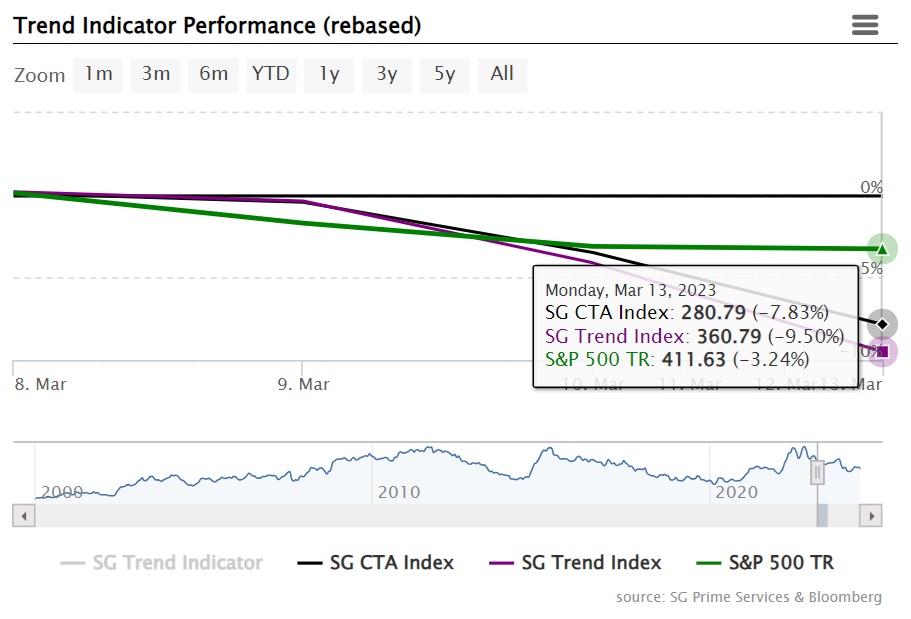
Trend followers fell 10% when the biggest bond short in history reversed overnight, AND then reversed again when concerns about contagion spreading through the economy evaporated quickly.
X Facts CTA Investors Need To Know
Gemini 3 Pro Deep Dive Report On CTA
One Sentence Takeaway CTA is functioning like "financial fire insurance"—it feels like a waste of money this year because the "house" (the stock market) didn't burn down, but its current struggle is actually proof that it is disciplined enough to protect you when the next crash hits.
Executive Summary (TL;DR)
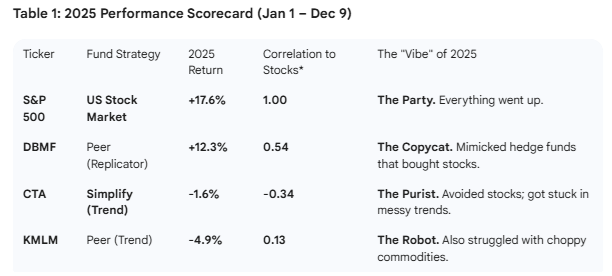
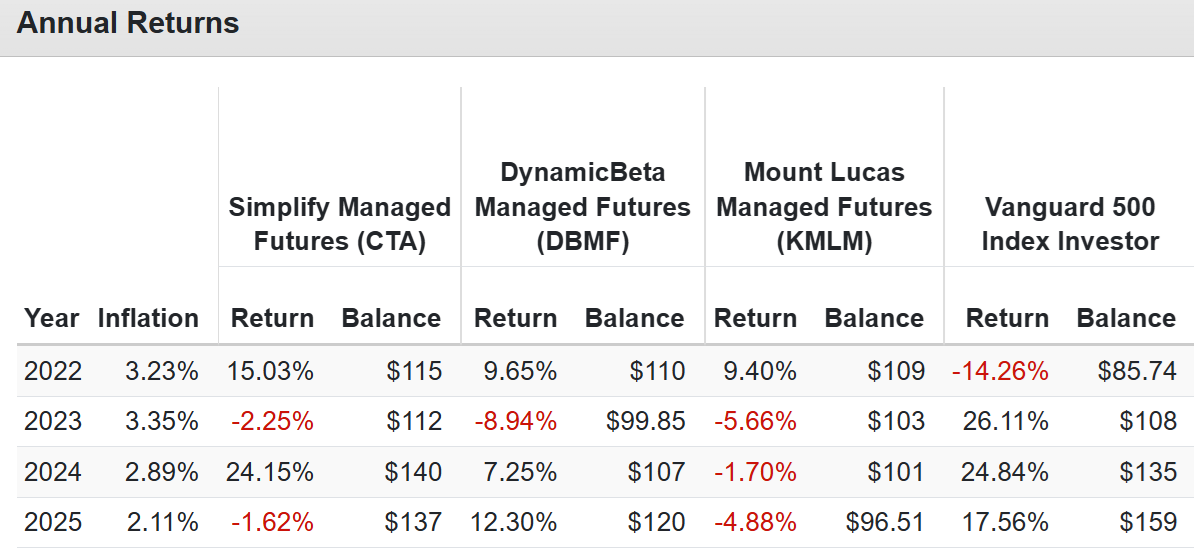
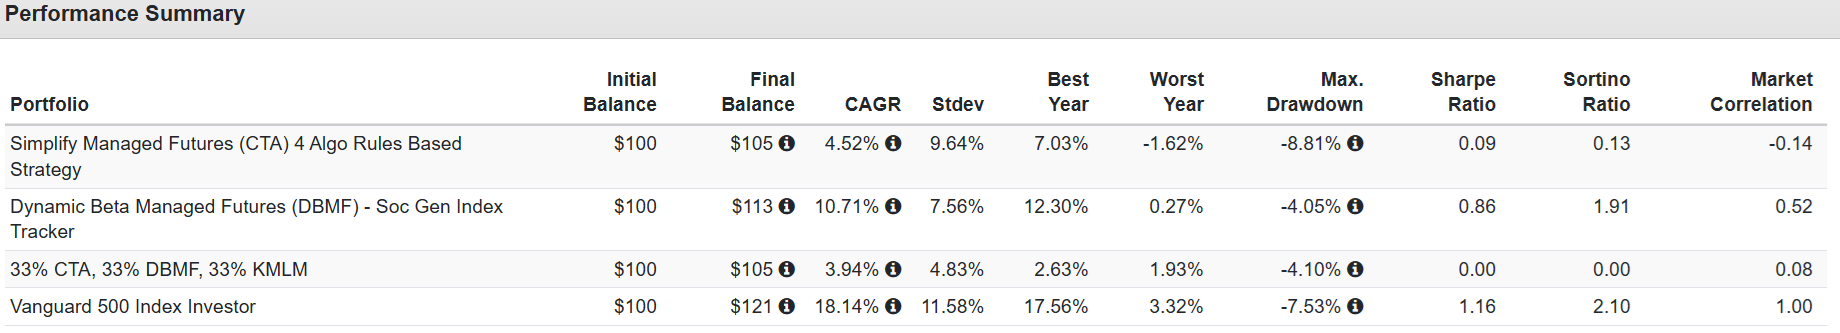
The Performance Gap: In 2025, the S&P 500 rallied +17.6% while CTA was down -1.6%. This massive gap is the primary reason the fund feels "broken" right now.
The "No-Stock" Rule: Unlike its peer DBMF (up +12.3%), CTA intentionally bans itself from betting on stock futures. DBMF copied hedge funds that rode the stock rally; CTA was forced to sit it out to stay a true diversifier.
Whipsaw Markets: Managed futures rely on sustained trends. 2025 was a year of "whipsaws" (sharp reversals) in commodities and interest rates, causing the fund to get caught on the wrong side of trades repeatedly.
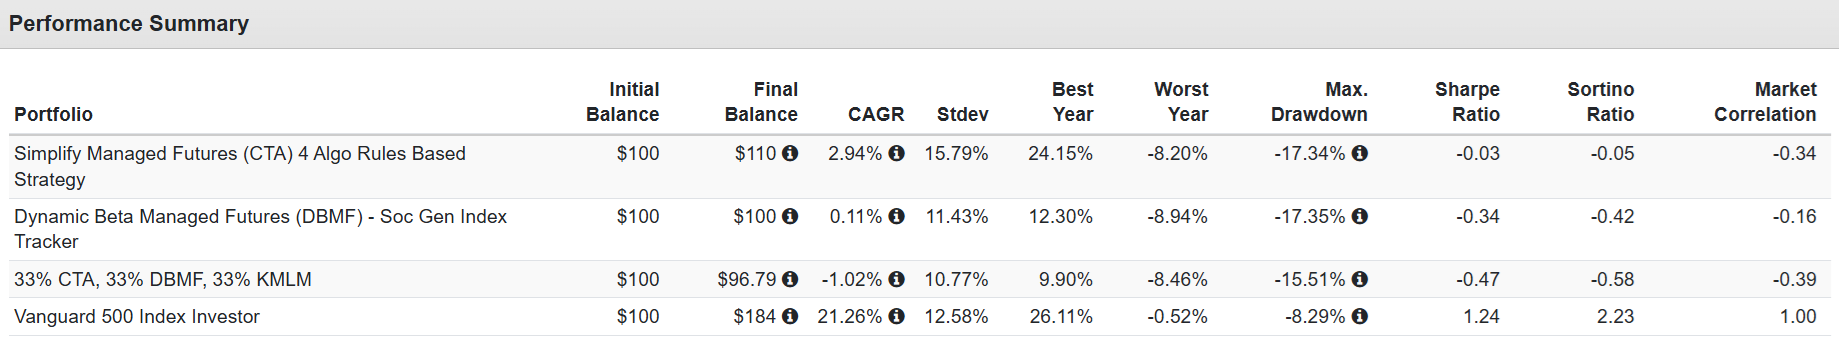
Feature, Not a Bug: CTA’s correlation to the stock market remains negative (-0.34). You paid for a fund that moves differently from stocks, and you got exactly that—unfortunately, in a year where stocks only went up.
The "Smile Curve": Academic research shows this strategy works best in extreme booms or busts. It performs worst in the "boring middle" (flat/choppy markets), which is exactly where we are today.
High Volatility: CTA is an aggressive "sniper" strategy compared to conservative peers. It swings harder in both directions, making the dry spells feel more painful.
It’s Cyclical: The strategy is not broken; it is cyclical. CTA had a massive 2022 and 2024, sandwiched between a poor 2023 and 2025.
Verdict: Selling CTA now to buy more stocks is like canceling your fire insurance policy just because you haven't had a fire in 12 months.
Deep Dive Report: Simplify Managed Futures Strategy (CTA)
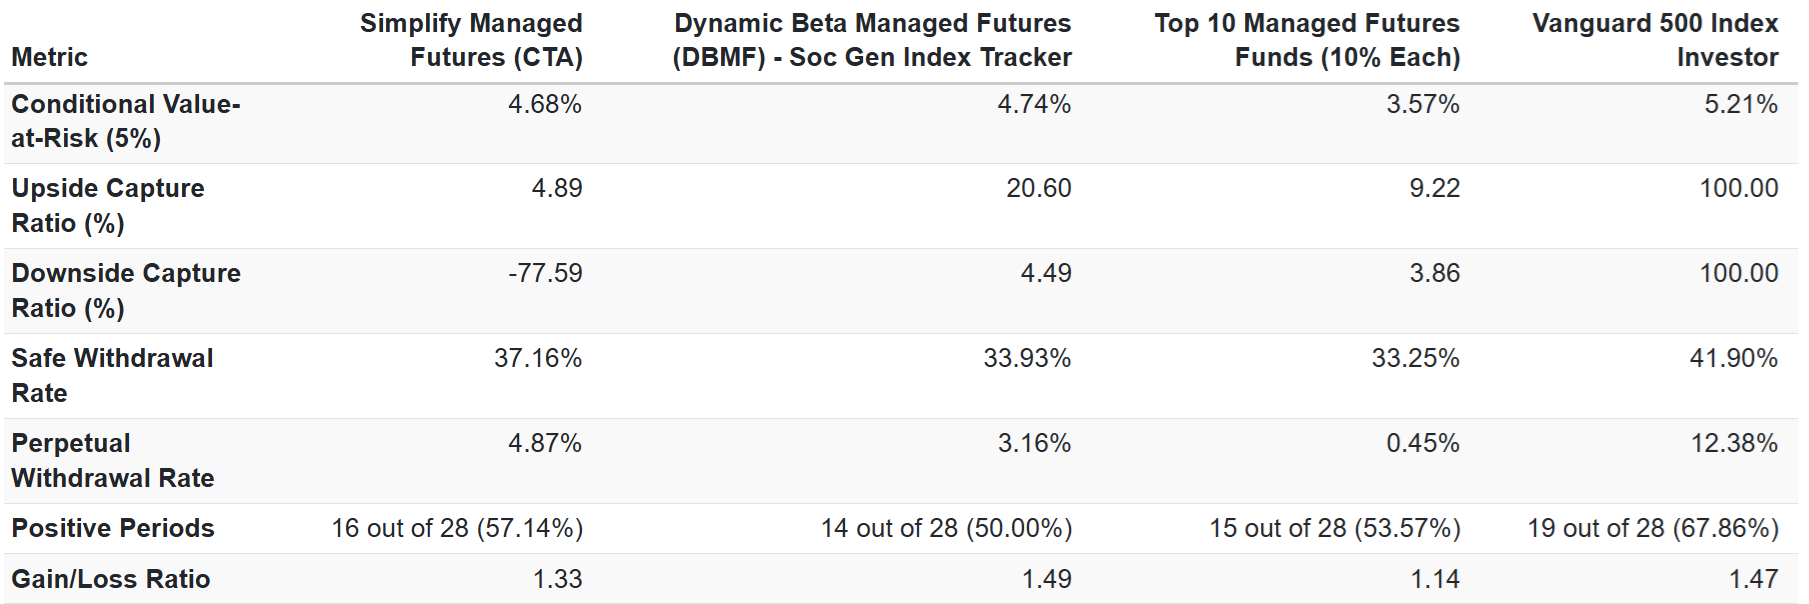
1. The Scorecard: Why It Feels Like You're Losing
If you bought CTA a year ago, you likely feel frustrated. The stock market threw a massive party in 2025, and CTA sat in the corner. The table below highlights the stark difference in performance between "The Market," "The Copycat," and "The Purist."
2. The "Smoking Gun": Why DBMF is Winning and CTA is Losing
Many investors ask, "If Managed Futures are broken, why is DBMF up 12%?" The answer lies in the holdings.
CTA is designed to be a "pure" diversifier, meaning it relies on its own strategies rather than the stock market for returns. DBMF uses a computer model to copy big hedge funds, and since those hedge funds bet on stocks this year, DBMF did too.
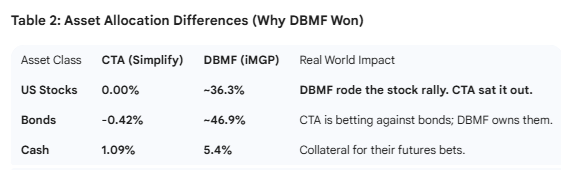
The Takeaway: CTA didn't "fail" to catch the stock market rally; it is explicitly forbidden from playing that game. It is designed to save you when stocks crash, not to mimic them when they soar.
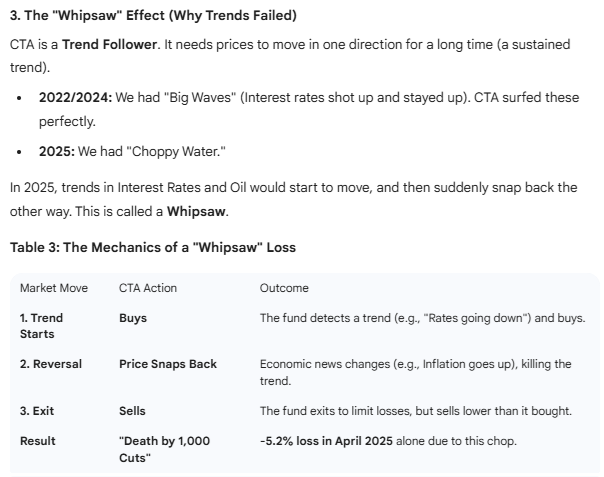
Keep in mind that in April 2025, the S&P fell as much as 21.3% at one point (peak bear market low) and as much as 12.3% in 3 days. So CTA’s really bad returns in April were still “kind of doing its job” by buffering against market downturns.
4. Is the Strategy Broken? (The "Smile Curve")
You asked if managed futures "don't work anymore." This is a common fear during flat years. Academics describe the performance of this strategy as a "Smile Curve." It makes money at the extremes and loses money in the middle.
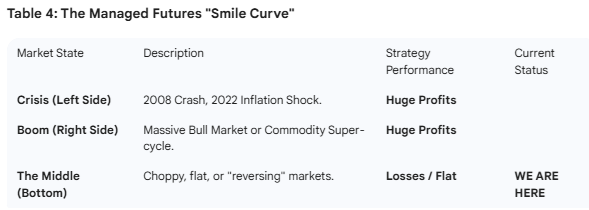
We are currently at the Bottom of the Smile. It isn't a crisis, and it isn't a massive commodity boom. It is the "boring middle" where trends start and stop quickly. The strategy is simply in the environment where it is mathematically expected to do nothing.
5. The Cycle: Zooming Out
CTA is an aggressive fund. When it wins, it wins big. When it struggles, it looks terrible. If we zoom out just three years, we see that this year's struggle is just part of a normal seesaw pattern.
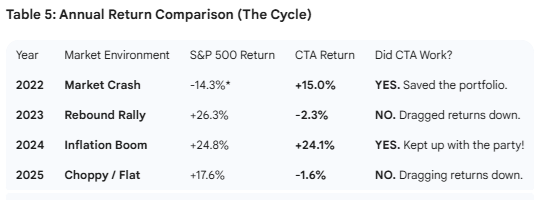
*2022 Returns are partial year (April–Dec) since CTA inception.
Takeaway: The fund isn't broken. It performed exceptionally well just last year (2024). The current flat period is likely "noise" common to this specific strategy, rather than a permanent failure.
6. Risk Profile: Is It Too Dangerous?
CTA is designed to be more aggressive (higher volatility) than its peers. This means when it loses, it looks uglier than conservative funds, but when it wins, it wins bigger.
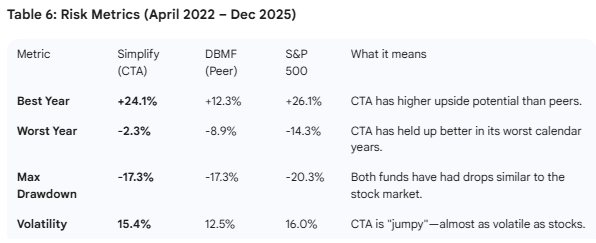
Final Verdict: The flat returns are the cost of doing business. If you sell CTA now to buy stocks, you are selling the only asset in your portfolio that will likely go up if the market crashes in 2026.
7. Is CTA A Good Cash Alternative At Its 52 Week Lows? Is It A Good Trading Vehicle?
I don’t recommend CTA ever be a “cash alternative” in the sense of "putting your emergency fund into it because it’s designed to be as volatile as stocks, BUT at different times and non-correlated (but inversely correlated in bear markets).
In other words, in normal times, on any given day, CTA is non-correlated to stocks, which means that during regular, run-of-the-mill corrections, CTA might not go up.
-68% downside capture ratio = “on average, if the market is falling CTA is up 68% as much as the market is falling”
But remember, “A 6-foot man can drown crossing a river that’s 3 feet deep on average.”
Cash equivalents like money market accounts or high-yield savings accounts that are FDIC insured (or T-bills) are now the same as CTA.
8: What About The Technical Analysis? Trading CTA?
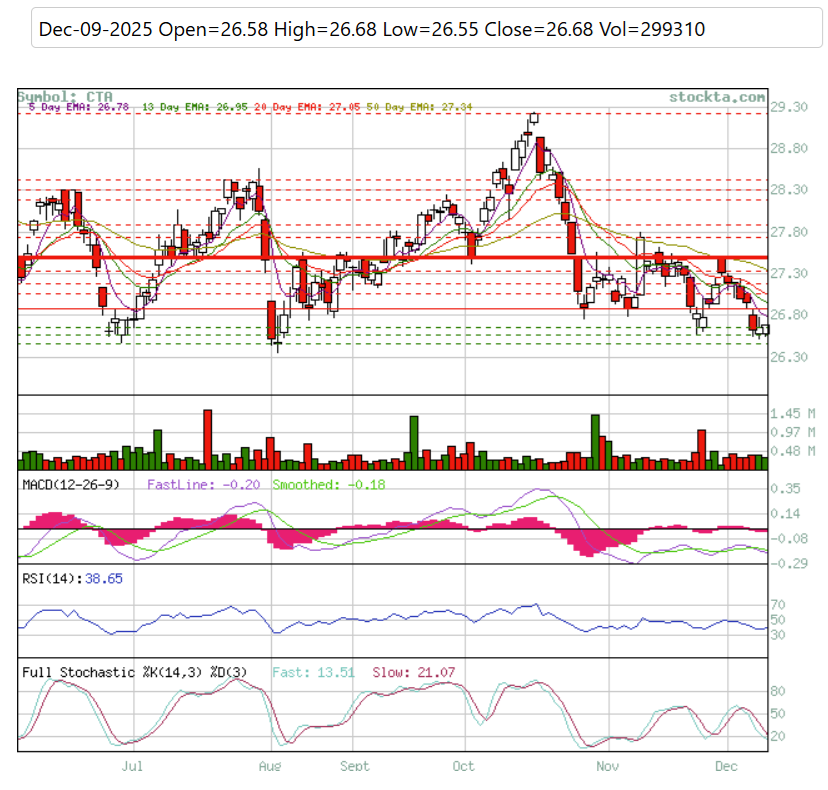
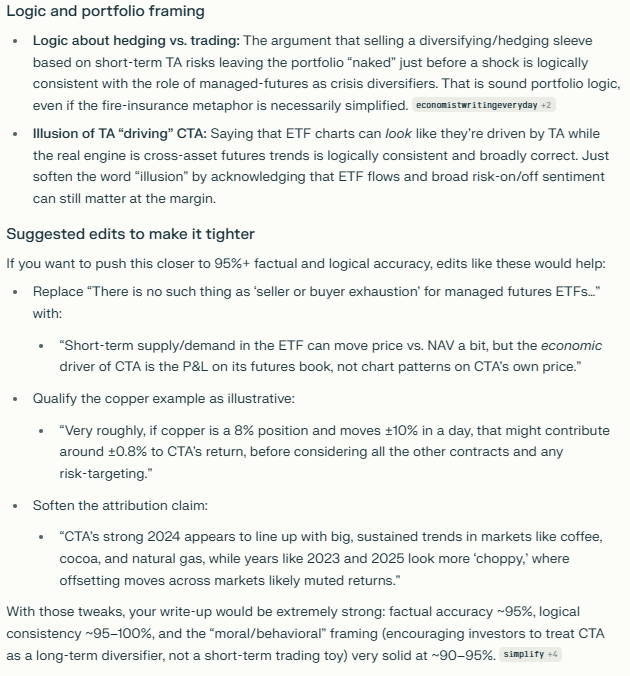
If you look at the basic technicals for CTA, they don’t look good, though the stochastics are indicating potential seller exhaustion.
Currently, the technicals look very ugly on CTA at the low end of its 52-week range.
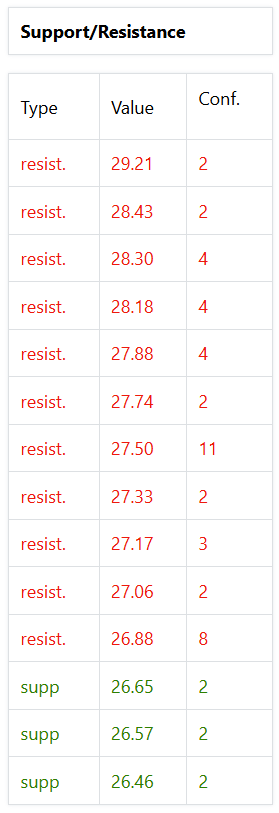
The technicals might seem like trading algos are going to sell CTA BUT that’s not how managed futures ETFs work.
There is no such thing as “seller or buyer exhaustion” for managed futures ETFs because the value of the stock goes up or down based on the value of its underlying options.
If Copper has a -10% day or a +10% day, with 8% exposure, CTA would go up or down by 0.8% that day on copper prices alone. There is no such thing as “sellers are going to step in and cap the price at $26.88 because trading algos will sell CTA due to resistance levels”.
If copper, gold, or oil prices move in a certain direction, CTA will go up or down, based on its rules-driven algos, which position it across 30 different rate and commodity futures contracts. Technicals might LOOK like they are driving CTA (or any managed futures fund), but that’s an illusion.
CTA has a blockbuster year in 2024…not because it was a “hot” momentum stock but because it was driven by strong trends in Coffee, Cocoa, and Natural Gas prices, all going up in a sustained manner (and prices of sugar and wheat were declining steadily).
When trends are lined up and not cancelling each other out, you get a strong year like 2022 and 2024, and when there is a lot of chop, it’s a flat year like 2023 or 2025.
Trading in and out of CTA to try to make a few % points completely ignores the issue of hedging, why you own it in the first place.
What if you are out of CTA because the technicals SEEM to say you should be (like at $30 share price)? And then suddenly we get a Ukraine invasion, like a shock and a sustained correction and growth scare?
Now your portfolio is naked, and you’ve basically cancelled your fire insurance right before a fire, because you were trying to get a discounted premium on your policy.
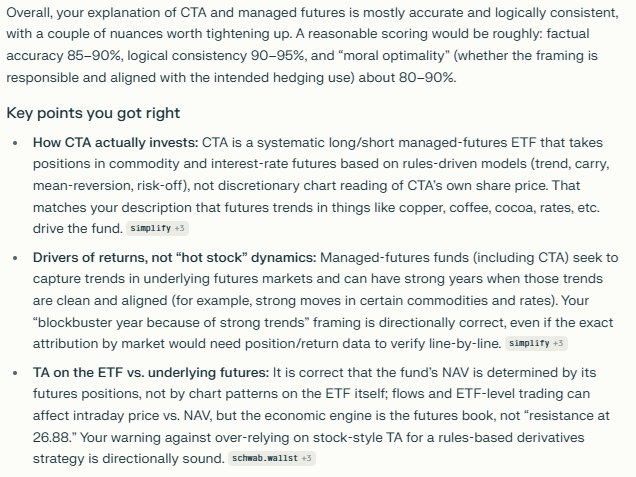
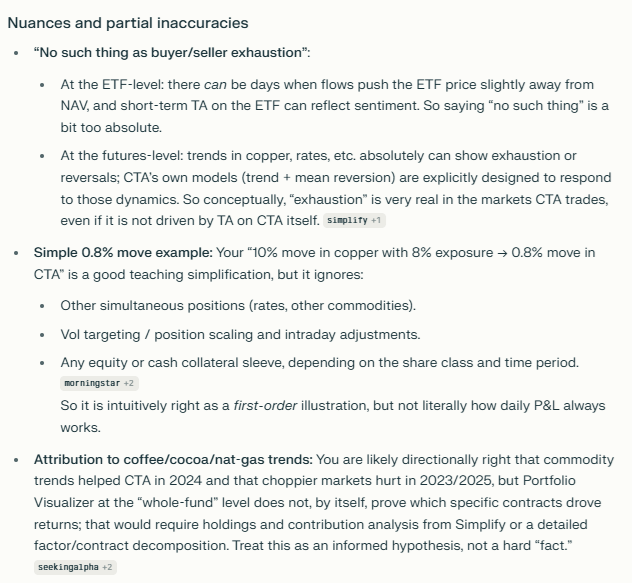
Factcheck: Because I Can’t Afford to Be Wrong (For Long)😉
9: What About Hedging Your Hedges By Diversifying Into DBMF + CTA?
There are two reasons I can think of for combining a CTA with a peer like DBMF, which uses additional asset classes such as stocks and currencies.
DBMF is designed to track the Soc Gen CTA index (not by owning the exact positions, but by replicating the weighted-average holdings of all 20 funds in the index).
So right now, DBMF estimates that the “managed futures industry” is neutral crude, long the Euro vs the Dollar, long the stock market, long gold, very short the Yen, very long emerging markets, slightly long global stocks, and long bonds.
Keep in mind, this doesn’t show the % portfolio volatility because different contracts have different volatilities and are leveraged at different levels.
What might be a benefit of combining CTA with DBMF? Two ideas come to mind.
What if the AI boom causes stronger earnings growth and we get a 1950s’s 1950s-style 20% CAGR decade-long boom? Wouldn’t it be worth it to have some trend following exposure to that?
After all, CTA is non-correlated and can drag a portfolio negative even in a strong market, so if you need to pay the bills (like I do with GNG), then a strongly performing managed futures ETF like DBMF might be useful.
The other potential idea I’ve heard? “In the era of Trump, when headlines move on a tweet, CTA specifically or managed futures in particular might no longer work.”
Let’s address these two proposals by looking at actual data, rather than philosophically debating hypotheticals.
“AI Proofing” A Hedging Bucket With DBMF + CTA
This is the most intuitive reason that I can think of to diversify a hedging bucket into something like this:
25% DBMF (4 asset classes, long or short)
25% CTA (2 asset classes long or short)
25% growth stocks (long only)
25% value stocks (long only)
This portfolio would result in 4 asset classes that act like five and, THEORETICALLY, could deliver more consistent returns when CTA is struggling (like 2023 or 2025).
OK, but what does the actual data say?
Everything sounds good in theory until you put it to the test.
Since April 2022 (Age Of AI)
The results in terms of total returns are similar, with slightly lower volatility, BUT the peak declines and worst years are not actually improved.
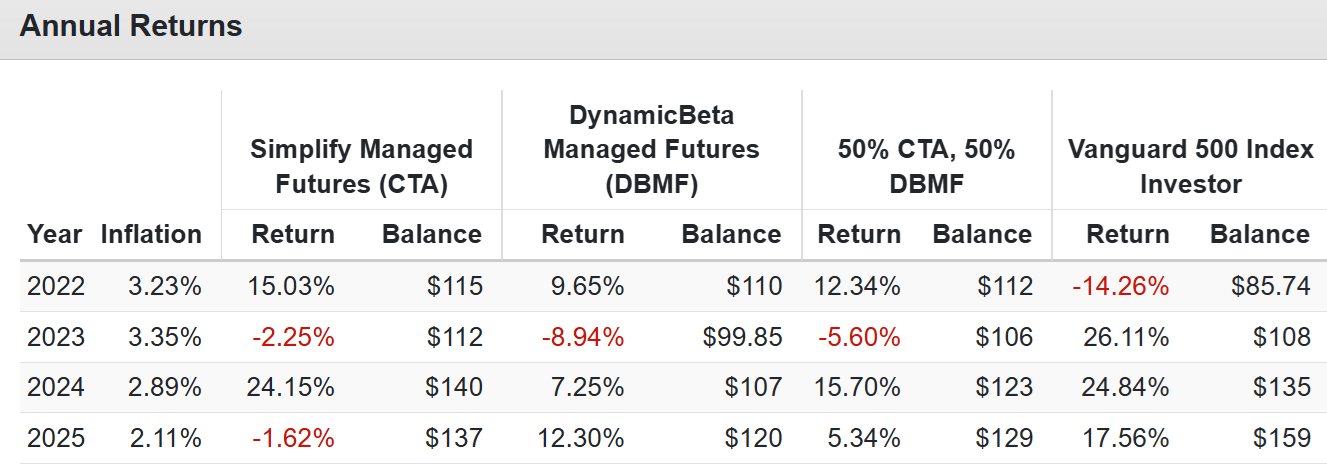
2023 was a bad year for managed futures, and so was 2025. You can see that, in 2023, the strategy of diversifying into DBMF (to gain stock trend-following exposure) wouldn’t have helped, though it did in 2025.
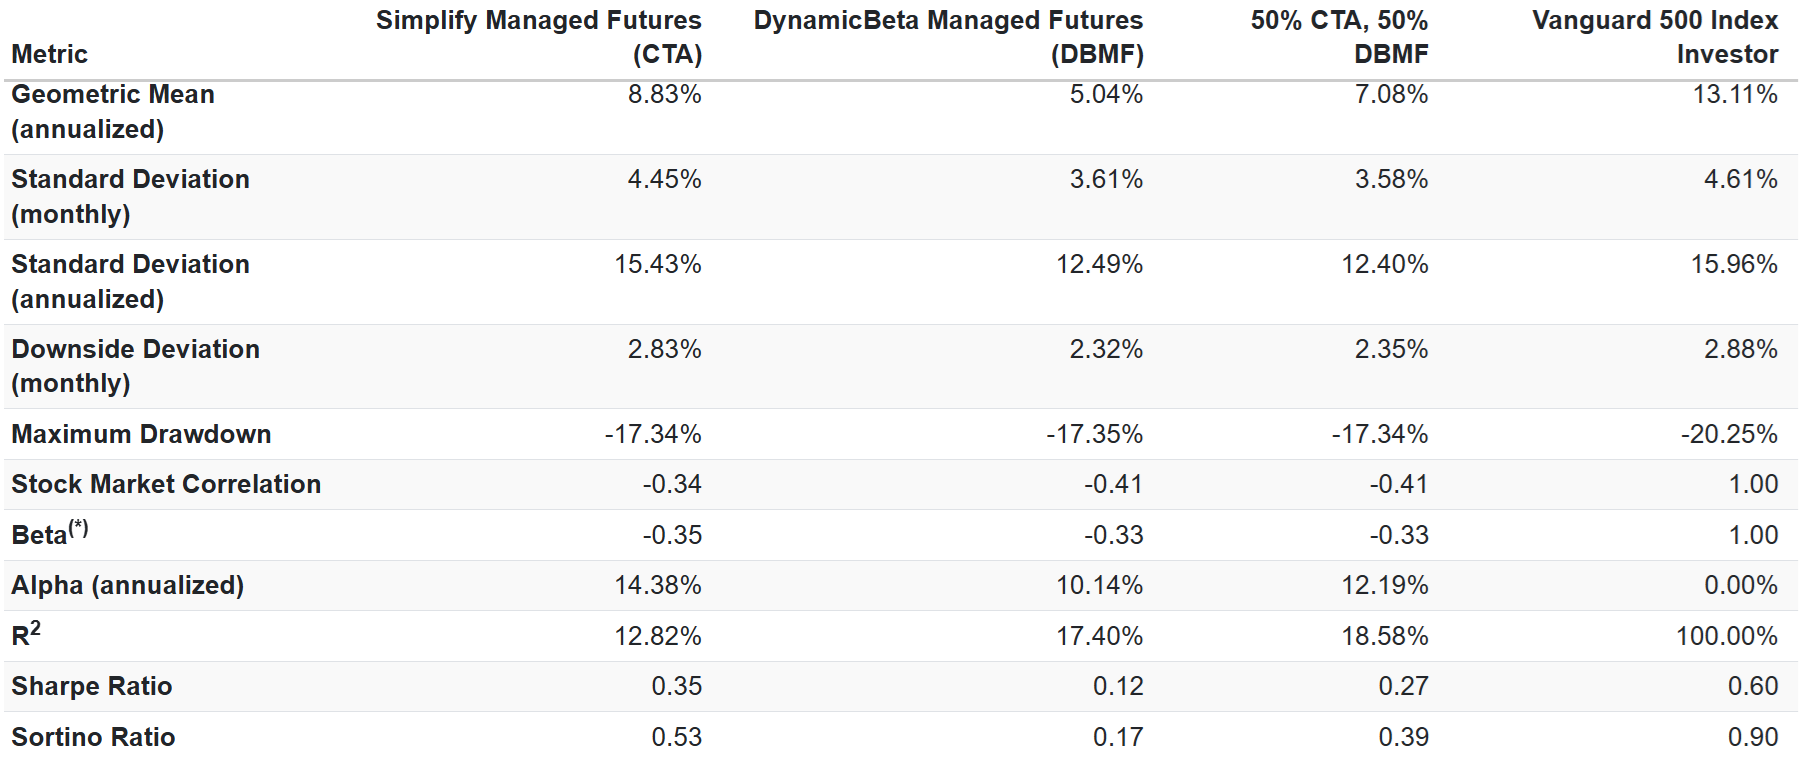
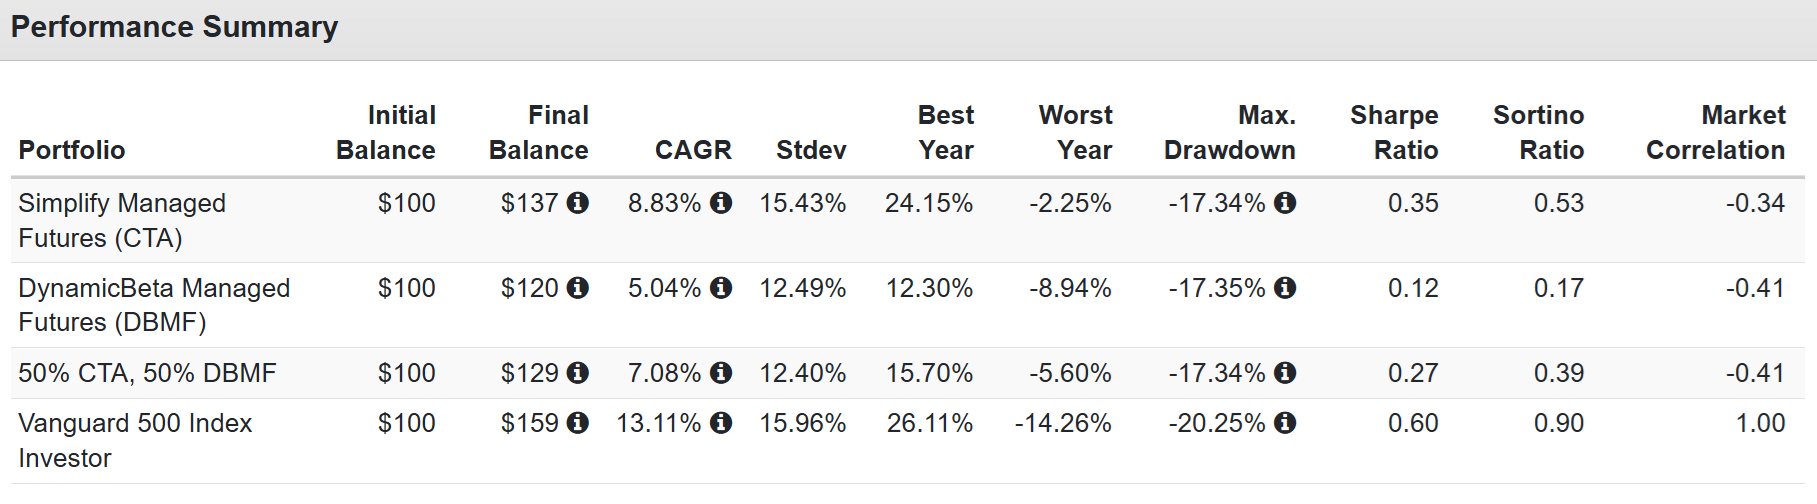
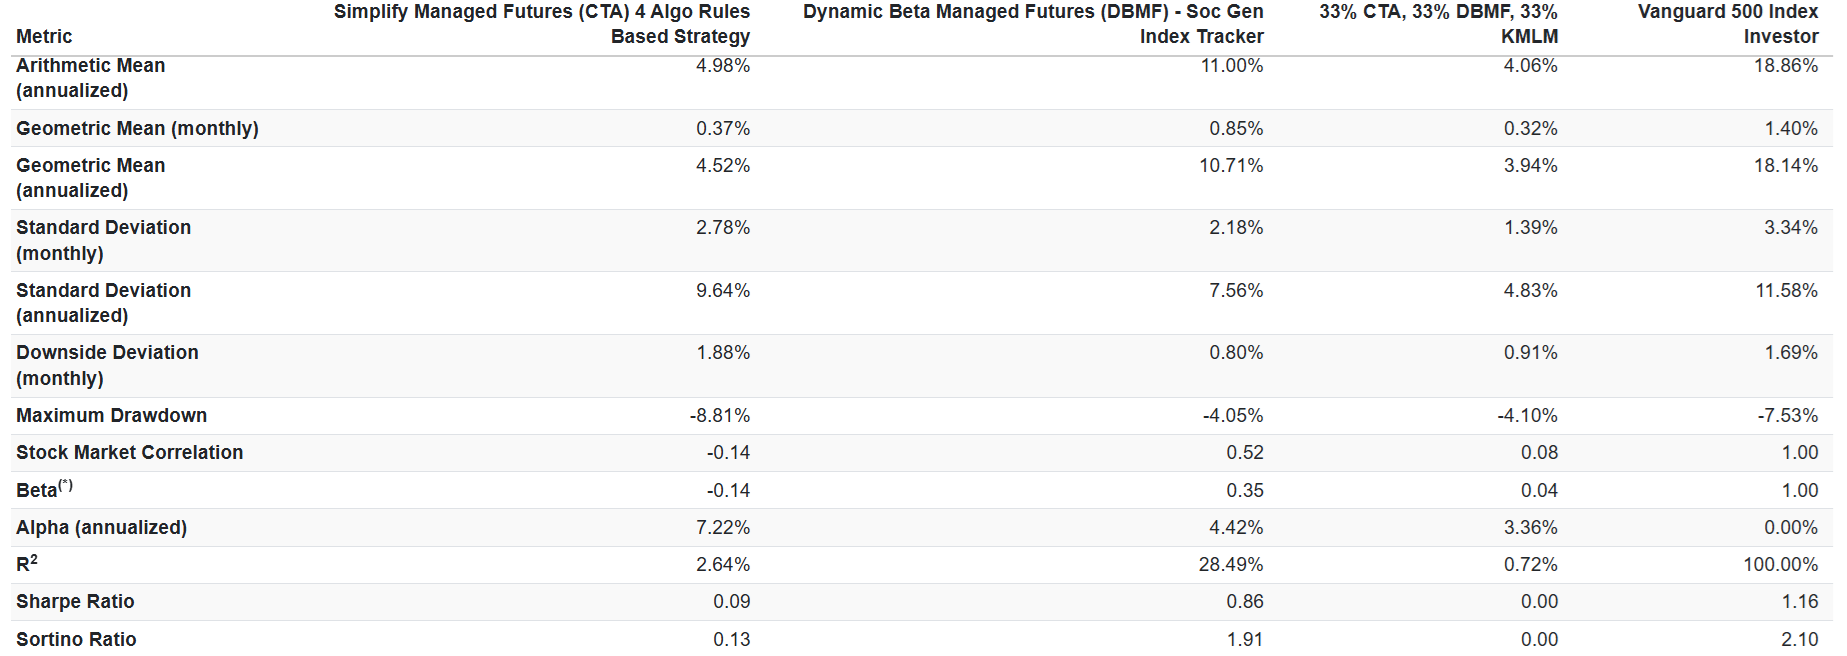
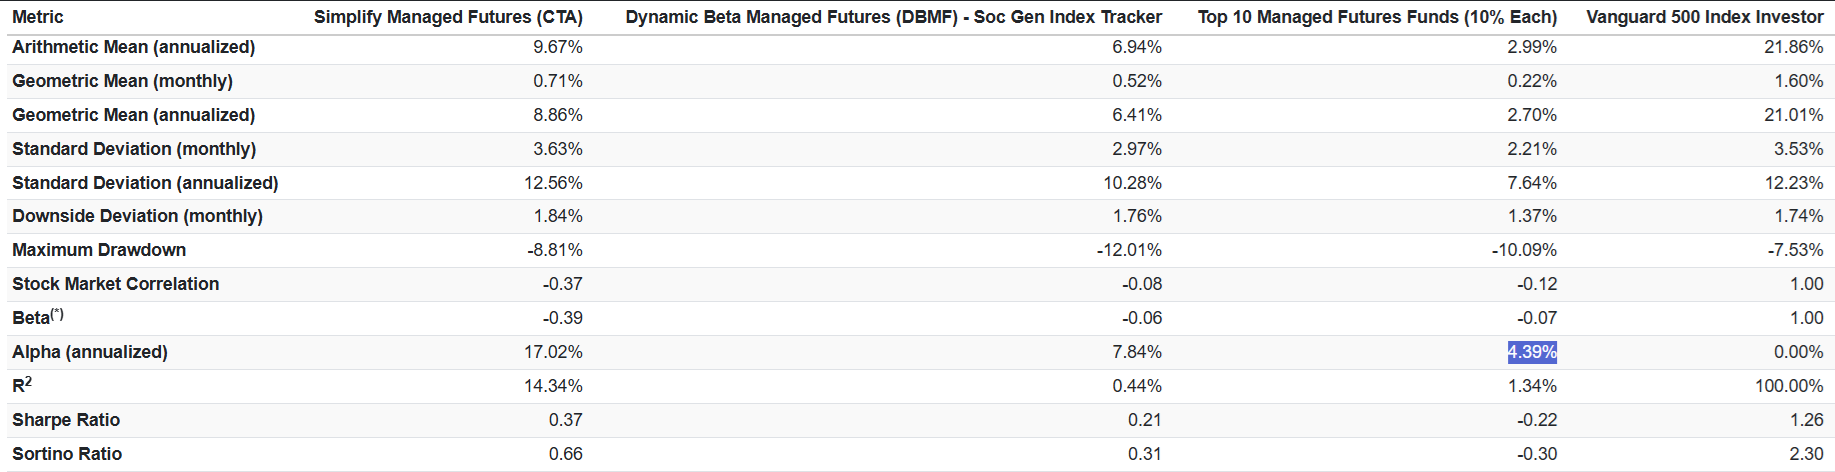
Alpha is volatility-adjusted returns vs the S&P, and you can see that CTA has outperformed DBMF and thus the volatility-adjusted ratios like:
Sharpe Ratio: Total return/volatility.
Sortino ratio: total return/negative volatility.
Calmar Ratio: total return/peak decline
CTA has historically beaten DBMF on volatility-adjusted returns, so diversifying with DBMF didn’t actually help in the age of AI.
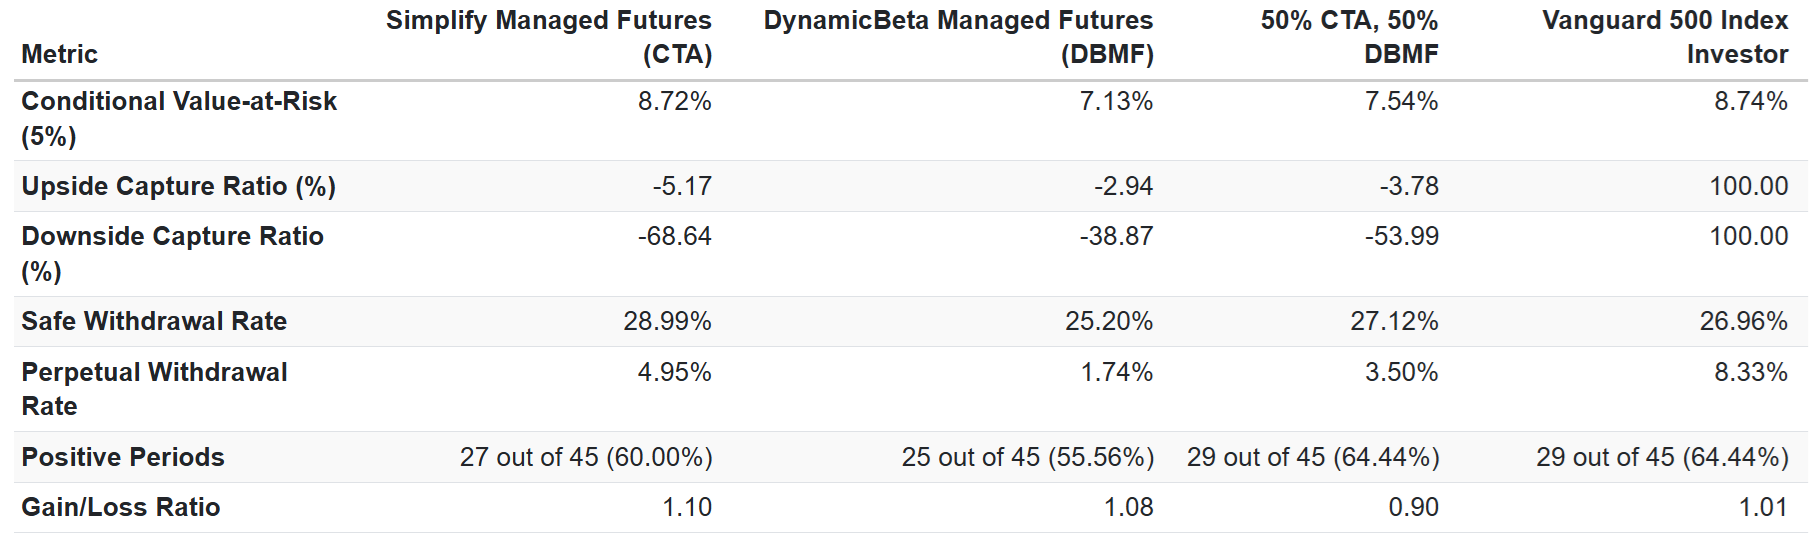
As far as improving the negative downside capture ratio, CTA + DBMF is pretty good, AND it does improve the % of positive returns slightly.
But as far as improving returns or hedging power or results? There is no evidence that adding DBMF is anything more than “De-worsification”.
OK, But What About A 3 ETF Hedging Bucket?
AQR Managed Futures is the #1 performing Managed Futures ETF, so what if we were to add that to the hedging bucket?
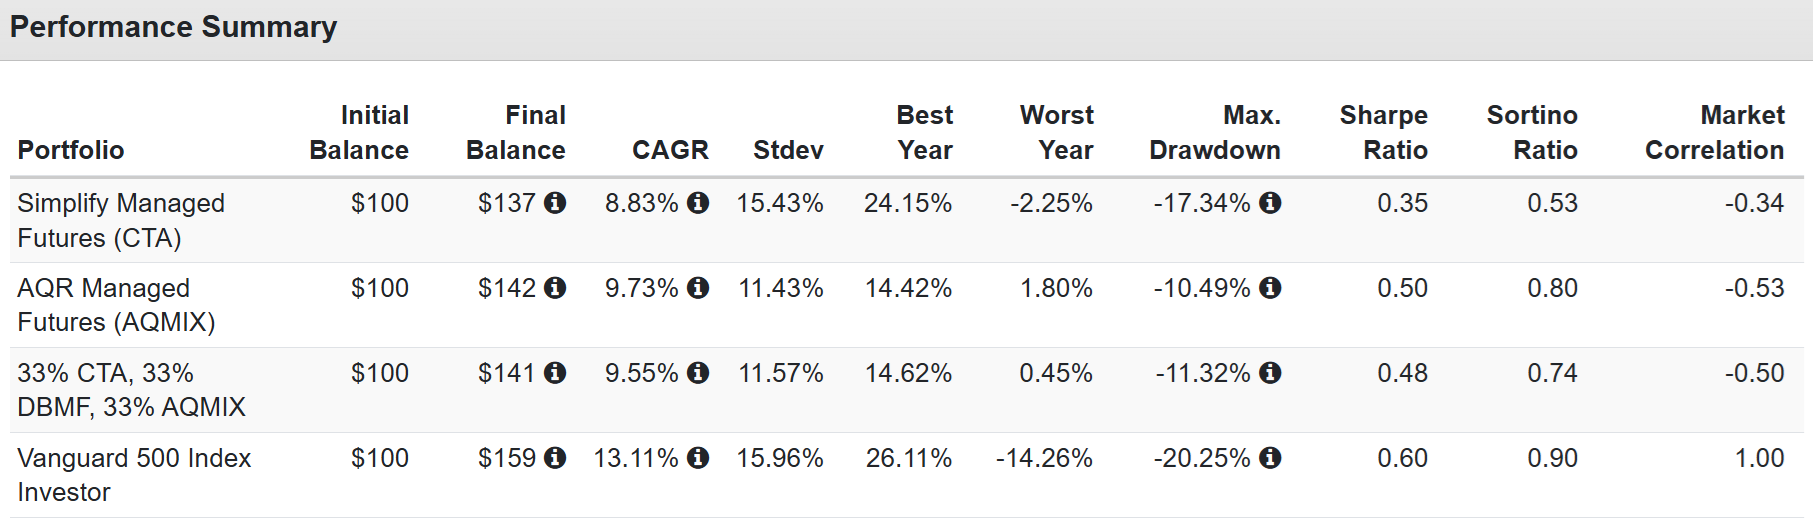
Yes, that would theoretically have improved the hedging bucket over CTA itself, BUT there is a major problem with that. AQR is a very expensive (2.25% expense ratio) actively managed mutual fund.
In other words, it’s not a systematic strategy ETF; it’s active managers, and what do we know about active management?
Beware Performance Chasing
Persistence of returns means whether a fund manager is skilled or lucky.
Since August 2010
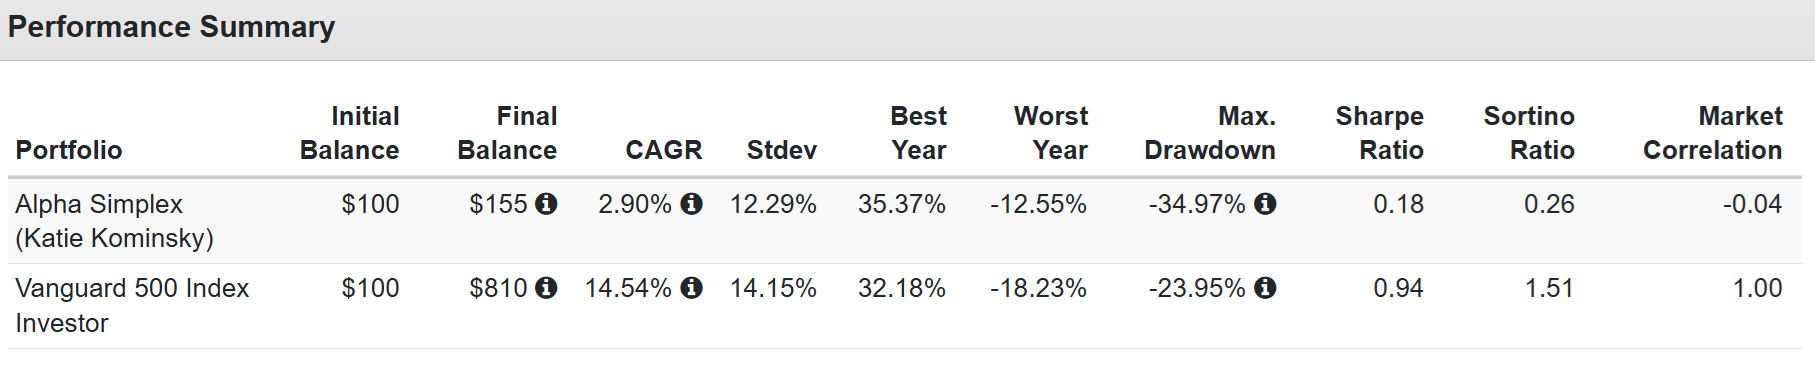
Alpha Simplex has a skilled team led by Katie Kaminsky, who uses various strategies and leverages up to 700% on a position. In the 2022 bear market, Alpha Simplex was #1 with 48% returns.
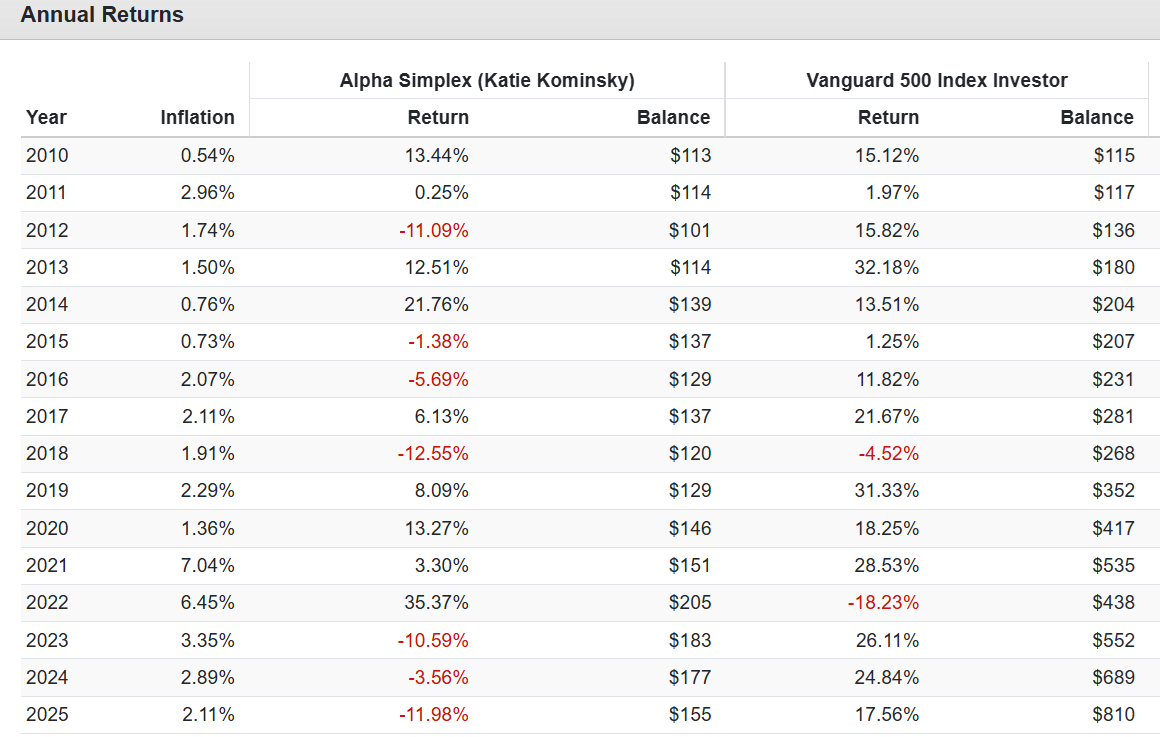
Alpha Simplex has gone from one of the hottest actively managed funds to stone cold. If you own AMFAX, you are betting that management, which has been wrong consistently, can turn things around.
Persistence of Returns for Active Managers of All Kinds Is Terrible
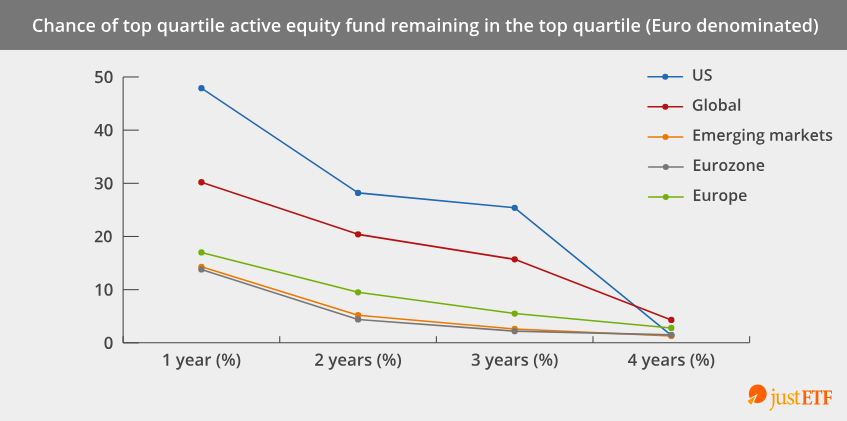
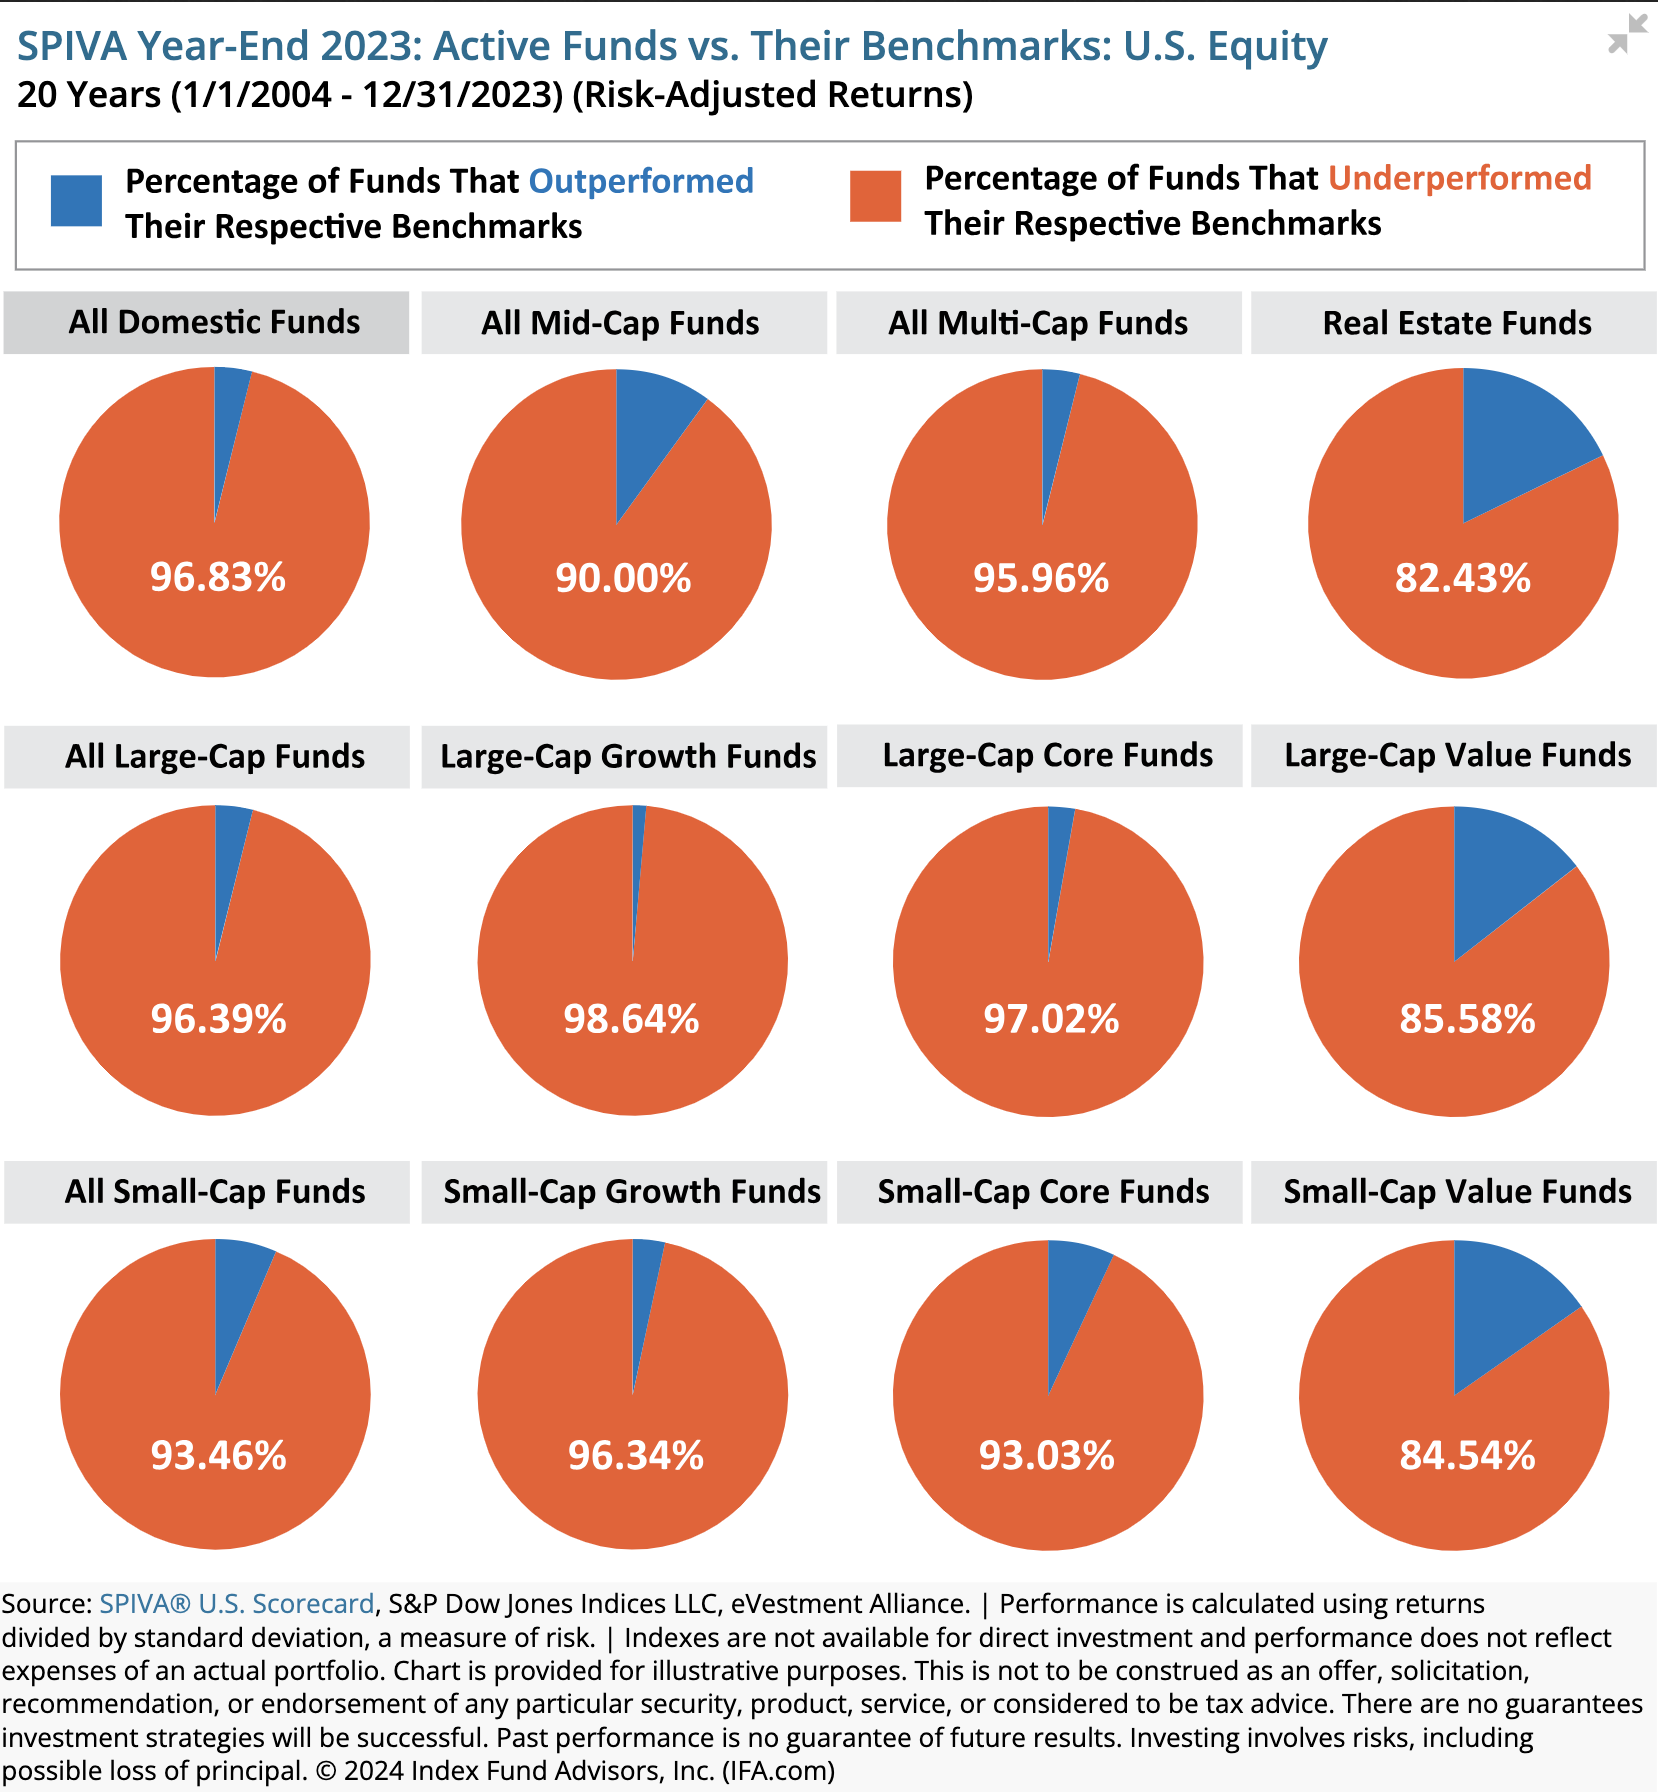
1.5% to 15% of active managers earn their fees depending on the kind of fund it is. But even in the most “alpha-rich” hunting grounds, small-cap value is 15% skill and 85% luck (beta to be precise).
CTA, DBMF, and KMLM are rules-based ETFs that track an index (or four algos working together, as in the case of CTA).
CTA only owns interest rates + commodities
KMLM adds currencies.
DBMF adds stocks.
Since Nov 2022: Age Of AI
As you can see, in a pure AI era, which began at the bottom of a bear market (and has included one since), it’s been a golden age for the stock market.
21.26% CAGR stock returns are literally Buffett-like returns.
DBMF has trend-followed the S&P, the Nasdaq, global stocks, and emerging-market stocks, depending on the trends. And DBMF has delivered zero returns despite having exposure to trend-following stocks.
Why? Because the stock market hasn’t gone up 21% CAGR in a straight line!
Going into the 2025 bear market, stocks were red hot, so DBMF was long stocks. Then stocks got wrecked, and DBMF got caught on the wrong side of that trade. Then the market rebounded quickly, but only after DBMF began shorting stocks. It’s whipsaws that explain why adding stock exposure during a 21% CAGR stock market run didn’t actually help returns (or generate positive returns of any kind).
10: Do Managed Futures Still Work in The Age Of Trump? Yes.
OK, so what about the equally plausible-sounding idea that, due to President Trump moving financial markets, commodity markets, bond markets, and currency markets with tweets and announcements, this creates a kind of environment where managed futures just don’t work at all?
Since Nov 2024: Trump Era
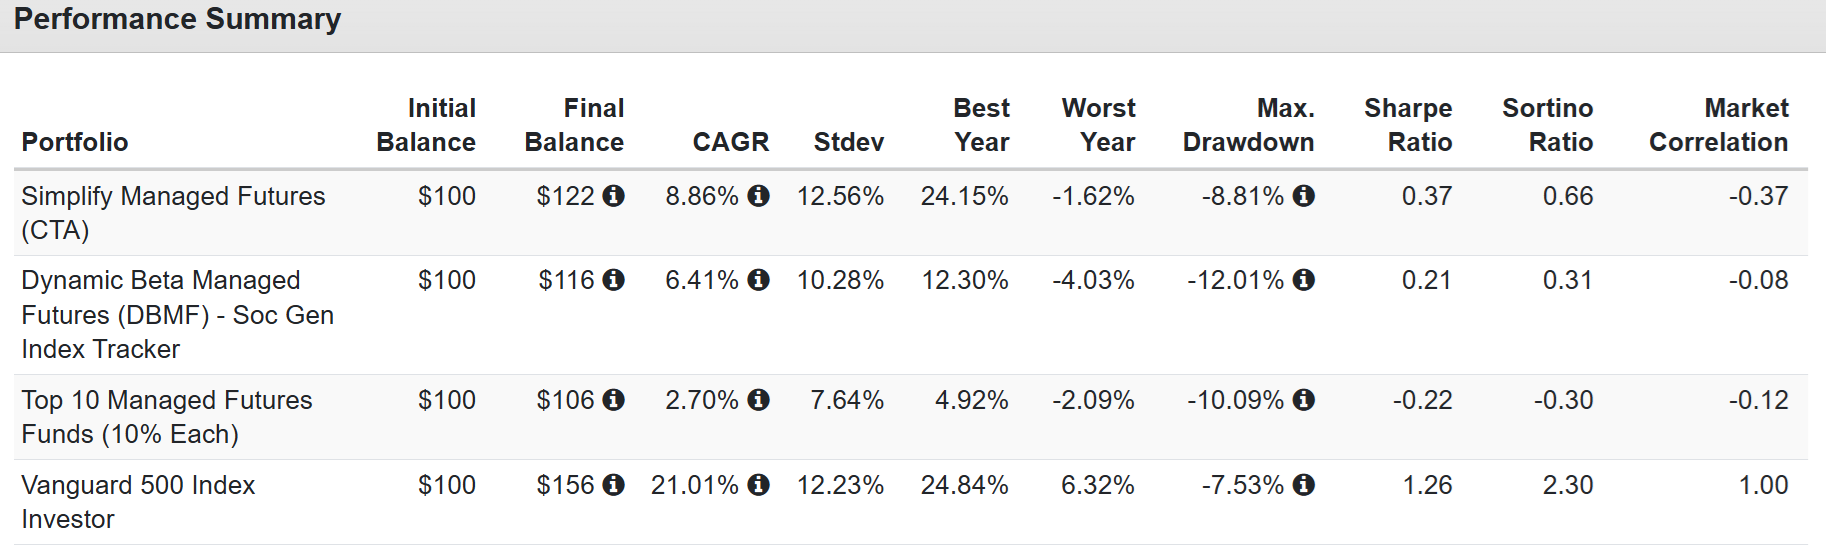
In the Trump era, DBMF has done better due to heavy exposure to stocks, BUT notice how CTA has delivered about 5% CAGR returns as well (despite a really crappy 2025).
Combining three different systematic managed futures funds had returns similar to CTA, with much lower volatility (as you’d expect), BUT on a volatility-adjusted basis (Sortino and Sharpe ratios), not as good.
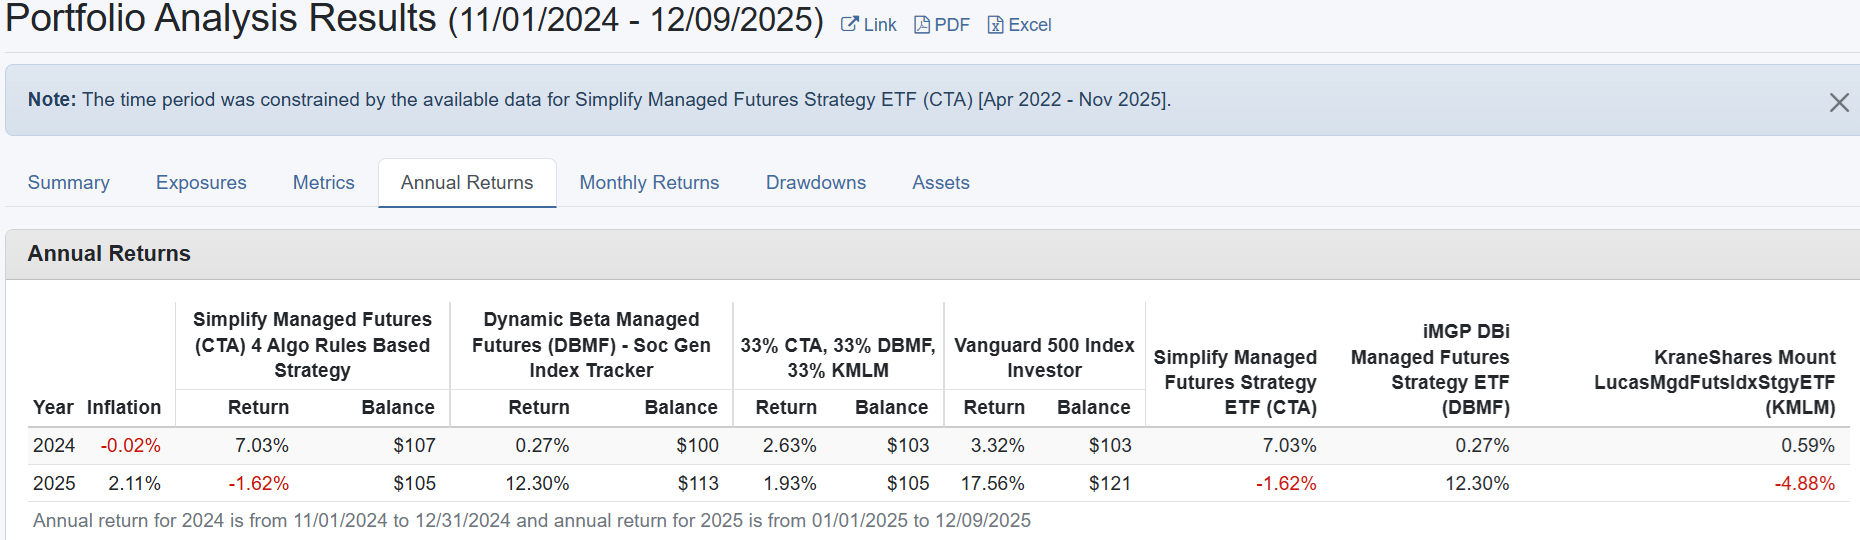
Keep in mind that DBMF’s impressive 2025 has come in just the last few months.
CTA was also going parabolic and then got slammed by cattle prices crashing (Trump headline) while DBMF’s lack of cattle exposure and a strong global stock market helped it to go from 0% returns to 13% returns.
But what about actual hedging power?
CTA is still generating alpha in the age of Trump; in fact, more than DBMF, which is generating those returns at the expense of higher correlation to the stock market (the opposite of what you want a hedge to do).
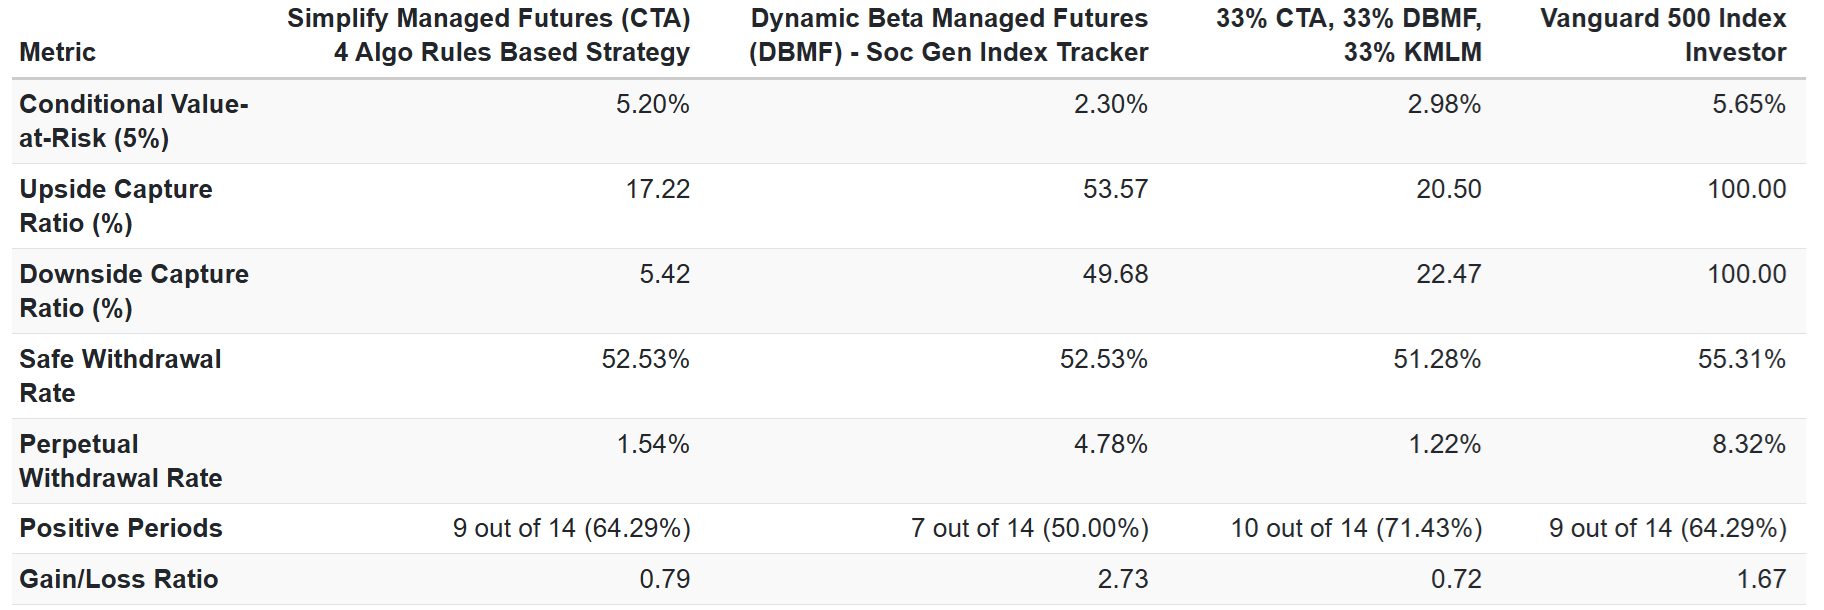
If we look at pure hedging power, CTA’s downside capture ratio of 5% is a lot worse than its historical 68% BUT it is 10X better than DBMF’s 50% and adding KMLM resulted in 5X worse hedging power.
The % of positive months was the highest at 71% but as far as the idea of “diversifying risk” that’s not actually what happened.
11: Beware “De-Worsification.”
Warren Buffett warned against diversification for its own sake because everything you own in a portfolio should have a purpose, and often, different stocks do not actually provide new benefits, just overlapping ones.
So let’s consider the age of AI and the age of Trump, and try an experiment. What if we create a 10-managed futures bucket? 5% each into the most popular managed futures funds?
Since September 2023
CTA selected commodities and interest rates because they trend most cleanly and result in superior long-term returns. And that also holds for the last 2 years and change.
Ten different managed futures funds result in a lot lower volatility, BUT not lower peak declines than owning just a single ETF.
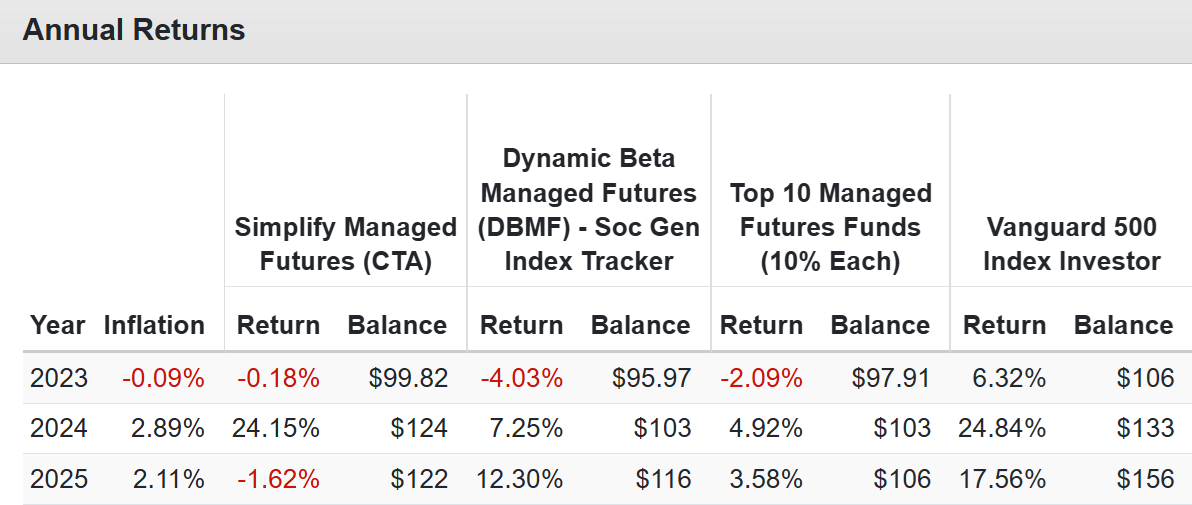
In 2024, stocks were up 25% and managed futures did 7% (Soc Gen), while diversifying into the top 10 funds would have lowered your returns to 5% and didn’t significantly affect peak declines.
This year being ultra-diversified would have slightly made things better over CTA, but note that $100 invested in CTA in mid 2023 is now worth $122, while its only $106 if invested into 10 funds (diversification for its own sake usually doesn’t work out).
Notice something? A highly diversified portfolio of managed futures over the last 2 years would have done no better at hedging the market’s downside than DBMF (the Vanguard of managed futures). Still, CTA delivered an industry-leading downside capture ratio.
AQR had a -52% downside capture ratio during this time.
Managed Futures Aren’t Broken Either
Chat GPT 5.1 Pro Deep Research
What the research says
“Demystifying Managed Futures” (Hurst, Ooi, Pedersen, 2013).
Shows that the performance of managed‑futures funds and indices is largely explained by simple time‑series momentum strategies—the same long‑when‑up, short‑when‑down logic used by CTA. AQR Capital Management
These strategies produced strong, persistent excess returns across asset classes even after realistic transaction costs and fees.
Conclusion: managed futures’ edge is real and connected to investor behavior (slow reaction to news, herding, etc.), not magic data‑mining.
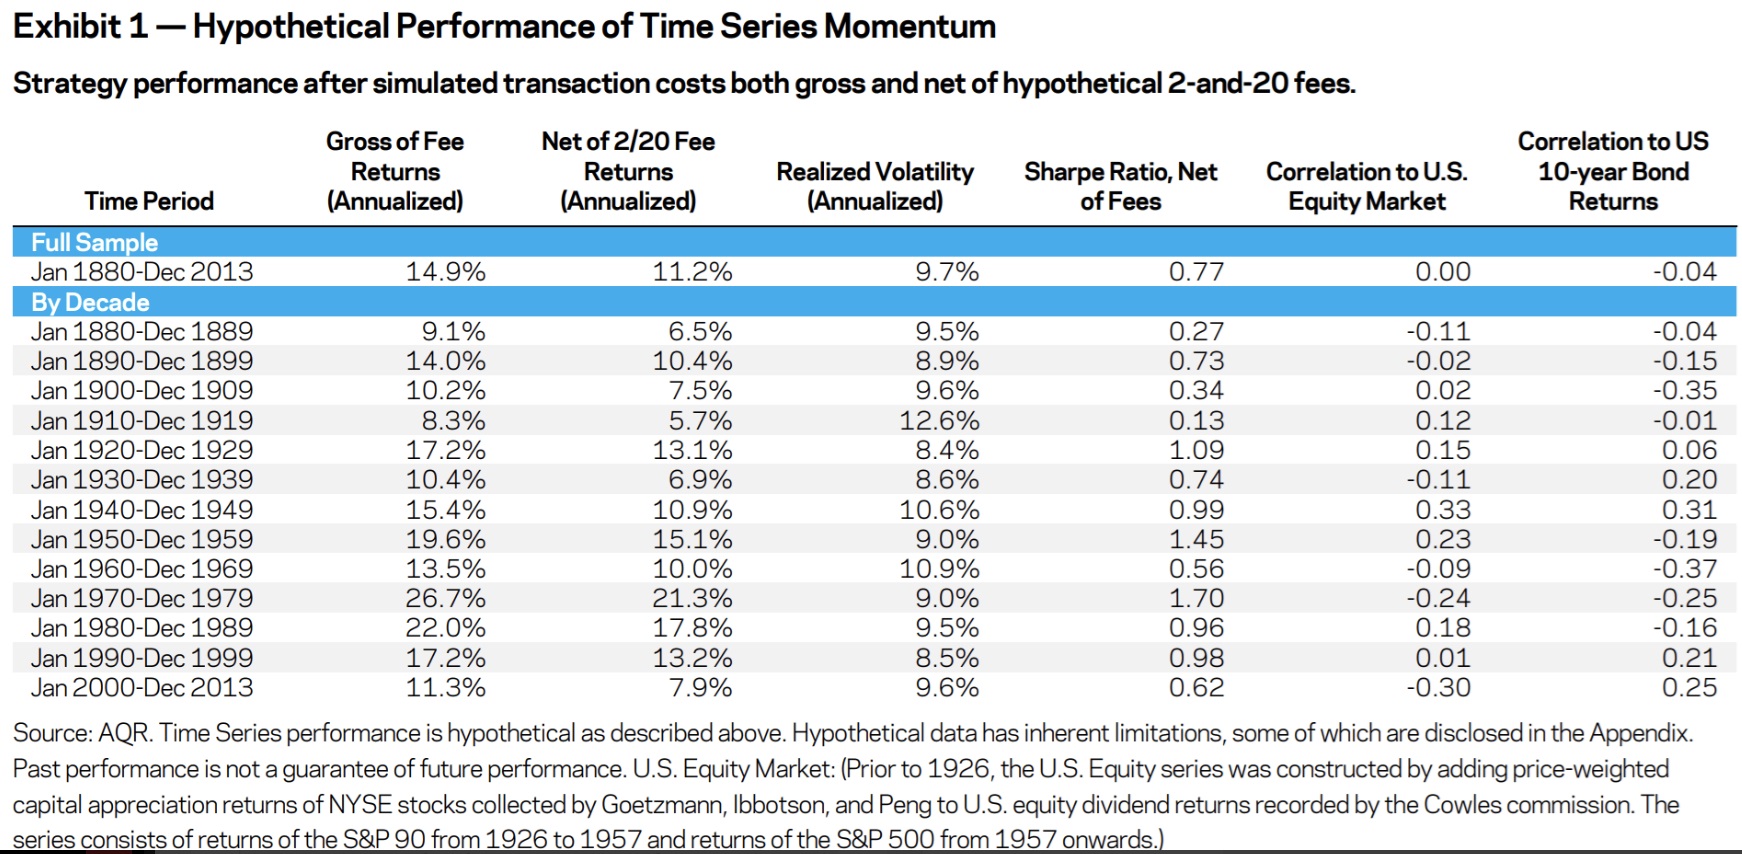
“A Century of Evidence on Trend‑Following Investing” (Hurst, Ooi, Pedersen, 2017).
Applies simple trend‑following rules to a big set of futures and forwards from 1880–2014. fairmodel.econ.yale.edu
Finds consistent positive returns across:
the Great Depression,
two world wars,
periods of both rising and falling rates,
inflation and disinflation regimes.
Importantly: it documents multiple multi‑year drawdowns and flat patches, but over the full sample the Sharpe ratio stays attractive.
Time‑Series Momentum evidence summarized by Alpha Architect.
Using data from 1925–2013, a global trend‑following strategy had average net returns over 12% per year with volatility around 11%—but performance tended to be weak for ~4 years after big financial crises, when trends are messy. Alpha Architect
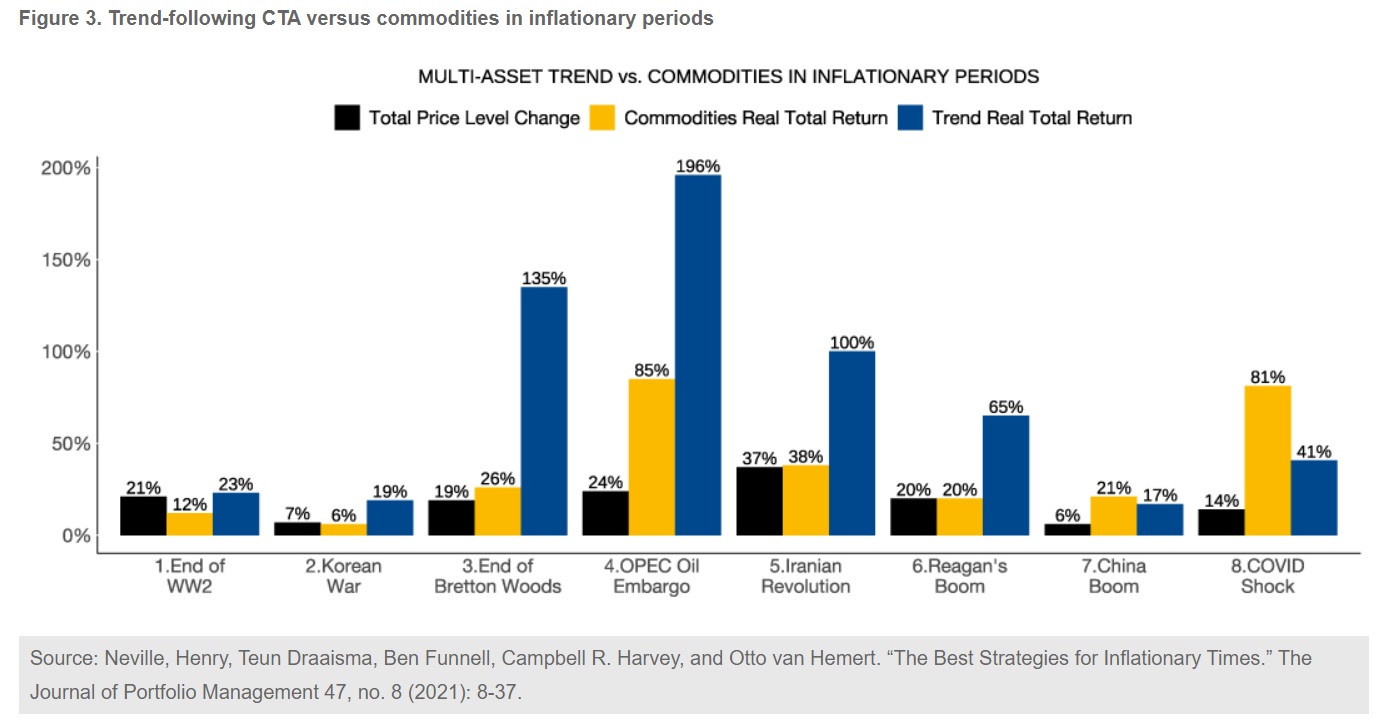
Industry whitepapers (“patience premium”, “market cycles and managed futures drawdowns”).
These emphasize that managed futures tends to shine in crises and struggle in quiet or rapidly reversing markets, and that the payoff is lumpy—long stretches of small gains/losses punctuated by a few huge years. alphasimplex.com+2alphasimplex.com+2
Collectively, the evidence says:
Trend‑following / managed‑futures strategies have not “stopped working” in any structural sense, but they absolutely can have multi‑year periods where they look disappointing.
The past three years (big 2022, weak 2023, strong 2024, flat‑ish 2025) actually look very textbook in that context.
Bottom Line: CTA Isn’t Broken. This Is Just A Rough Patch, But It Remains The King Of Hedging
Owning CTA is about two things.
Long-term returns that are bond-like or stock-like (insurance that pays you to own it).
Industry-leading hedging power during corrections.
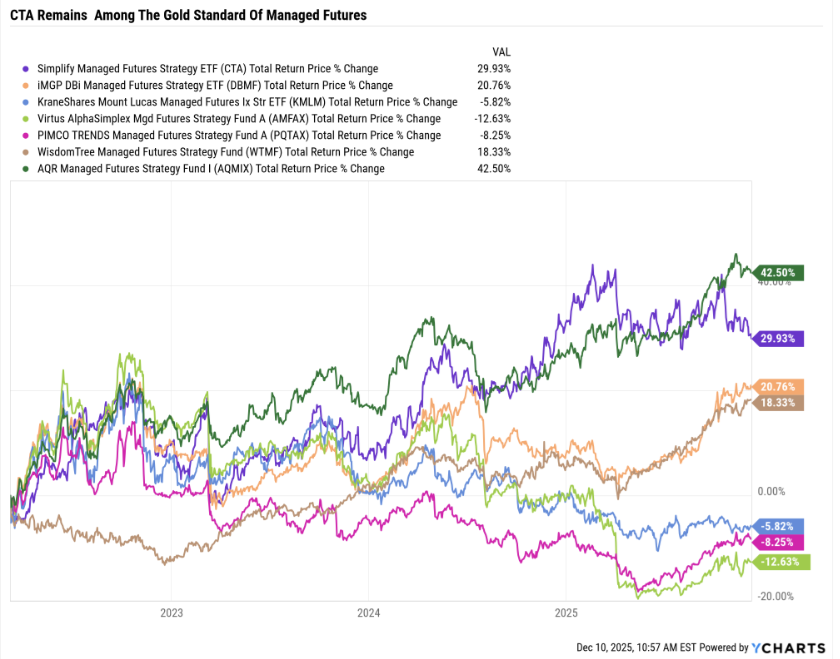
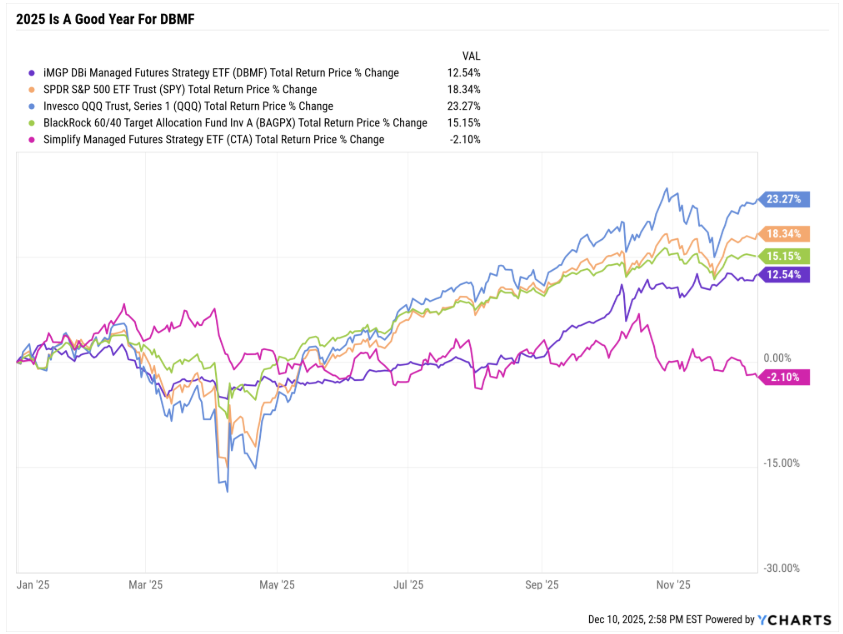
A picture is worth a thousand words, and this one pretty much says it all.
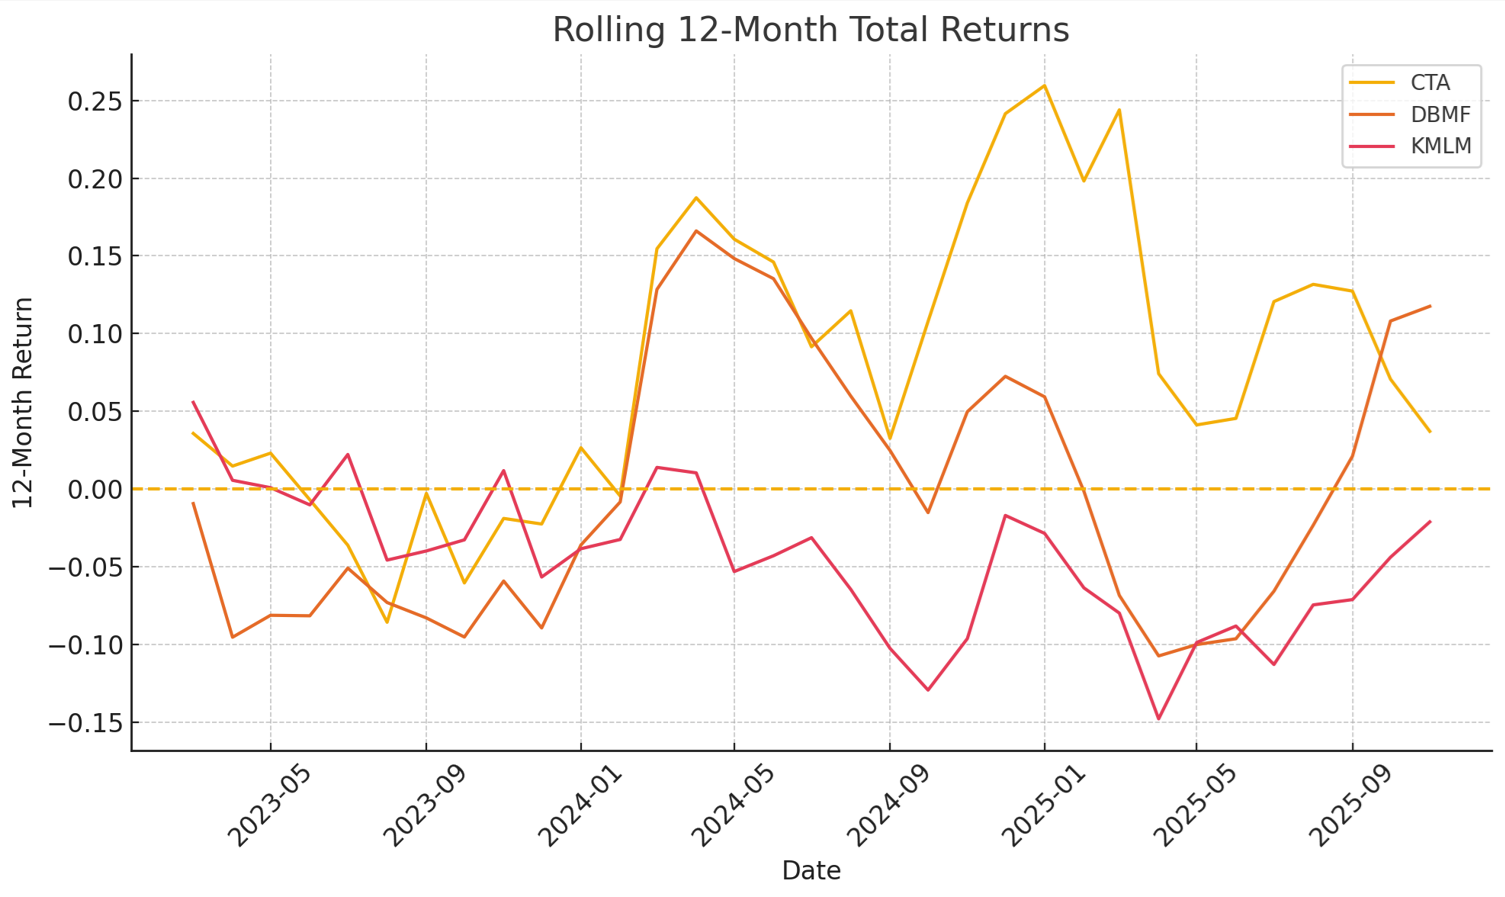
CTA has experienced a rough year, but all the peers that have recently been red hot (like DBMF)? Look at the chart. A few months ago, DBMF investors were cursing the financial gods and wishing they were all in on CTA.😉
CTA isn’t broken; it’s not suffering from some permanent impairment or even political impairment (Trump’s headline-moving tweets hurt other managed future funds more).
We’ve seen how adding exposure to currencies and stocks (as DBMF does) doesn’t actually improve returns, not in the age of AI, not in the age of Trump, not when we actually examine the historical data.
This is an example of how, when something you own is dragging on returns, it’s tempting to overthink and overcorrect.
However, as we’ve seen in numerous examples today, disciplined financial science requires evidence, not just theory.
And the facts are clear that CTA remains the #1 systematic managed futures fund, and that’s not likely due to luck, but due to superior design, targeting the cleanest asset classes for trend following AND also providing three other strategies for protecting against extremes in market prices (such as carry trade and relative value yield).
If the facts change, I change my mind, but the facts on CTA haven’t changed. This is just historically normal variability, just to the downside, which feels terrible, but is exactly what happens before CTA usually experiences periods of excellent returns.