ZEUS, NVO, & Economic Updates At The Bottom Of The Article
Today’s report is inspired by an excellent question a GNG member asked me in the comments on my last article.
Adam, what happens if you take Zeus and substitute VFLO for CTA? I'm just curious because I am young..and don't care if the market goes down. I would love to achieve 20% annual returns. I have a small portfolio where I run Zeus with CTA (just in case 😂). I have some other accounts where I am considering doing this swap out. Just let me know what you think.-Derrik Abell
Given today's news, I thought this would make an excellent how-to-invest-better-style article. One that focuses on three essential lessons that I’ve realized we all need to learn (and internalize!) in order to achieve our financial goals.
Lesson 1: Asset Allocation Makes All The Difference
Over 12 years I’ve spent building models and designing the ZEUS LEGACY fund, I’ve learned that asset allocation is the core of any successful investment strategy.
Asset allocation is just the mix of stocks, bonds, and other asset types, like gold, commodities, crypto, private equity, private credit, venture capital, hard assets like infrastructure, real estate (physical, not REITs), art, wines, collectibles, (even barrels are now an asset class😉) ect.
“The landmark Brinson, Hood, and Beebower study (1986, 1991) found that asset allocation explains 93.6% of the variation in returns between portfolios—meaning it largely determines whether Portfolio A behaves differently than Portfolio B.” CFA Institute

For us stock nerds😉 trying to optimize portfolios instead of just using index funds, the key is to know the right asset allocation over time.
There are many ways to optimize a portfolio, with things like volatility-adjusted returns (aka “risk-adjusted returns” like the Sharpe ratio) being one example.
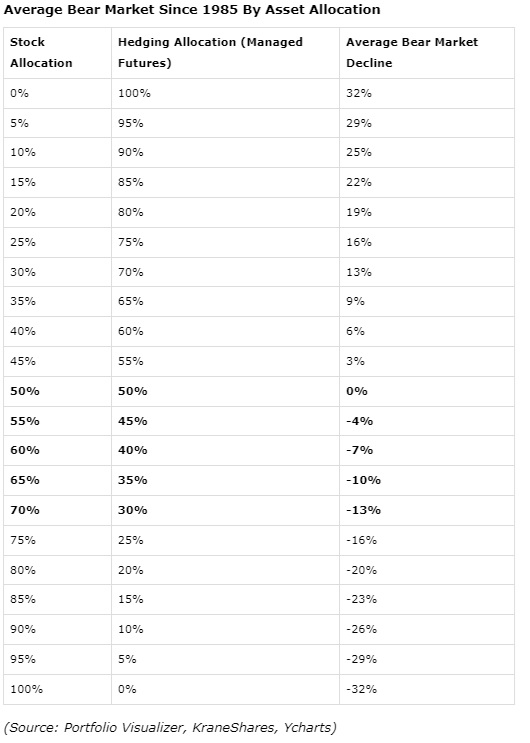
Other people target a specific average peak decline during bear markets. That’s completely understandable, because if you are sleeping well at night during market bottoms (when panic is at its highest) then the rest of the time will be even less stressful.
The ZEUS Strategy: 4 Buckets For KISS (Keep It Simple Stupid😉)
25% bonds (long or short)
25% commodities (long or short)
25% growth stocks (long)
25% value stocks (long)
These are three asset classes that historically act like 4, being non-correlated primarily to each other, even during bear markets.
That’s what allows for such incredible resiliency during bear markets.
During bear market bottoms, correlations go towards 1, due to global margin calls. Anything positive tends to collapse as hedge fund managers and investors using margin are forced to sell to avoid locking in losses during the waterfall phase of a correction.
That’s the terminal phase —the washout —when volatility spikes due to algorithmic selling and mass liquidations.
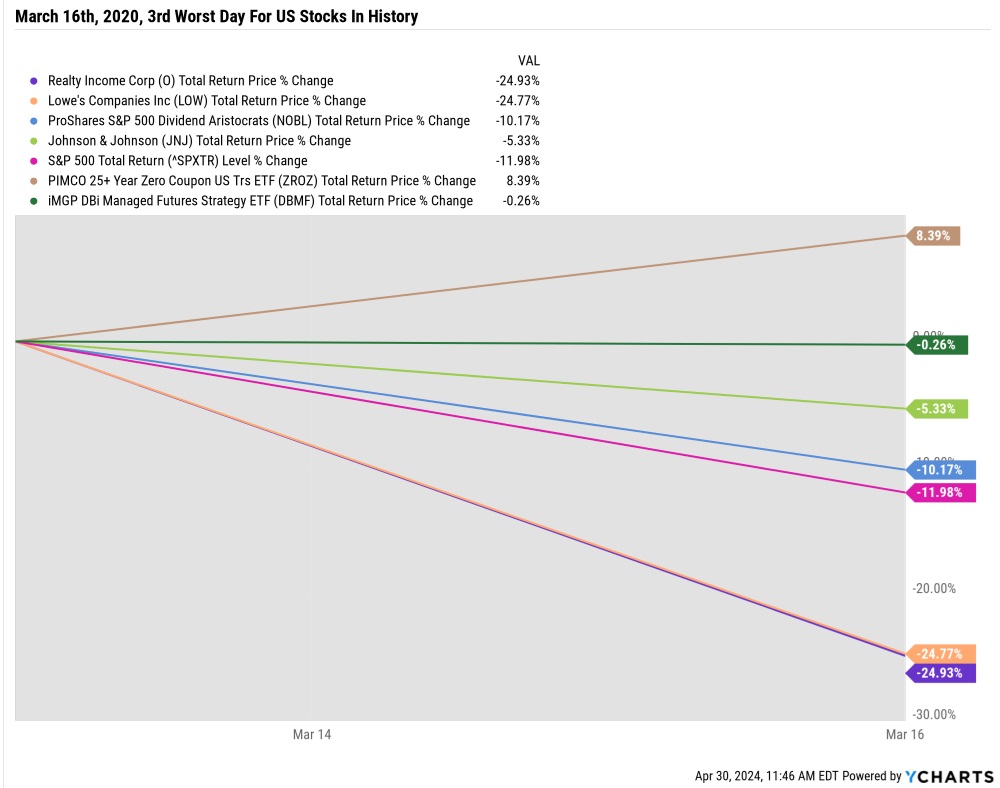
During the March 16th, 2020, global margin call, the stock market fell 12% and Lowe’s and Realty Income, two dividend aristocrats, usually have lower volatility, fell 25% in a single day. Why? Because some hedge funds owned them, and had to sell something to raise cash to avoid becoming forced sellers of higher volatility assets.
If you had limit orders set for O and LOW that day? Congrats! You were the other side of the “dumb money,” which was the liquidated hedge funders😉
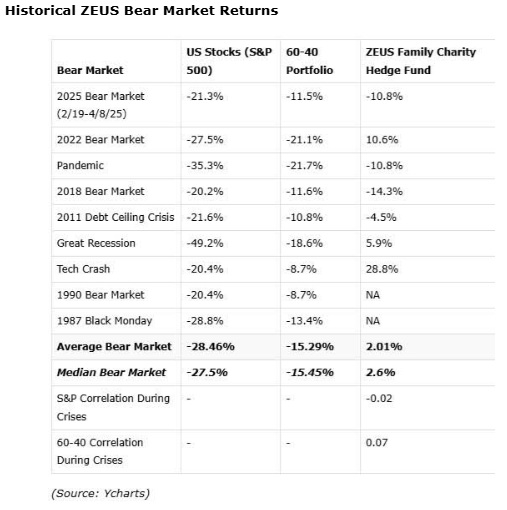
ZEUS tends to be flat or even go up modestly during the average and median of the last seven bear markets, and that’s because asset allocation is the science-based magic behind a kind of portfolio stability that few people even realize is possible.
It’s not just stable during bear markets (the largest decline since 1990 was -14.3% during the Dec 2018 bear market); it’s a very steady performer because across four asset classes (including long or short 22 commodity and bond futures contracts), something is always working.
More importantly, with all 4 asset classes (growth and value tend to move in opposite directions much of the time) and all of them offering long-term positive returns, there is no long-term sacrifice to owning all of them.
In other words,
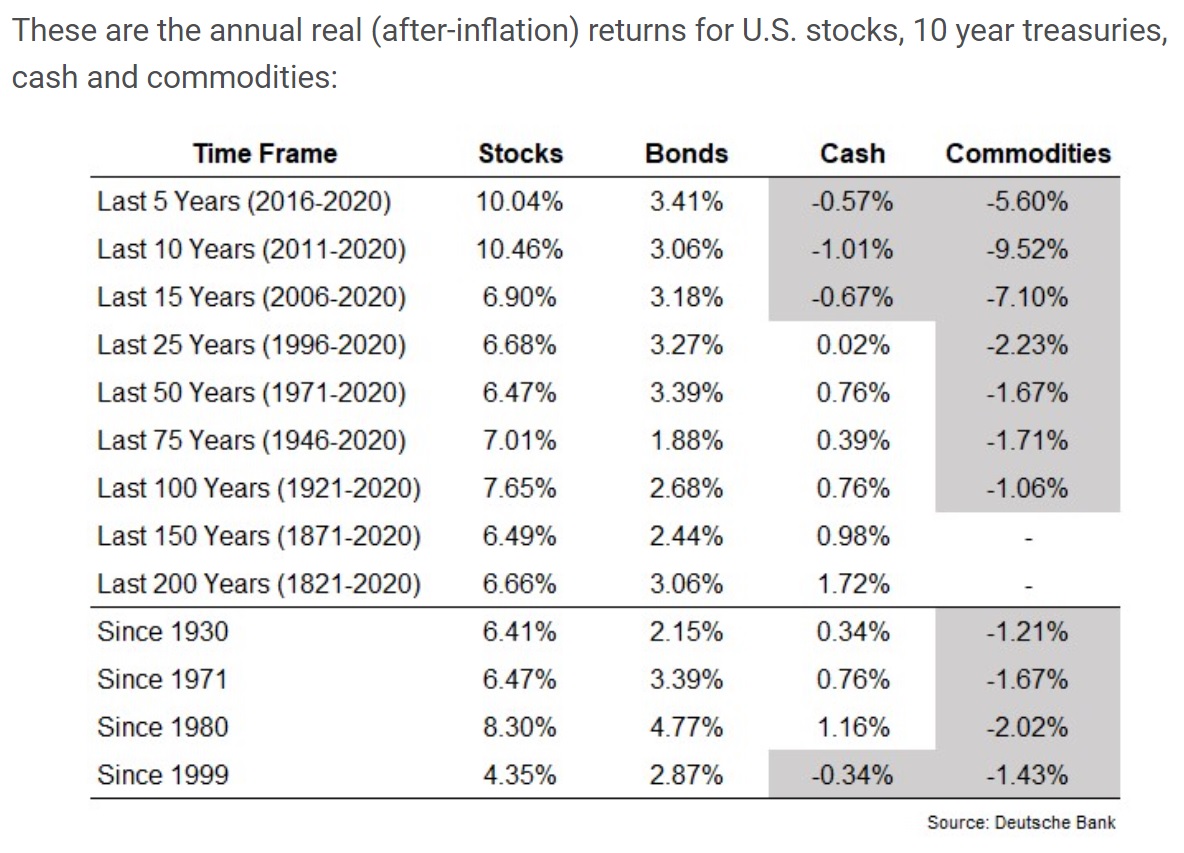
For example, you can see that commodities are a terrible long-term investment. That’s because, adjusted for inflation, the long-term price of most physical things falls over time.
Think about the purpose of technology and capitalism. To make more with less. To mass produce and drive the price down so you can maximize volumes and thus absolutel profits (not profit margins).
That means commodities are supposed to decline over time, and they do.
So to own a basket of commodities all the time? That’s like owning long-tail funds that use aggressive put buying strategies to bet on stocks falling.
Those funds (or buying out-of-the-money puts in general) are guaranteed to lose money over time.
For ZEUS? We don’t accept that you have to own insurance that drags on returns forever.
We own only asset classes with a historical positive return.
Managed Futures (Trend Following) Historical Returns
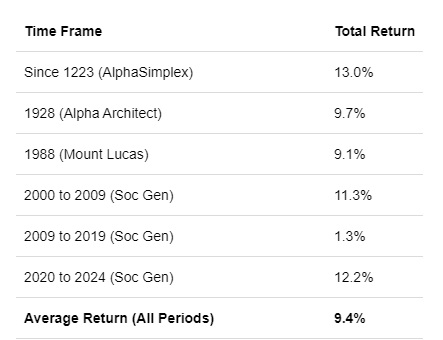
Other than the zero-interest-rate era, managed futures (what CTA is the gold-standard ETF for) is an investment strategy that delivers stock-like returns, but is also the most effective historical hedging tool.
ZEUS historically captures 78% of the market’s upside and 57% of the downside (26% in the AI era).
That’s compared to the 60/40, which captures 70% of the upside and 80% of the downside.
The point is that whatever asset classes you own, you need to optimize for your specific goals (whether it’s minimal declines in bear markets, or max returns per unit of downside volatility (Sortino ratio) or returns per unit of peak decline (Calmar ratio).
Understanding your financial AND EMOTIONAL needs is critical, because even I feel the panic of a crashing portfolio.
April 8th, I almost made a $1.3 million mistake that would have effectively ended my career because of emotional stress and lack of sleep.
And on April 7th, I was pounding the table to “Shut up and buy something smart and you’ll thank me in a year.”
No amount of intelligence will eliminate negative feelings in a correction or bear market.
Asset allocation is the best weapon we have to stay safe and sane during periods of market turmoil.
When You See This Remember…
Your FEELINGS Are Wrong
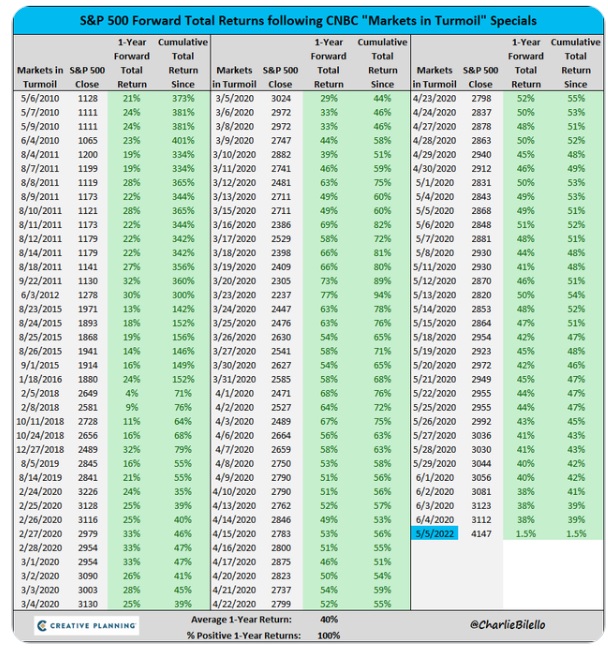
Interestingly, the average 40% return after the VIX hits 60 (which has happened 33 times since 1992) is also 40%. In other words…if CNBC is running a “markets in turmoil” that is a “SHUT UP AND BUY SOMETHING SMART AND YOU’LL THANK ME IN A YEAR!” Moment😉
Lesson 2: Know What You Own And Why- Because Your Faith Will Be Challenged!
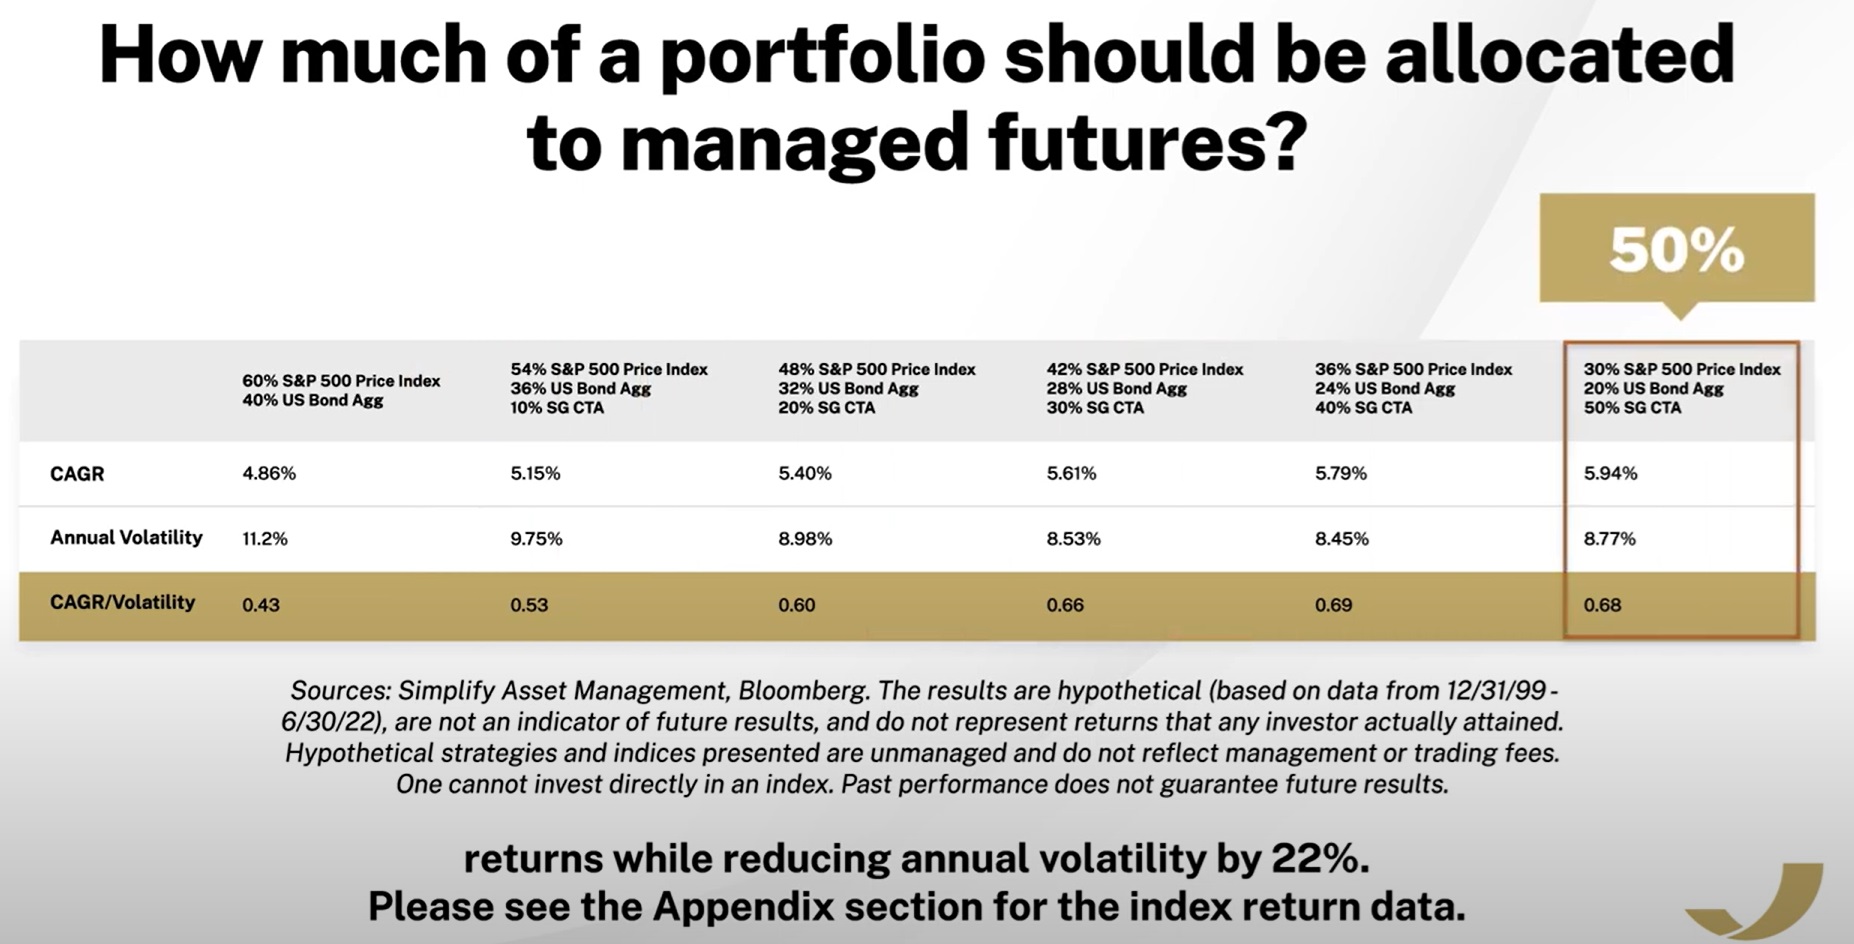
So let’s answer Derrik’s question. What happens if we replace CTA with VFLO? What if we turn a 50% hedging bucket into a 50% deep-value bucket (75% value and 25% growth) in a 100% stock strategy?
Since July 2023 (VFLO Inception)

The correlation to the S&P is very high because it’s a 100% stock portfolio. Asset allocation is driving the difference.
But look what happens to the volatility. The S&P has a historical volatility of 15% and since mid-2023, just 12.6%. With a 100% stock portfolio that’s 75% value and 50% individual stocks (always more volatile) you get higher volatility and higher peak declines.
More concentrated portfolios are more volatile but can also generate stronger returns.
The Sortino ratio, which is excess returns (above risk-free cash) per unit of downside volatility, is a great way to measure whether a portfolio’s volatility “juice is worth the squeeze”.
Historically, the S&P’s Sortino is 0.85 so the last 3 years have been perfect for investors, but even so, the ZEUS strategy, whether mine or the pure ETF version (50% managed futures, 25% deep value ETF, 25% growth ETF) was superior and with strong returns, low peak declines, and really impressive reward/risk ratios.

The Treynor ratio is excess return per unit of volatility, and you can see how the ZEUS strategy, with its “magical” asset allocation, runs circles around the market and a pure 100% stock portfolio.
Mind you, for those who don’t care about volatility? If you don’t need to control volatility? Then the 28% CAGR of the 100% stock version of ZEUS (which is called a ZEN portfolio: 50% ETF and 50% high-conviction stocks you like) will generate superior long-term returns.
Remember that managed futures, long-term, deliver 9% to 10%, and VFLO has historically delivered a 19% CAGR (since 1992) and 20% since inception. So there is some return sacrifice.
Calmar Ratio: Long-Term Total Return/Peak Drawdown (Ever) S&P 0.17 historical (10% returns/58% GFC crash)
Since July 2023

You can see that the ZEN version of ZEUS, using VFLO instead of managed futures, results in a lower Calmar (think SWANiness ratio😉).
But higher returns overall, so if you don’t care about volatility? If you have 10+ years? Then it’s perfectly fine to use IF AND ONLY IF you are a stock-picking nerd who won’t be driven crazy by market volatility.
My Favorite Geeky Risk Management Stats😉

The ratio that ZEUS is optimized for is the reward/risk ratio, defined as the upside capture ratio divided by the downside capture ratio.
Since July 2023

The 60% stock/40% bond portfolio has historically had a reward-to-risk ratio of 0.875.
For every 1% downside in a falling market, it captures 87.5% of the market’s upside in a rising market.
The market, by definition, captures 100% of the upside per unit of downside.
And you can see how replacing the 50% managed futures in ZEUS with VFLO (deep value stocks) results in a better reward/risk ratio than the S&P, but far less than the ZEUS strategy, which is 336% of the market’s upside in a rising market per unit of downside in a falling market.
And ZEUS 2026? Well, the age of AI has been really good for ZEUS (because it’s been optimized for this specific ratio).
For every 1% downside ZEUS captures in a falling market, it captures 5.06% of the market’s upside in a rising market.
Since April 2022


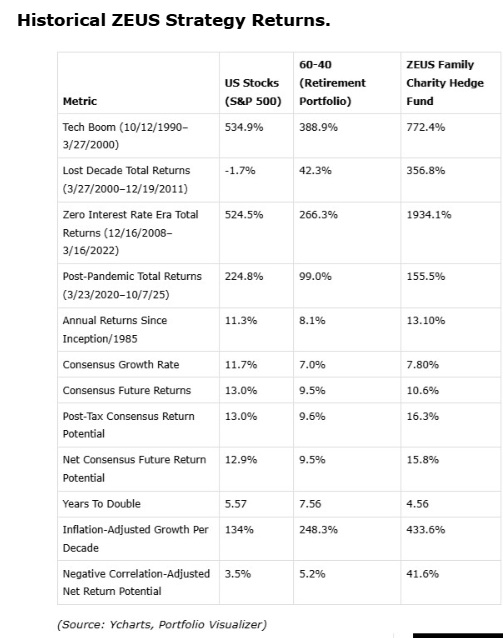
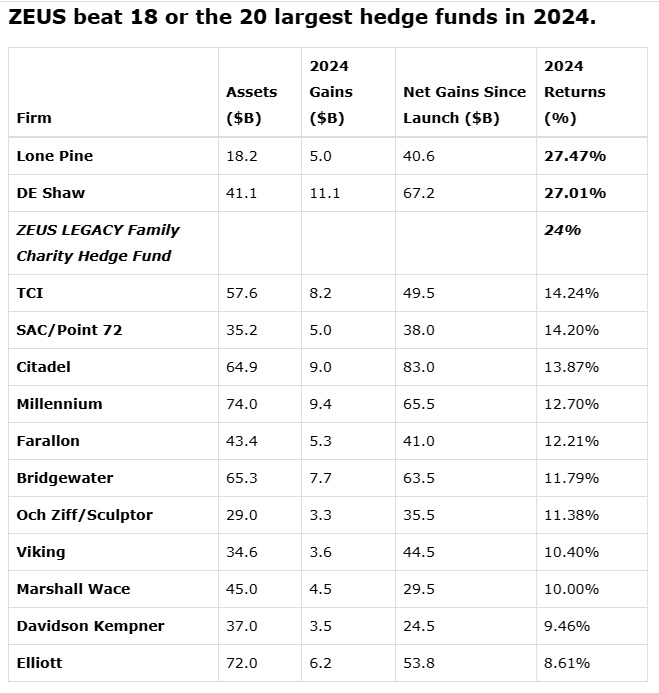
And it’s not only in geeky volatility-adjusted statistics that ZEUS is beating hedge fund pros like Ray Dalio and legendary endowment manager David Swenson.
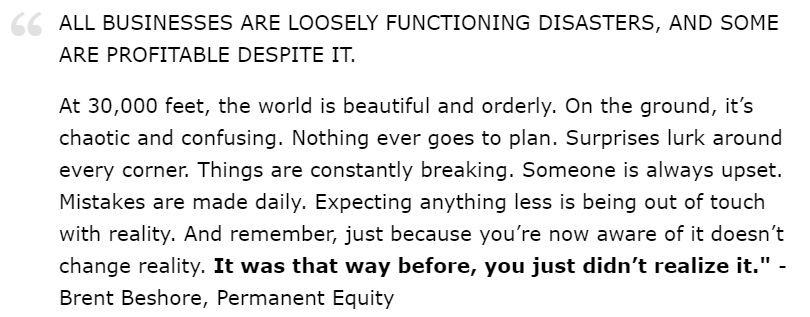
Lesson 3: Even When Everything Goes To Plan…Nothing Goes To Plan…Exactly As Planned! 😉
On Dec 12th, 2023, Morningstar estimated a 23% CAGR for ZEUS's long-term return.

At the peak in July, ZEUS was at a 25% CAGR in total returns (and beating the S&P and Nasdaq😉), and until recently, it was precisely at 23% CAGR.
In other words, draw a straight line from December 12th, 2023, inception to September 2025, and you get EXACTLY the forecasted returns.
But of course, we’ve had a lot of drama since Dec 2023, including a 21.3% bear market.
So let’s talk about that bear market.
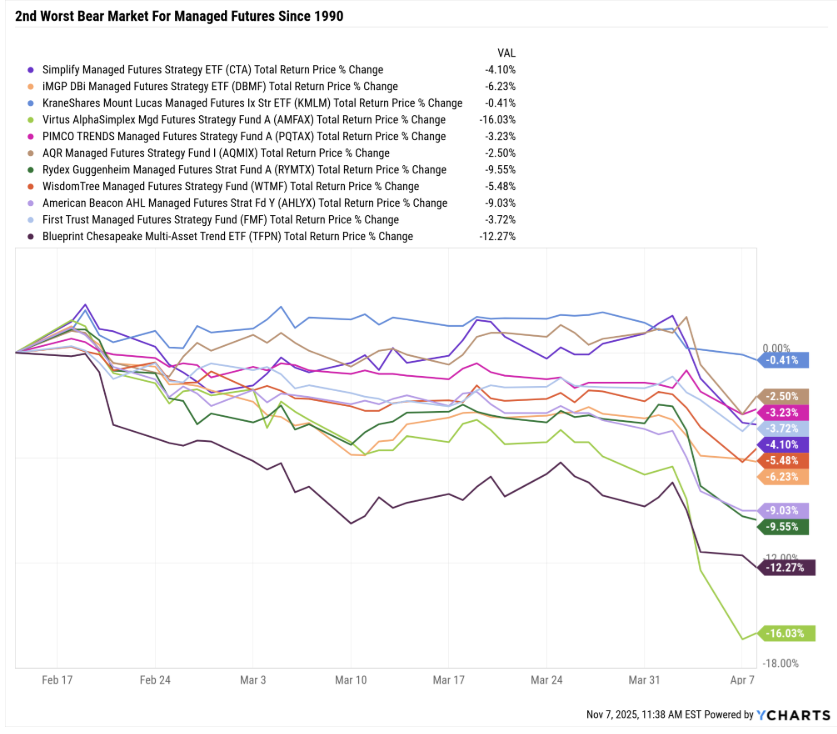
CTA wasn’t working during that bear market.
The Best Hedging Strategy Of The Last 30 Years: Not One Managed Futures Fund Went Up
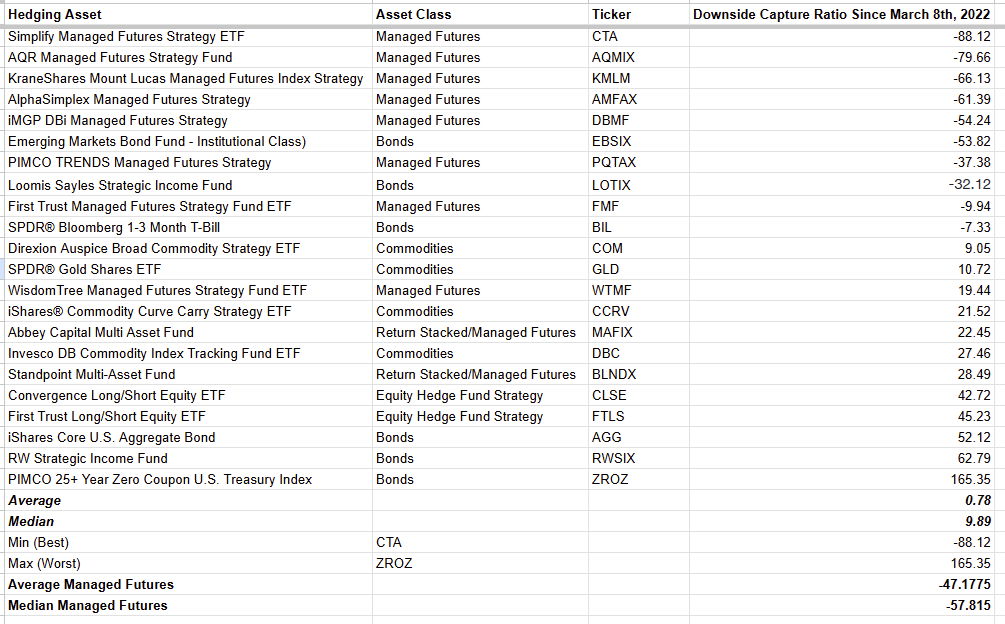
The median downside capture ratio for managed futures over the last 3 years is -57%. So if the market is down 10%, their typical GAIN in that downturn is 5.7%.
But every correction is different.
So ZEUS, at 50% managed futures, which were expected to go up 17% (CTA’s downside capture ratio) in the downturn, instead fell 4% (it FELT a lot worse than that in the moment).
And how did things turn out? When half the portfolio underperformed its expected returns by 21%?
56% downside capture vs 57% since March 2007.
Even when everything FELT it was broken, the system was working EXACTLY AS EXPECTED!
Lesson: Even When Everything Is Going As Expected, Surprises Are Still Happening…Exactly as Expected! 😂
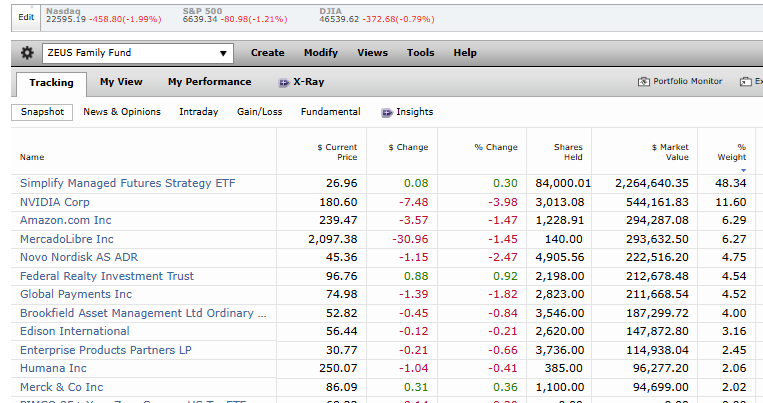
ZEUS Updates: I Have To Do This Every Week, So I Might As Well Share it With Everyone😉
As of Nov 7th (Down 0.74%, 61% downside capture ratio vs 57% since March 2007)
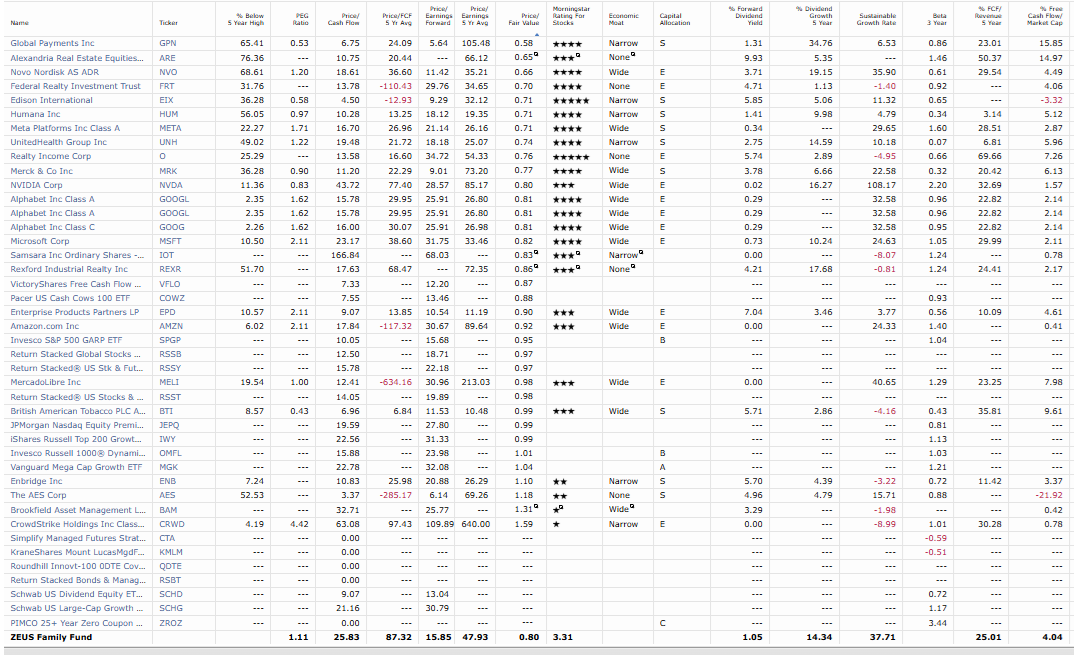
According to Morningstar, ZEUS is 20% undervalued (25% upside to fair value), trading at a PEG of 1.11 and a 16 PE, vs. a historical 48.
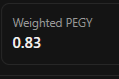
We’re working on the historical PEGY data, but I can say that the hypergrowth bucket is 0.5 PEGY vs 1.3 historical, and typically, value stocks have historical PEGY ratios of 1.5 to 2.5.
The best educated guesstimate is that ZEUS has a historical PEGY of 1.65.
50% historical PEGY discount
That’s 100% upside potential in the following year. And a weighted PEGY portfolio potential of 54% (CTA historical return is 9%).
In other words, if ZEUS companies all grow as expected and the portfolio were up 54% in a year…that would be luck…but😉

Assuming no GNG Research Revenue from subscribers, we need ZEUS to increase by 8.15% over the next year to pay the bills.
If all existing free members sign up as Pro members after their 1-month free trial expires, we need 4.55% returns or 8% of the fundamentally justified potential.
From a portfolio with 25% FCF margins and 37% LT Morningstar sustainable growth rate.
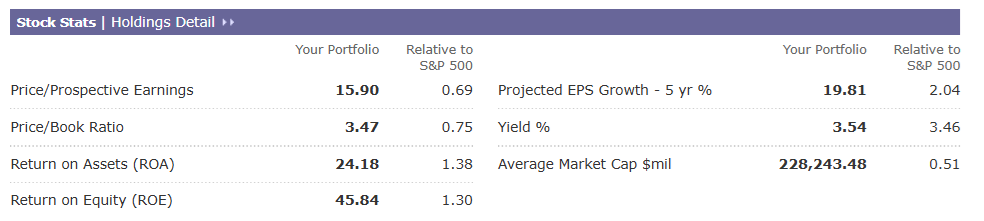
Morningstar estimates the stock portfolio has a 24% CAGR in total return over the next 5 years, with CTA providing a 4.5% boost to the weighted total return.
12% weighted total return potential from Yield + growth
5% CAGR valuation boost (20% discount = 25% upside to fair value) = 2.5% weighted boost.
So 14.5% weighted stock portfolio return potential + 4.5% CTA potential is 19% CAGR for the next 5 years X 15% historical dynamic rebalancing boost = 21.85% pre-tax annual return expected from current portfolio.
Based on the PEGY discount of 50% (a 15% annual valuation boost), the ZEUS portfolio currently has a 24% CAGR total return potential, with a dynamic rebalancing-adjusted potential return of 1.15 = 27.6%.
So, at the moment, ZEUS 2026 appears to be on track to achieve a 21% to 28% CAGR over the next 5 years.
We need annual returns of 4.55% to 8.15% to pay the bills while we ramp up GNG to cash flow profitability.
16% to 39% of the projected returns cover the costs we need to pay while we scale.
Cautiously optimistic.
Now you know why I track the economy and markets so closely.
This isn’t just about making money; it’s about paying the bills for 17 people😉
Buffett-like returns from blue-chip bargains hiding in plain sight are nice, but 60-40-like returns are necessary for now.
And now you know why I am so fanatical in my quest for the best facts and reasoning. I might joke around a lot, because in the age of AI, you have to laugh at the absurd (and to keep from crying😉)

But fundamentally, my family’s future (including GNG and my ZEUS family) is riding on my facts and reasoning being right.
For now, as with many small business startups, we sing for our supper or we starve.😉
Or more specifically, we eat our own cooking, and it either works, or we starve.😂
And having gone 30 days living on pickle juice and mustard before, I have no intention of giving up my subway! 🤣

Or as I like to put it jokingly…ride or die with Jensen Huang, the technowizard of Denny’s😂
Because not only am I doing this for the entire company and all 17 ZEUS family members, but also my future wife and kids.

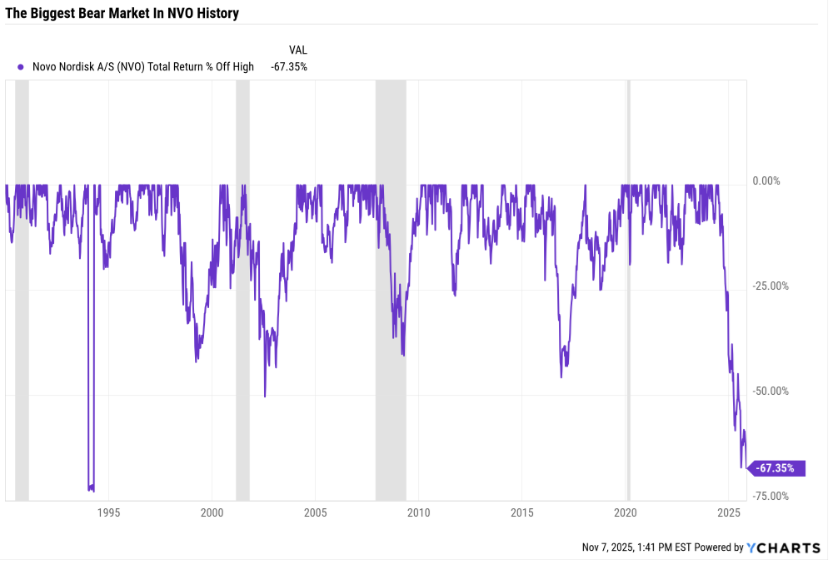
Novo Nordisk Earnings And Continued Decline
ZEUS is approaching the end of its current buying power due to about $100K in end-of-the-year GNG expenses, AND that unfortunate $161K is a realized loss.
ARE is now $54 with a 52-week low of $53.17.
We sold at $57, so while painful, the risk management rules are proving their worth.
In 2 weeks, I’ll provide a full update on NVO’s PEGY to ensure the thesis remains intact. But here’s a summary and earnings take from Morningstar.
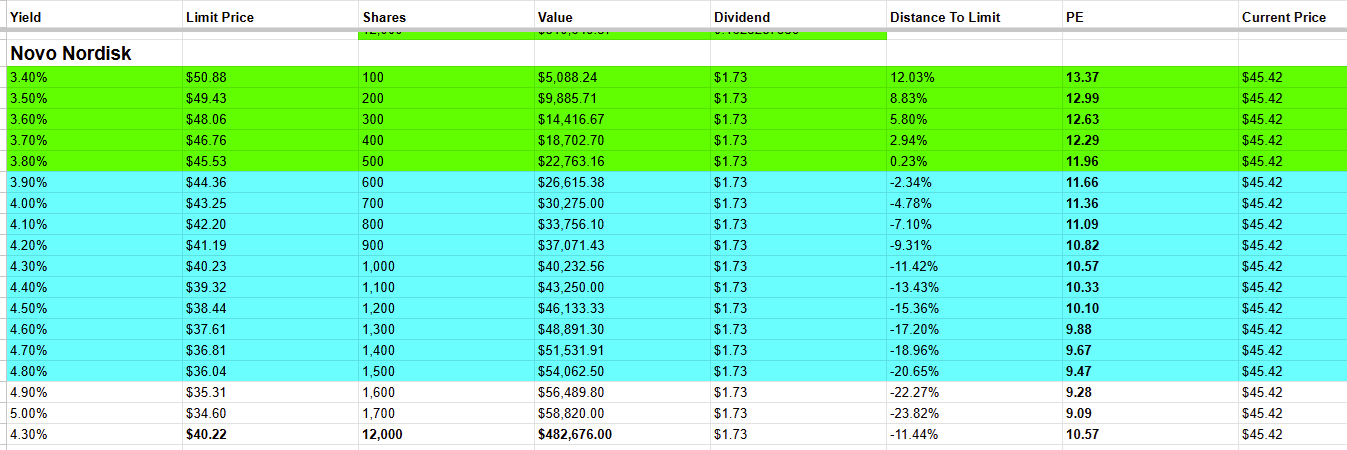
Even after earnings and a reduction in guidance, NVO’s latest order —a 500-share limit —filled at just under 12X earnings, a 50% historical (non-growth-adjusted) PE discount.
-4% to 24% CAGR is the growth range for all analysts
11.1% CAGR median consensus from 2024 through 2030.
Bottom Line NVO Thesis Intact
Morningstar agrees, by the way.
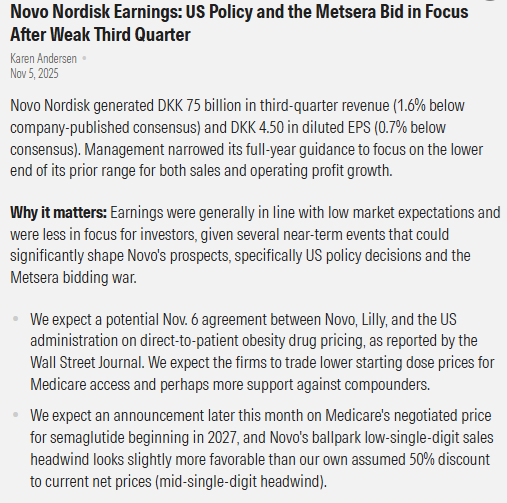
They missed by a little, tightened guidance, and ultimately, Morningstar is maintaining its 18.4 PE fair value estimate vs a 24 historical PE.
If you believe in NVO as a company, this is the best time to buy in at least 35 years.
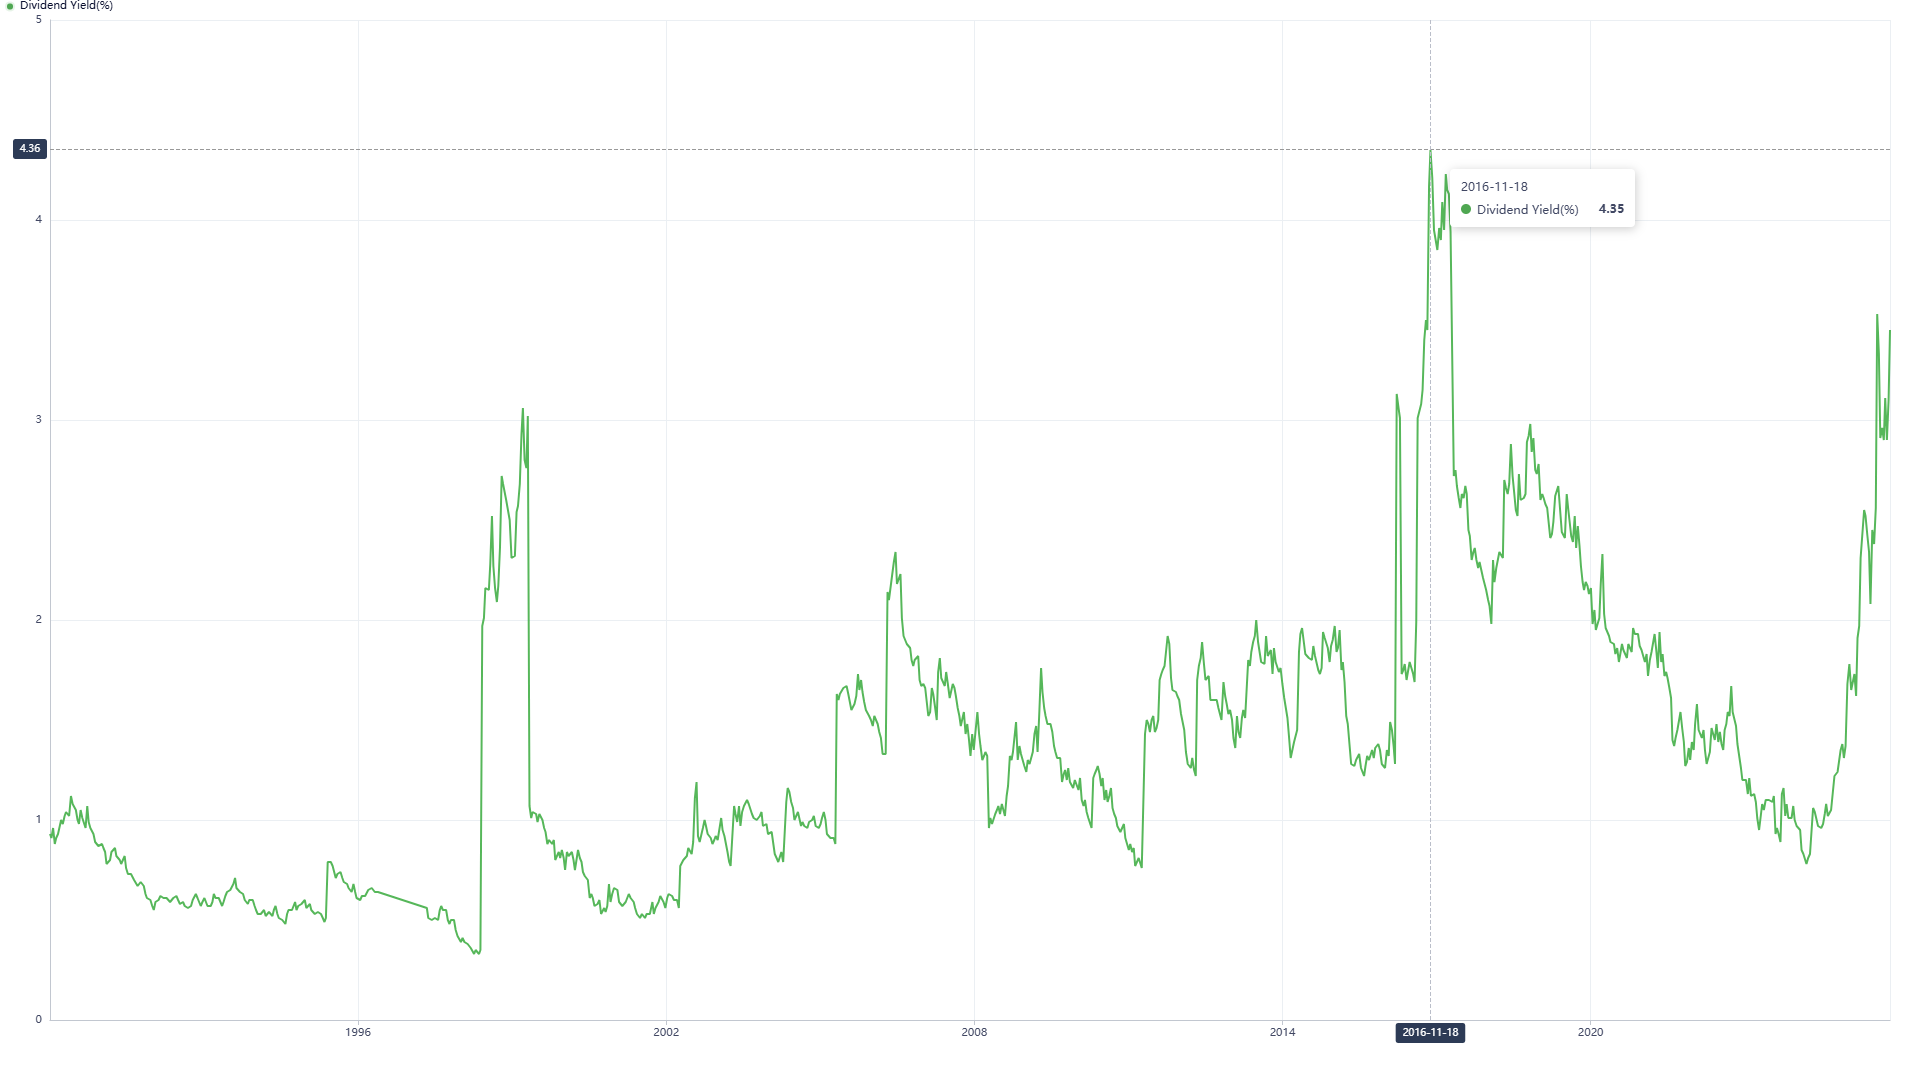
Novo is approaching the highest yield in 30 years, and its 30-year dividend streak is protected by a 50% payout ratio and AA-stable credit rating.
Novo: The Thesis Is Intact, and I’m Happy It’s A 5% Position in ZEUS.
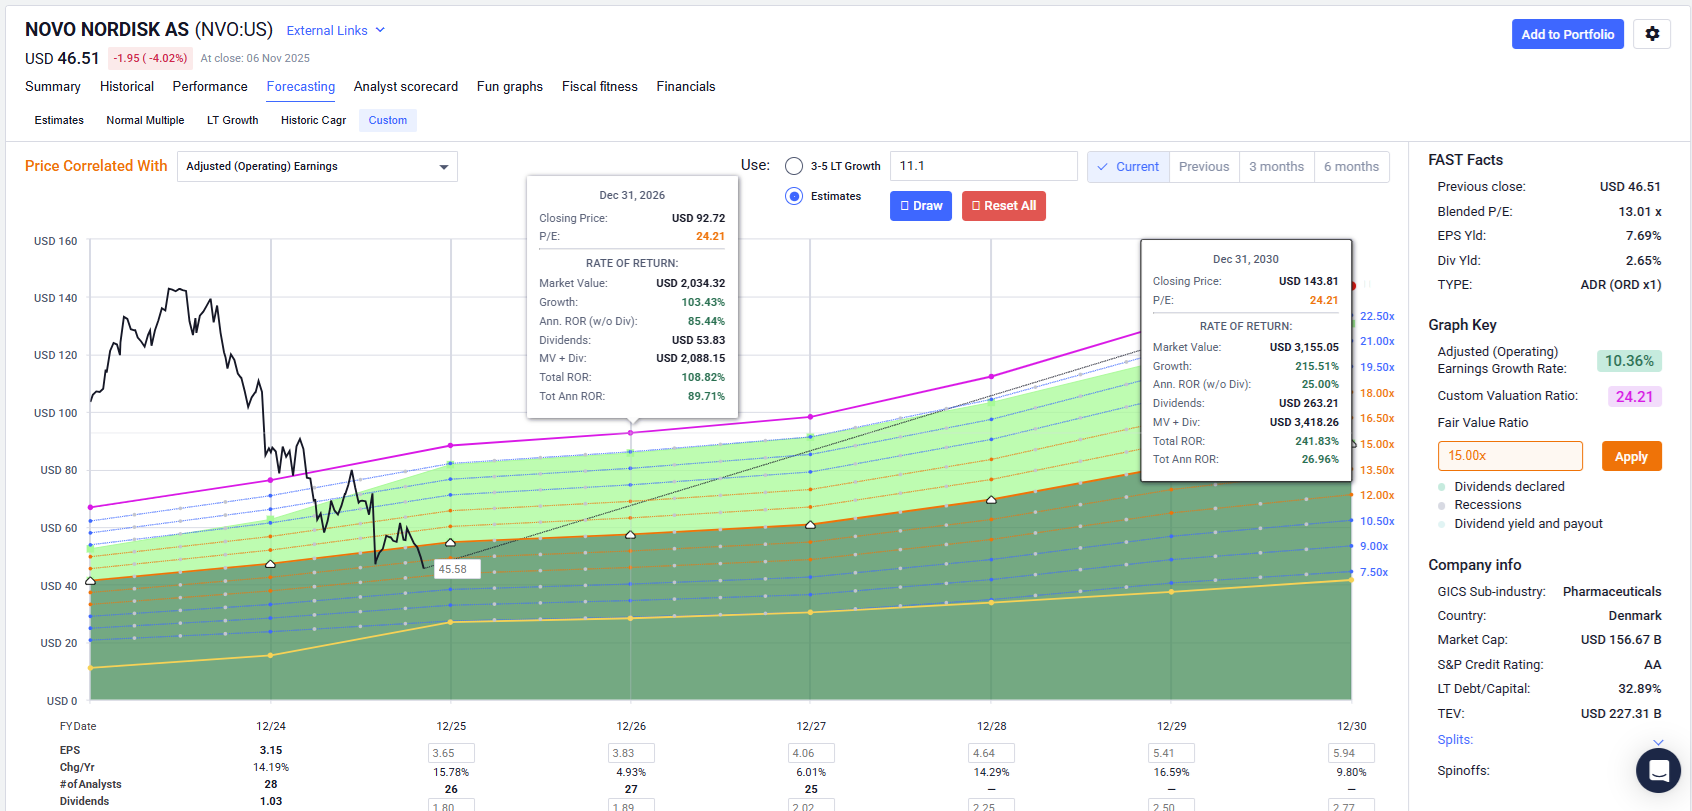
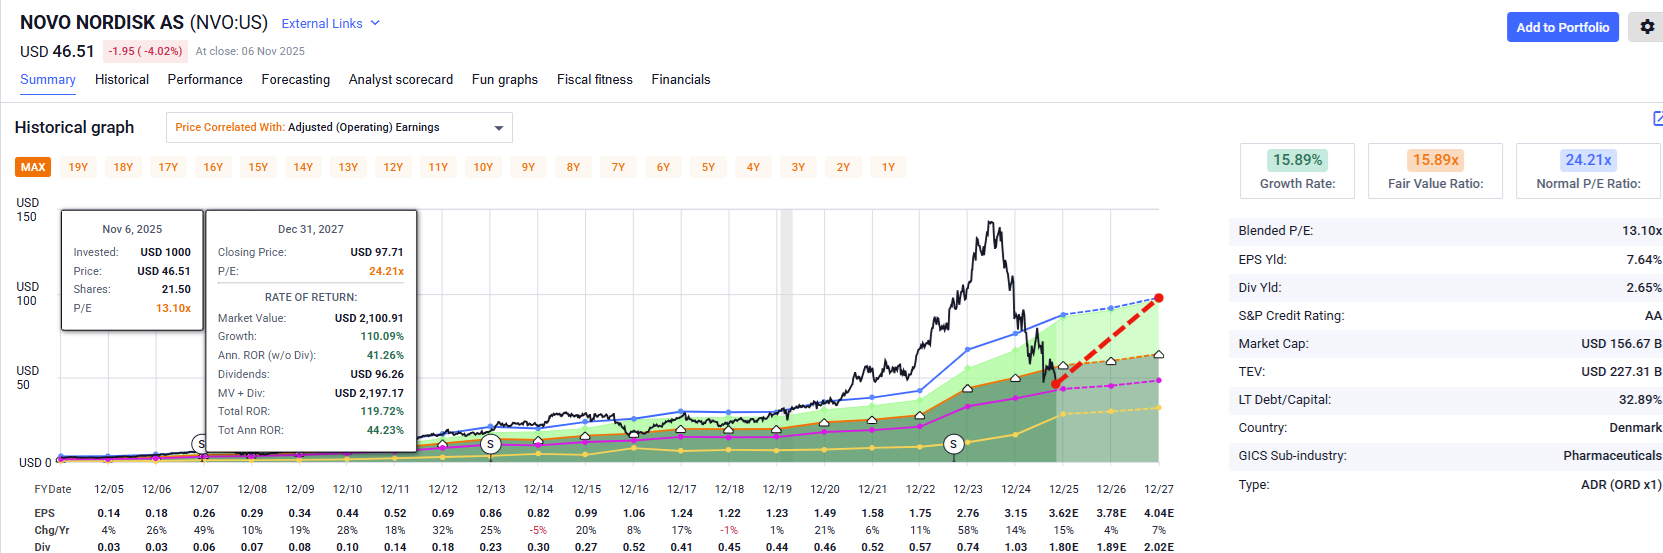
Morningstar’s 18.4 Fair Value PE: Still Buffett-like Returns of 21% CAGR

This is NVO from the current price of $45.58 as I write this.
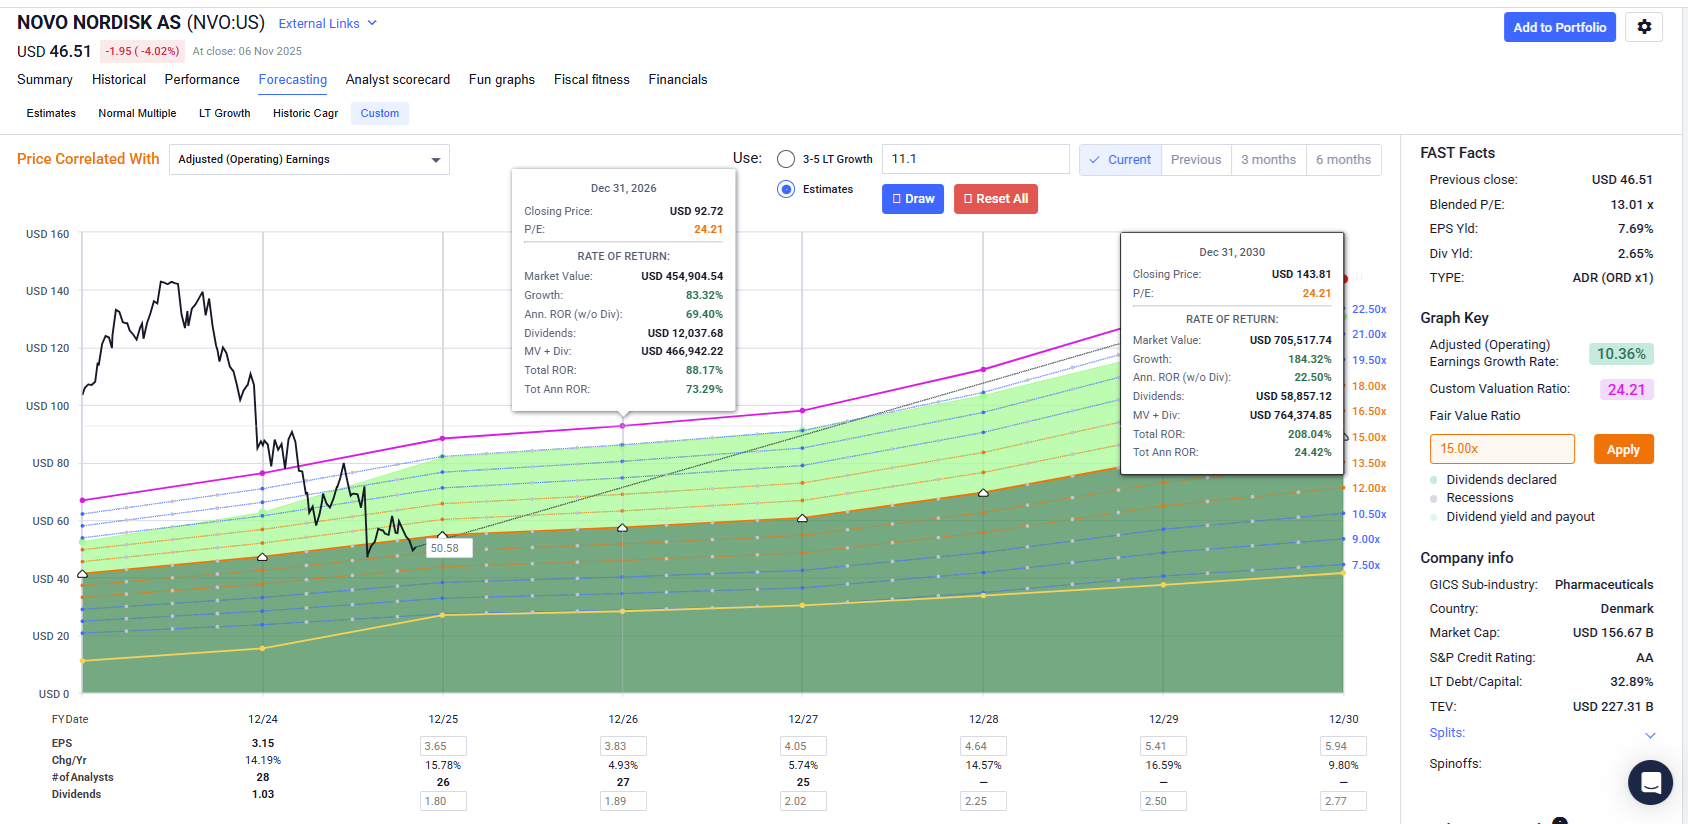
And here is what the ZEUS position looks like from our $50.58 cost basis.
It’s not just about me, the company, or the ZEUS family (including my future wife and kids), it’s about everyone’s kids🤗
Estimated Long-Term Impact Of Potential Novo Nordisk Profit
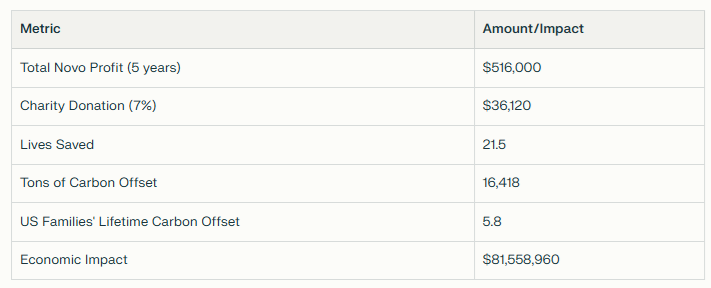
When you measure everything in basis points and babies saved, life gets a lot more interesting and meaningful.🤗
Economic Update: Still Strong Despite All The Headwinds
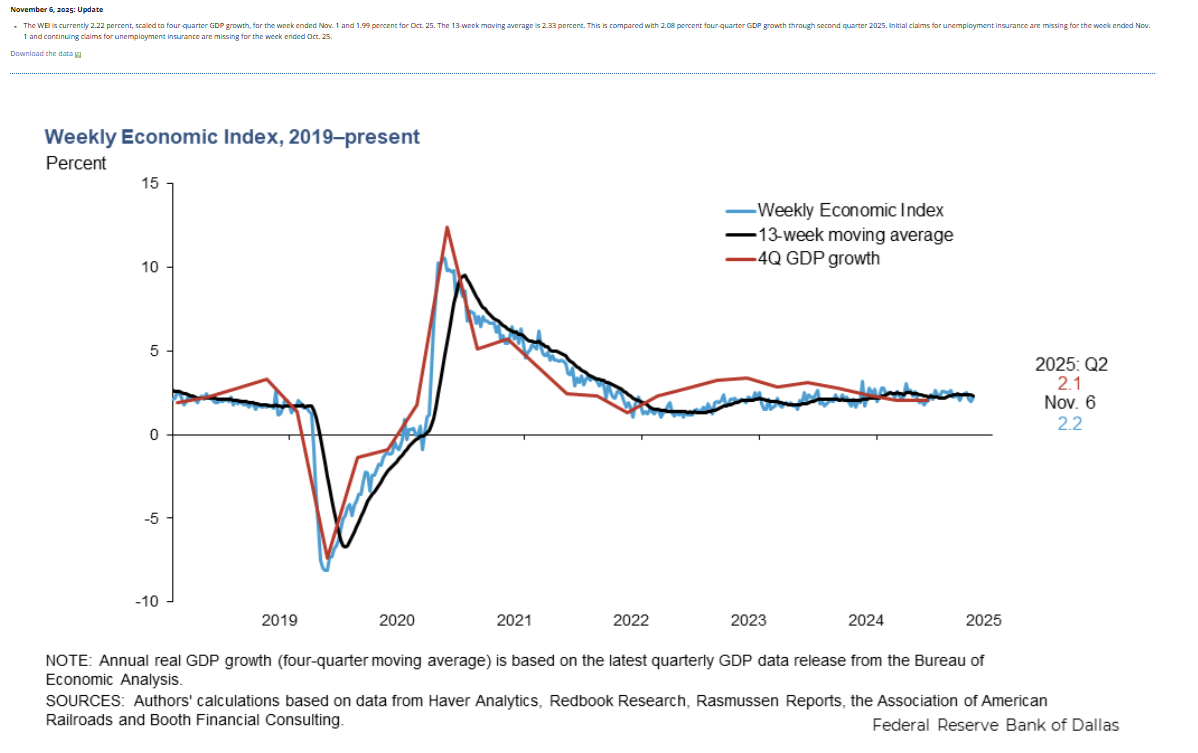
And here’s how the WEI looks zoomed in.
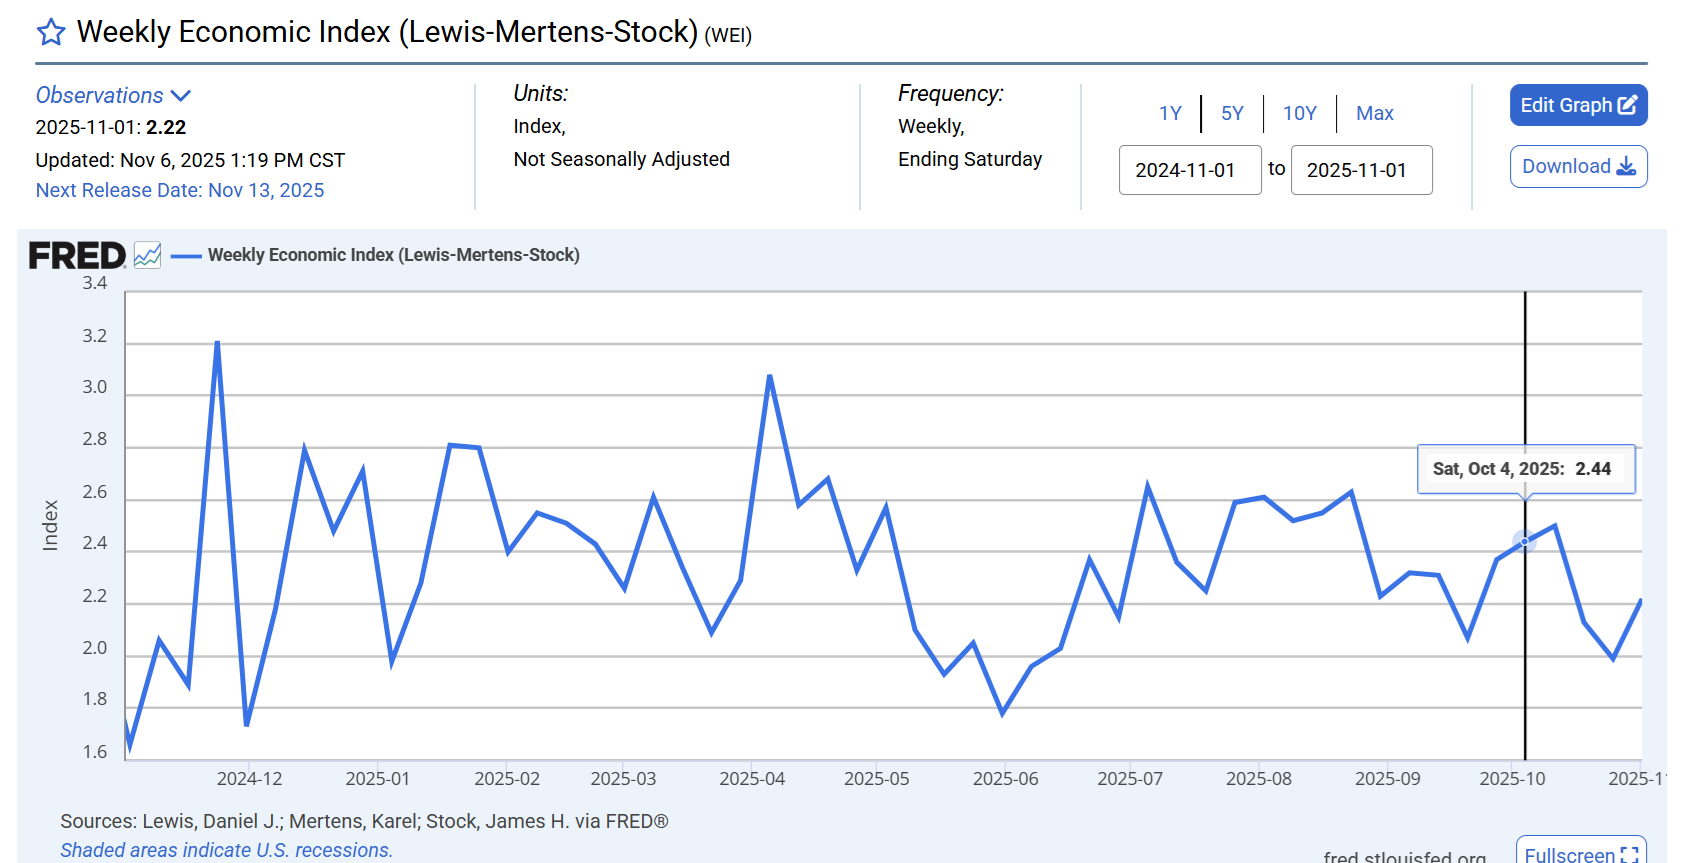
Since the shutdown began and growth was 2.44%, we’re now at 2.22%, so no significant damage, as far as this model shows.
Watch The Blue Chip Economists Race To Catch Up To The Real Time Data (Herding and Cover Your Ass😉)
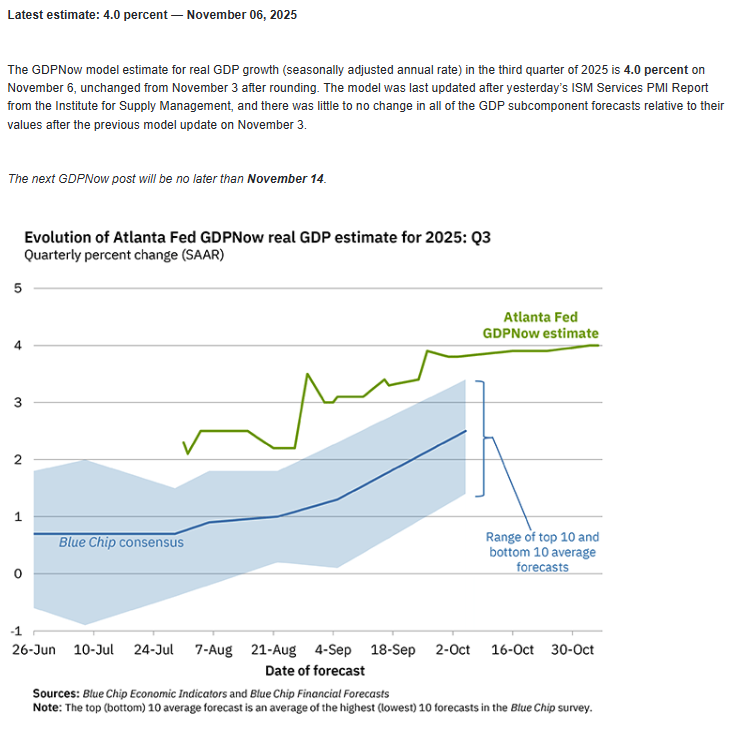
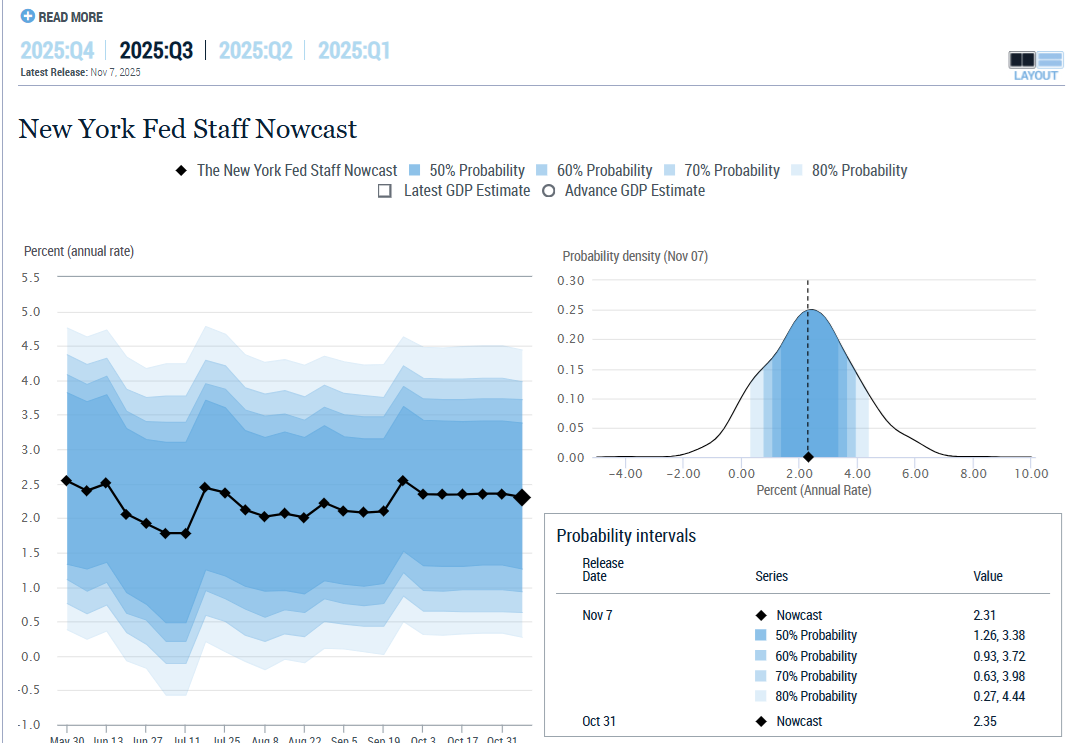
Q3 looks good at 2.3% (like WEI).
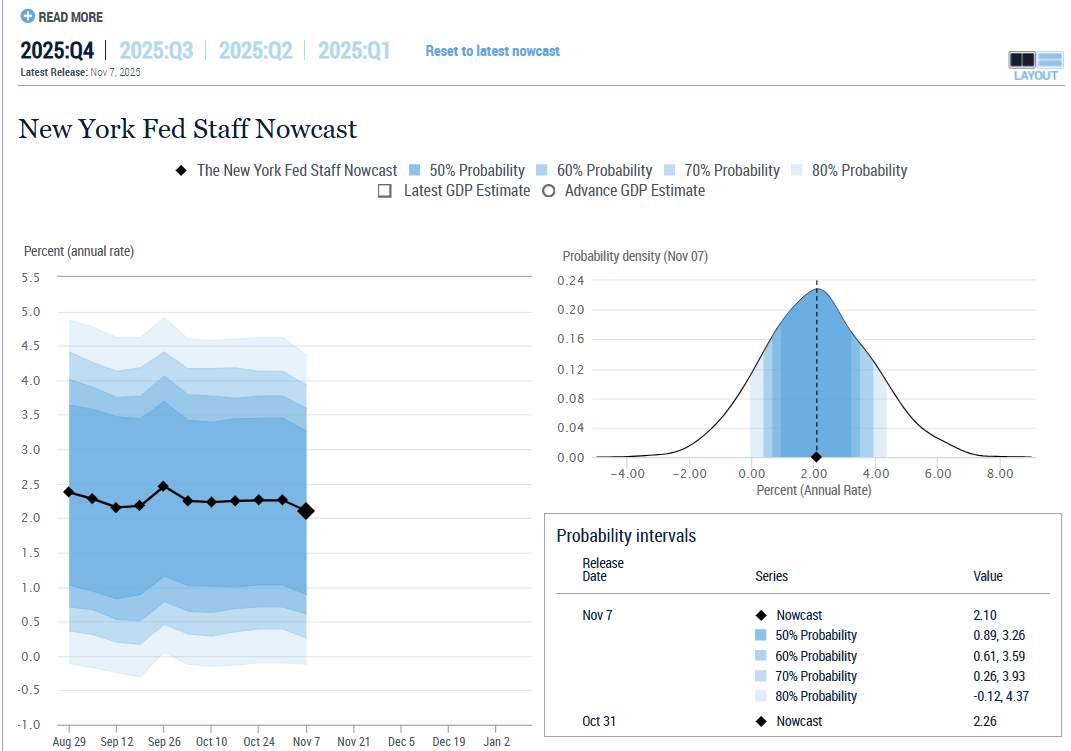
Q4 looks good too.
There is no evidence of a growth scare.
Regardless of what headlines might say, if growth is above 2% in real time and stable, it’s not a growth scare.
A 10% to 15% correction is perfectly normal (14% is the average peak decline since 1980 in any given year).
But unless growth is below 2% and declining, we’re not likely to get a 15% to 20% growth scare correction.
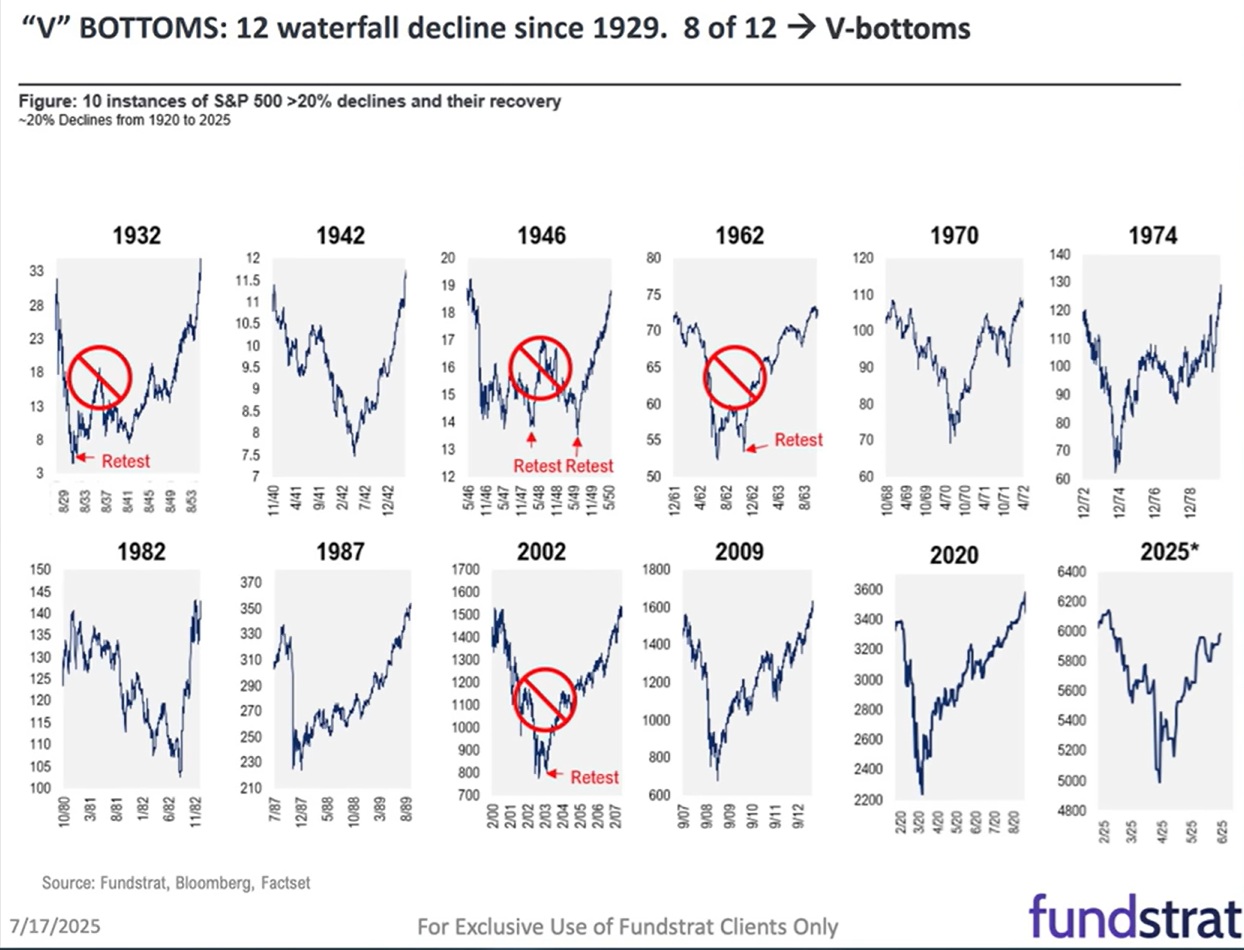
And if there is no negative growth? No recession? Then it’s a V-shaped recovery, at least historically speaking.
In 1987, the stock market fell 20% in a single day (Dow 22%), and the STOCK MARKET FINISHED UP THAT YEAR!
Have A Safe, Healthy, And Relaxing Weekend!