Part 1 closed on a single position. One stock, one put, one specific risk. That is a fine starting point and an unrealistic ending point, because most of you do not own one position. You own a book of ten to thirty positions of different sizes, different betas, and different theses. The question that actually keeps you up at night is how to protect that whole book without having to babysit a hedge on every name.
Below we will move from single-name hedging to portfolio-level hedging, using index puts as the instrument and beta as the unit of measurement. The mechanics are more involved. The conclusion is the same. Protection is conditional, not constant.
The back half of this paper introduces the concept that ties the rest of the series together.
Volatility itself is a tradeable input.
The gap between what the option market prices in advance and what the market actually delivers afterward is its own kind of edge, and most investors sit on the wrong side of it.
TL/DR. As of the May 26, 2026, close the variance risk premium runs above its long-run average, meaning insurance on the S&P is somewhat more expensive than the recent realized moves justify, while tail-protection premium remains elevated against a live Middle East risk calendar. The body of this paper walks through how to size a single index-put hedge against an entire portfolio using beta, why the choice of instrument (SPY vs QQQ vs SMH vs SPX) often matters more than the choice of strike, and a primer on implied versus realized volatility that sets up the rest of the series. After this educational arc, I will start publishing pieces on the strategies we are actually running internally.
Objective
One question, narrow and practical.
How do I hedge an entire portfolio without buying a put on every position I own?
Buying twenty individual puts on twenty individual positions is technically possible and operationally painful.
The transaction cost adds up, the management overhead per roll is meaningful, and a lot of the names you are insuring do not really need their own dedicated put.
Index puts solve this by treating your portfolio as one number. You measure how the whole book tends to move when the market moves, then buy a single instrument that gains value when the market falls. That is the entire mental model for this article.
This is, again, position-sizing under uncertainty, not market prediction. You are not claiming to know what the next quarter holds. You are deciding, in advance, how much of an adverse outcome you are willing to absorb at the level of the whole book.
From One Position to the Whole Book
The single-position framework from Part 1 quietly assumed that the position being hedged was big enough relative to the rest of the book that an individual put was justified. That assumption breaks at portfolio scale.
When thirty positions each occupy 3 to 5 percent of the book, no single name carries enough weight to do meaningful damage on its own. The risk that actually matters at the portfolio level is shared risk, the part of every position that moves with the market.
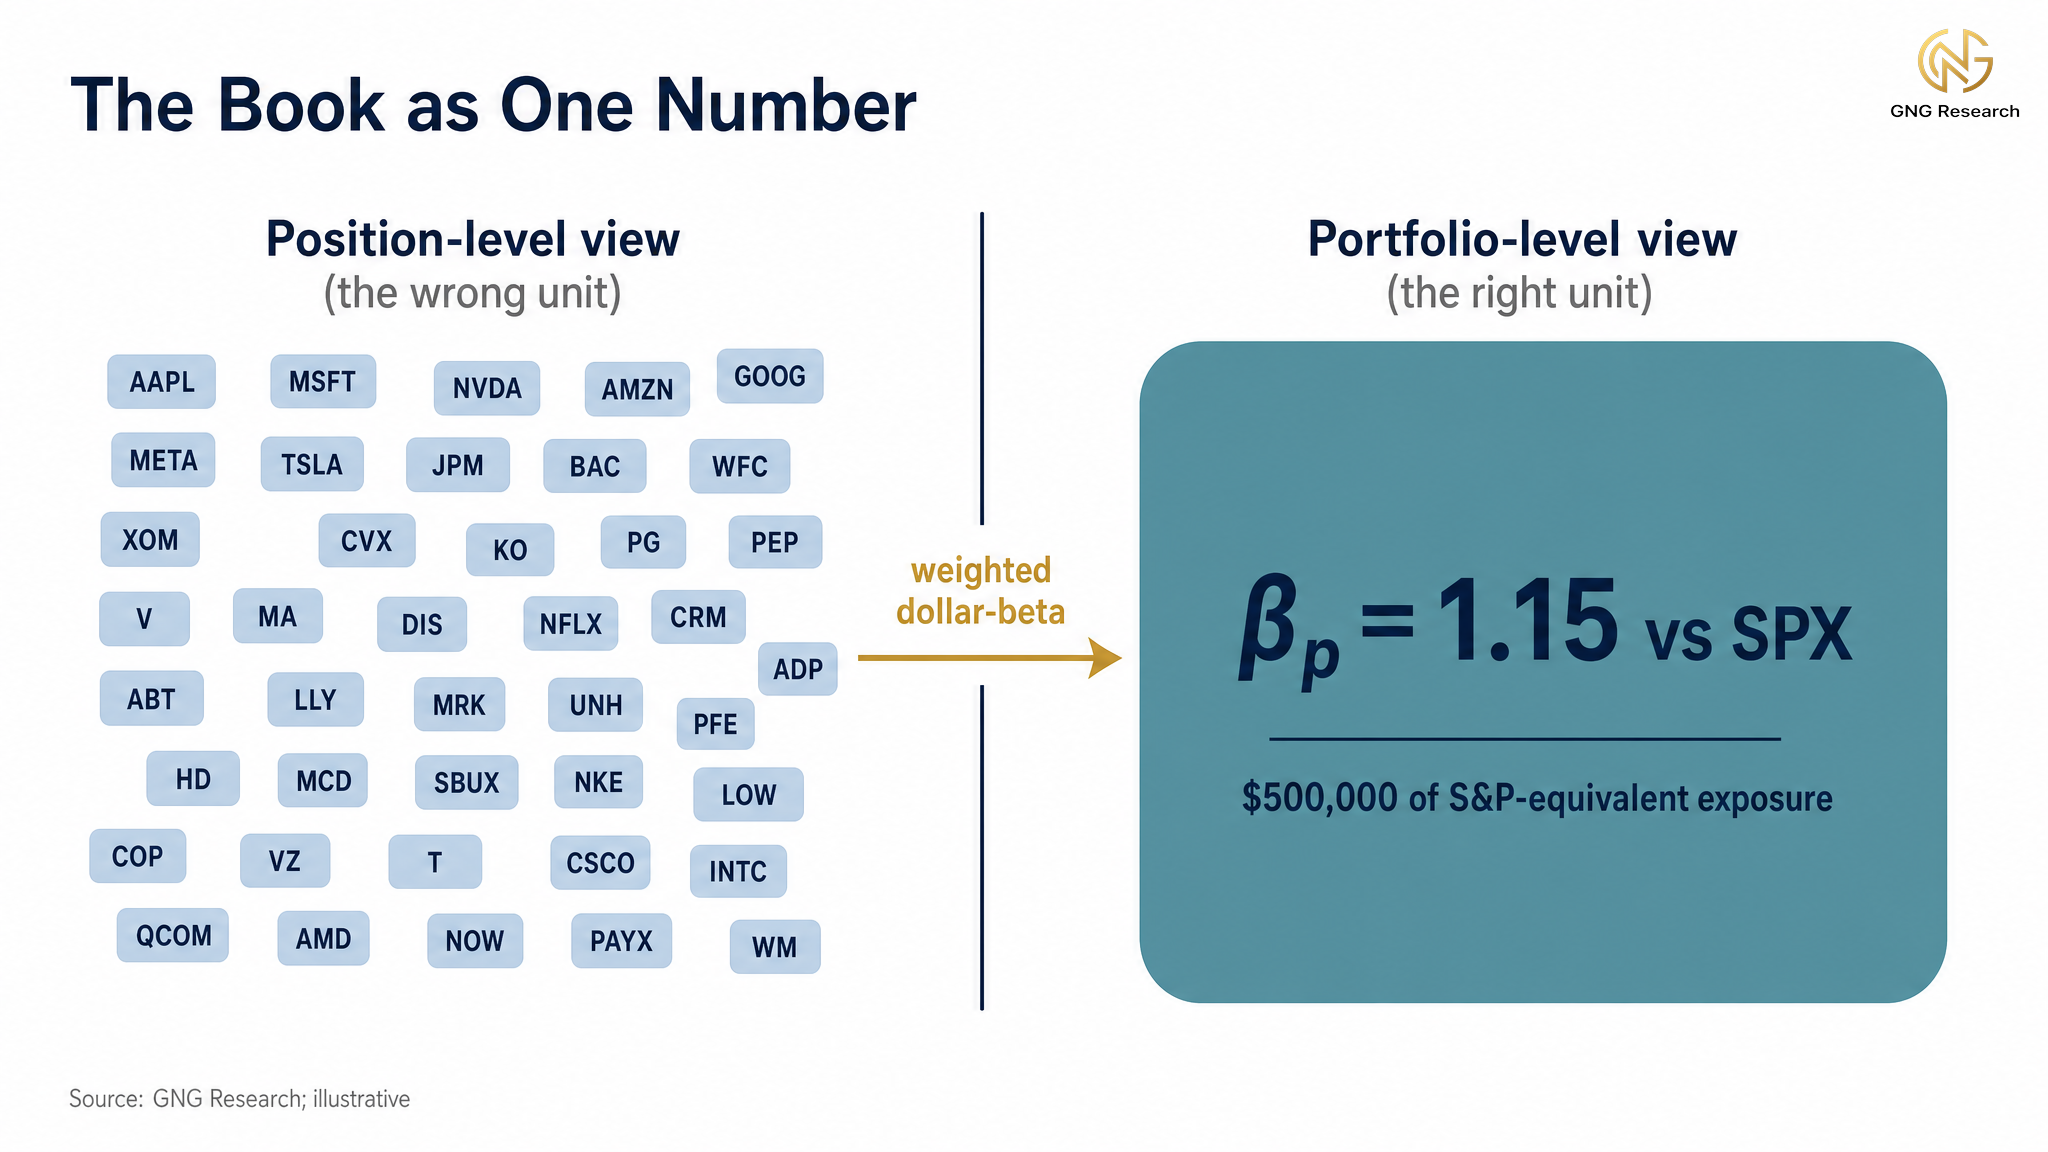
That shared risk is what beta measures. In plain English, beta is a single number telling you how much a stock tends to move when the whole market moves one percent. AAPL at a beta of 1.30 tends to move 1.3 percent for every 1 percent the S&P moves. JNJ at 0.55 moves about 0.55 percent for every 1 percent the S&P moves. Beta drifts through time, deliberately ignoring company-specific risk, and tightens in stress events as cross-stock correlations rise toward one. For the purpose of sizing a market hedge it is the right unit to use, with the stress-beta caveat covered in Practical Implementation Notes.
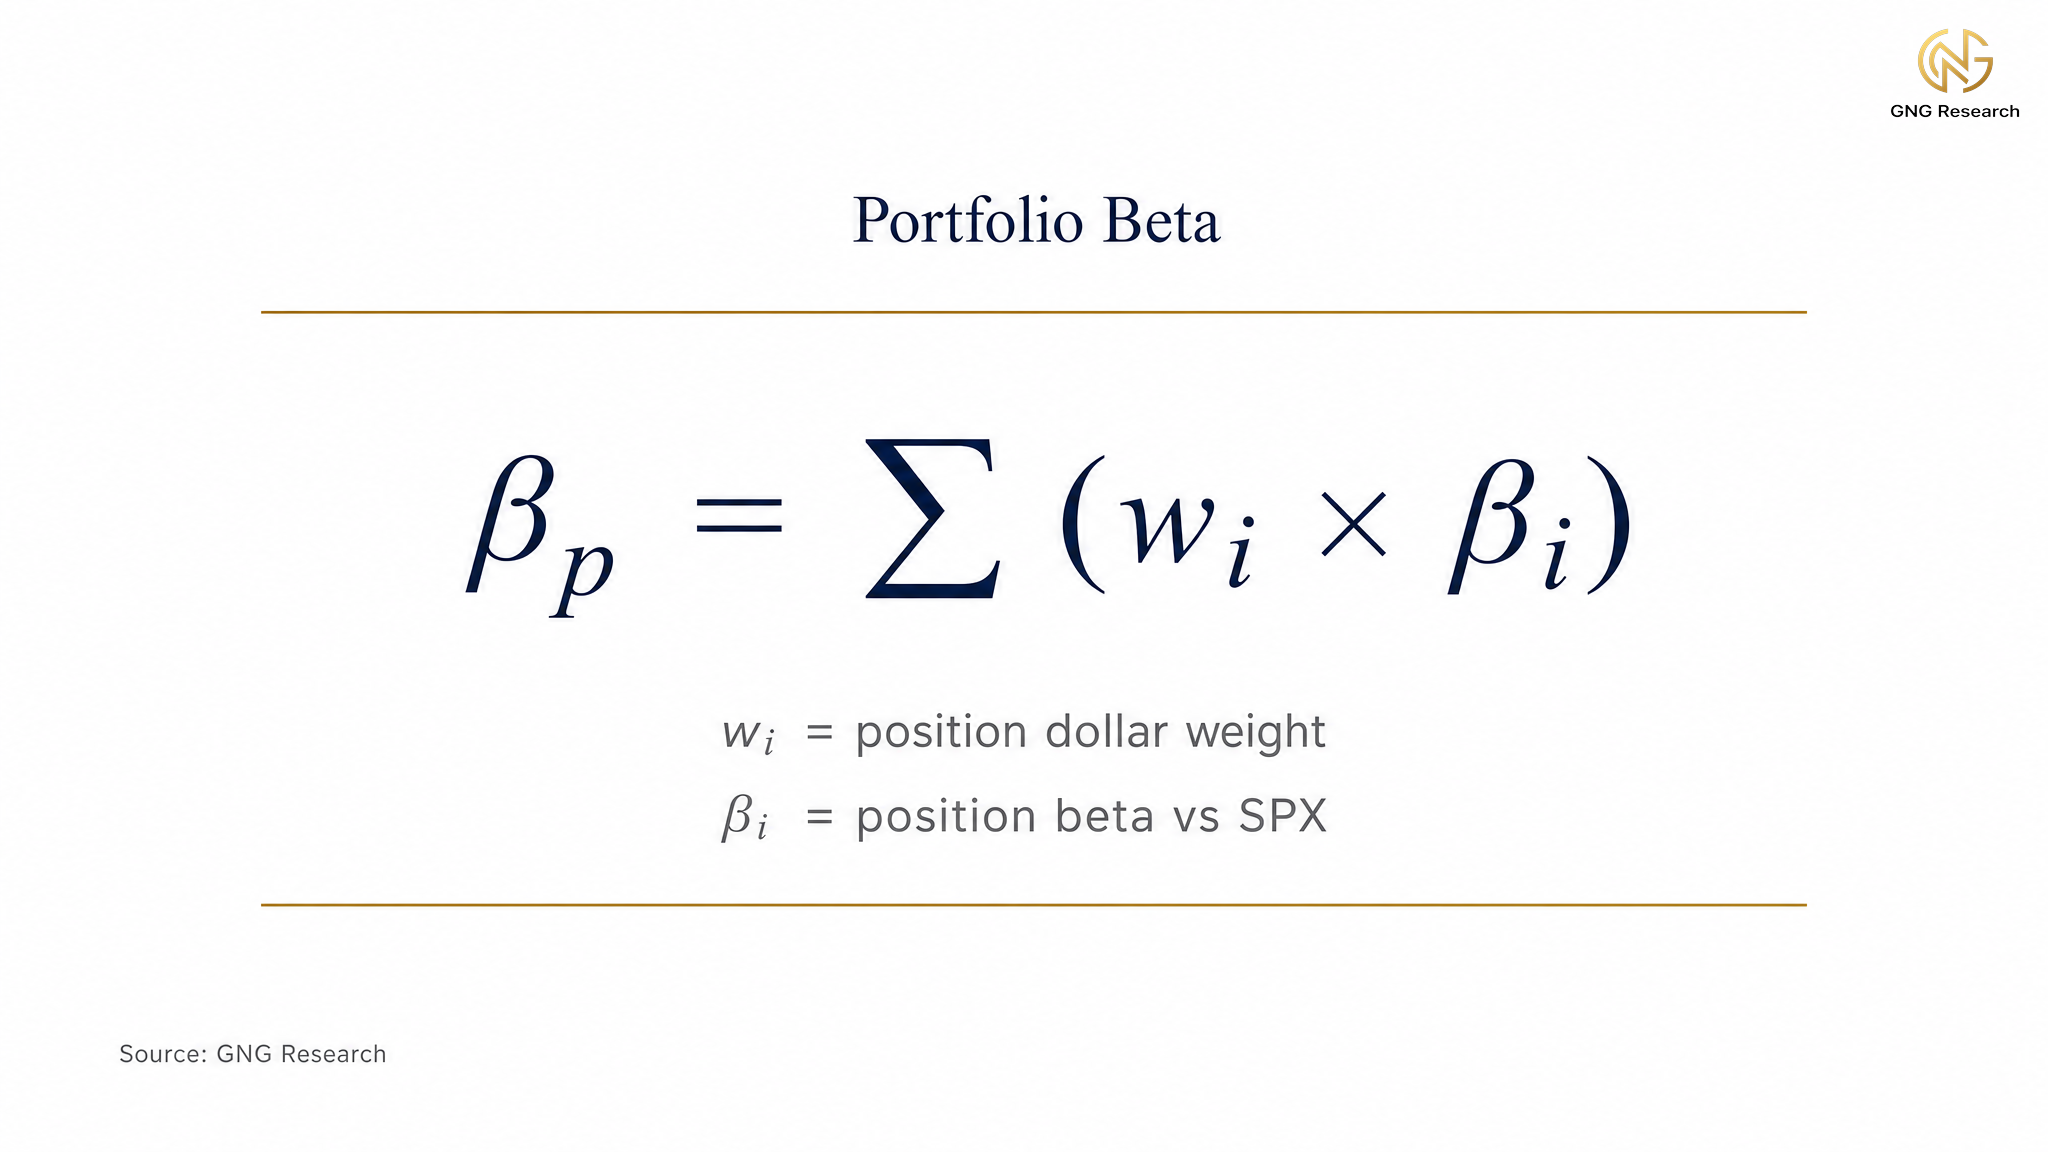
Your portfolio's beta is the dollar-weighted average of its components, bigger positions counting for more and smaller ones for less. That holds for a long-only equity book measured against a single benchmark. Options, leverage, or short positions change the arithmetic, but for a conventional long book it is the right unit.
Applied to a representative $500,000 book of seven positions, mostly large-cap with one defensive name (JNJ) and one broad-index allocation (VOO), the contributions add up to a market beta of 1.15. A 1 percent move in the S&P will tend to move this book by about 1.15 percent in the same direction.
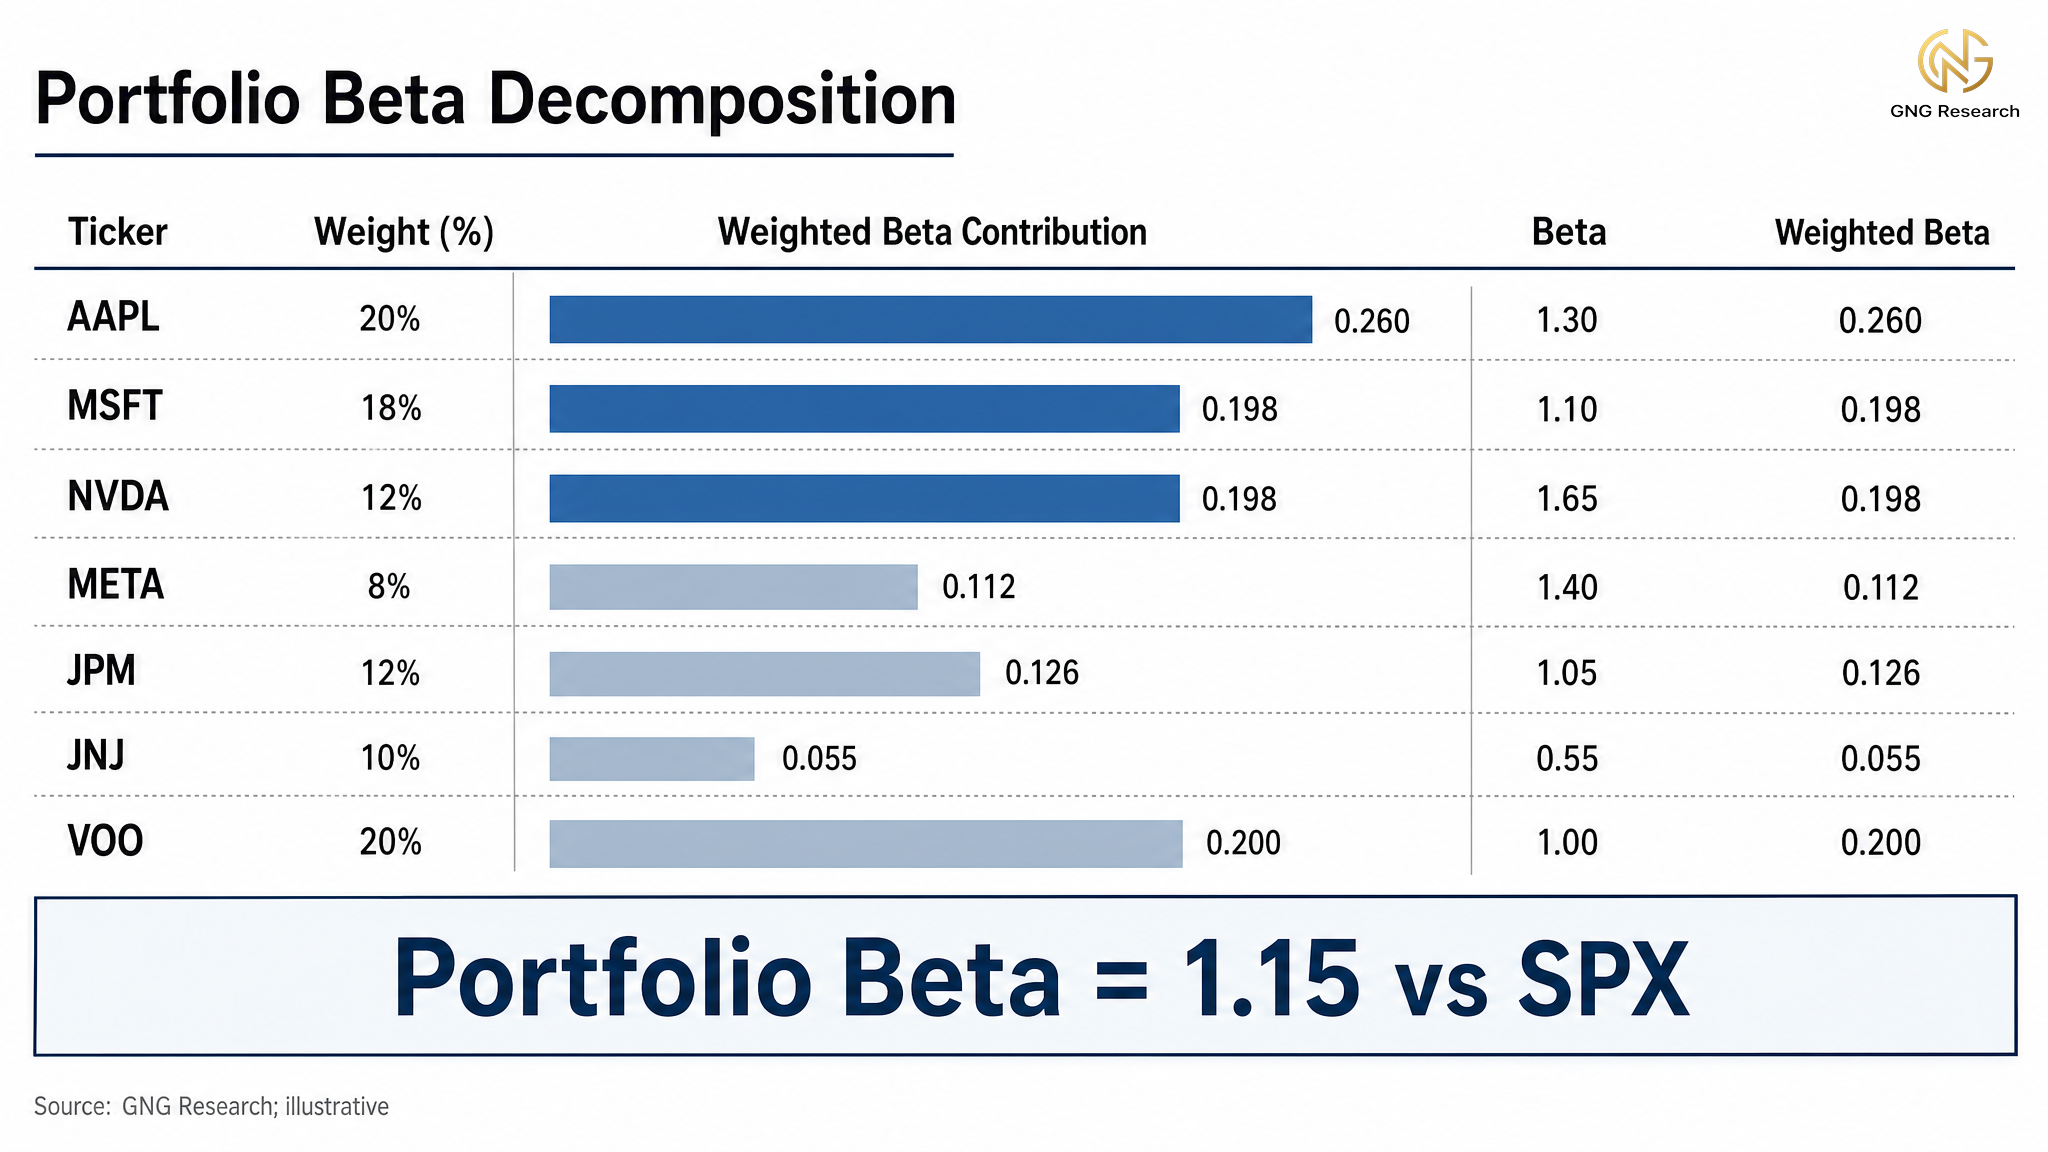
That single number is what you are actually hedging. Not seven positions individually, but one aggregate, 1.15 betas of S&P exposure sitting inside a $500,000 portfolio.
The Index Put Hedge
Once you know the portfolio's beta, sizing the hedge is one calculation. The question is how many contracts of an index put you would need to buy to offset that dollar-beta exposure.
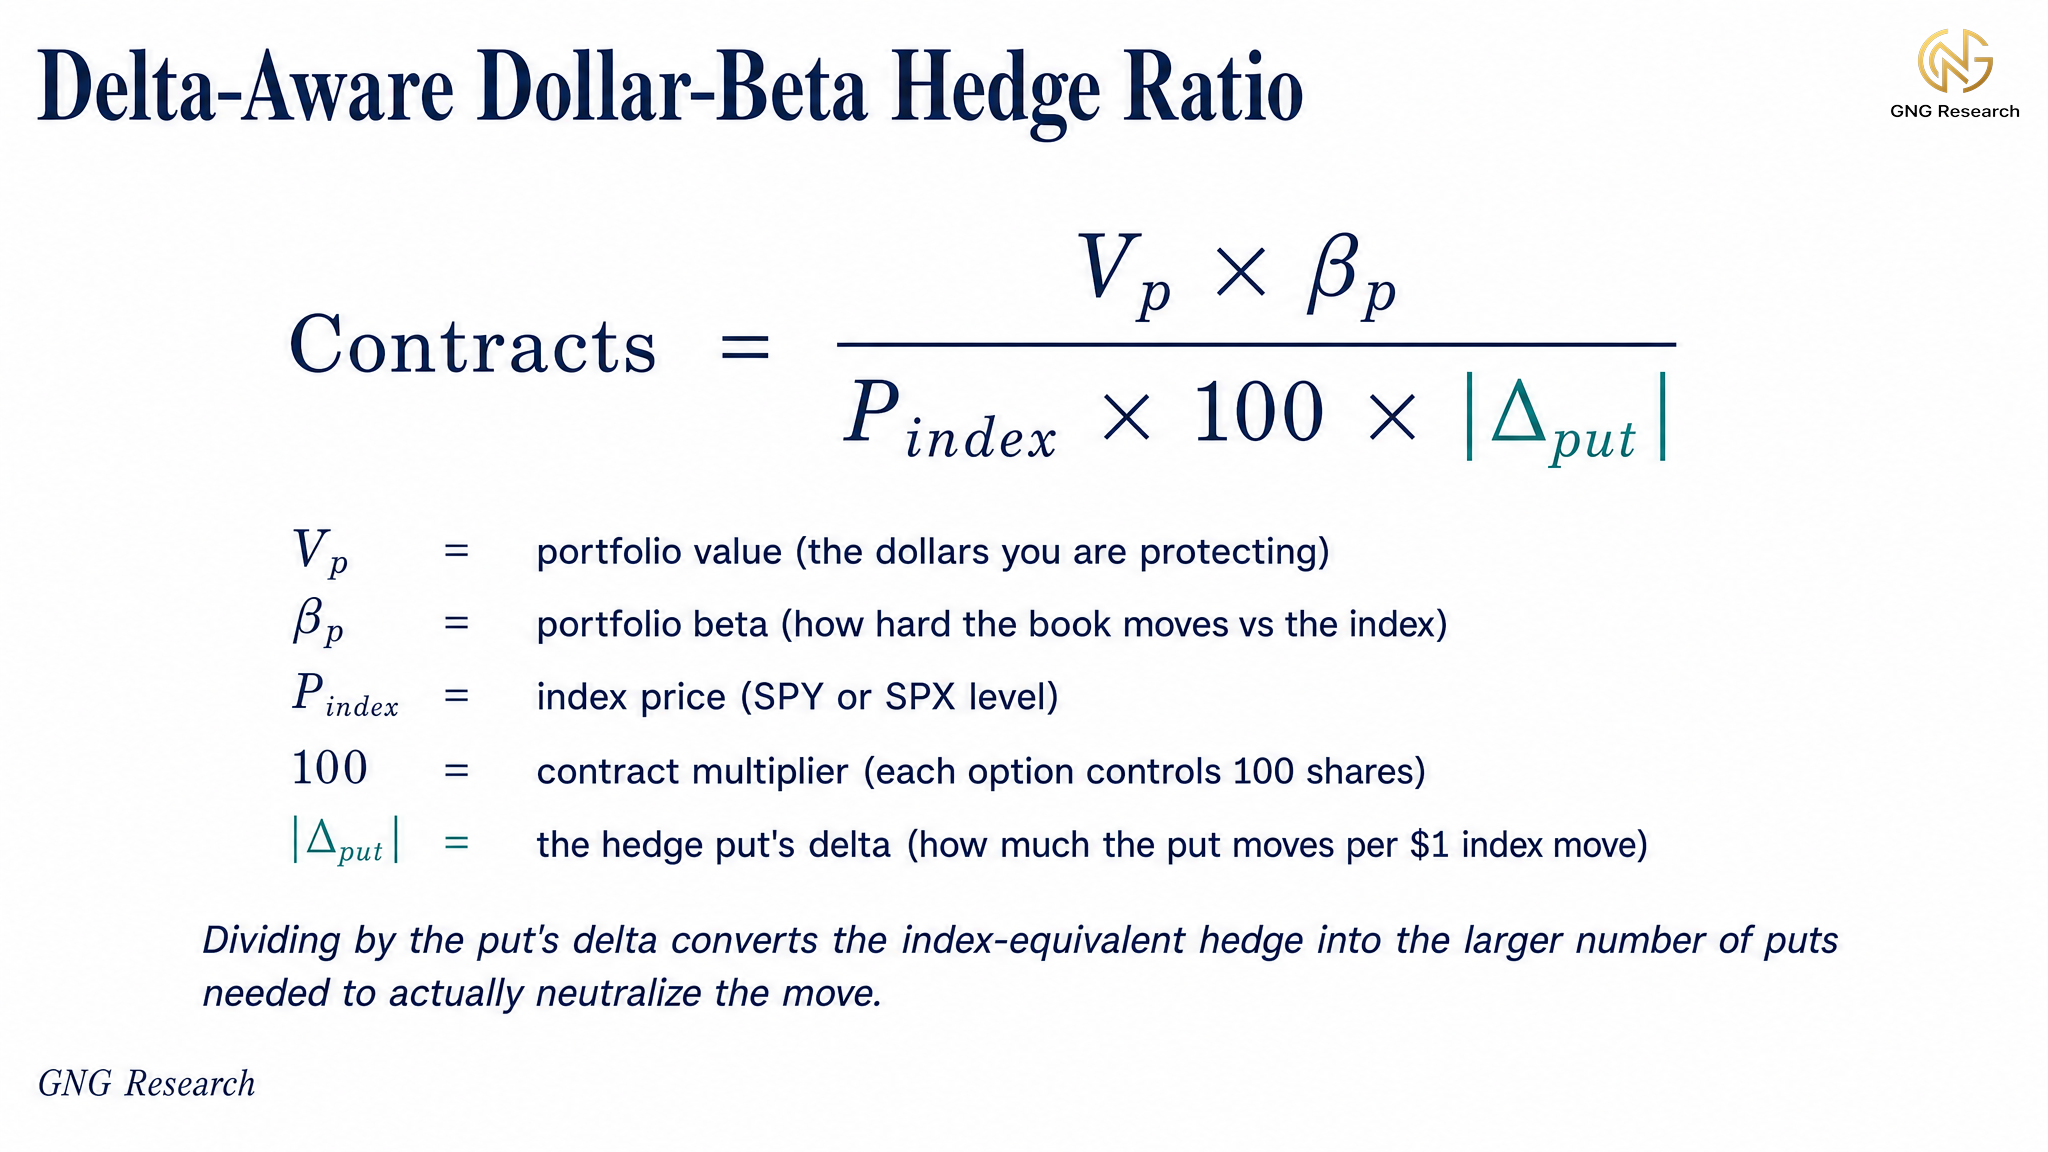
What the formula is really asking is this. How many index puts would you need to hold so that when the market falls, the puts gain back what the book gives up.
There is one wrinkle that trips up almost everyone new to this. A put does not move one-for-one with the index. Its sensitivity has a name, delta, the amount the option's price changes for each one-dollar move in the underlying. A put's delta runs between 0 and -1. The out-of-the-money hedge puts you buy for protection typically start around -0.30, meaning the put gains roughly thirty cents for every dollar the index falls. Only as the index drops and the put goes in the money does its delta march toward -1 and the put start to move dollar-for-dollar.
That is why sizing on notional alone under-hedges the early part of a move. Matching your book's dollar-beta with a contract that only pays thirty cents on the dollar leaves you short. To neutralize the move you divide by the put's delta, which scales the contract count up.
Applied to SPY trading near $752 against a $500K book at beta 1.15, the book's dollar-beta exposure is $500,000 times 1.15, or $575,000. Sized as if the put moved one-for-one, that is about 8 contracts. Dividing by a 30-delta put's -0.30 delta lifts it to the number you would actually buy.
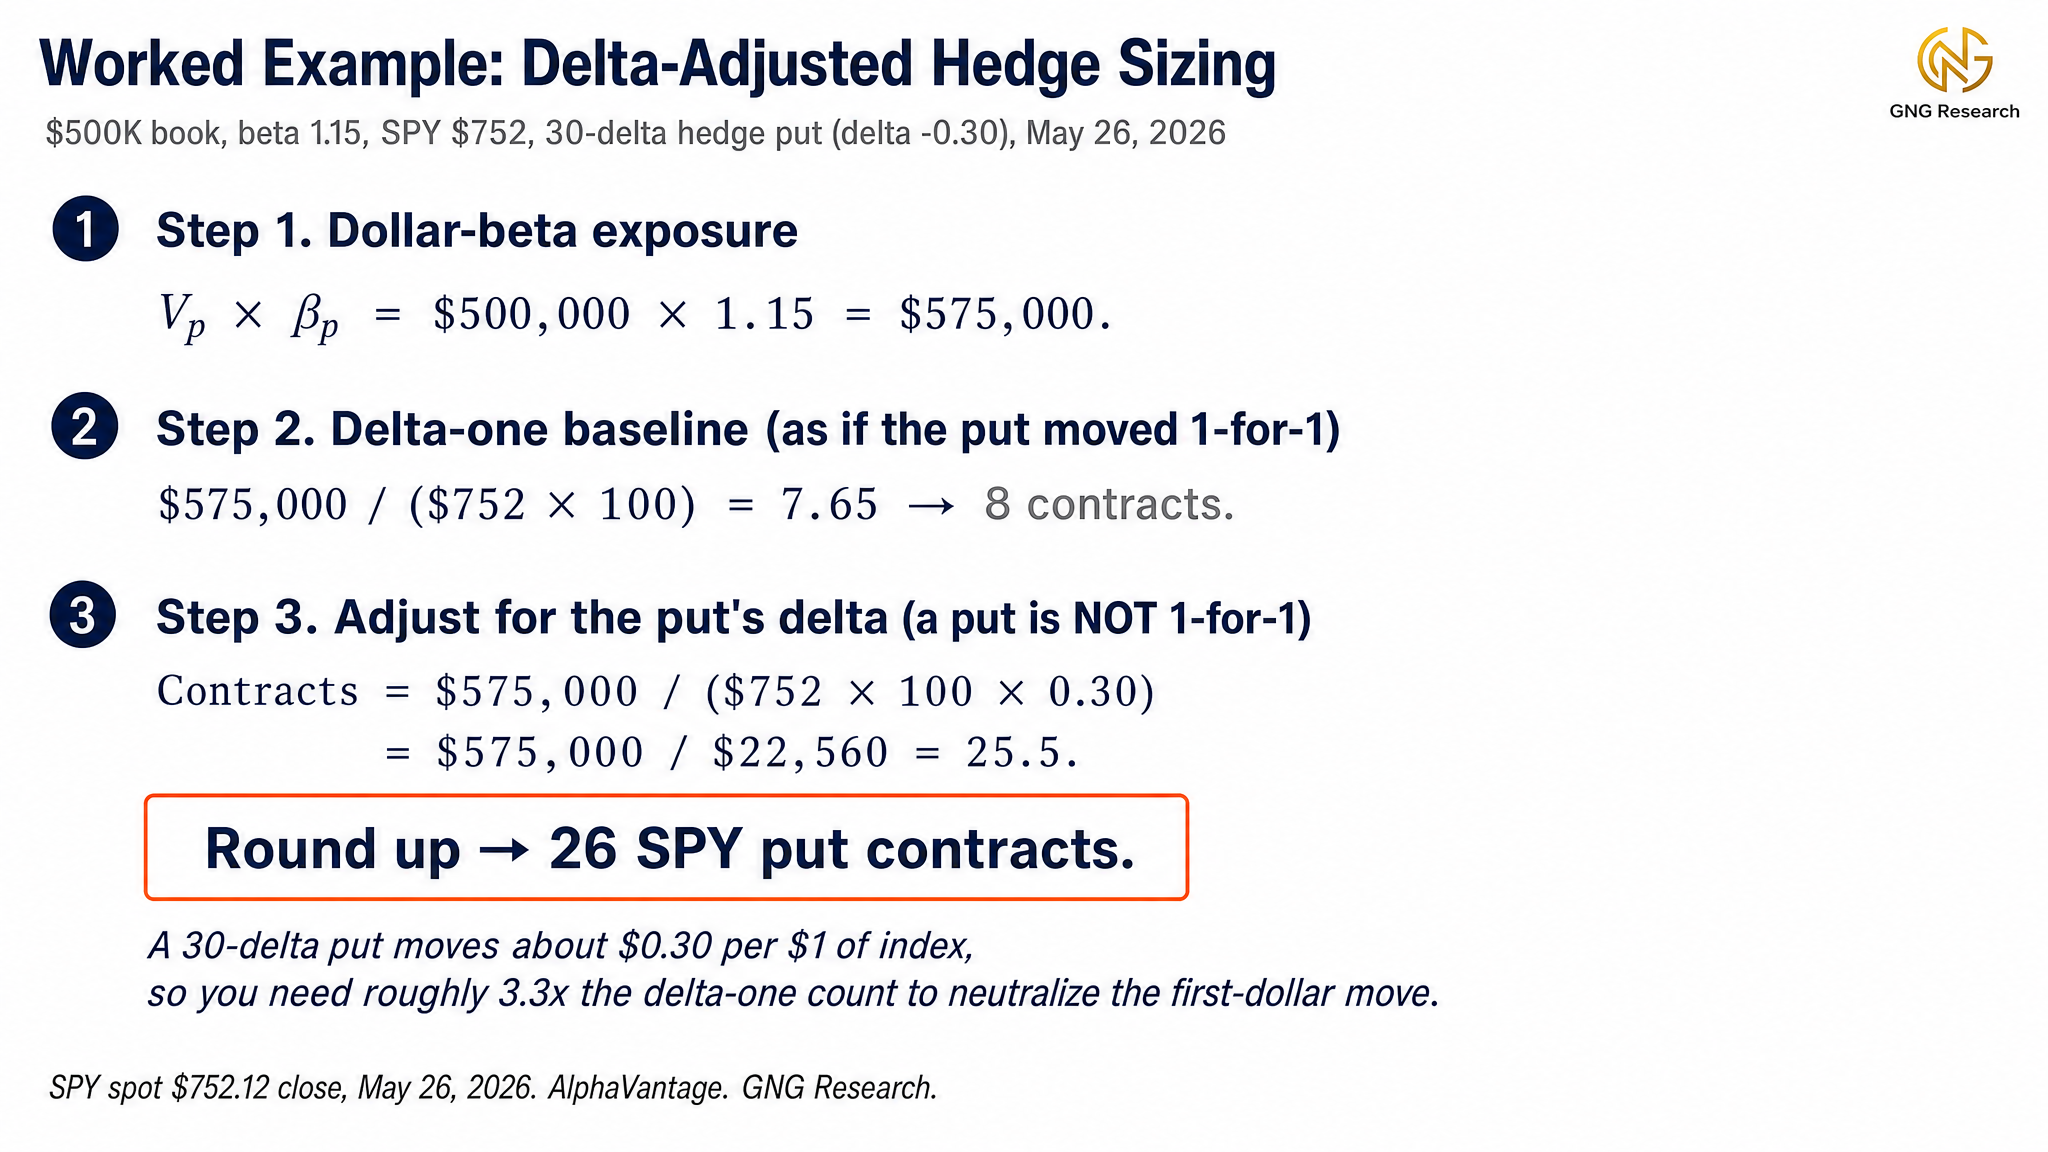
Rounded up to the next whole contract, 26 SPY puts size a full delta-adjusted hedge against this book at today's marks, roughly 3.3 times the 8-contract delta-one baseline. That multiple is simply one divided by the put's delta. A deeper put with a -0.50 delta would need closer to 16 contracts. A far out-of-the-money put with a -0.20 delta would need more than 38.
That count is a snapshot. The 26 puts neutralize the book's first-order market exposure at today's spot and today's delta, no more. Delta, gamma, and the book's own beta all drift as the market moves and time passes, so a standing hedge is rebalanced, not set once (the roll and delta-threshold mechanics live in Practical Implementation Notes). Convexity is what works in your favor as a move develops. Because each put's delta climbs toward -1 as the market falls, the hedge gains delta precisely as the drawdown deepens, so you hold first-order protection now and pick up convexity as the selloff runs. How much of the book's loss that convexity actually offsets depends on the size and path of the move and on what implied volatility does alongside it.
The catch is cost. Buying 26 puts rather than 8 means roughly 3.3 times the premium, which is why almost nobody carries a full delta-adjusted hedge for long. That tension, full protection against full cost, is the subject of the next two sections.
Pick the Right Index, Not Just the Right Strike
SPY is the default because most diversified books correlate reasonably well with it. It is not always the right choice.
A portfolio dominated by mega-cap technology is hedged more efficiently with QQQ puts than with SPY puts.
The Nasdaq-100 is roughly 55 percent information technology with another 15 percent in communication services, so a book heavy in names like NVDA, AAPL, MSFT, META, GOOGL, and AMD is really a tilt on QQQ in disguise.
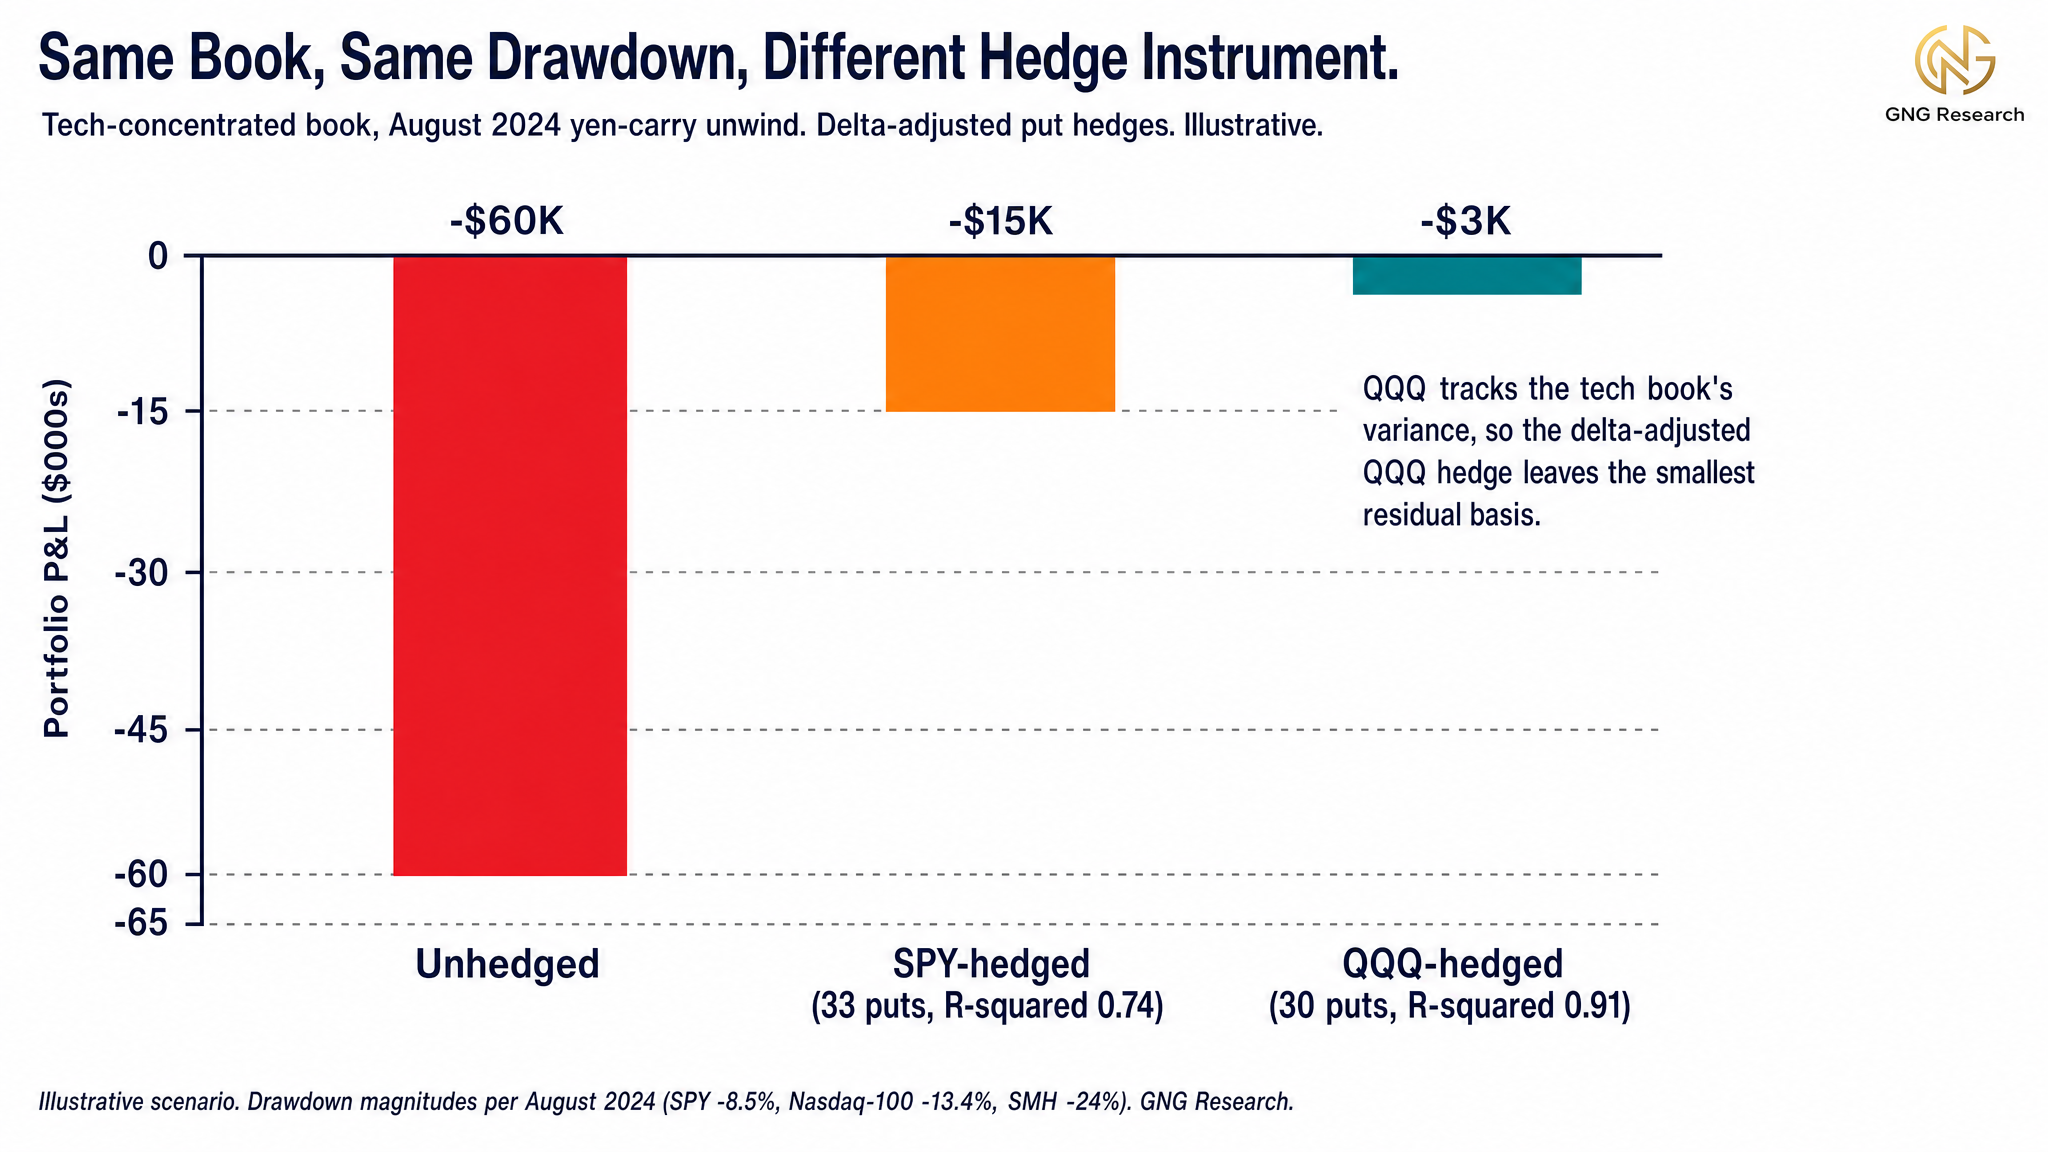
Regressing such a book against SPY makes it look more diversified than it actually is, because all the financials, energy, and staples noise on the other side of the equation muddies the relationship. Regress the same book against QQQ and the R-squared (the share of your book's variance the index explains) typically jumps from around 0.74 to above 0.90.
The August 2024 yen-carry unwind is the cleanest historical reference. From the mid-July peak to the August 5 close, SPY fell roughly 8.5 percent, the Nasdaq-100 (QQQ) fell about 13.4 percent, and SMH (semiconductors) fell close to 24 percent from its prior high. A tech-concentrated book hedged with SPY puts only picked up the broad-market move and left a meaningful share of the actual drawdown uncovered. The same book hedged with QQQ puts of equivalent dollar-beta sizing picked up most of it.
The lesson generalizes. The index with the highest explanatory power for your book's returns has historically been the better-matched hedge, though liquidity, skew depth, exercise style, and tax treatment can matter as much in practice.
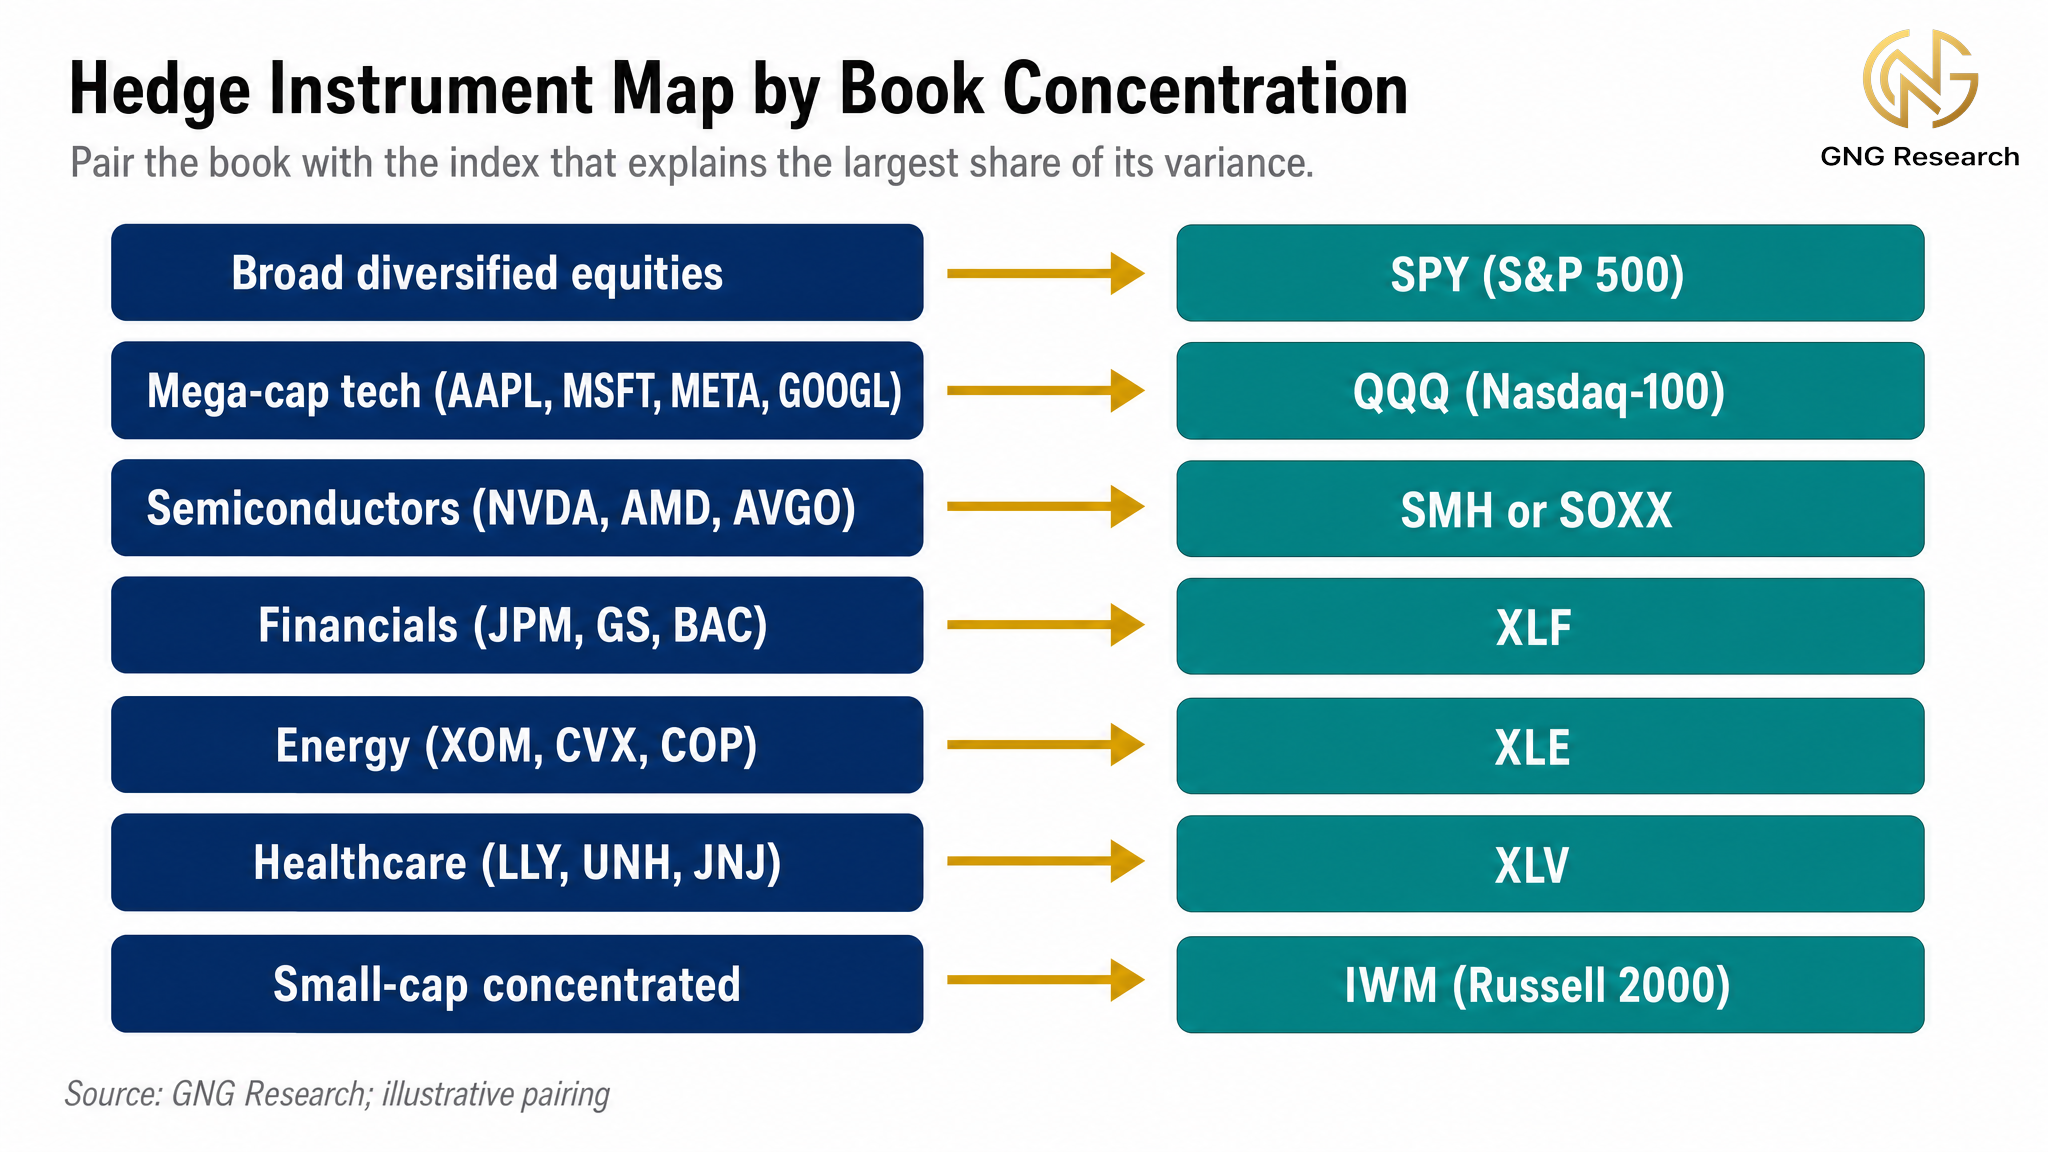
The same logic that pairs a technology-heavy book with QQQ pairs a semiconductor-heavy book with SMH, a financials concentration with XLF, an energy tilt with XLE, healthcare with XLV, and a small-cap focus with IWM.
The dollar-beta formula works in most cases. Only the ticker changes.
At larger portfolio sizes the practical choice shifts from SPY to SPX, even when QQQ posts a higher R-squared on the book's returns. SPX options are European-exercise and cash-settled, so there is no early-assignment risk on any short put leg in a structured trade, and settlement is in cash against the index print rather than by delivery of shares. SPX options are also Section 1256 contracts, which produces 60 percent long-term and 40 percent short-term tax treatment regardless of holding period, on the order of a $10K reduction in federal tax on a $100K profit at a top marginal bracket. SPY options carry neither of those features, they settle by share delivery and are taxed as ordinary equity options. For an institutionally sized book the SPX product set is often the more useful hedge venue once R-squared, liquidity, exercise style, and tax treatment are weighed together.
Partial Hedges
A full dollar-beta hedge offsets 100 percent of the book's expected market exposure. That is rarely what you actually want. It is the most expensive option and it removes most of the upside that made you build the portfolio in the first place.
In practice, I rarely see anyone running a full 100 percent hedge for long. Most disciplined investors scale into protection as conviction in the regime rises.
Against the same $500K book at beta 1.15, the delta-adjusted counts scale linearly.
100 percent hedge, 26 contracts
50 percent hedge, 13 contracts
25 percent hedge, 7 contracts
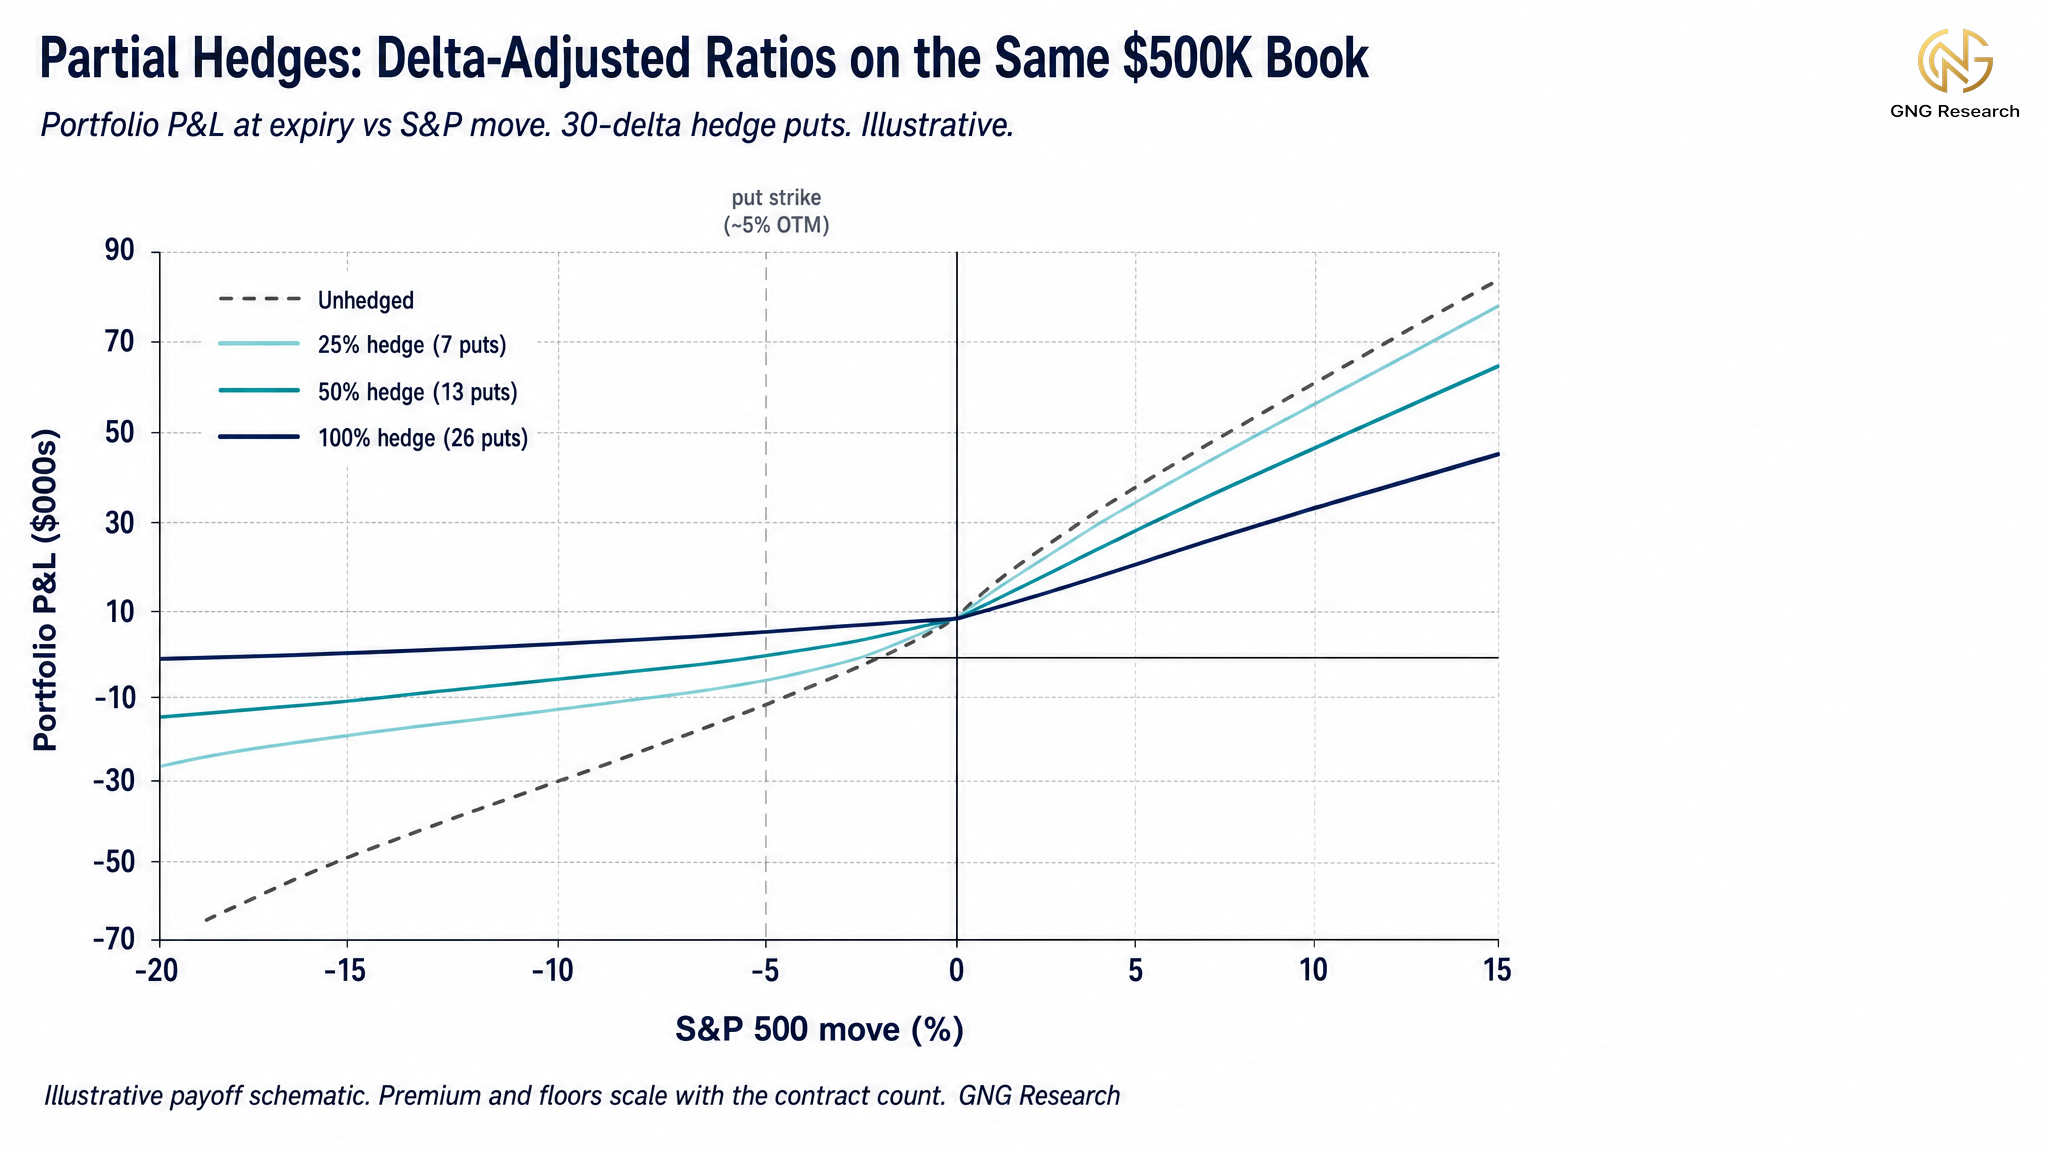
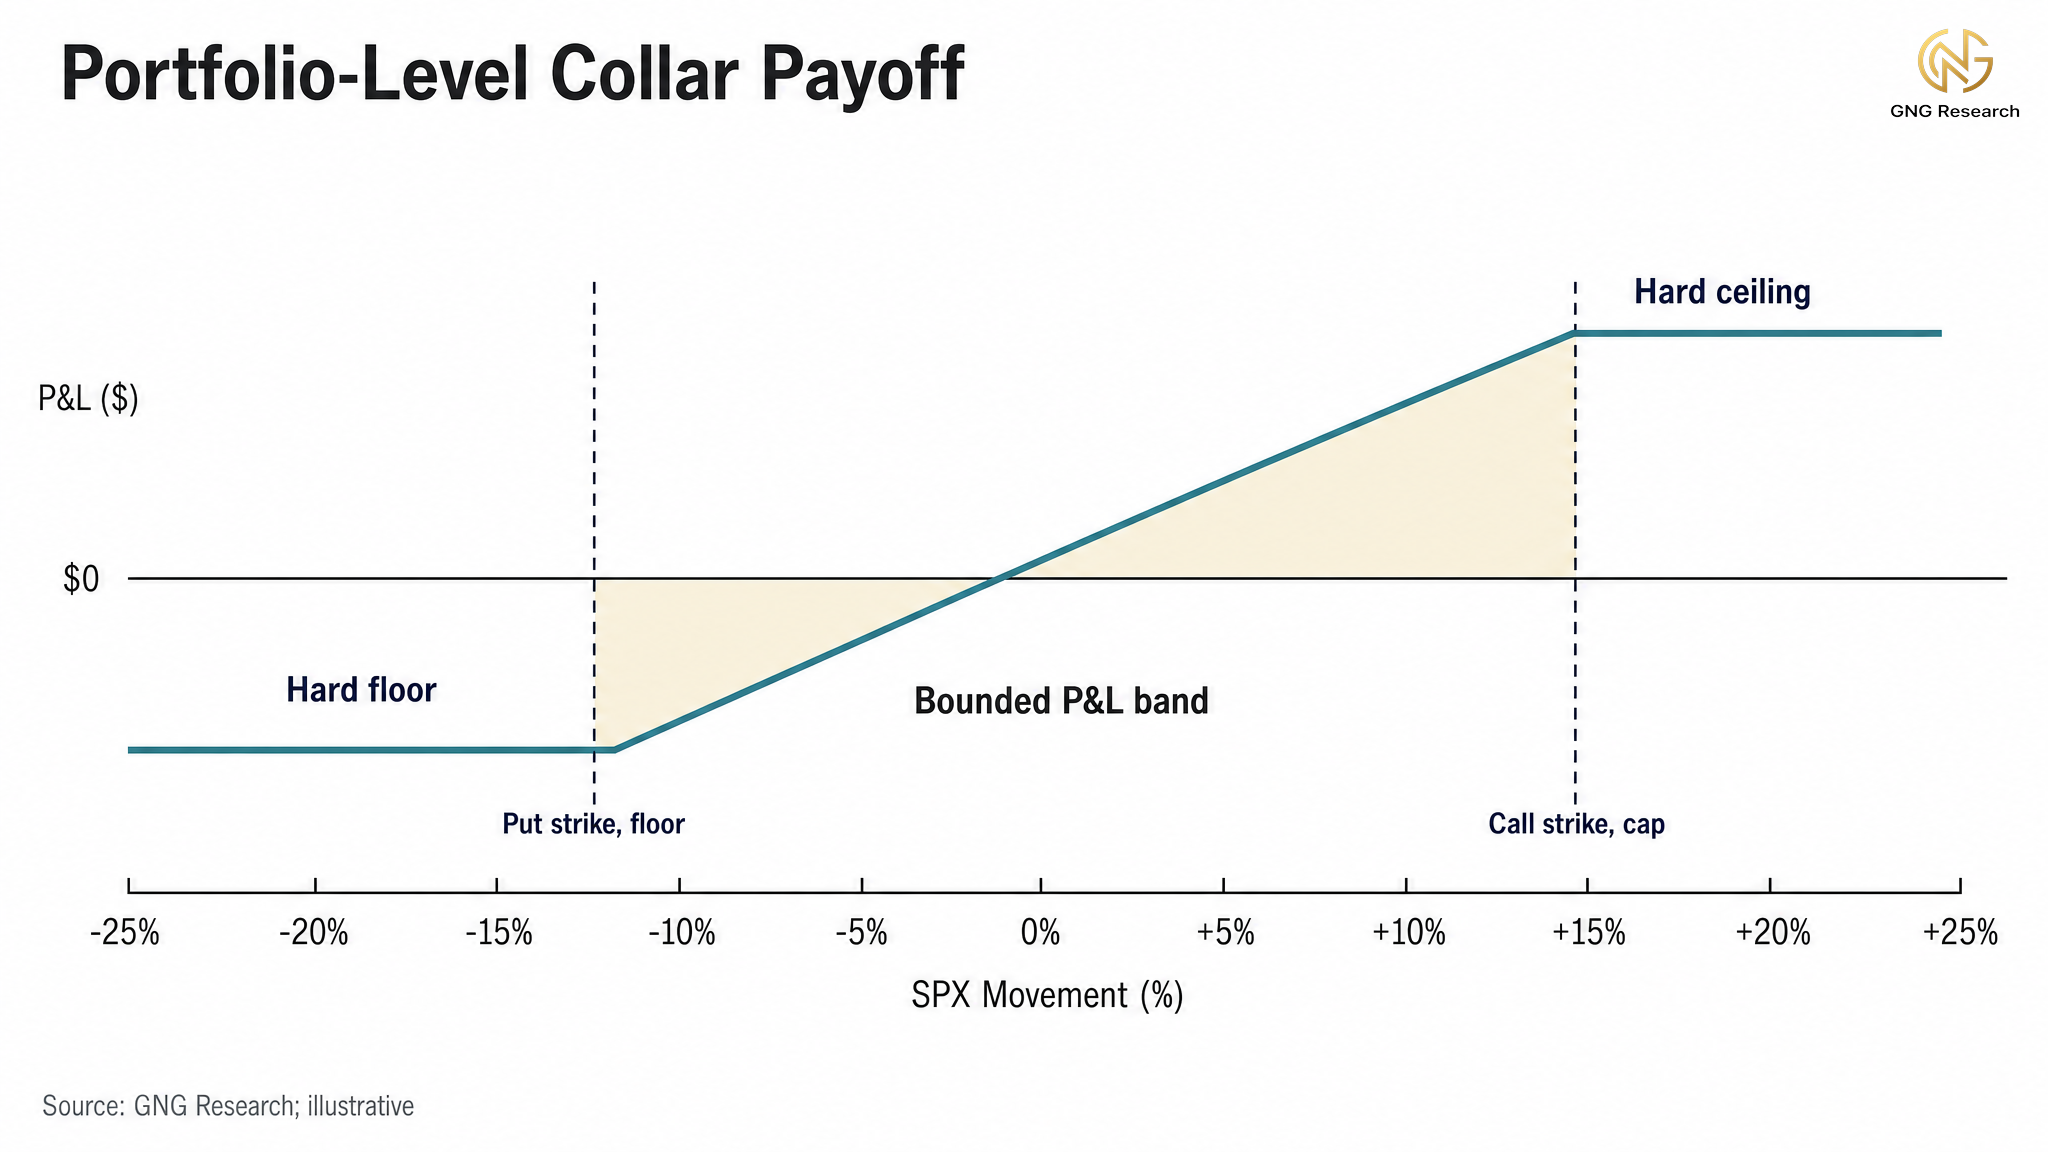
Two things to notice in the chart. First, none of the hedged lines run flat above the strike. The premium you paid is a constant drag in any benign market, and that drag scales with the ratio you carry. The full delta-adjusted hedge carries the heaviest drag because it holds the most contracts.
Second, the ratios shape the downside very differently. A light 25 percent hedge softens the move but leaves most of the drawdown intact. The full 26-contract hedge bends sharply once the puts gain delta below the strike, flattening the loss and, in a deep enough selloff, turning convex as those puts approach a delta of -1. That convexity is the reward for carrying the heavier premium. Your portfolio still absorbs roughly the first 5 percent down to the put strike, after which the delta-adjusted protection takes over, more forcefully the larger the ratio.
Picking a hedge ratio is really a question of how much loss you are willing to absorb between today's spot and your put strike.
Strikes closer to spot absorb less drawdown and cost more in premium. Strikes farther from spot absorb more drawdown and cost less.
The right answer depends on the drawdown your portfolio can survive and still compound back from.
The Cost of Carry
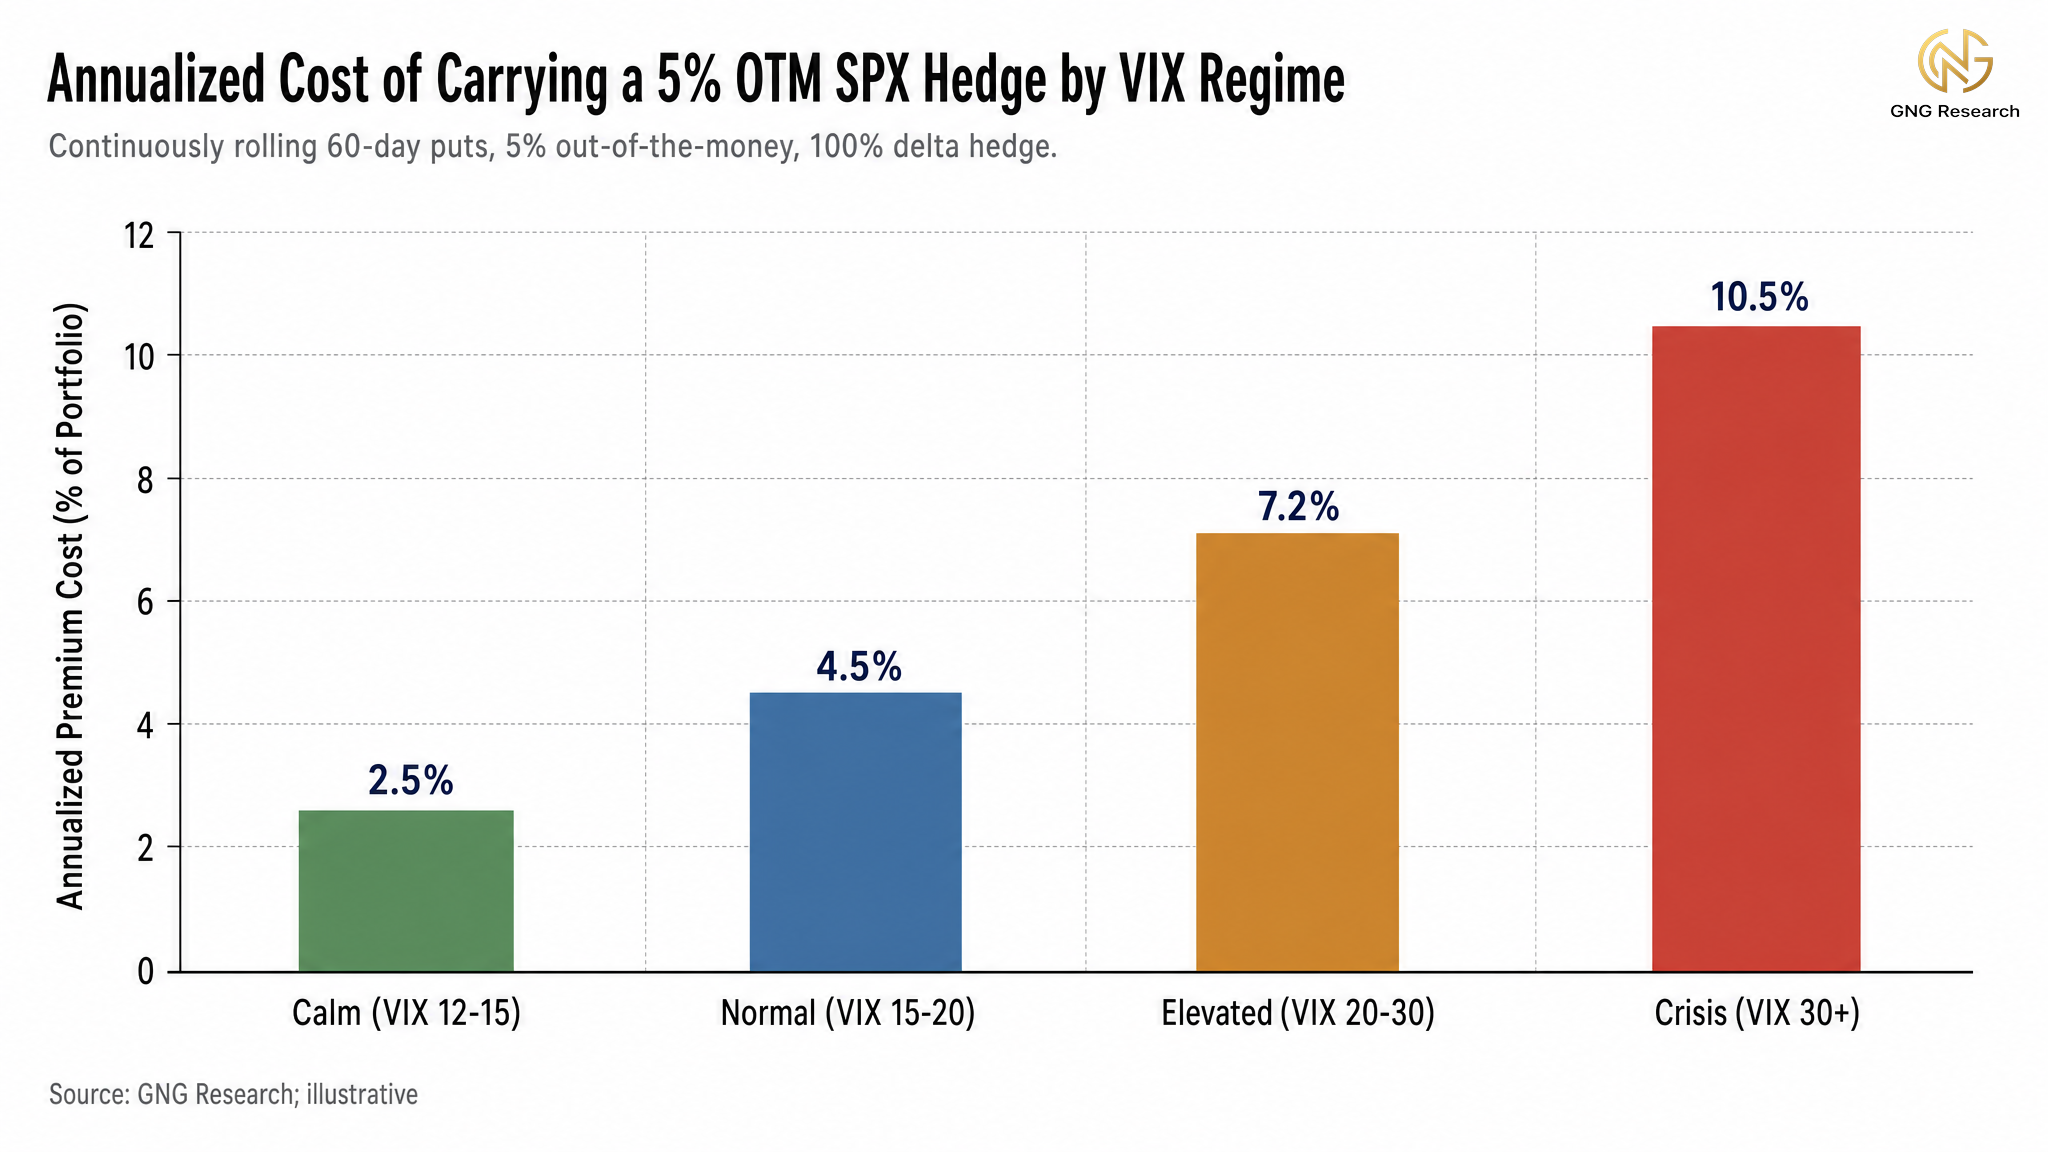
Permanent protection has a permanent cost. At portfolio scale, that cost moves with the volatility regime, and the bill is not constant. A full delta-adjusted hedge on our $500K book, 26 puts rather than 8, runs on the order of 3 to 4 percent of the book over a single 60-day cycle in today's regime. Annualized, that is a serious drag on returns, which is why the full hedge is the exception rather than the default.
What you pay for a put is set by implied volatility, and implied volatility is essentially what the market thinks tomorrow's swings will look like. At a VIX of 13, puts are inexpensive. At a VIX of 35 the same put on the same strike can cost several times more, with the realistic multiple depending on tenor, skew, and moneyness rather than scaling linearly in the headline VIX print.
Wait for confirmation that you need the hedge and you pay crisis-regime premium for protection that should have been on the book already.
Carry the hedge permanently and you bleed calm-regime premium for years before paying a much larger premium during the regime that actually required it.
The skill, again, is not in owning the hedge. It is in knowing when the hedge is worth its premium. Historically, sizing protection up has tended to pay when the probability or severity of a drawdown is elevated, ahead of known catalysts, at stretched valuations, when implied volatility is rising faster than realized volatility, or when your own systems flag a fragile regime.
Sizing protection down or off has tended to be the better posture when the regime is calm, the variance risk premium runs above its long-run average, and the carry cost is difficult to justify against the actual realized moves of the recent past. History is never guaranteed to repeat.
That final clause is the entire premise of the next section.
The Price of Fear, Implied versus Realized Volatility
To this point the article has treated volatility as a single variable.
There are really two, and the relationship between them is the most important concept in the remainder of this series.
Implied volatility is the standard deviation of returns the options market is pricing for the forward window. The VIX is the 30-day implied volatility of SPX options, derived from a wide strip of out-of-the-money calls and puts. A VIX of 17 says the market is pricing the next 30 days with an annualized standard deviation of 17 percent in SPX returns.
Realized volatility is the standard deviation the index actually delivered over a backward window, usually the rolling 30 days, computed from close-to-close returns. It is what happened, not what was anticipated.
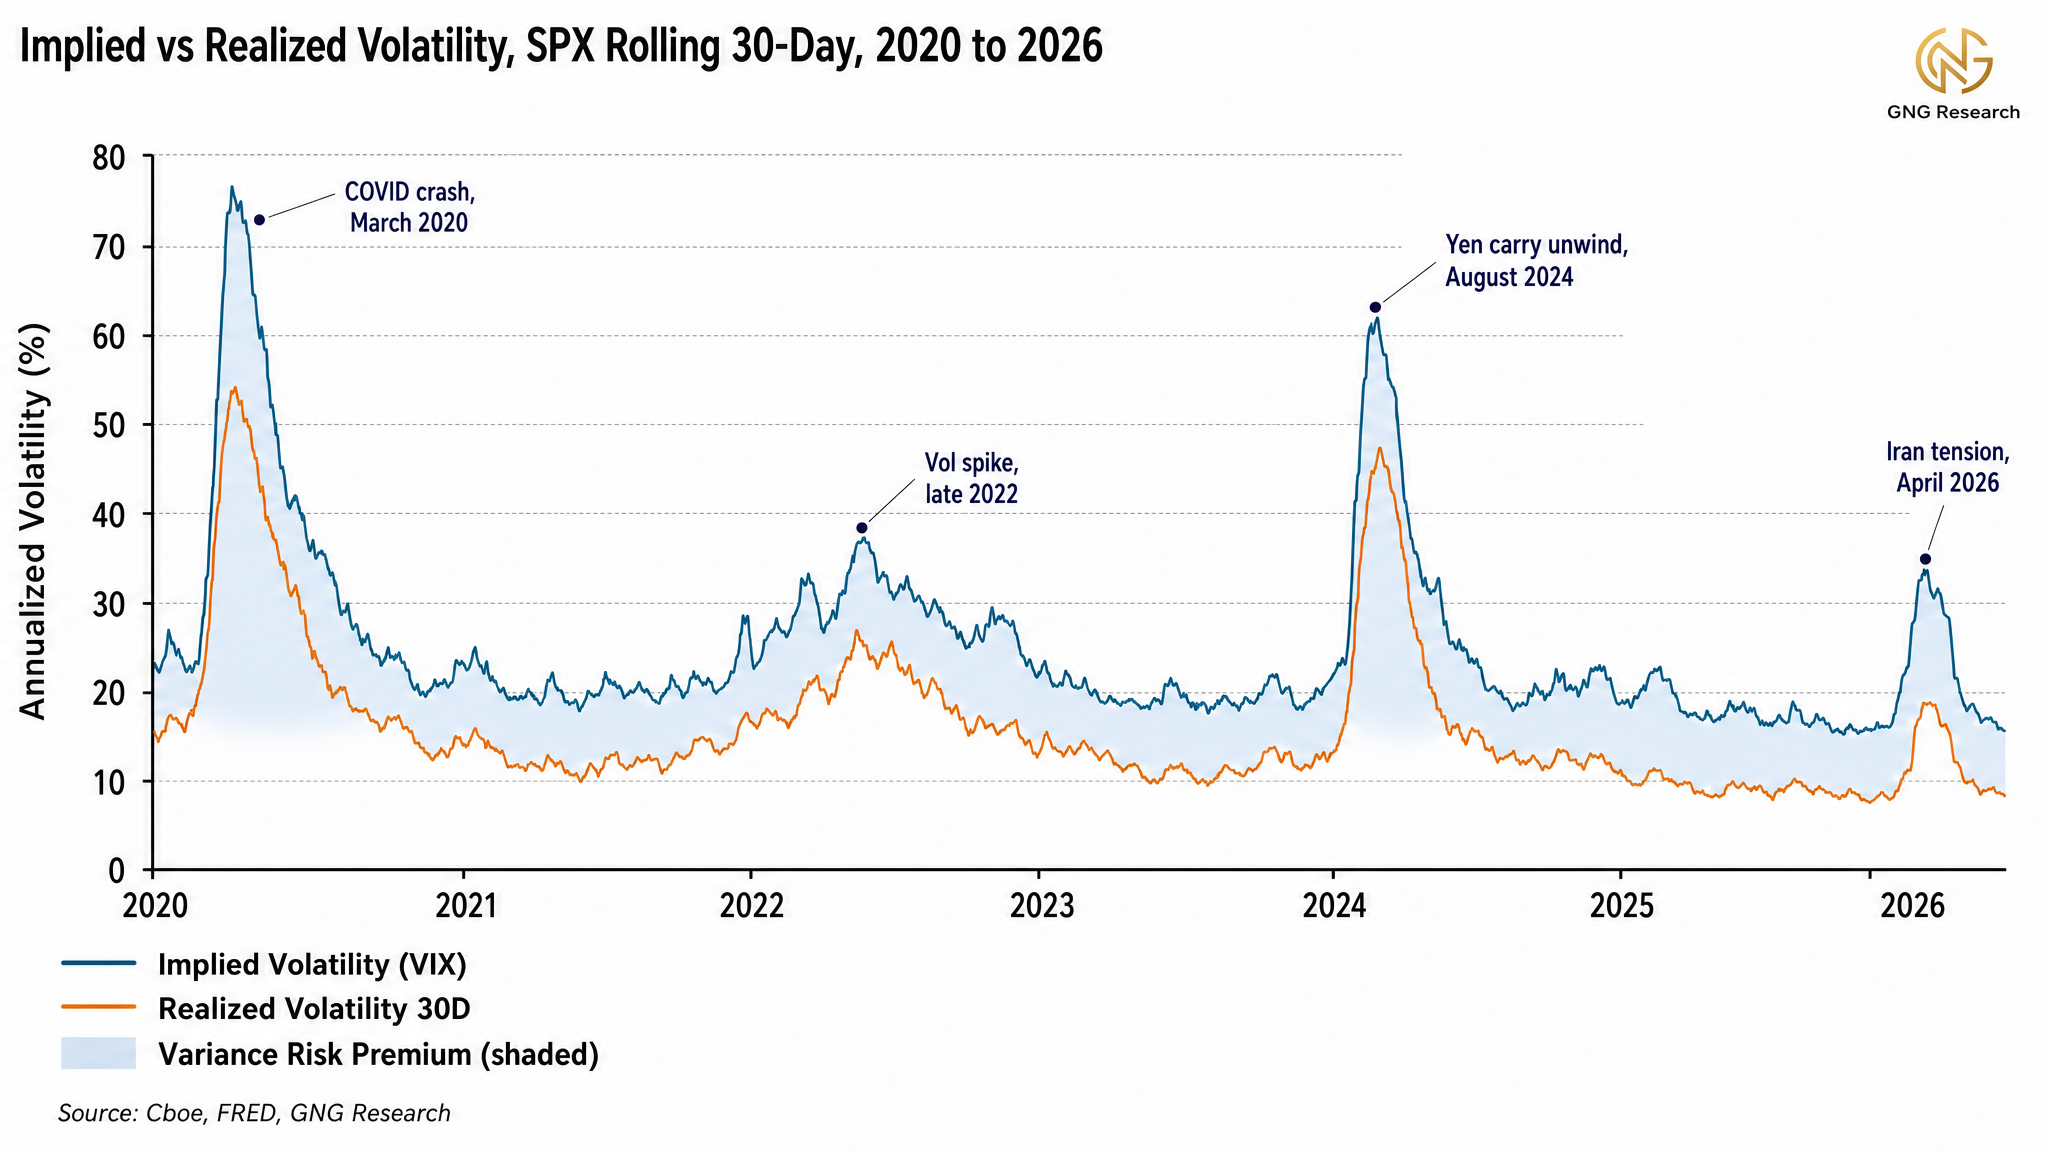
Implied volatility typically runs higher than the realized volatility that follows it. The spread between them has a name, the variance risk premium, or VRP. Strictly, the academic variance risk premium is defined in variance terms, the implied variance minus the expected realized variance, and what we track here in volatility points is its close and widely used proxy. (A vol point is one percentage point of annualized standard deviation, the same unit the VIX is quoted in).
Across rolling 30-day windows on the S&P, the long-run average gap has been roughly 3 to 4 vol points. The premium is not noise. It is what the rest of the market is willing to pay you, on average, for absorbing crash insurance demand, dealer hedging frictions, jump and skew aversion, and the volatility-of-volatility risk these structures embed. Investor fear of drawdowns is the headline cause, the persistent funding for the premium comes from those structural sources too.
An investor buying puts pays that premium. An investor selling options sits on the other side and collects it on average. The collection is cleanest in a pure short-volatility structure such as a short straddle or a variance position, while a covered call blends the premium with the equity upside it caps, harvesting it without being a pure expression of it.
The premium is not risk free income, it reverses sharply during crisis periods. Across full cycles it tends to be positive on average. Where you sit relative to the variance risk premium is one of the strongest determinants of the long-run expected return from owning or selling index options.
Where We Are Right Now
TL/DR I would just skip until the end if you were only here for the options education. These are my current thoughts and feelings and this section is honestly kind of a ramble.. So I've been writing this throughout the week so note that things may be a tad outdated down to the day.
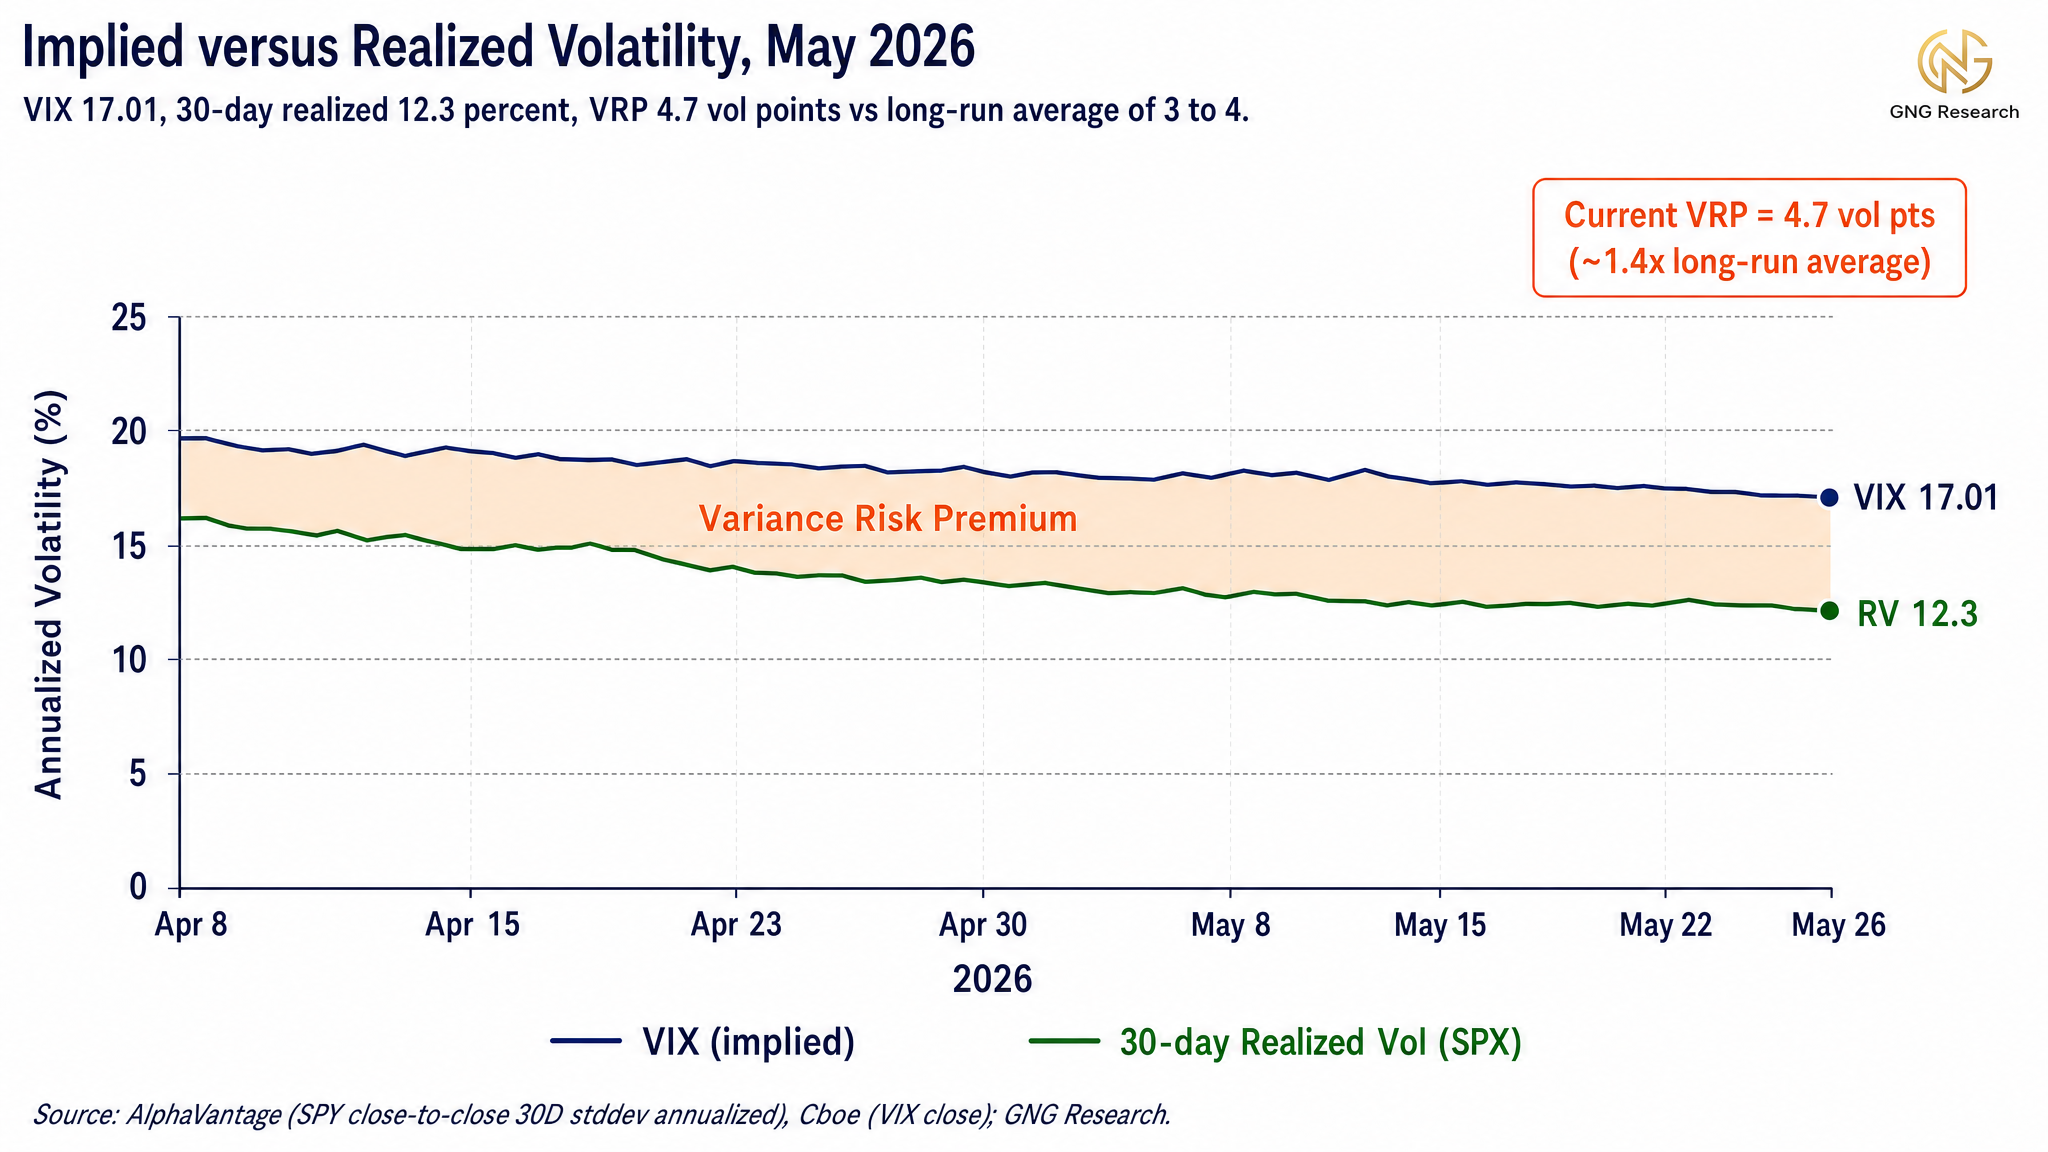
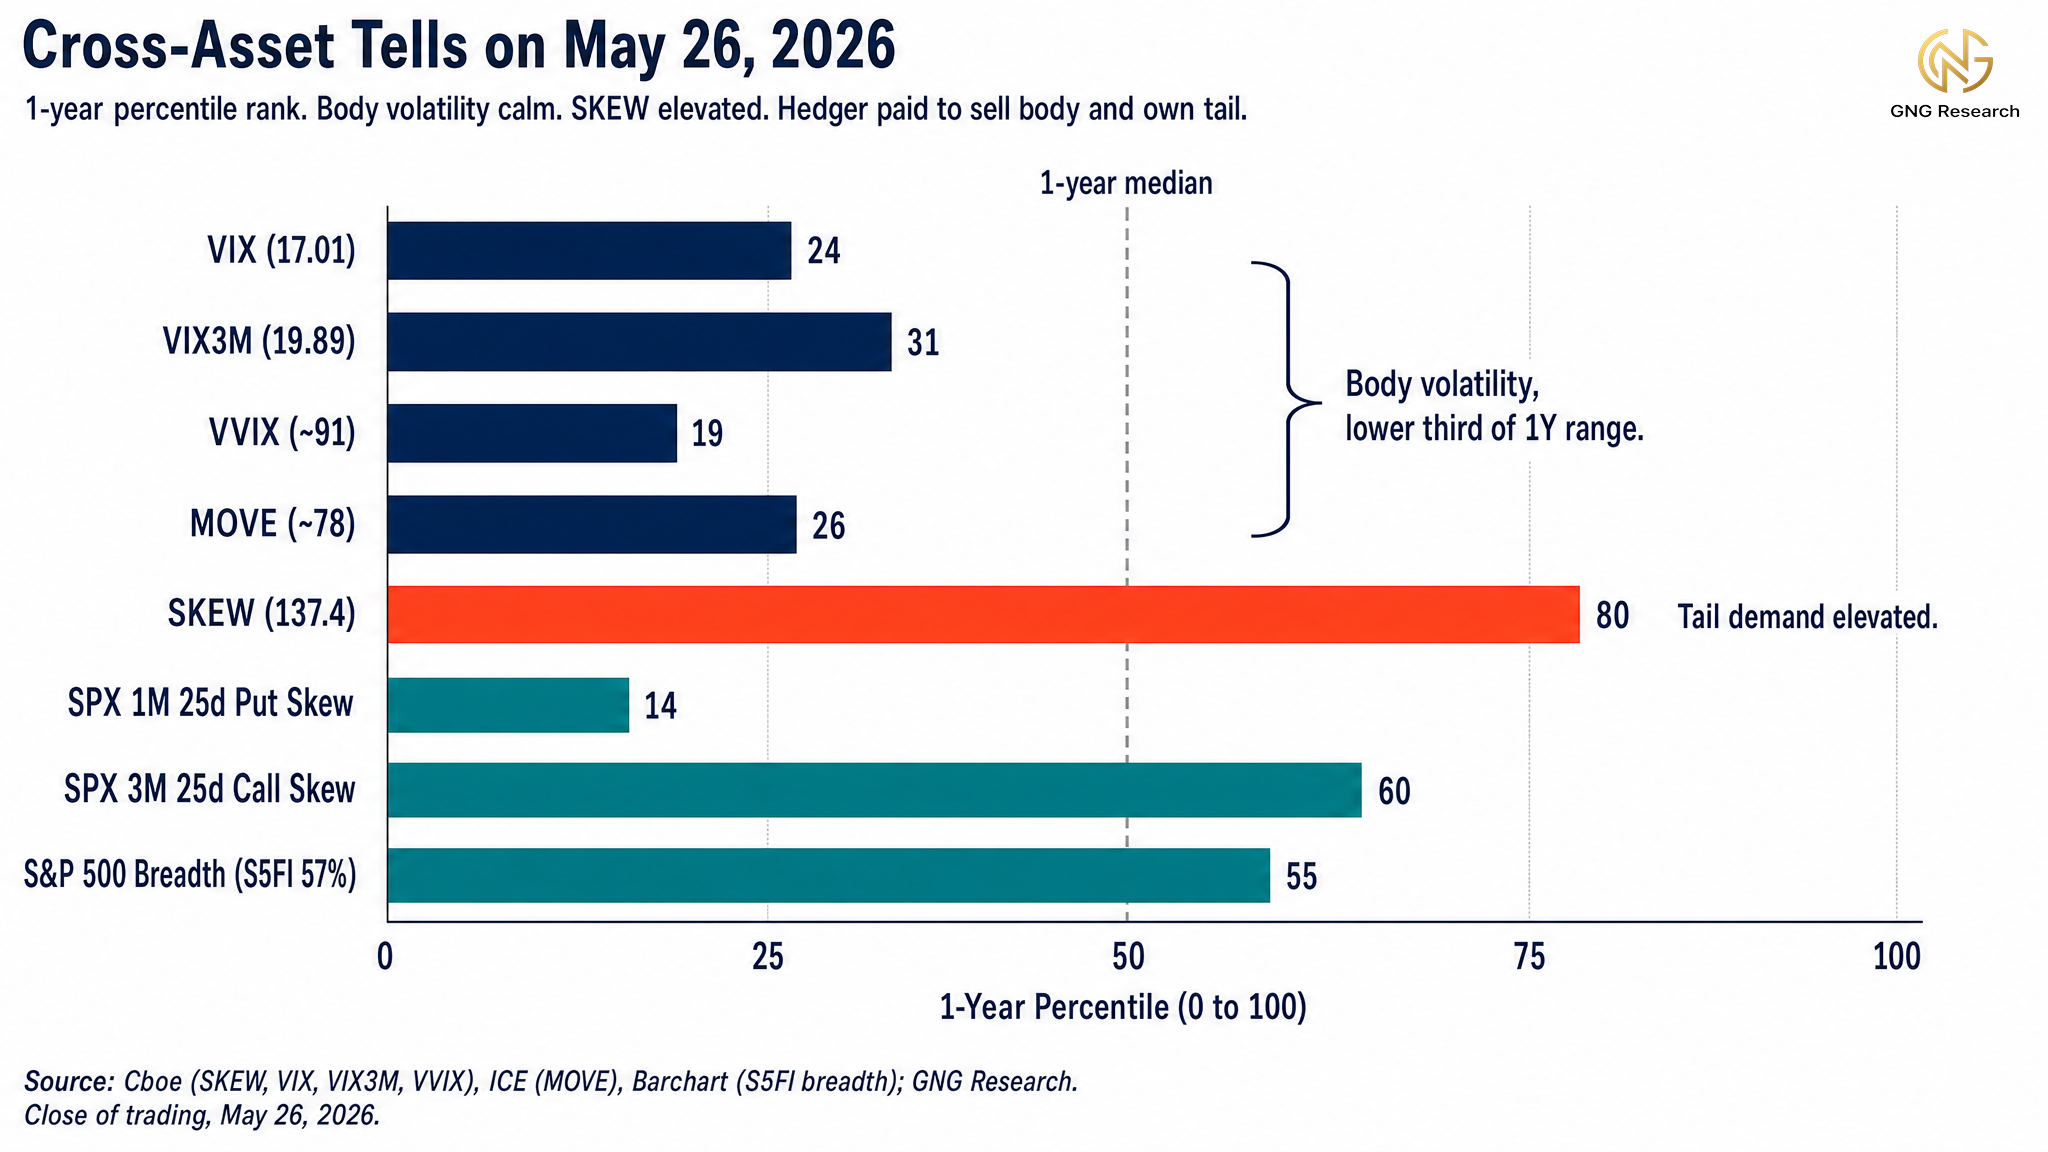
Closing on May 26, 2026 set the scene. SPX at 7,539, VIX at 17.01 (the VIX is the 30-day implied volatility of S&P 500 options, the market's price for the next month of fear), and trailing 30-day realized volatility on the index at roughly 12.3 percent annualized.
Against that primer, the May 26 snapshot resolves cleanly.
Today the VRP sits at 4.7 vol points, modestly above its long-run average of 3 to 4 points. In plain terms, the market is charging a meaningful premium for one-month equity insurance against what the index has actually been doing, though less rich than it ran through the first three weeks of May.
VIX3M (the 3-month version of VIX, the same fear gauge looking 90 days out instead of 30) closed at 19.89, and 6-month implied came in at 22.46.
The Cboe SKEW index (the price the market is paying for far-out-of-the-money disaster protection relative to at-the-money options) sits at 137.4, elevated against its long-run reference near 120.
The MOVE index (the bond-market equivalent of VIX, implied vol on US Treasuries) closed near 79 in the most recent print available, sitting below its long-run reference of roughly 80 to 90. To put it simply, the equity insurance market is calm in the body of the distribution and only nervous in the deep tails, and the bond market is genuinely quiet.
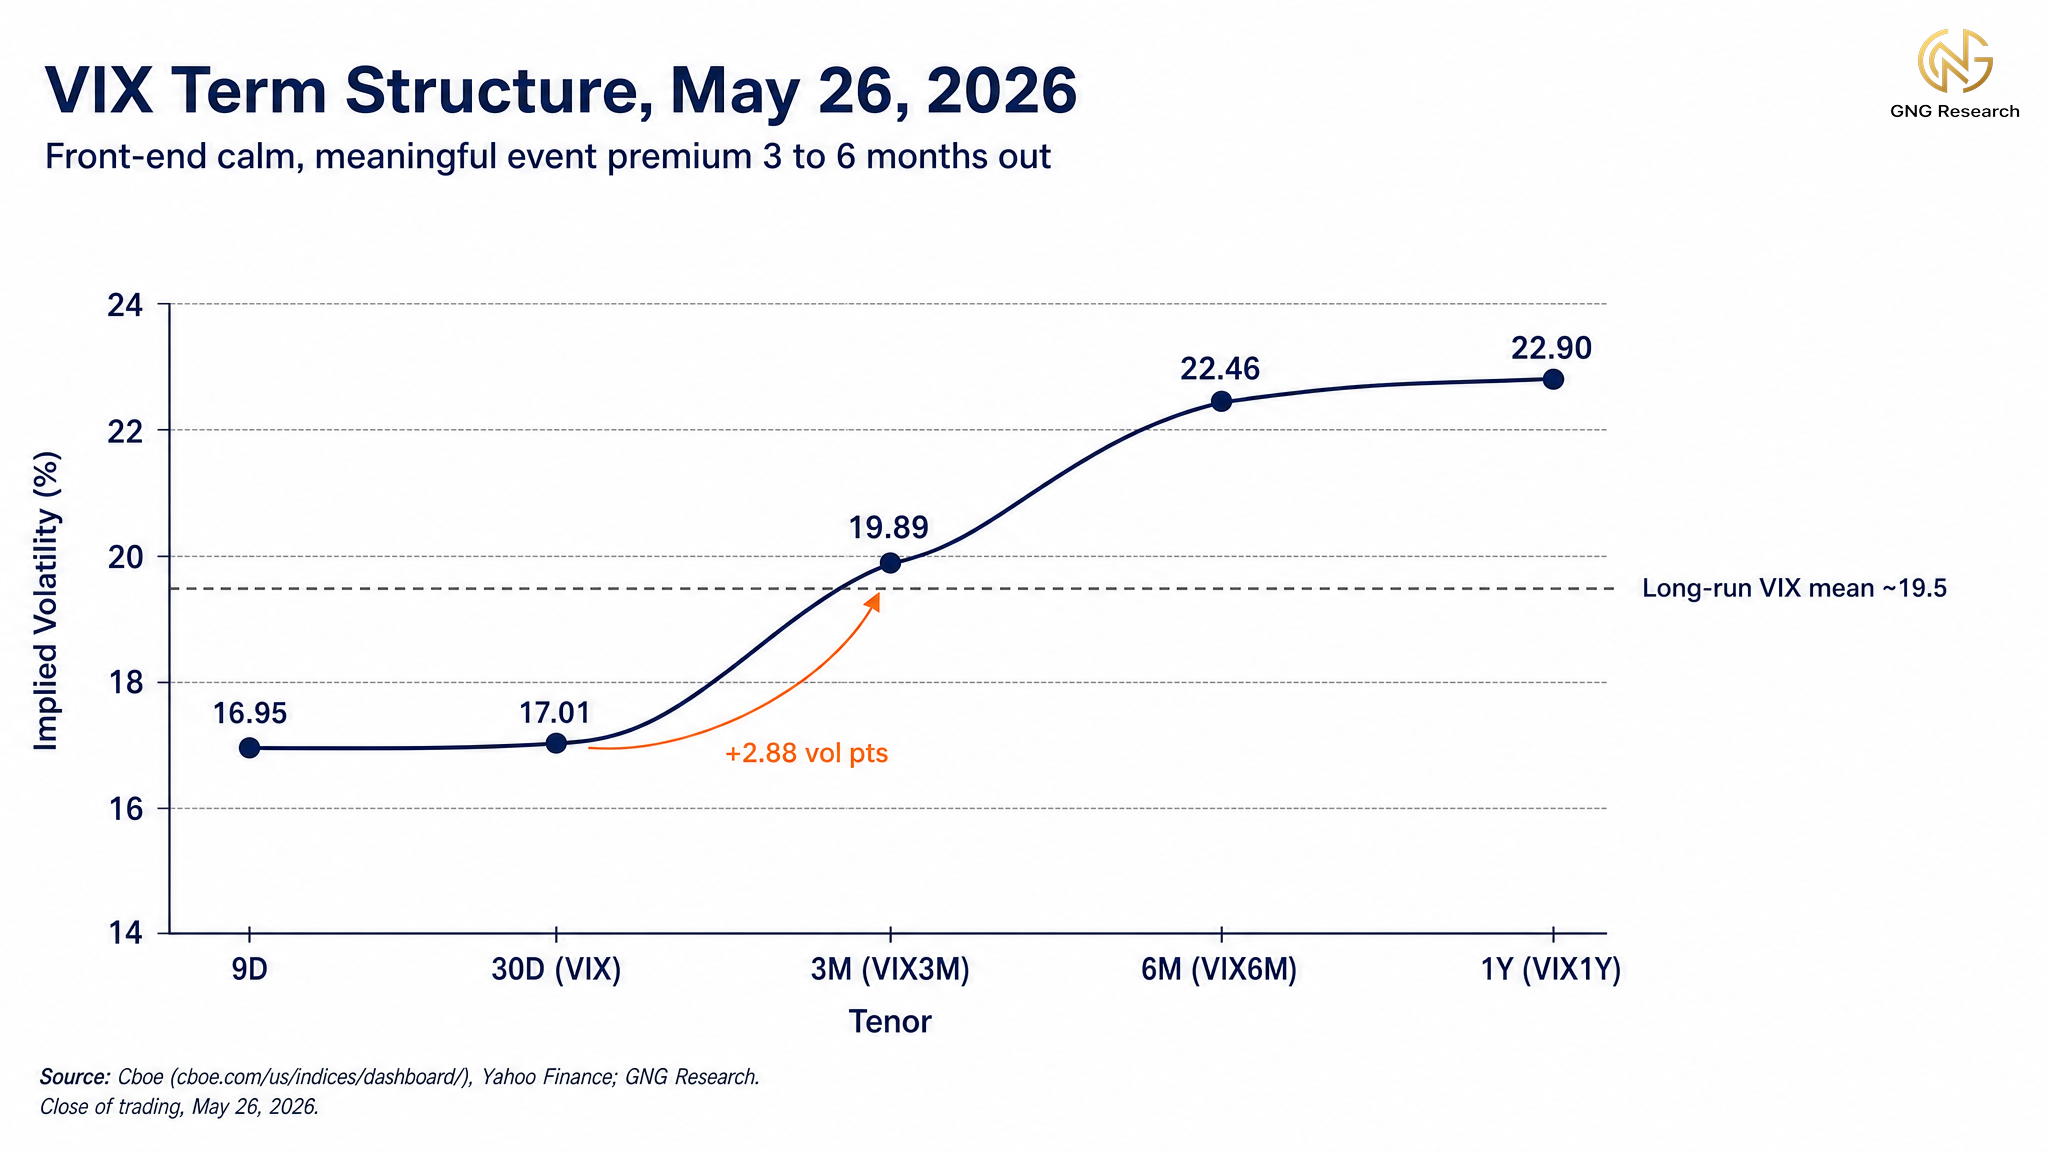
The first signal worth reading is the shape of that curve. A 2.88 vol-point gap between front-month VIX and VIX3M is what traders call contango in vol, where the front month sits below later months because the market expects more turbulence later than right now.
The market is pricing calm conditions in the immediate two-week window and meaningful premium in the 60 to 90 day window. That later window happens to contain the June 16 to 17 FOMC meeting (the Federal Reserve's rate-setting committee), the July CPI release (Consumer Price Index, the headline inflation print), and the start of Q2 earnings season (the calendar window when most S&P companies report).
The curve is telling you where the option market expects the action to be, and it is not pricing it in the next two weeks.
VVIX (the implied vol of the VIX itself, which is the market's price for how much the fear gauge could move) sits at 91, in the lower third of its multi-year range. Vol-of-vol that low means the option market is not pricing a sudden VIX spike inside the next two weeks. In genuine stress regimes the front month inverts above VIX3M within days of the event window, and VVIX clears 130 before the realized move arrives. None of those tells are present today.
CME FedWatch (the futures-implied probability of each FOMC outcome at upcoming meetings) is pricing roughly 97 percent probability of an unchanged target at the June 16 to 17 meeting, after the April CPI print at 3.8 percent removed the previously-priced cut. Polymarket and Kalshi corroborate the FedWatch read at 97 percent - don't get me started on these two platforms. I find it increasingly interesting and actually a decent sentiment gauge for the general public opinion.
In plain terms, the bond market has fully digested no cut in June and is no longer pricing rate-policy surprises into the near window.
On the earnings side, with 94 percent of the S&P 500 reported, Q1 2026 is closing as one of the strongest seasons on record. Blended EPS growth sits at 27.7 percent year over year on 11.4 percent revenue growth, and the blended net profit margin is 13.4 percent, the highest reading since FactSet began tracking the series in 2009. The beat rate is 84 percent on EPS and 81 percent on revenue, both well above five and ten-year averages. That is the fundamental backdrop the realized tape is responding to. SPX 1-month 25-delta put skew (the implied vol of puts roughly 25 percent likely to expire in the money, where "delta" is how much an option moves per $1 of underlying) has compressed to the 14th percentile of its 1-year range, while 25-delta call skew sits in the 60th percentile.
That is the unusual thing. Body protection is historically cheap. Upside-chase calls are pricing rich. The SKEW print at 137 ties it together. The residual hedging demand is concentrated in the deep tails, not in the body of the distribution.
One plausible cause of that residual tail bid is observable in the news flow, and the read does not require complex math.
The United States and Iran remain in a fragile ceasefire framework declared April 8, 2026 and indefinitely extended April 21. The framework is technically intact but is no longer clean. On May 26, US Central Command conducted what it called self-defense strikes against missile sites and Iranian vessels near the Strait of Hormuz, and Iran's IRGC claimed it downed a US Reaper drone the same day and called the strikes a violation. Doha negotiations are continuing, with Secretary Rubio indicating a final agreement is still days away. The Strait of Hormuz remains partially reopened with significant friction, Iranian transit fees in place, and war-risk insurance premiums running 2 to 3 percent of vessel value versus roughly 0.1 percent before the conflict. Brent crude closed near $99.59 per barrel on May 26, roughly 40 percent above its February 2026 average of $70.89.
The open-ended ceasefire framework remains under live negotiation, with the next round of US and Iranian catalysts falling inside the same 3 to 6 month window that contains the June 16 to 17 FOMC, July CPI, and the start of Q2 earnings. Separately, Israel authorized intensified operations against Hezbollah in Lebanon over the May 25 to 26 weekend, and the Russia-Ukraine front remains live. The long-dated event premium the SKEW print is signaling looks like it is pricing more than the domestic catalyst calendar alone, with a plausible read being a specific reopen-failure scenario in the Middle East alongside a wider regional escalation risk.
This tells me the hedging bid sitting in the wings is concentrated in tails because it has a specific binary event in mind, not because it has lost faith in the body of the distribution.
Historically, when option markets price a single binary geopolitical event alongside a calm realized tape, the more attractive premium to sell has been single-name body volatility while leaving index-level tail risk untouched or only modestly hedged. Regimes shift, and the relationship can break.
Cross-asset positioning is consistent with the same read. The DXY (the trade-weighted US dollar index) closed at 99.09. The 2s10s spread (the gap between the 2-year and 10-year Treasury yields, the most-watched recession indicator) is positively sloped at +49 basis points, which is the non-recessionary shape.
The MOVE index sits well below its long-run reference, so bond-market fear matches equity body fear, both quiet.
Gold holds a structural bid as a stagflation hedge rather than a crisis hedge. Same instrument, different drivers, in stagflation gold rises with persistent inflation and stagnant growth, in crisis it rises as a safe haven when other assets fail. Today's bid looks like the former.
Breadth is consistent with the headline strength. The percent of S&P 500 names above their 50-day moving average (a market-internals gauge of how broadly the rally is participating, the 50-day moving average is the rolling 50-day average closing price of a stock) sits at roughly 57 percent on the May 26 close, a constructive but not extreme participation reading.
The tape is broad rather than narrow, and the body of the index is participating alongside the heavy lifters.
Personally, none of the signals here would lead me to lean into buying broad-index put protection at today's marks. The setup looks more like an environment for monetizing the rich premium than for paying it.
Structures that have historically held up better in regimes like this include covered calls on overextended single-name winners where IV-rank is elevated (you own the stock and sell a call above current price to collect premium against it), cash-secured puts on quality names worth owning at lower entry prices (you set aside the cash to buy the stock and sell a put to get paid for the willingness to be assigned), and put credit spreads or bear call spreads anchored to fair-value work.
A credit spread is the structure where you sell one option and buy a further-out-of-the-money option as protection, and you collect the net difference as a credit. A bear call spread is that structure on the call side, selling a call closer to spot and buying a further-OTM call as a cap, collecting the net premium with a defined maximum loss.
Each one of these structures is a way to be paid to take a defined-risk view rather than to pay for one.
Two things temper the read. The SKEW print indicates that small notional far-OTM put structures remain inexpensive in vega terms, so cheap tail protection is genuinely available if you want it. And the elevated event volatility through June 17 looks more like a window for credit-spread sellers than for outright put buyers. At the index level, where the tail bid is concentrated, a put spread or a 1x2 put ratio funded by selling the elevated call skew has historically been the more capital-efficient way to carry geopolitical reopen-failure risk than buying outright puts. The 1x2 put ratio is a structure where you buy 1 put closer to the money and sell 2 puts further OTM, and the math works because the two sold puts finance the close-in put, often leaving the structure at zero net cost or a small credit. Below the lower short strike the structure inverts into a net short put position with naked downside convexity, gap-down risk in a crash that can dwarf the credit collected, and early-assignment risk on American-style products. It is the more efficient carry for the body of a tail event, not for the tail of one, and it requires explicit crash-risk management.
The 60-day read. In an above-average-VRP, calm-body, fat-tail regime, the posture I lean toward is one that sells volatility selectively rather than buying it indiscriminately. The market is paying a premium to insure against a move it is not yet pricing as imminent in the near window. To me, that is the more interesting side of the trade. Regimes shift, and the relationship can break. History is never guaranteed to repeat.
Practical Implementation Notes
A few practical notes before we move on.
Roll cadence. A 60-day put with 30 days remaining has decayed through most of its useful theta, the position has entered the steepest portion of its theta-decay profile. Many systematic vol-overlay programs roll between roughly 21 and 30 days to expiry into the next 60 to 90 day window to avoid the steepest theta decay, though institutional hedging cadence varies widely from calendar to event-driven to delta-threshold rules. For a standing overlay you intend to keep on, holding each put all the way to expiration is the most efficient way to overpay for protection over a calendar year, since you ride the steepest theta every cycle. A hedge bought for a specific dated catalyst is the exception. There it can be rational to hold through the event and let it expire.
Effective beta. Your portfolio's effective beta (the beta your book actually delivers in a sell-off, which is usually higher than the calm-market number because correlations tighten under stress) matters more than the headline beta when it counts. A book dominated by mega-cap technology carries a different effective beta in a stress event than the calm-market number suggests, because the components correlate more tightly when the market drops than they do on quiet days. If you expect your book's effective beta to climb in a stress event, sizing the hedge to the stress beta rather than the calm beta has historically been the more defensible call. History is never guaranteed to repeat.
Income offset. The same VRP that makes buying puts expensive makes selling calls profitable on average. An index-level collar (long the book, long index puts, short out-of-the-money index calls) funds your downside protection by capping the upside. If your portfolio's job is to pay you, protecting the base that produces the income matters more than catching the next leg up. The index-level collar is built for exactly this case.
Leveraged ETFs. Someone asked about hedging with options on SOXL and SOXS. Leveraged ETFs reset their leverage daily, which produces compounding drag in any choppy market regardless of direction.
Options on these products inherit the same path-dependence problem (path-dependence in plain terms means the answer depends on the exact sequence of moves, not just the start and end points) and can lose money even when your directional view turns out to be right.
The cleaner instrument for semiconductor exposure is options on the unlevered sector ETF (SOXX or SMH) sized for the effective delta of the leveraged position rather than its notional. A dedicated piece on leveraged ETF hedging is planned for later in the series.
A Tool I am Considering Next On The Platform
I am considering building a Hedge Pairing tool for the platform. The existing build queue is already long, so this remains tentative.
The idea is simple. You click your portfolio, we regress its returns against every plausible candidate index (SPY, QQQ, IWM, sector SPDRs, SMH, KRE + All in our database) over a rolling window, and the output flags the instrument with the highest explanatory power, sizes the positions, and runs a backtest of the hedge through the August 2024 unwind, the April 2025 tariff drawdown, the 2022 cycle, and whatever other window you select.
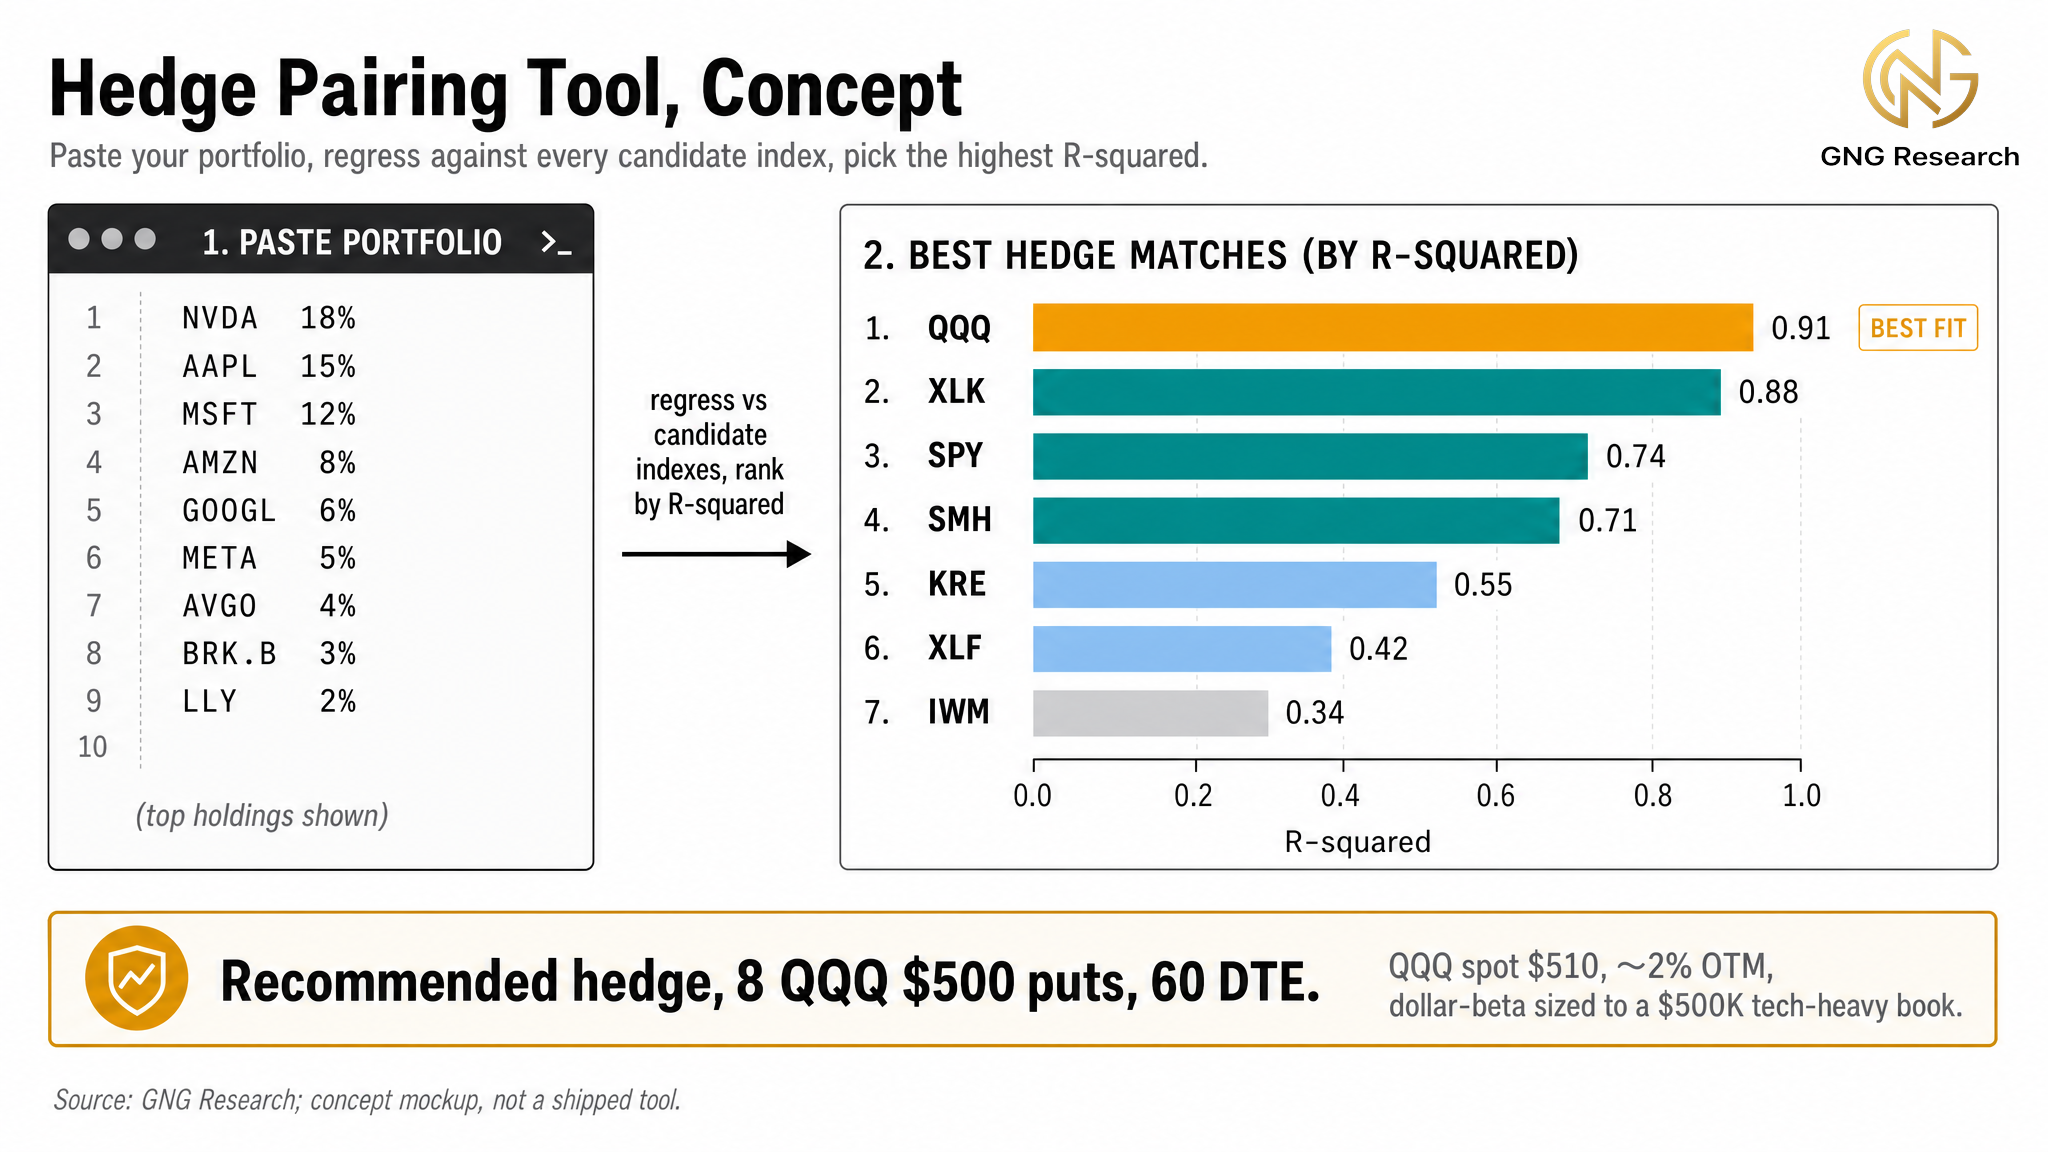
The institutional name for this practice is the minimum variance hedge ratio, or best-fit benchmark hedge.
Prime brokers including Goldman Sachs offer it as part of their basket and synthetic equity services. The objective is to replace the subjective call of which index to use with a data-driven answer.
Conclusion
This paper set out to answer one question.. how to protect a portfolio rather than a position. The answer is an index put, sized by the book's beta and bought on the index that best explains the book's variance, used partially more often than fully and only when the cost of insurance is worth paying.
The book is the unit, not the position. Hedging the aggregate is really hedging the systemic risk that lives across every position you hold.
The instrument matters as much as the strike. A technology-heavy book hedged with SPY is under-hedged in the regime that matters most. The right hedge is the index with the highest explanatory power for your book's variance.
You are always on one side of the variance risk premium. Buying options pays it. Selling them collects it, most cleanly through short-volatility structures and only partially through a covered call. The current spread tells you whether the regime is rewarding the seller of insurance or the buyer.
Looking Ahead
If the cost of hedging scales with the volatility regime and the value of hedging scales with the probability of a drawdown, the right hedge size is not a fixed rule. It is a signal. How much delta you carry against the market should respond to the spread between implied and realized volatility, to your portfolio's recent realized drawdowns, to the known catalysts on the calendar, and to model-driven regime classifications.
That is the territory of volatility arbitrage and regime-driven hedge sizing.
Up next in Part 3, Volatility as a Tradeable Input, The Variance Risk Premium in Practice.