Today I’m trying out an experimental article style, and two recent comments really hammer home my approach to disciplined financial science, the style of analysis that over 120,000 people at Seeking Alpha and Dividend Kings trusted over the last decade.
Can I put together a great research report in half a day? Using the best AI deep research models, FactSet data, and expert opinion from Morningstar?
Here’s what inspired the question and this experimental article.
“Great call on ARE @Adam Galas —— Alexandria Real Estate Equities (ARE) on Wednesday nearly halved its quarterly cash dividend, sending shares down more than 10%.
The real estate investment trust owns, operates, and develops properties for life science companies. Its board said the dividend reduction reflected the company's "commitment to fortify its already strong balance sheet, enhancing financial flexibility and preserving liquidity of approximately $410M on an annual basis." Glenn Ford, GNG Chief Equity Strategist
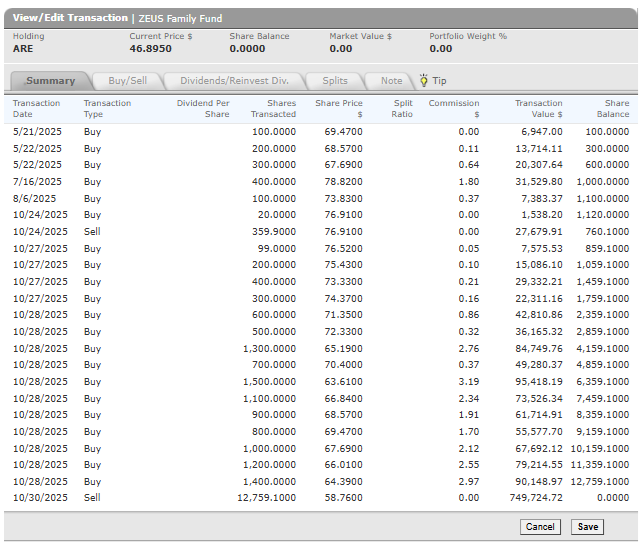
As I explained in my special report, Alexandria triggered all 15 limits I had set for dynamic rebalancing, carefully calibrated to take it to max risk cap allocation if the price achieved a once in lifetime opportunity level.
However, the warning about a potential dividend cut was a potential thesis-breaking event, and so now the risk management rules of ZEUS include a provision that if a dividend stock signals a potential cut, all limits are turned off.
ARE went from a 1.6% position to a 3.1% position on the four limits that filled before I saw the dividend cut warning.
In the report, I walked you through the daily fundamental risk modeling that our systems were doing and the ultimate conclusion when we sold on 10/30 at $59 was an 80% risk of a dividend cut (up to 90% if we get a recession) with a 35% base-case dividend cut and up to 65%.
ARE has just announced a 45% cut.
The $163K loss created by having to sell a 17% position (at the peak, exactly as designed for max risk cap weighting) at a 17% loss was painful. But what would have been more painful was had I not followed the best available facts to their optimal conclusion, which was to sell when the math said to sell.
By not being a proud, stubborn fool, I saved ZEUS $140K in additional losses.
By “Walking Humbly” And Admitting a hindsight mistake, I saved the ZEUS family $140K
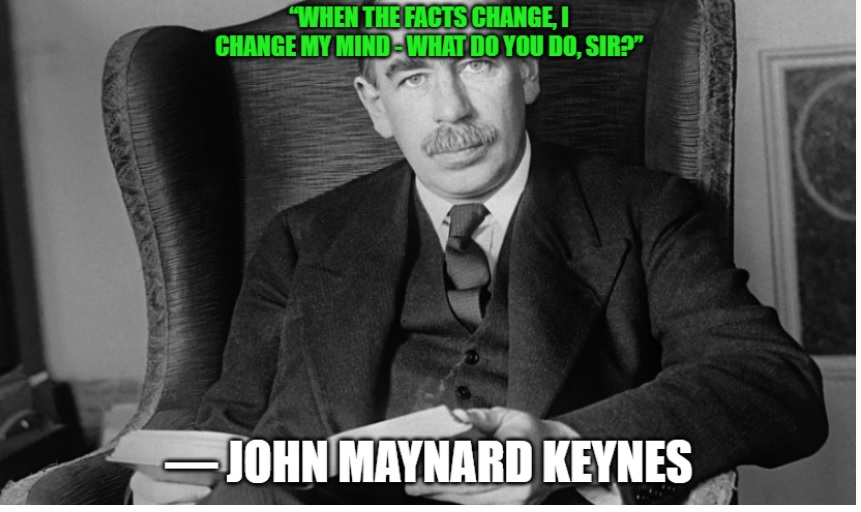
It’s not being wrong that bankrupts you in finance, it’s being wrong for too long.
Another Example Of Why People Trust My Judgement
“Jim Mott@mottman13 hours ago
If you keep writing articles like this you’ll have no problem paying off that 43k nut every month!
Do you have any analysis on the Microsoft story about them lowering sales targets today?”
Here’s my response, after feeding Jim’s question into Gemini 3 Pro.
"Here is the breakdown of the story and a draft response you can use so you can get some sleep. The Story in a Nutshell The person is asking about a report published yesterday (Dec 3) by The Information claiming that Microsoft has quietly lowered its sales targets (quotas) for certain AI products, specifically within its Azure cloud unit. The Claim: The report alleges that sales teams missed their AI agent sales goals (specifically the "Foundry" product) because enterprise customers are hesitant to pay the high costs without seeing clear value yet. As a result, the report says Microsoft cut growth targets for the current fiscal year to 25–50%. The Rebuttal: Microsoft officially denied this. A spokesperson stated they have not lowered aggregate sales quotas and that the report misunderstands how their sales compensation works. Market Reaction: Microsoft stock dipped about 2-3% on the news but recovered slightly after the denial." So that's the background of the news you mentioned.
This is why we look at consensus estimates for all companies, huge headline companies like MSFT. I appreciate the information because they do fantastic work (that's why they cost something like $700 per month!) But there are 62 analysts covering MSFT, and collectively they know it better than anyone other than Satya Nadella. And if Satya and his team are denying it, well, we'll find out in 3 months, won't we? Right now, the 5-year CAGR sales consensus (median from 62 analysts) is 16.3% with EPS growth of 19.4% CAGR due to rising margins and buybacks. So if that sounds like a growth slowdown, it's the kind that any company in the world would dream of😉.
We're working on developing advanced models we call "Alpha Finance" that will be able to make proprietary estimates for companies, aiming to model growth rates more accurately than the median analyst consensus. That might provide some useful insights, but for now, I'm not going to pretend that my opinion is smarter than that consensus. It's kind of like if you asked me, "What do you think the Fed should do?" I can tell you the probability of a cut is 89% and in that case, I have really good reasons (I can talk your ear off) about why the Fed funds rate should be 2.5% right now, but what I think doesn't matter as much as the 89% probability that the bond market is pricing in through Fed funds futures. The same with "What will Nvidia do after earnings"? The options markets priced in plus or minus 6% ahead of earnings. I'd be speculating and guessing if I tried to do better than that. Real-time recession risk? We'll build a model internally, of course, but the prediction markets at Kalshi and Polymarket are matching blue-chip consensus with around a 1 to 2 week lead during a crisis. So the best available data is what we use, and we build meta models that incorporate other models because it's the best system we've found so far.”
And this brings me to today’s special experimental article, inspired by another member in our chat room (which is now upgraded to RocketChat).
“Jared Damico
What are GNG's thoughts on CRM’s earnings today? Can they overcome the software headwinds?
Here’s what I told Jared.
“I am putting together a report for you that will appear in the morning as an experimental article. Gemini 3 Pro is down (overloaded it seems) so I downloaded all FactSet has on CRM (all consensus and historical data) along with Morningstar's takes and then asked Chat GPT 5.1 Pro deep research to put together a detailed report (lots of charts and tables) AND also a TLDR executive summary (8 bullet points) and estimate the probability of 13+% consensus growth being accurate and whether the investment thesis is intact. I'll turn it into an article for you in the morning. Best I can do since I'm not an expert on Salesforce, and our tools are not quite yet out of beta in terms of running a full analysis. I'll run a PEGY for you and put that into the report, and also include a FAST Graphs, with and without growth adjustment. I should try the same thing for Adobe, which was discussed on What Are Your Thoughts. Some very interesting points they made. But that's for another day.”
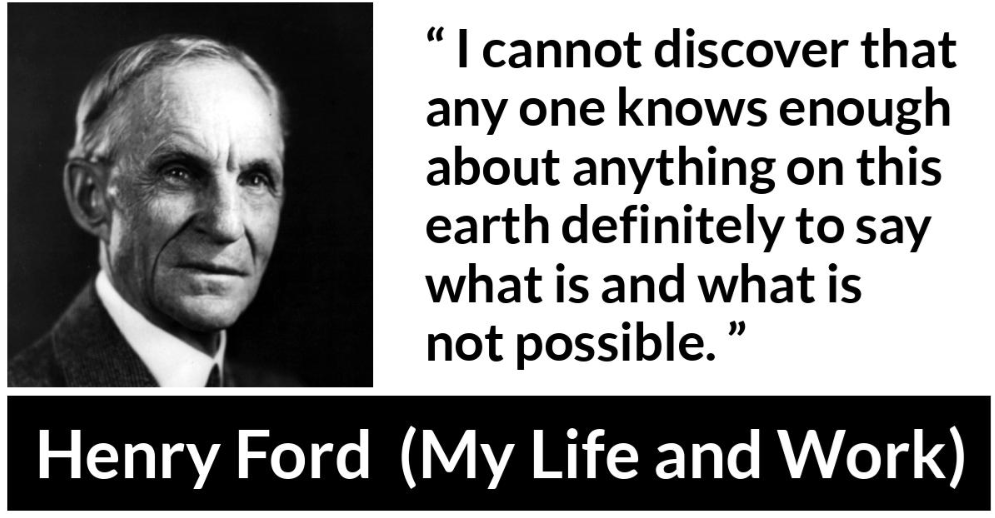
I’m a systems builder and a teacher of disciplined financial science. I can’t know the specifics of what is going on with all 5,000 companies (and counting) that are in our system. But what I can do is ask the right questions, or know who to ask for the right questions, to answer almost any question.
So with that being said, let’s look at the special report that ChatGPT 5.1 Pro, in combination with FactSet’s data, and Dan Romanoff, Morningstar’s CRM analyst, as to what CRM’s latest earnings means for the investment thesis.
What Salesforce Investors Need To Know About CRM’s Thesis
PEGY Analysis
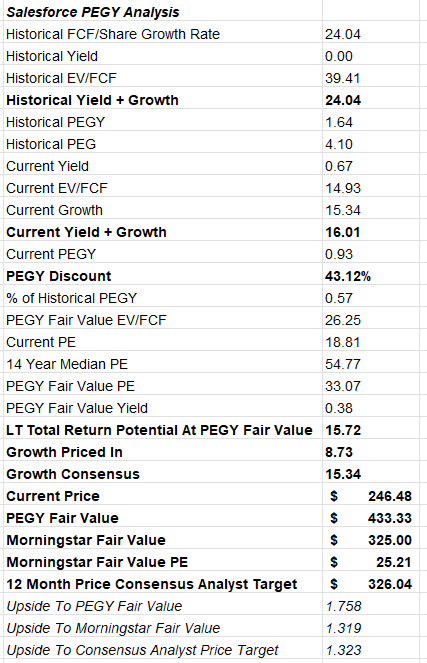
What the PEGY analysis shows is that when CRM was growing at 24% (doubling FCF/share every 3 years), it traded at a very high 40X EV/FCF and a median PEG of 4.1.
However, now that growth is expected to slow to 15% (doubling every 5 years instead of 3), the historical PE of 55 should come down to around 33.
Morningstar and analysts think that a 25X to 26X PE is the new normal, implying a 32% upside in the next 12 months (and to fair value) according to analysts, while the PEGY model says a more impressive 76% is justified based on the 0.93 PEGY vs a historical 1.64.
My opinion? Based on the PEGY, slower growth is still worth it, and that CRM is a significantly undervalued company trading at 18X EV/FCF. PEGY of 0.93 for a company of this quality, with solid qualitative analysis confirmed from the consensus of 55 analysts (including Dan Romanov) = a solid buy right now.
FAST Graphs Consensus Return Potentials (Both Growth And Non-Growth Adjusted)
Non-Growth Adjusted
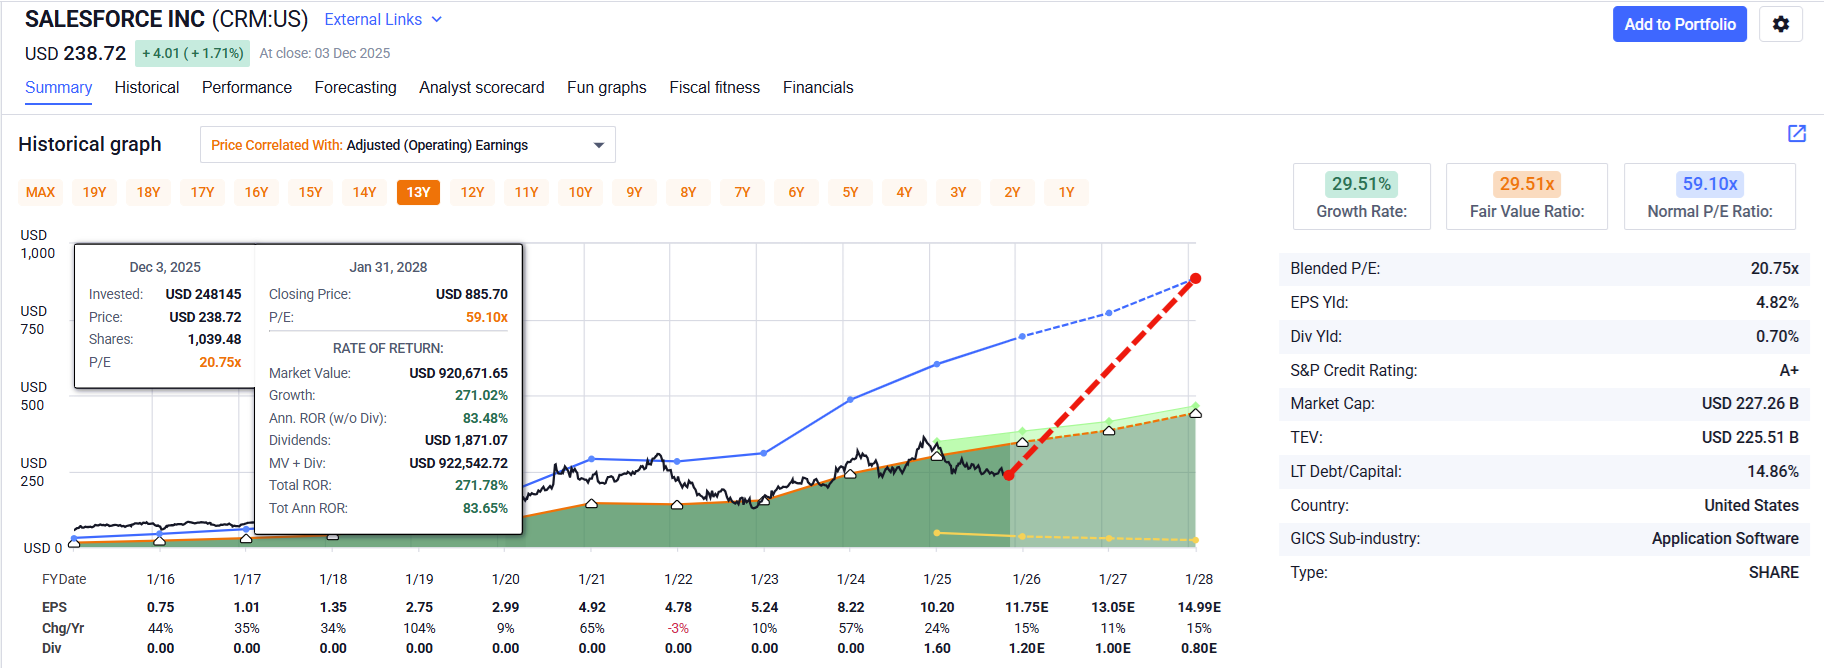
We can see the value of the PEGY analysis at work: if you just use the 10-year average PE of 59, you’d think CRM could 4X in the next 2 years, which is obviously not likely.
Non-Growth Adjusted (PEGY)
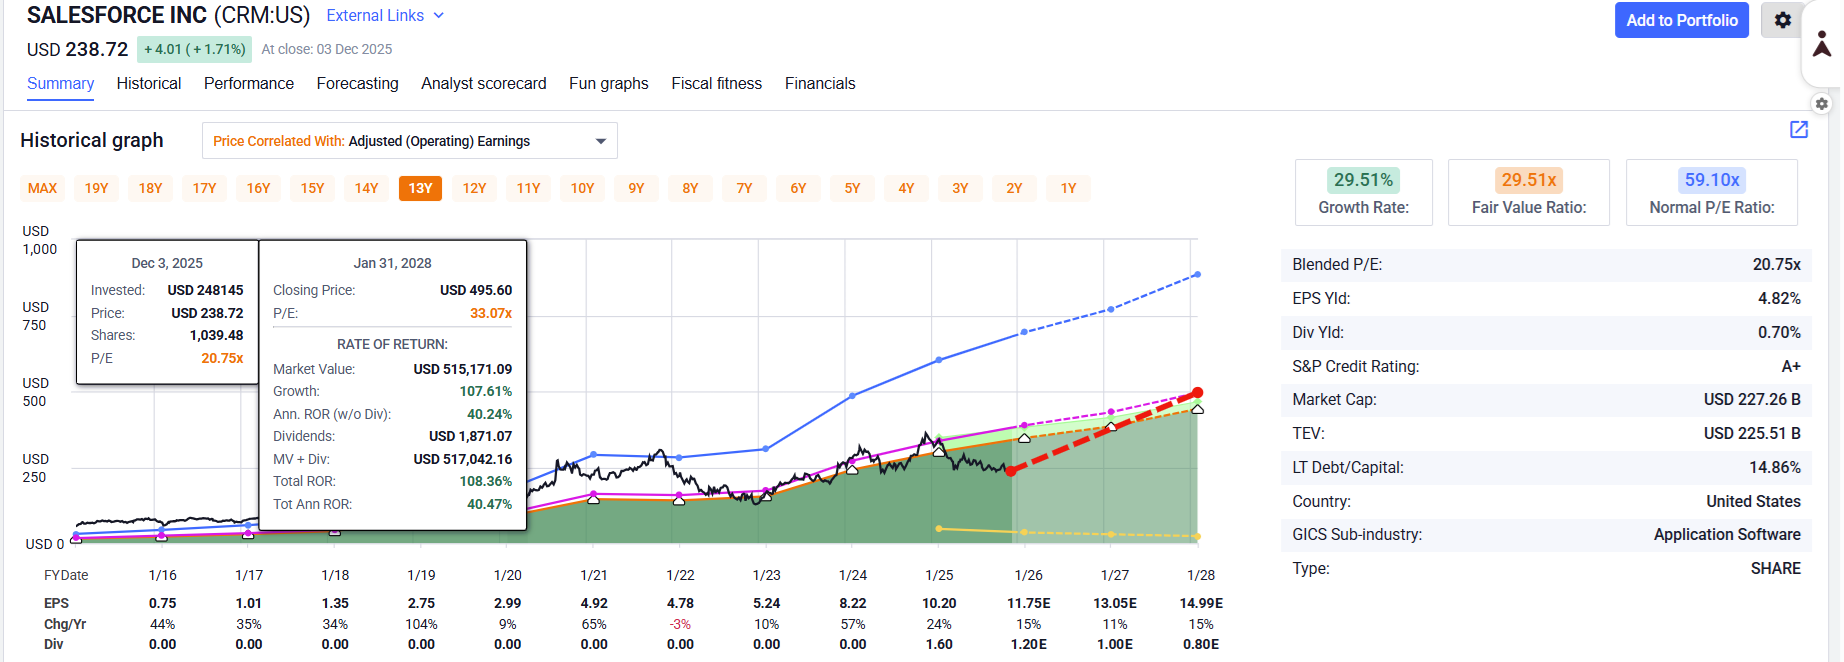
You can see with the PEGY fair value of 33 that the return potential is still a very strong 108%, or 40% CAGR.
And what if Morningstar and analysts are right? What if the fair value PE is actually 26?
Morningstar Fair Value PE (Analysts Agree)
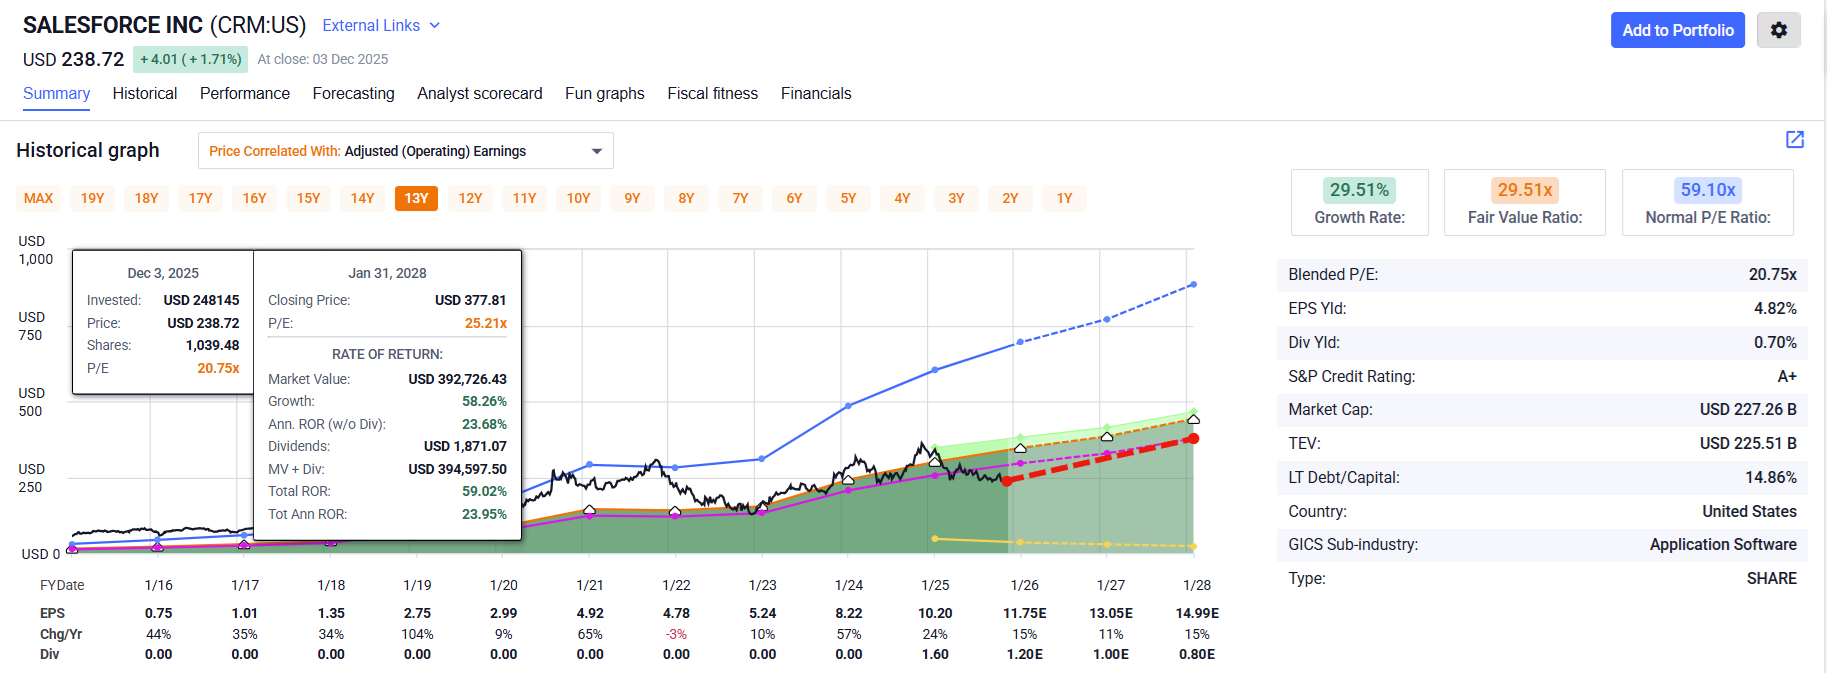
Big tech stocks have traded at 25X earnings for about a decade before the age of AI began, so a 25X fair value for CRM growing at 15% is reasonable (IMHO) and would still imply a potential 59% gain over 2 years for CRM or 24% CAGR.
That’s a 3X in 5 years rate of return, which is what venture capital is targeting (their rule of thumb for entire portfolios).
In other words, if I were running a pure PEGY portfolio (which I am trying to do), I would consider CRM to be a very promising deep value candidate that offers the kind of 3X in 5-year return potential that allows retail investors to target venture capital-like returns without paying high fees or locking up capital for 7 to 15 years.
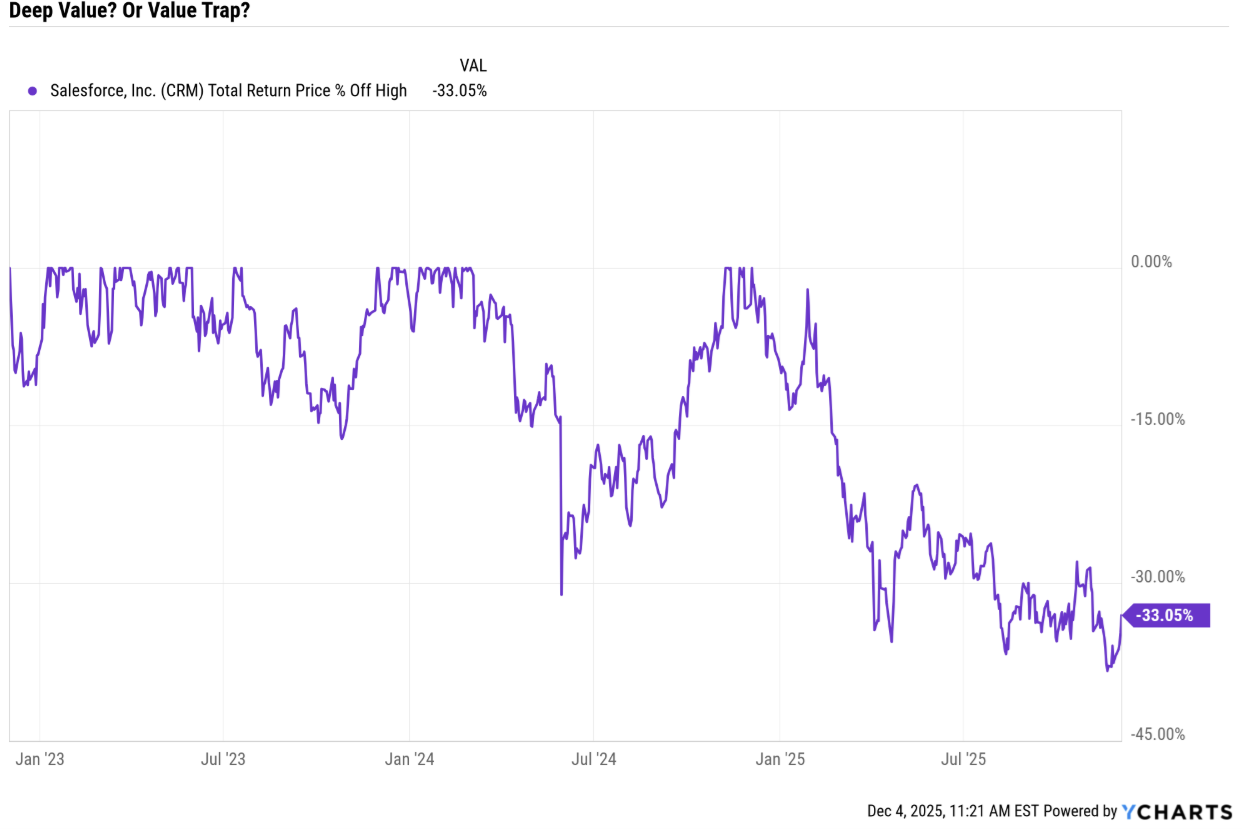
Technical Analysis: What Do Trading Algos Think
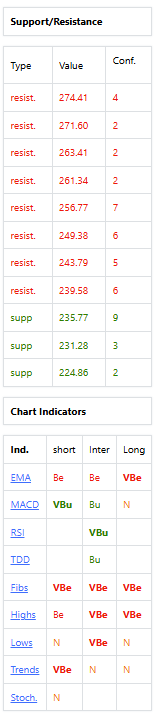
A close below $235 would indicate that strong support has broken, and CRM might potentially have a significant short-term correction.
Trading algos are not liking the charts, so this isn’t a “Quandamental” rec, it’s a pure fundamentals are great, and to heck with the charts, rec (what I normally do).
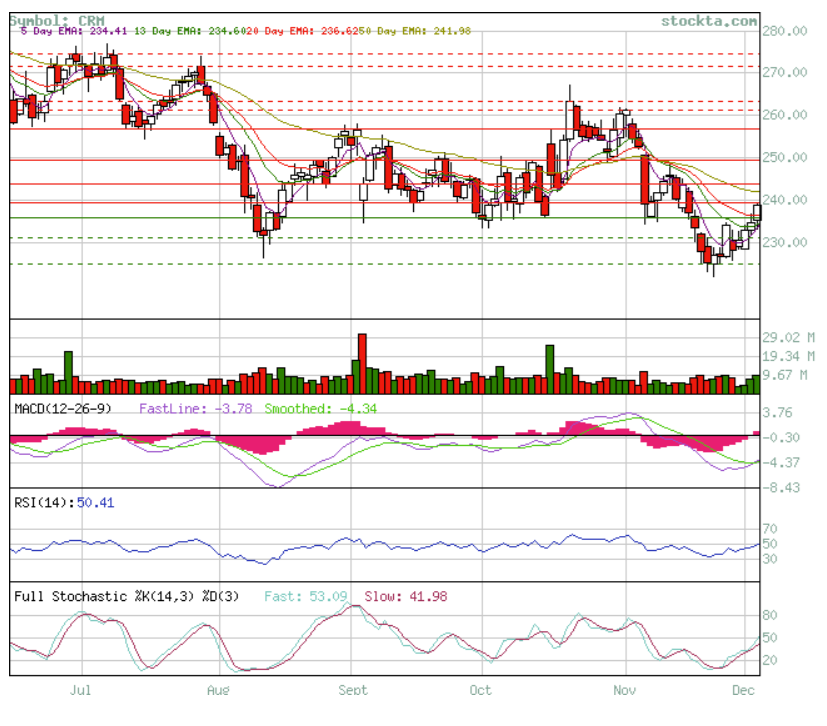
What we see here is a sign that CRM might have bottomed (the fundamentals support that), and if the price closes above $258 (the strongest resistance), then the algo traders will suddenly like the charts.
The Stochastics, RSI, and MACD are momentum indicators that signal that CRM is not overbought, so the signal triggered by a $258+ close is “Everyone back into the pool, the water’s fine and limited warning signs.”
And Now The Expert Report (ChatGPT 5.1 Pro Running On FactSet & Morningstar Data & Expertise)
Salesforce (CRM) — Earnings Update, AI Momentum, and 5‑Year Outlook
One‑line client takeaway: Salesforce’s near‑term growth is steady (not spectacular), but profitability is surging, and AI is now a measurable revenue driver — leaving the long‑term thesis intact with a high probability of hitting the Street’s ~13% EPS CAGR trajectory while revenue runs closer to ~9–11% under consensus.
Pictures Are Worth A Thousand Words (Thesis Intact)
TLDR (Too Long Didn’t Read) (8 bullets)
Q3 headline: Revenue $10.26B (+9% YoY; +8% cc) and non‑GAAP operating margin 35.5% — a record margin print. cRPO +11% to $29.4B; RPO ≈ $59.5B (+12%), signaling healthy backlog. Business Wire
AI traction: Agentforce + Data 360 ARR ≈ $1.4B (+114% YoY). Agentforce alone >$500M ARR (+330% YoY); 9.5k+ paid deals; 50% of bookings from expansions. Salesforce+1
Billings re‑accelerated: ~13% YoY in Q3, outpacing revenue — supportive for near‑term growth. Morningstar
Outlook raised: FY26 revenue now $41.45–$41.55B; FY non‑GAAP op margin ~34.1%; Q4 revenue $11.13–$11.23B (incl. ≈$300M from Informatica, which closed Nov 18). Morningstar+3Reuters+3Investopedia+3
Thesis check: Intact, not broken. Morningstar keeps $325 FVE and calls the stock attractive; management still guiding toward “Rule of 50” on the path to $60B revenue by 2030. Morningstar
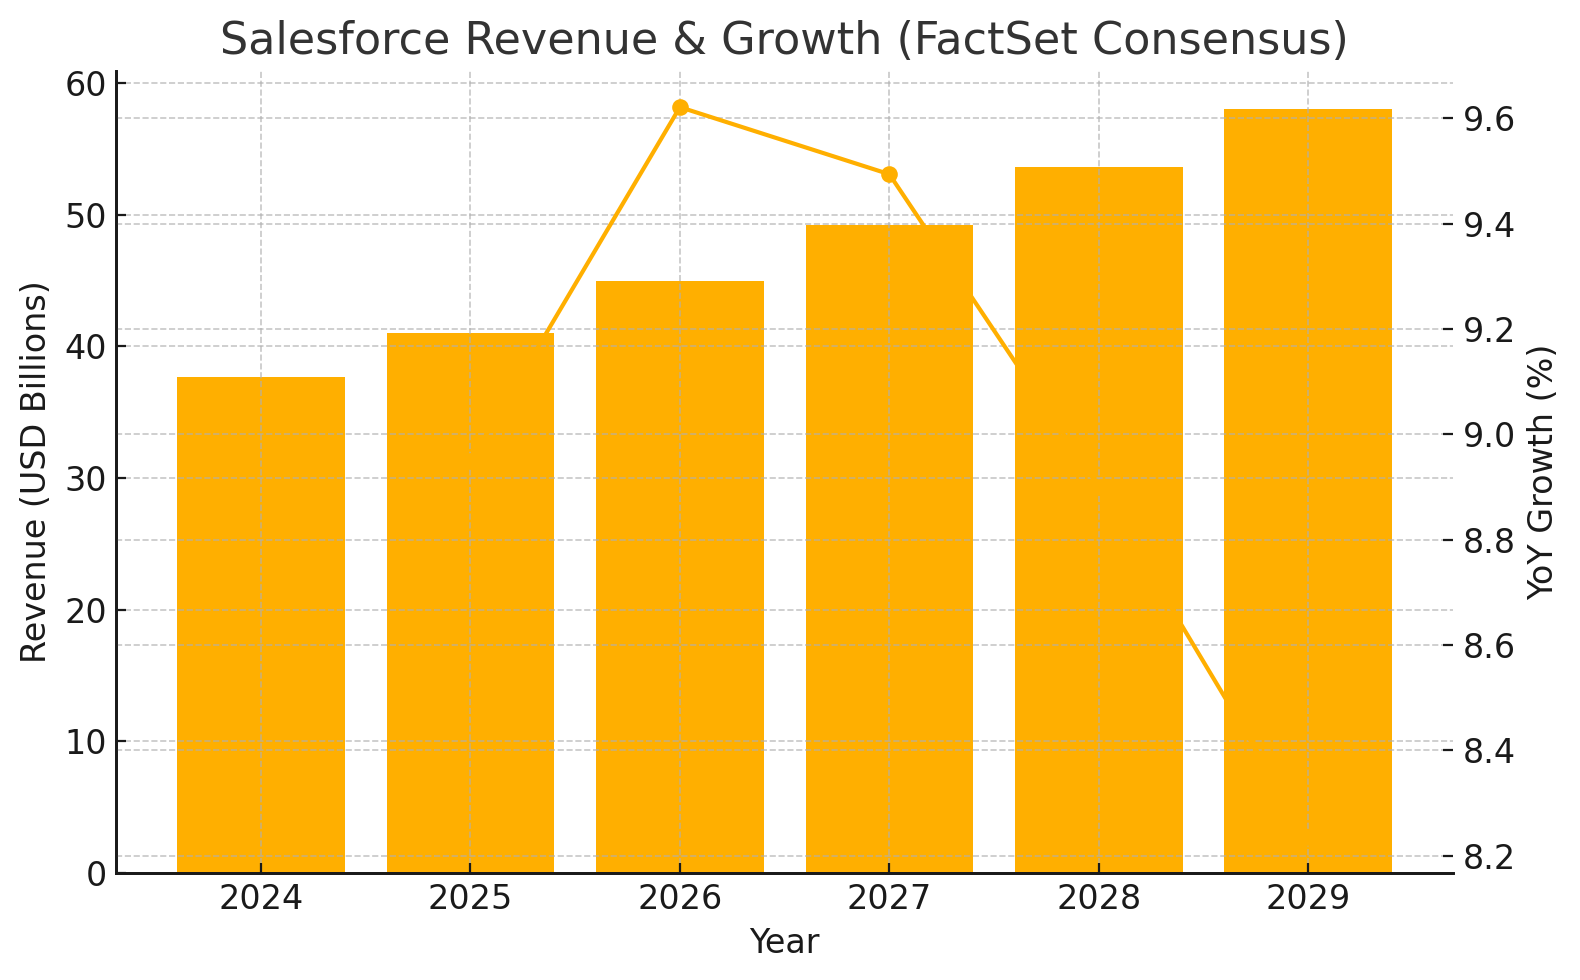
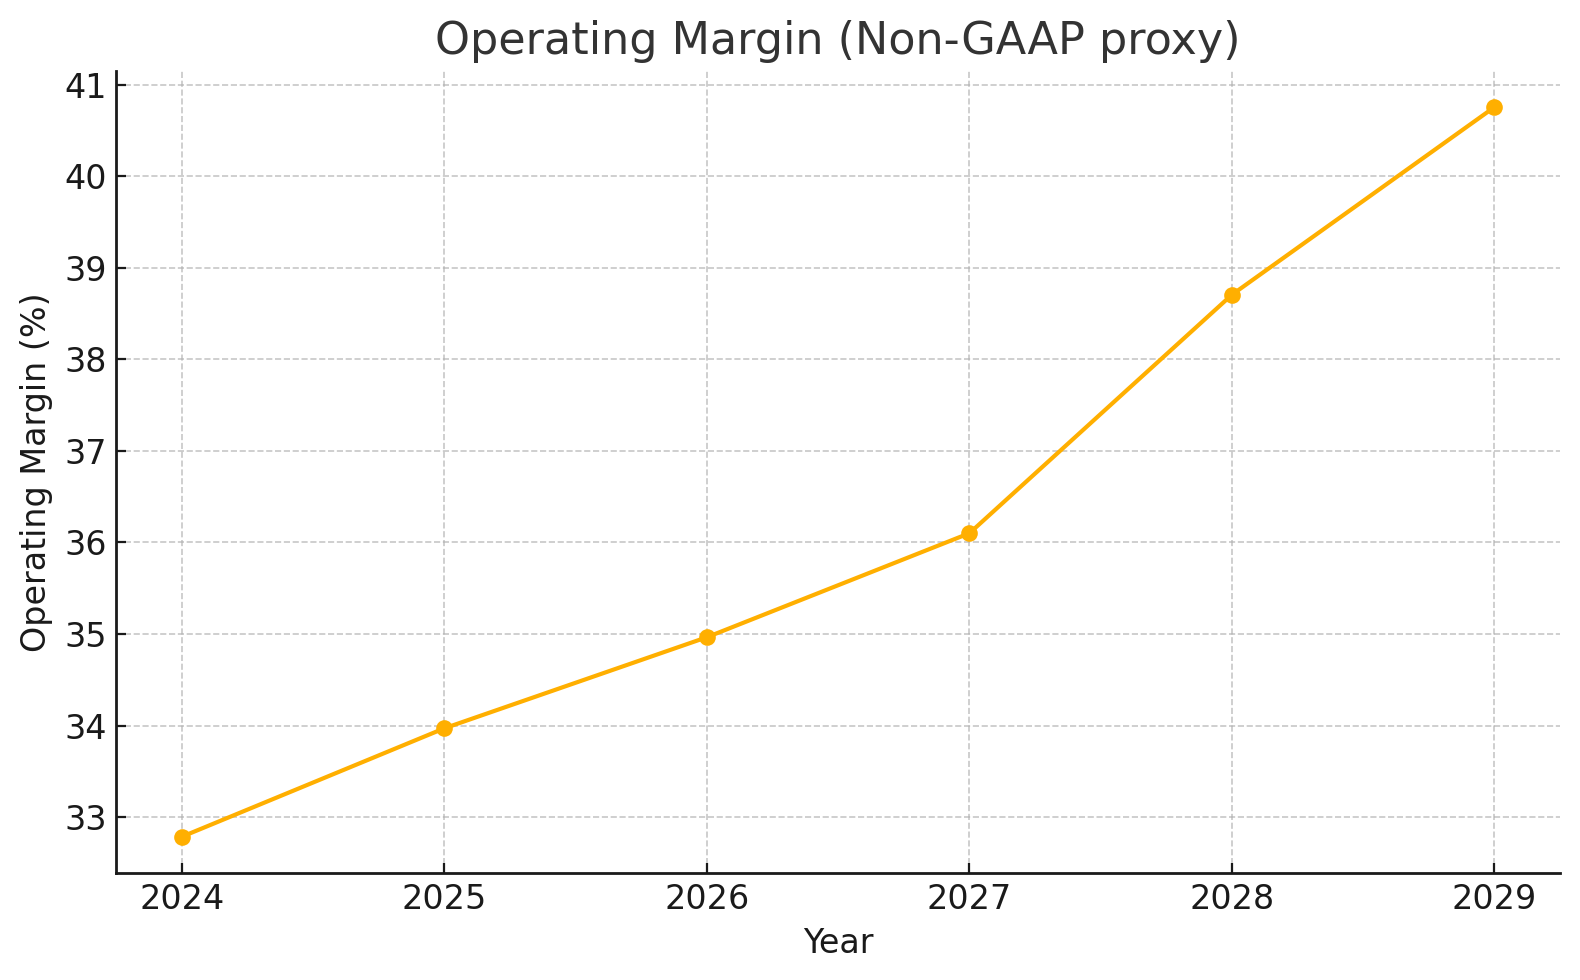
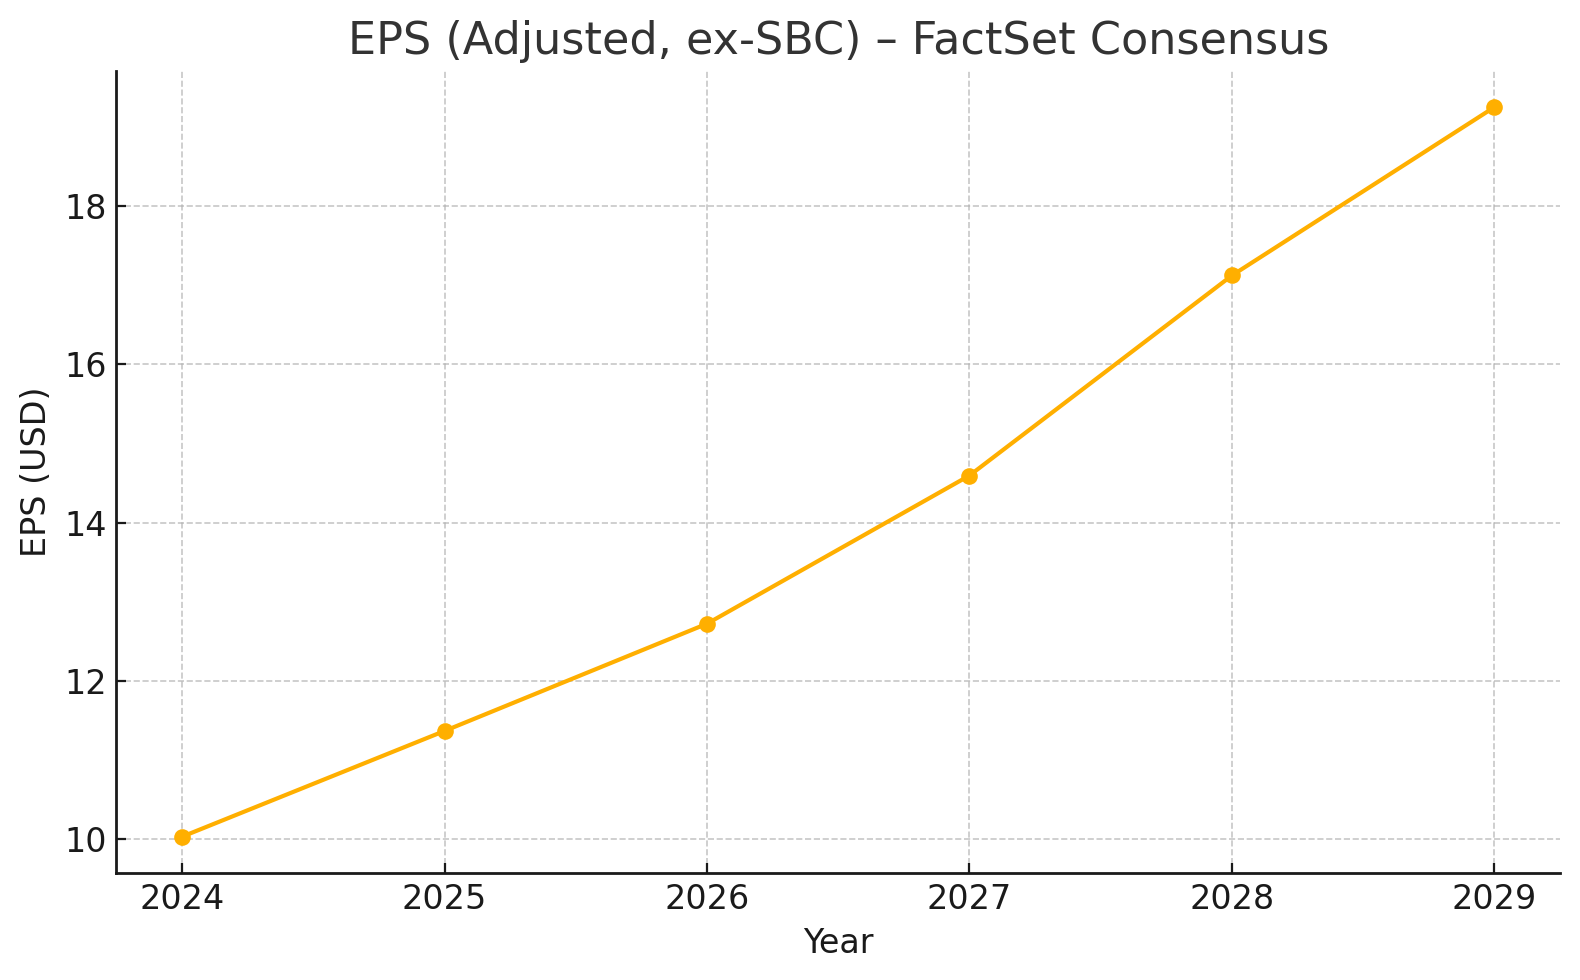
FactSet base case (CY 2024–2029): Revenue CAGR ~9.0% (to $58.0B), operating margin trending toward ~41%, adj. EPS CAGR ~13.9% (to $19.24). (See charts/tables below.)
Probabilities (our estimate):
≥13% revenue CAGR (5‑yr): 25%
≥13% EPS CAGR (5‑yr): 70%
Overcome seat‑model & macro headwinds inside 12–18 months: 75% (aligned with management’s comments and backlog/billings trends). Morningstar+1
Key risks: Persistent IT‑spend softness, pricing/model transition risk if AI reduces “seats,” and integration/program‑execution risk (e.g., Informatica). None appear thesis‑breaking today. Morningstar
1) What just happened — Q3 FY26 (quarter ended Oct 31, 2025)
Revenue & margins: $10.26B (+9% YoY; +8% cc), non‑GAAP op margin 35.5%, GAAP op margin 21.3%. Operating cash flow $2.3B (+17% YoY). Business Wire
Backlog: cRPO $29.4B (+11%); RPO $59.5B (+12%) — management called it a “powerful pipeline of future revenue.” MarketWatch+1
AI momentum: Agentforce + Data 360 ARR ≈ $1.4B (+114%); Agentforce >$500M ARR (+330%); 3.2T tokens processed; 9.5k+ paid Agentforce deals (↑50% QoQ); 50% of AI bookings from existing‑customer expansions. Salesforce+1
Billings: ≈13% YoY acceleration, above revenue growth (bullish near‑term indicator). Morningstar
Guidance (updated):
FY26 revenue: $41.45–$41.55B (raised). FY26 non‑GAAP op margin: ~34.1%. Adj. EPS: $11.75–$11.77. Reuters+1
Q4 revenue: $11.13–$11.23B, which includes ≈$300M from Informatica; the deal closed Nov 18, 2025. Morningstar+1
Morningstar’s take (Dec 4, 2025): “AI momentum is undeniable” with notable Agentforce strength; fair‑value $325 maintained; seat‑based model scrutiny persists, but AI is more tool than threat; management still expects revenue to accelerate in 12–18 months. Morningstar
2) Is the investment thesis broken?
No — it’s intact and evolving.
Evidence: (i) record profitability and rising backlog; (ii) rapidly scaling AI products that add to spend per customer; (iii) guidance raised despite a tough enterprise‑software tape; (iv) valuation discipline (buybacks/dividend) supporting EPS compounding. Morningstar’s unchanged $325 fair value and positive stance reinforce this view. Morningstar
3) What the FactSet consensus says (your file, CY 2024–CY 2029)
Key metrics (consensus): revenue $37.65B → $58.03B (CAGR 9.04%), operating margin 32.8% → 40.8%, adj. EPS (ex‑SBC) $10.03 → $19.24 (CAGR 13.91%).
“Rule of 50” trend: steady march toward ~49 by 2029 (8.2–9.6% revenue growth plus ~41% margin).
Charts (generated from your FactSet workbook):
Revenue & growth (bars + line)
Operating margin (%)
Adj. EPS (ex‑SBC)
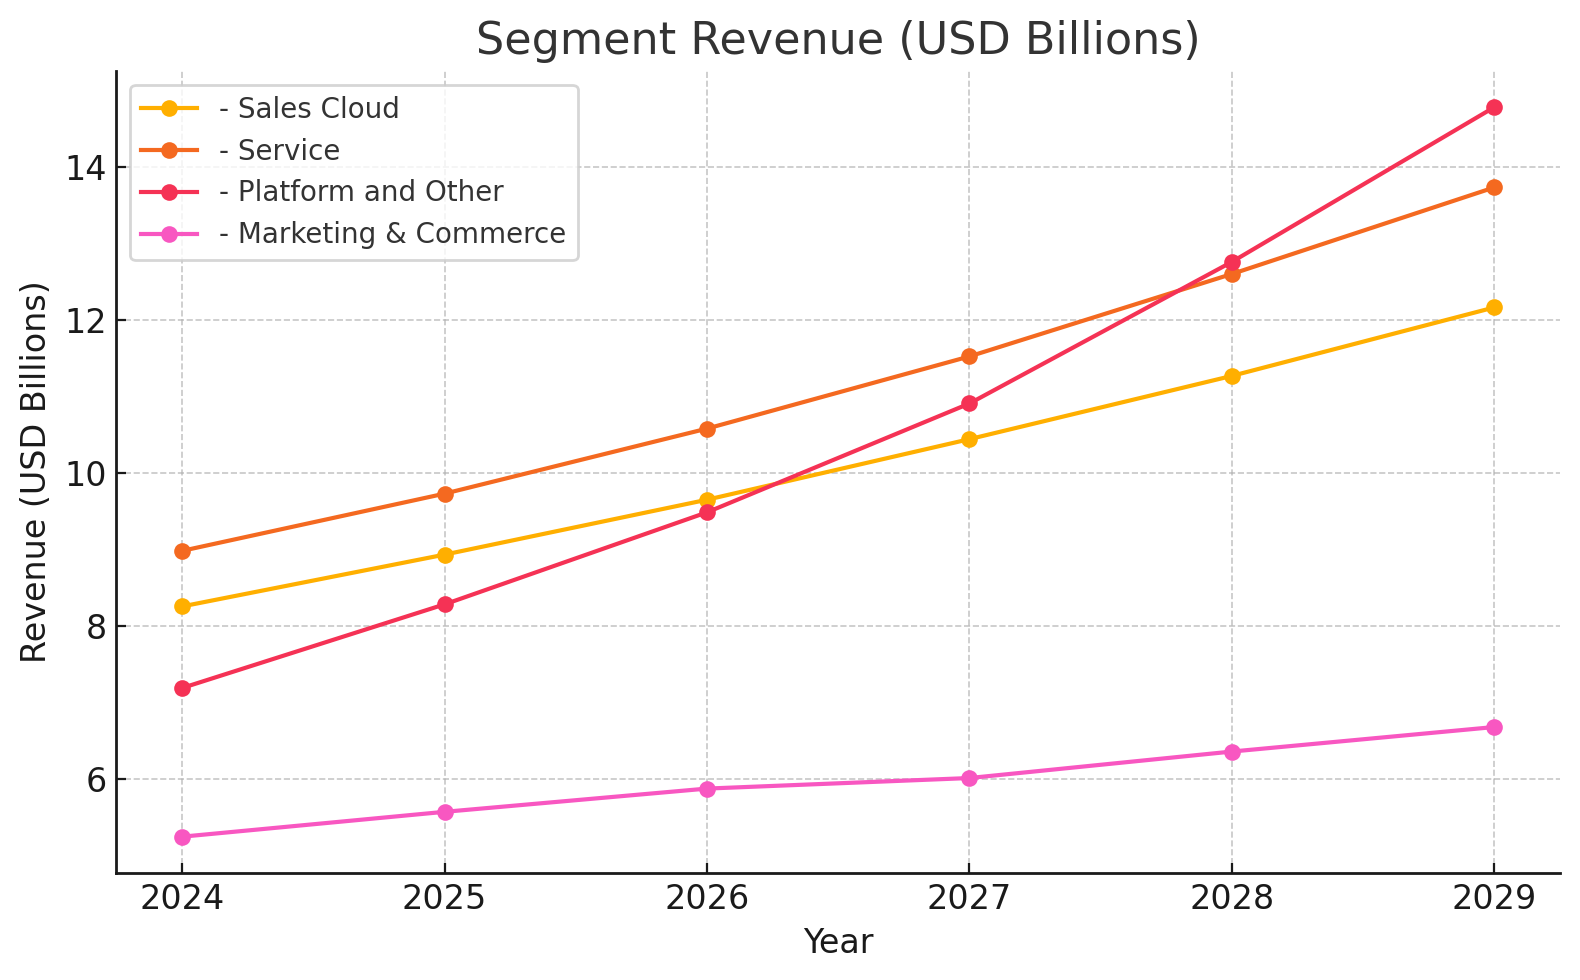
Segment trajectories (Sales Cloud, Service, Platform & Other, Marketing & Commerce)
(Charts are shown above; also included in the downloadable slides.)
Year‑by‑year summary (FactSet consensus):
|Year|Sales (USD B)|Revenue YoY %|Operating Margin %|EPS ex-SBC|EPS ex-SBC YoY %|
|---|---|---|---|---|---|
|2024|37.65|nan|32.79|10.03|nan|
|2025|41.01|8.95|33.97|11.37|13.30|
|2026|44.96|9.62|34.96|12.72|11.91|
|2027|49.23|9.49|36.10|14.59|14.70|
|2028|53.61|8.90|38.71|17.12|17.30|
|2029|58.03|8.24|40.76|19.24|12.41|
2024 vs 2029 with CAGR:
|Metric|2024|2029|5y CAGR %|
|---|---|---|---|
|Revenue (USD B)|37.65|58.03|9.04|
|Operating Margin %|32.79|40.76|24.31*|
|Adj EPS (ex-SBC)|10.03|19.24|13.91|
*Margin change is percentage increase, not percentage points.
“Rule of 50” (Revenue growth + Operating margin):
|Metric|Revenue YoY %|Operating Margin %|Rule of 50|
|---|---|---|---|
|2025|8.95|33.97|42.92|
|2026|9.62|34.96|44.59|
|2027|9.49|36.10|45.59|
|2028|8.90|38.71|47.61|
|2029|8.24|40.76|48.99|
Segment mix & CAGRs (USD B):
|Year|2024 (USD B)|2029 (USD B)|5y CAGR %|
|---|---|---|---|
|- Sales Cloud|8.26|12.17|8.06|
|- Service|8.99|13.74|8.86|
|- Platform and Other|7.19|14.79|15.50|
|- Marketing & Commerce|5.25|6.68|4.95|
(Source for all tables/charts in this section: your uploaded FactSet Excel.)
4) Can they overcome today’s headwinds?
Primary headwinds: slower enterprise IT budgets; scrutiny of the seat‑based model in an AI world; and integration/execution risk from acquisitions. Morningstar explicitly notes the seat‑model has been under pressure across software in 2025, but reiterates AI looks like a tool, not a threat. Management expects re‑acceleration in 12–18 months, supported by billings/backlog and AI adoption. Morningstar
Why we think they can:
Demand indicators turned up: billings growth (~13%) > revenue growth; cRPO/RPO accelerated. Morningstar+1
AI monetization path: tangible ARR already $1.4B; usage metrics and deal counts are scaling fast; upsell to existing base is working (50% from expansions). Salesforce+1
Pricing model flexibility: increasing use of usage‑/value‑based pricing for AI features should offset any seat‑compression. (Management commentary + product packaging observed in Q3 coverage.) MarketWatch
Integration capacity: Informatica closed Nov 18 and is embedded in the outlook; management reaffirmed full‑year profitability targets. Salesforce+1
Our probability that Salesforce overcomes these headwinds within 12–18 months: ~75% (above even odds, consistent with pipeline/billings and Morningstar’s read‑through). Morningstar
5) Probability analysis — growth versus expectations
What exactly is “13%+ per year”?
Revenue: Analysts do not expect 13% revenue CAGR — the FactSet base case is ~9% through 2029.
EPS: Analysts do expect ~teens EPS growth — your FactSet file implies ~13.9% adj‑EPS CAGR to 2029.
Our probability estimates (next 5 years):
TargetOur probabilityWhyRevenue CAGR ≥ 13%25%Requires durable macro tailwind and continued AI‑led upsell/new logos lifting growth to low‑mid teens; plausible but needs near‑perfect execution.EPS CAGR ≥ 13%70%Margin expansion (already in motion), operating leverage, and buybacks can sustain teens EPS growth even if revenue is ~9–11%.Beat consensus EPS path (≥15% EPS CAGR)35%Upside from faster AI monetization and “Rule‑of‑50” progress; probability limited by macro and pricing friction.Miss on EPS (<10% EPS CAGR)20%Would require prolonged macro softness, slower AI monetization, or integration hiccups that cap margins.
Scenario framing (revenue/EPS; probabilities sum to 100%):
Bull (~20%) — Revenue 12–15% CAGR; EPS 15–20% CAGR; AI unlocks new spend and accelerates upgrades.
Base (~60%) — Revenue 9–11%; EPS 12–15%; gradual margin climb to upper‑30s%/~40%, matching the FactSet trajectory and management’s long‑term aim.
Bear (~20%) — Revenue 5–7%; EPS 7–10%; macro drag persists and/or AI monetization slower.
6) Valuation & thesis verdict
Valuation anchor: Morningstar FVE $325 (Dec 4, 2025) and “attractive” posture post‑print; Street commentary likewise points to improving sentiment after the raise. Morningstar+1
Verdict: Thesis intact. Salesforce is transitioning from hyper‑growth to profitable growth while layering in new AI revenue streams. With backlog strength, rising margins, and credible AI adoption metrics, the path to management’s long‑term “Rule of 50” looks realistic. We view the probability of meeting or exceeding the consensus EPS growth path as high, while a 13% revenue CAGR remains an upside case, not the base case. Business Wire+1
7) What to watch next (signposts)
AI ARR growth & attach rates (Agentforce/Data 360) and % of bookings from expansions vs. new logos. Salesforce
Billings and cRPO trends staying above revenue growth (re‑acceleration signal). Business Wire
Seat‑model evolution (credit/usage‑based add‑ons, packaging of AI entitlements) to defend/expand ARPU. MarketWatch
Informatica integration milestones and incremental contribution versus guidance. Salesforce
Operating margin cadence toward high‑30s/≈40% through 2028–2029 (FactSet trend).
8) Appendix — Charts & Tables (FactSet consensus)
Revenue & growth (bars + line)
Operating margin (%)
Adj. EPS (ex‑SBC)
Segments (Sales Cloud, Service, Platform & Other, Marketing & Commerce)
Downloadables:
Slides with all charts: Download PPTX
Summary tables (Excel): Download XLSX
Data & sources: Earnings metrics and AI ARR, backlog, and guidance from Salesforce Q3 FY26 press materials and coverage; Morningstar equity note Dec 4, 2025; FactSet consensus (your file) for 2024–2029 projections. Morningstar+3Business Wire+3Reuters+3
Footnoted source details
Salesforce Q3 FY26 results release (Dec 3, 2025): revenue $10.3B (+9% YoY), non‑GAAP op margin 35.5%, cRPO $29.4B (+11%), RPO $59.5B (+12%). Business Wire
Agentforce/Data 360 ARR ≈ $1.4B (+114%), Agentforce > $500M ARR (+330%), 3.2T tokens, 9.5k+ paid deals; half of AI bookings from expansions. Salesforce+1
Morningstar (Dan Romanoff, Dec 4, 2025): billings ~+13% YoY; seat‑model scrutiny; AI more tool than threat; FVE $325; re‑acceleration expected in 12–18 months; Q4 revenue $11.13–$11.23B including ~$300M from Informatica. Morningstar
Informatica deal closed Nov 18, 2025 and is reflected in guidance. Salesforce