Humans are storytelling creatures, and we CRAVE certainty, even if it’s just the illusion of certainty.
That’s why we LOVE predictions! Even if they are nothing more than plausible-sounding probabilities disguised in smart-sounding words.
Have you ever watched CNBC, or Bloomberg, or Fox Business, and been impressed (and possibly terrified) by a really smart head of equity research for some major investment bank? And felt the need to immediately act on that information? And then the very next guest, with equally impressive credentials, said the opposite?! With equal confidence?!
Let me walk you through a big picture review of the economy, corporate profits, and market earnings, filtered through the #1 headline of the last few weeks. Let’s look at what the best available actual facts tell us.
Remember that all models are wrong, but some are useful.
All narratives, no matter how smart-sounding, must always explain the data, not the other way around.
The truth is the truth, and you don’t have to understand it; you just have to live by it.
The one thing I can always promise is that every narrative I tell you, every plausible-sounding story explaining the data, will be wrong. But it will be the least wrong model and narrative I know, and when we’re wrong, we’re never wrong for long. 😉
And most importantly, I’ll always walk you through the data, so you can see why I consider it the most true interpretation of the truest facts we have.
Before We Begin: The Most Important Thought Experiment You’ve Never Heard Of (Why “Playing” Geopolitics Sounds Smart But Isn’t)
Imagine you had insider information about a stock, and it might move 10%, 20%, or even 30%!
You might be tempted to invest 1%, 5%, or even 10% of your entire life savings based on that. Sure, maybe the insider is wrong, but if he’s right?!
Investing based on geopolitics is a similar siren song. “How can I PLAY Venezuela?! Or Iran? Or Russia Invading Ukraine?!”
That’s the wrong way of thinking about headline events, and here’s why.
What if you invested 1% of your $1 million portfolio based on geopolitics and were right? That’s $10K invested, and you make $1K to $3K.
What if you are super aggressive and invest 10% of your portfolio? Then congrats! You’ve made $10K to $30K.
But a well-designed portfolio can earn 10% to 15%.
So that $30K in profit you’re so proud of? That’s 3% of the portfolio. In 3 to 4 months, had you done nothing, you would have earned it anyway.
So you can do a lot of stressful thinking and trading to make 3%… or you can earn 3% in 3 to 4 months by doing nothing. Which is the smarter move?
I Consider Worrying About Markets To Be Work😉
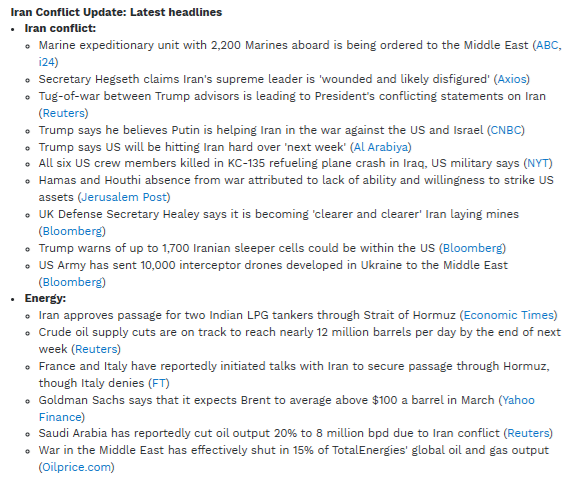
Iran War Update: The Short & Sweet Version (For Those With Busy Lives)
War in Iran: what regular investors need to know (March 13, 2026)
How it started: This is really a second round, not a brand-new conflict. It follows the 12-day Israel-Iran war in June 2025. The current round began on February 28, 2026, when the U.S. and Israel launched strikes aimed at Iran’s leadership and at what they describe as its nuclear and ballistic-missile threat; the first wave killed Supreme Leader Ali Khamenei and other senior figures.
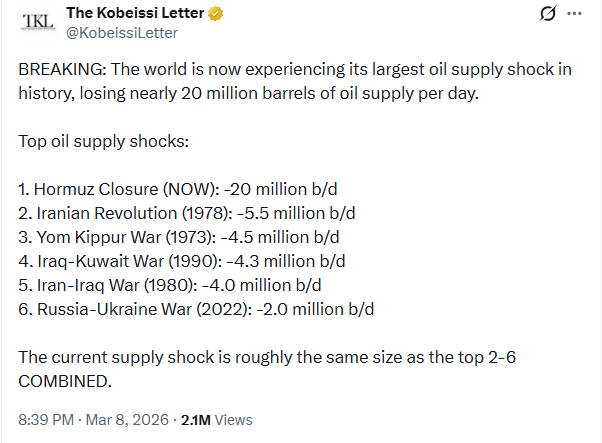
Where it stands now: The U.S. and Israel have the military edge and have badly damaged Iran’s missile arsenal, navy, and ability to support regional allies. Iran’s answer has been to make the war economically painful: missiles and drones, tanker attacks, and an effective chokehold on the Strait of Hormuz, where traffic is down about 97%. Oil is back above $100, and the IEA says this is the biggest oil-supply disruption in history.
Most likely outcome: Base case: not regime change and not a neat peace deal, but a pressured de-escalation after both sides claim victory. Iran’s regime looks weakened but not close to collapse, and Washington’s stated aims have already shifted from stopping an imminent threat to crippling Iran’s nuclear program to replacing the government. That usually means the endgame gets bargained, not cleanly “won.” Reserve releases and early diplomacy around the Hormuz point in the same direction. This is still a judgment call, not a certainty.
Plain-English investor takeaway: This is less a “who wins militarily?” story and more a “how long can Iran keep oil and shipping disrupted?” story. That duration is what markets will care about most, especially for energy, airlines, industrial supply chains, and inflation-sensitive stocks.
What Does This Likely Mean For You? The Answer Might Shock You
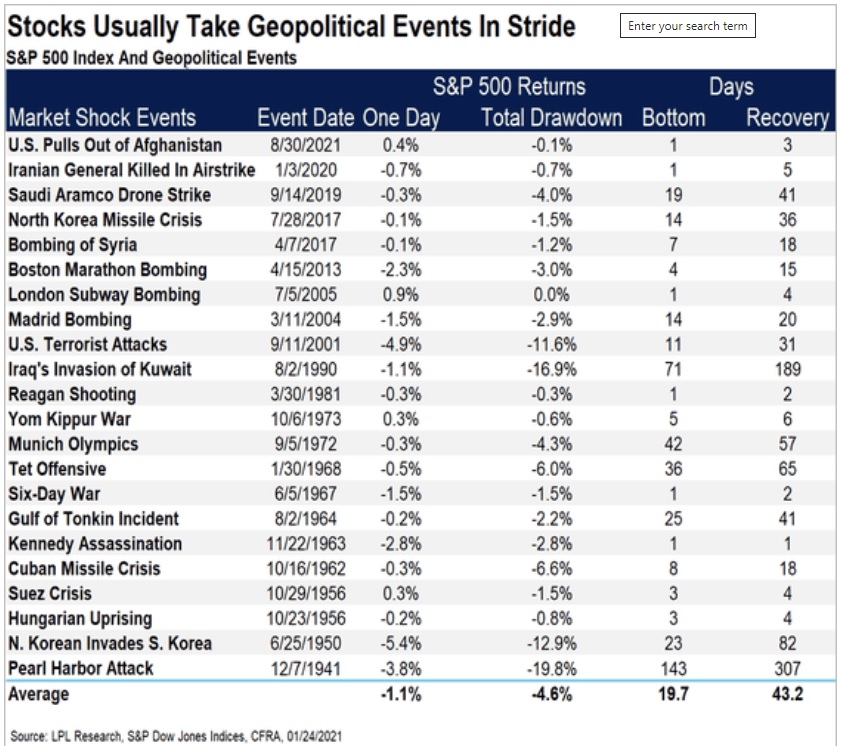
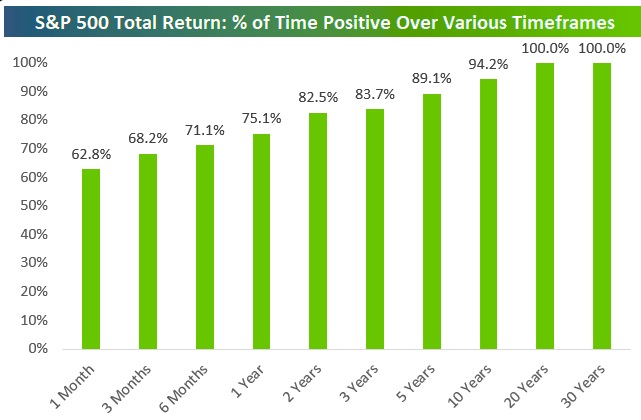
Historically, we’re Close To The Bottom
What about wars in particular?
Why Are Investors Worried About War Again? 😉
*The answer is a sequence of return risk.
** And the solution to that is prudent asset allocation, NEVER hiding in cash and waiting for “the dust to settle”.
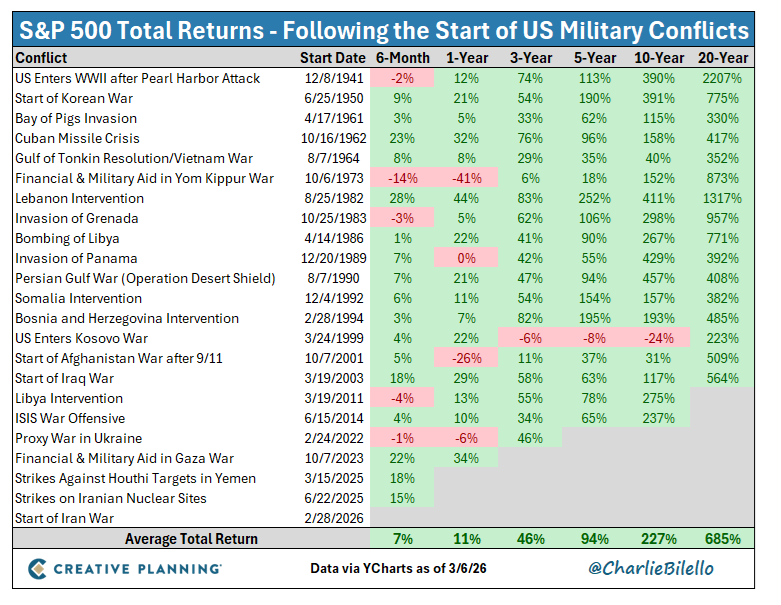
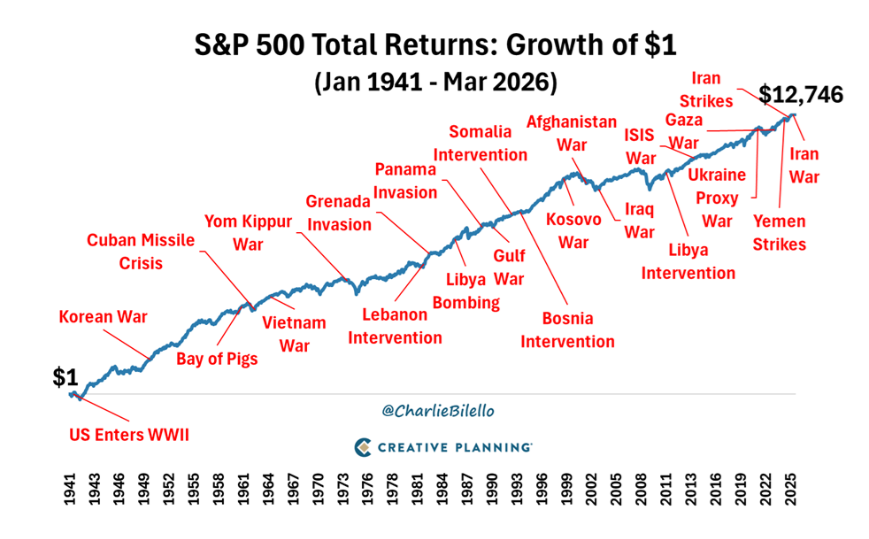
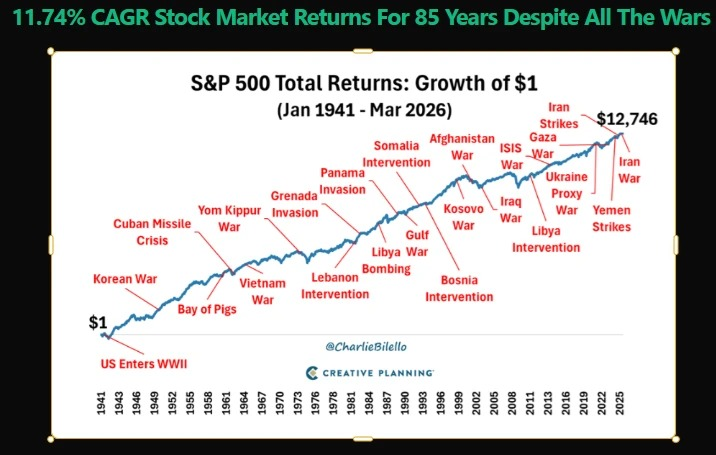
11.74% CAGR Stock Market Returns For 85 Years Despite All The Wars
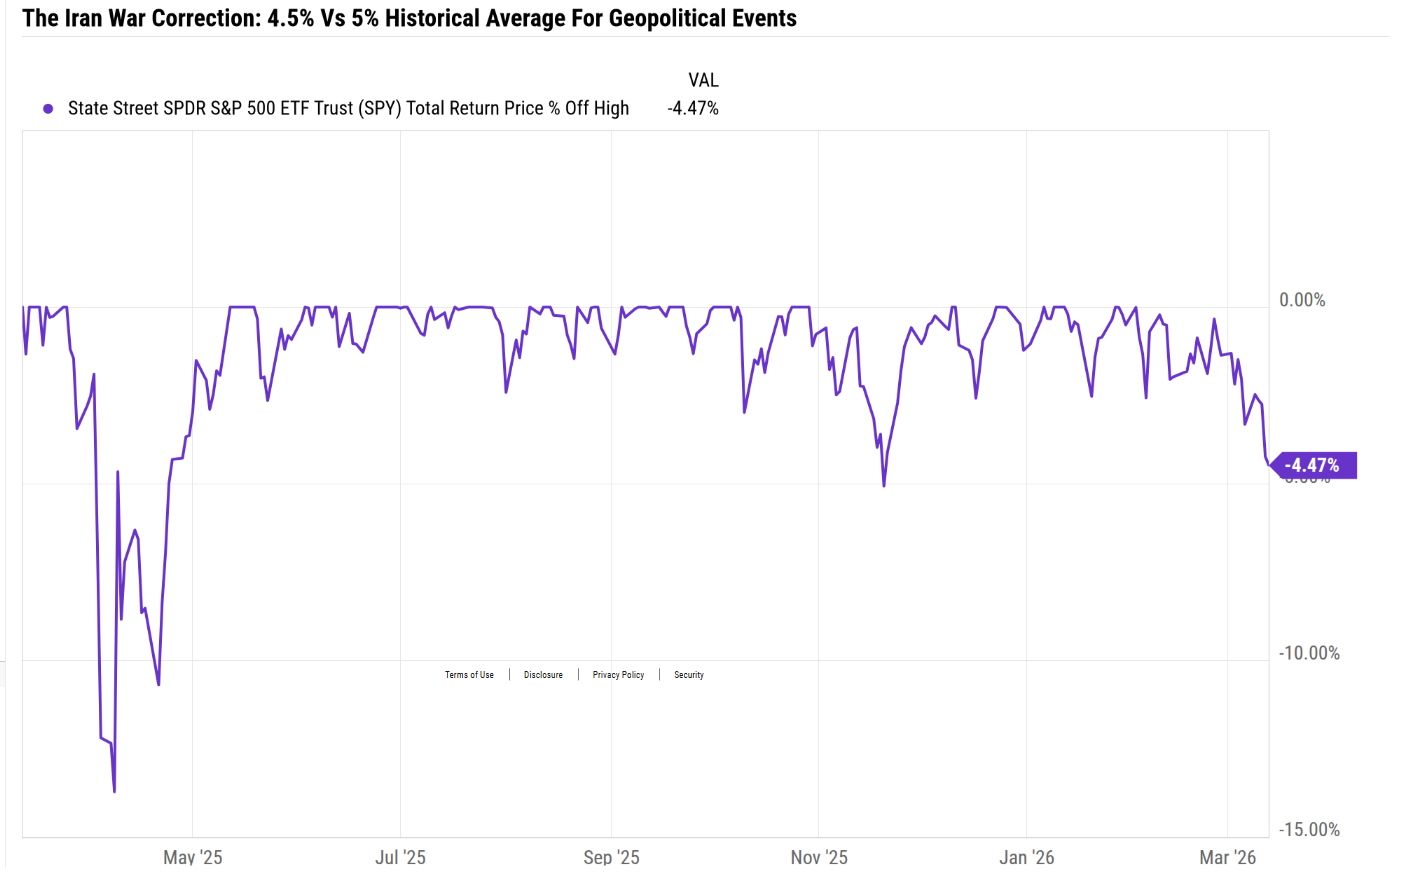
The surprising truth about geopolitical events like this is that they usually only trigger a 5% market decline (lasting an average of 1 month), and within 2 months of the bottom, stocks are at record highs.
So let me share with you something that might shock (and hopefully calm and delight you😉
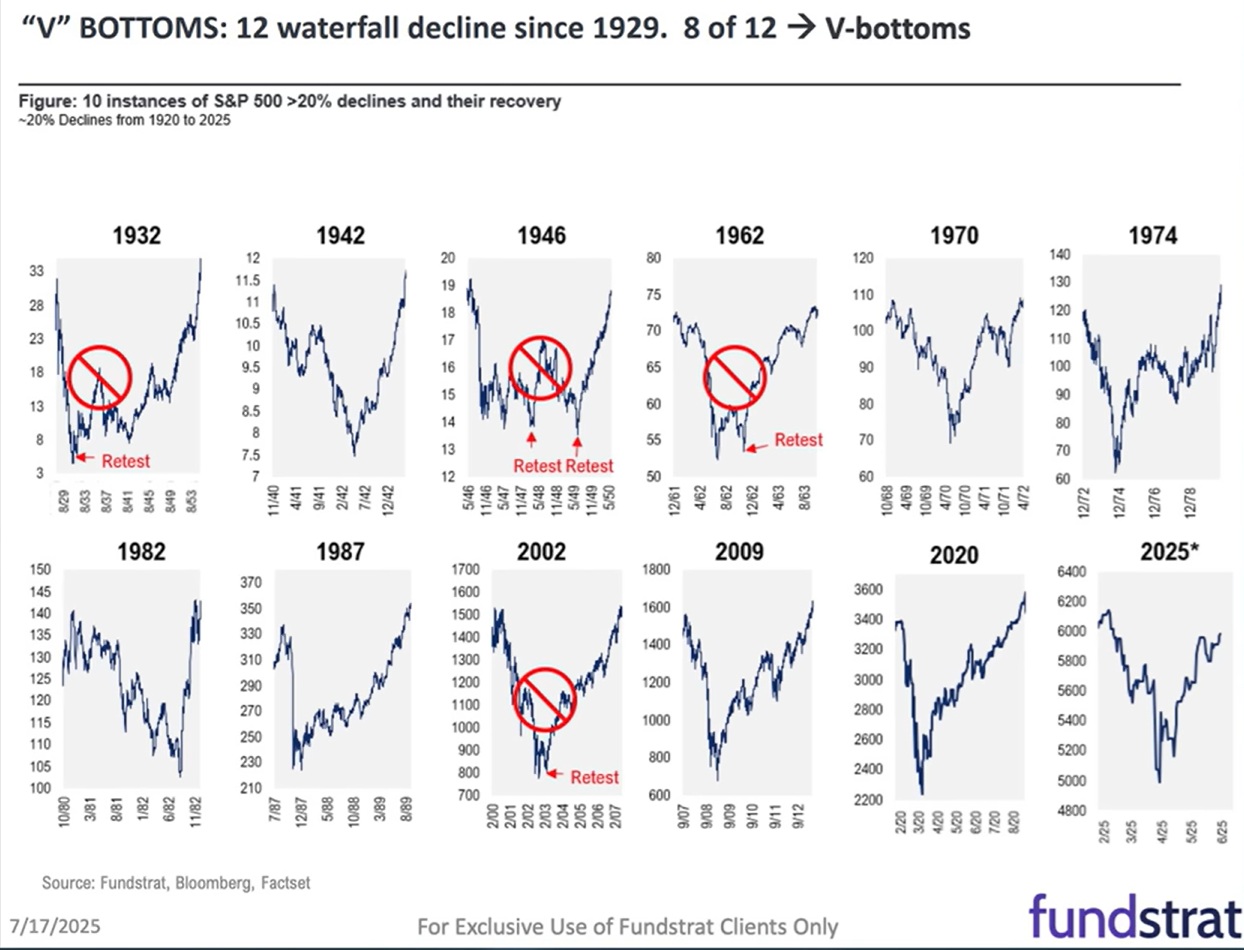
If March 12th Was the Bottom, This Chart Explains Why
Every downturn is slightly different, and very few are exactly in line with historical averages. But it can happen.
The COVID crash was exactly a 33% average historical bear-market decline.
The Oct 2022 bear market low was exactly 28%.
The April 2025 20% low was exactly the average non-recessionary bear market low.
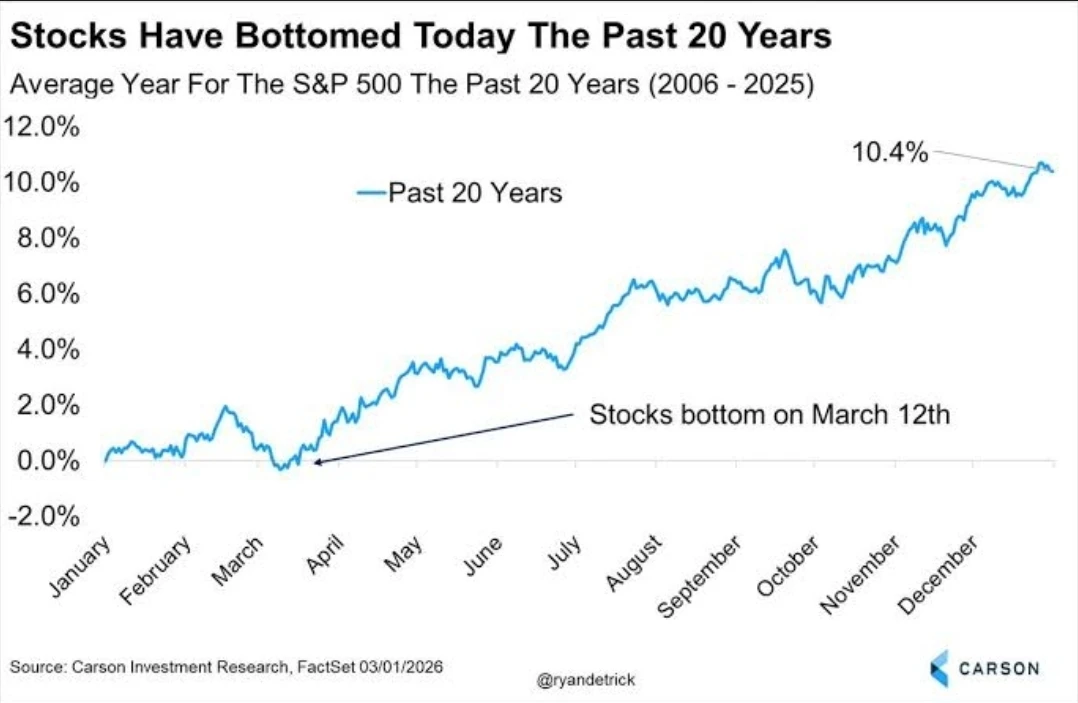
If the market bottoms on Thursday, March 12th, that would be consistent with the last 20 years of market data.
OK, those are some really interesting and optimistic charts and tables, but what about the Straits of Hormuz!?
Let’s Talk About The Largest Oil Shock In History
Can Iran Close the Straits of Hormuz?
The Strait of Hormuz is not Iran’s waterway alone. It lies between Iran and Oman, and the standard law-of-the-sea view is that international shipping has transit rights. But markets care less about legal theory than about whether ships can move safely. Iran does not need an airtight naval blockade to stop oil flows; it only has to make transit dangerous enough that commercial shipping refuses to move.
Iran has the tools to do that. The U.S. Defense Intelligence Agency says Iran can severely disrupt Hormuz with anti-ship missiles, drones, submarines, more than 5,000 naval mines, and hundreds of fast attack and inshore boats; its coastal anti-ship missiles can reach ships about 300 km from shore. The waterway is also physically vulnerable: at its narrowest point the Strait is 21 miles wide, but the shipping lanes are only about 2 miles wide in each direction. In a corridor that tight, even a small number of successful attacks—or credible reports of mines—can freeze traffic.
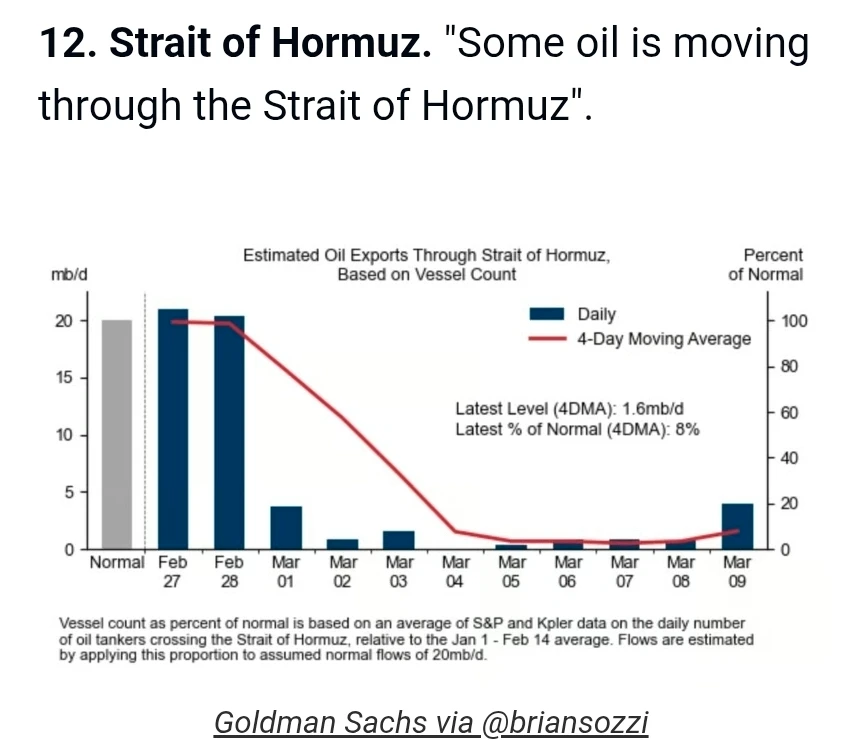
That is the key investor point: this is not mainly about whether Iran can “beat” the U.S. Navy in a long naval war. It is about whether Iran can keep the risk of transit above the commercial pain threshold. Right now, the answer is yes. Reuters reports U.N. data showing traffic through Hormuz down 97% since Feb. 28. The IEA says March global oil supply is on track to fall by 8 million barrels per day because of the blockage, while Gulf producers have cut output by at least 10 million bpd. Some ships are still getting through, which means this is not a perfect physical seal; it is a de facto closure driven by danger, uncertainty, and selective passage. Goldman's vessel-count chart showing roughly 1.6 mb/d, or 8% of normal, is directionally consistent with that picture.
Alternative routes help, but they are small relative to the problem. EIA estimates that Saudi Arabia and the UAE together have only about 2.6 million bpd of spare bypass pipeline capacity available, versus roughly 20 million bpd that normally moves through Hormuz. That means rerouting can cushion the blow, but it cannot replace the Strait.
My base case is that Iran can sustain a de facto disruption for weeks, but a total, airtight closure against a determined U.S.-led coalition is much harder to sustain for months. That is an inference, not an official forecast. The public evidence points to a staged reopening, not a flip of a switch: on March 10 the U.S. Navy was still telling the shipping industry escorts were too risky for now, but by March 12 Washington was openly planning escorted passages once it had stronger control of the airspace and had further degraded Iran’s missile threat. The IEA also expects some recovery from April as Saudi and UAE bypass routes ramp up, while warning that shut-in production could still take weeks or months to normalize. Reuters also reported Goldman Sachs now models roughly 21 days of very low flows, around 10% of normal, followed by about 30 days of gradual recovery. Treat that as a market scenario, not a certainty.
So the practical answer to “when does oil start flowing again?” is: some oil is already flowing, a broader restart could begin in phases from late March into April if the missile/drone threat is pushed down and escorts become viable, but full normalization is more likely a weeks-to-months story than a days story. Prices can ease before volumes are fully restored, because markets react to movement from paralysis to partial flow long before the all-clear is sounded.
This is a big reason so many investors fear something like this.
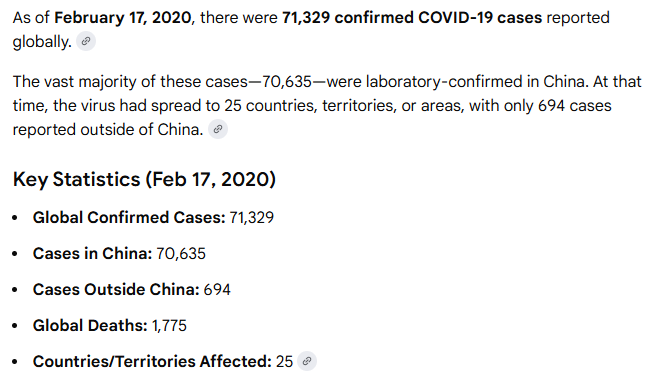
During COVID, the market peaked on Feb 17th.
Cases were spreading exponentially right up to that point.
The Market Didn’t Care About COVID…Until It Was All The Market Cared about
If the Straits of Hormuz are closed, then what is the world going to do?
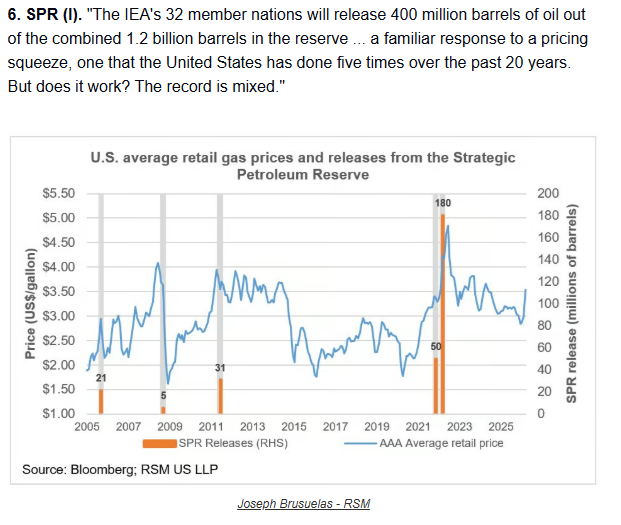
The International Energy Agency’s 32 members are planning to release 33% of their oil reserves to help offset the shortfall. Is that going to work?
Why It’s Not Going To Work
If you define “work” as making up a 20 million bpd shortfall in crude supply, then no, the G7 has 1.2 million bpd in throughput capacity on its oil reserves.
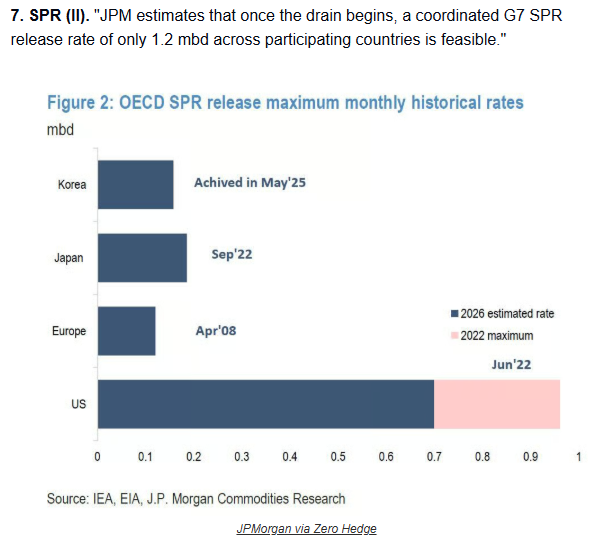
What about the rest of the 25 nations that are coordinating their oil reserve releases together?
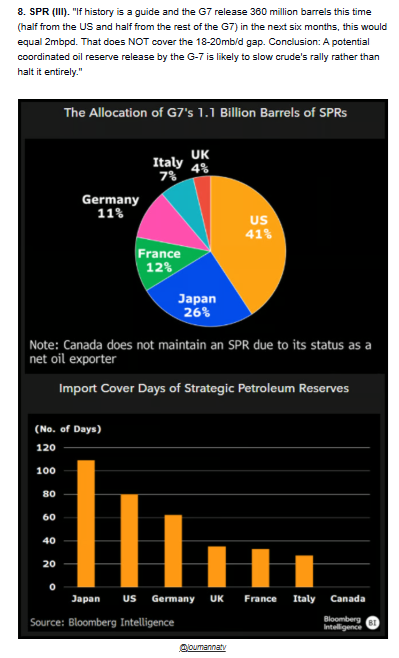
The world’s 32 oil reserves have a throughput of 2 million barrels per day. That means the capacity through the pipes connected to those 1.2 billion barrels of oil.
The world uses about 100 million barrels per day, so global reserves amount to just 12 days of global demand.
At 100% capacity, the oil reserves can be drained in 600 days.
For every 50 barrels in reserve, there is just 1 daily barrel of capacity
OK, that sounds terrifying! Doesn’t this mean crude is going to skyrocket to record highs? Isn’t the global economy going to crash, COVID-style? Isn’t the stock market going to tank? Don’t we all have to do something?!
Why The Terrifying Numbers Don’t Actually Matter As Much As You Think
I love keeping people calm because the end of the world is statistically rare.
I personally promise you the world will never end. Because if it does, we’ll be too dead to care. I was wrong😉😂
I’m the Funniest, Delightful Finance Nerd, But Hardly Alone😉😂
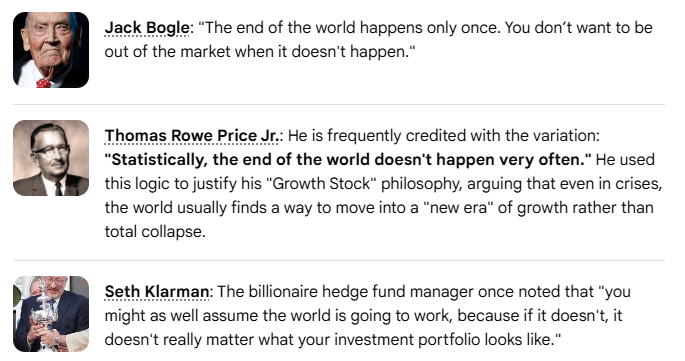
OK, so before we all freak out and start dumping our stocks due to this 4.5% pullback…let’s take a deep breath and listen to some really smart people…with charts!😉
Calm Down And Carry On…Look At The Actual Data…Not The Speculative Worst Case Scenarios

OK, so here’s why I’ve not been losing sleep over the war. And neither should you!
The Straits of Hormuz don’t belong to Iran; they are merely being threatened, so insurance companies are telling customers they are invoking Force Majeure (act of god) provisions, which means if a tanker is sunk, the insurance company doesn’t have to pay out.
That’s how the threat of a few hundred mines that wouldn’t actually sink that many ships is able to cut off the oil so quickly.
After 9/11, the economy dipped into the mildest recession in history (0.2% peak GDP decline), not because of the economic impact of the towers falling, but consumers being scared that more attacks might be coming, so they stayed home and spent less.
This is an equivalent effect, but with oil tankers.
Oil is likely to start flowing through the Straits simply because Iran doesn’t have the military capability to actually maintain a de facto blockade.
But isn’t the disruption so large that it’s like a COVID shock?
An Impressive & Scary Chart…BUT Not As Scary As You Think
The world is far less reliant on oil for each $1 in GDP than it used to be. The days of the 1970s, like oil shocks crippling the global economy, are unlikely to be repeated.
For one thing, the US is the world’s #1 oil producer, and shale oil can ramp up relatively quickly.
The Permian basin, by some estimates, has as much as 270 billion barrels of crude, the single largest oil reservoir in the world.
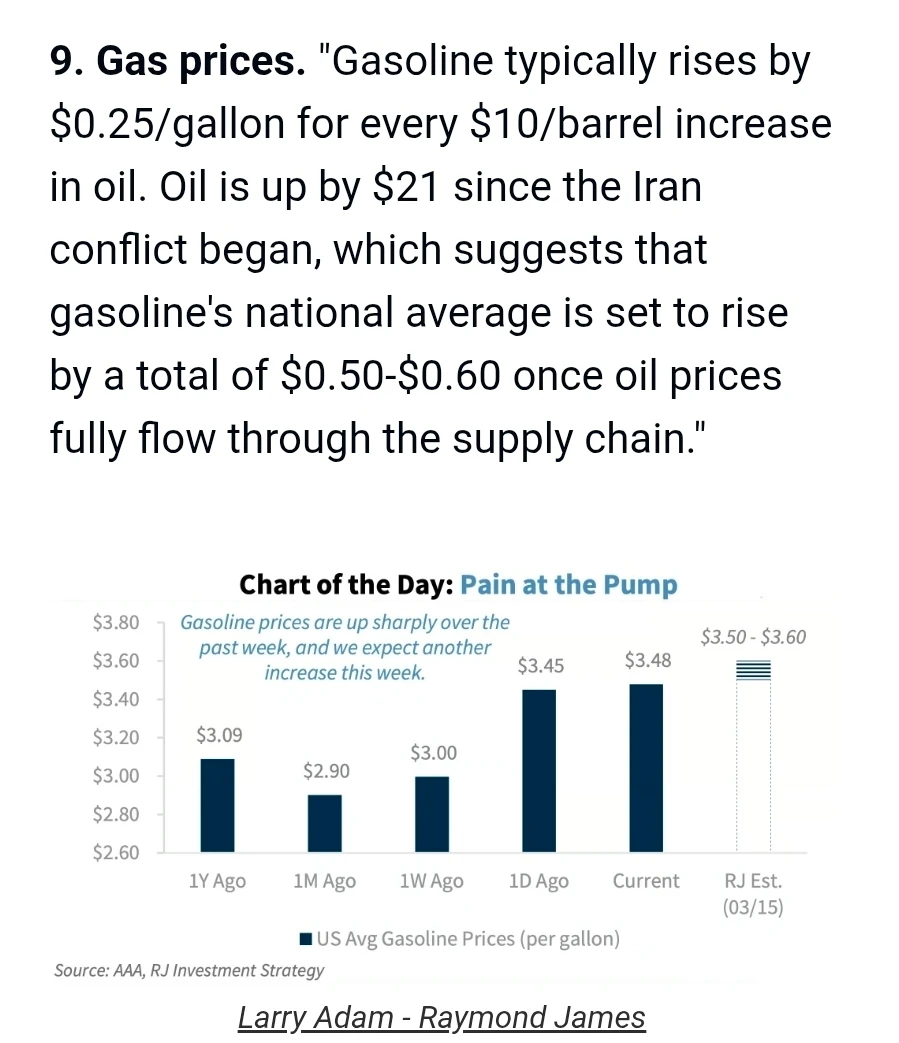
Crude was $70 before the war, $90 right now, so that’s $0.50 per gallon higher.
Even at the recent intra-day peak of $110, that’s a $1 increase in the price of gas.
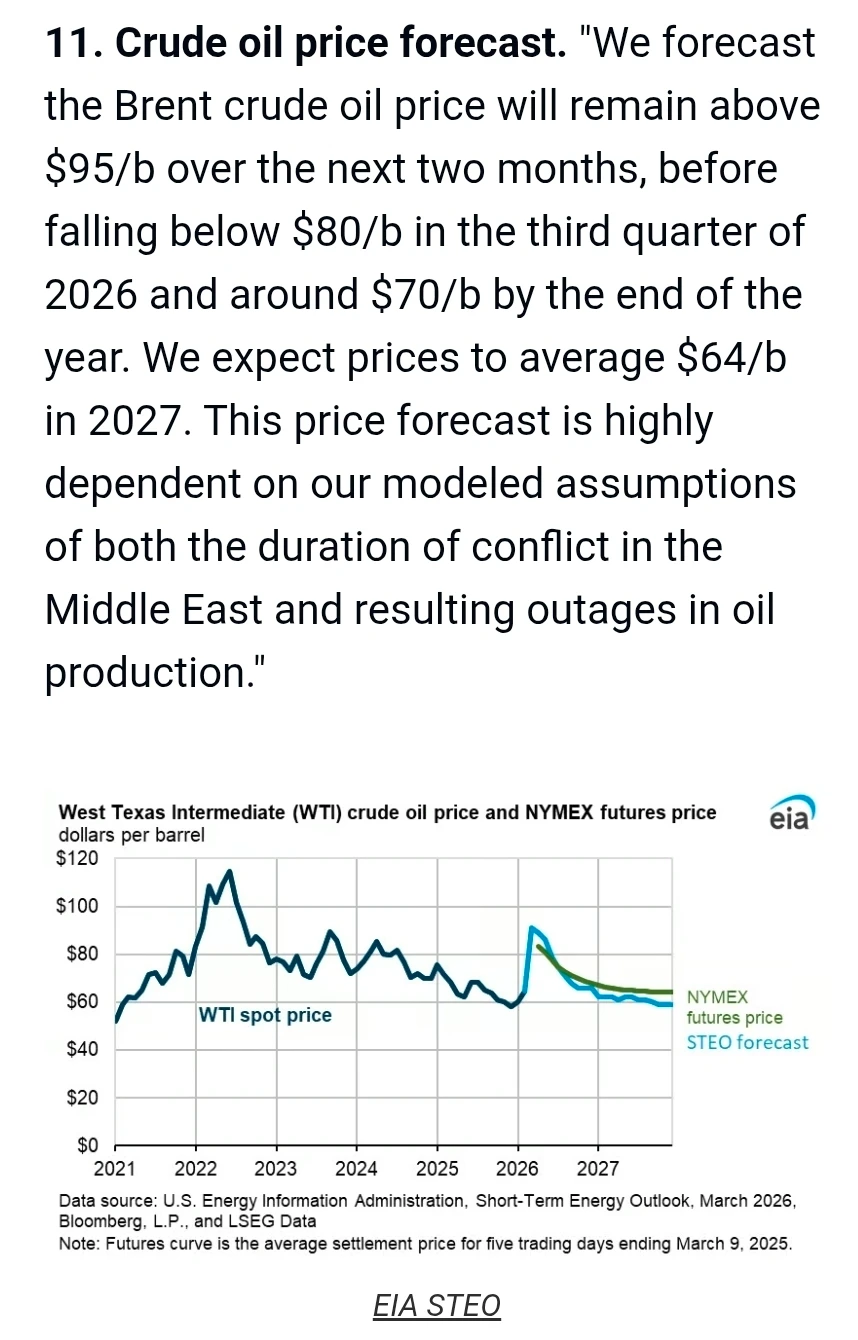
This might be just one model from the Energy Information Administration (US government), but so are any of the super scary models predicting $200+ crude.
$5 gas was the highest ever reached in the US (after the spike to $130 following the Russian invasion of Ukraine).
Don’t worry about $6 gas, because it’s not likely.
The probability of nuclear war in any given year is 1.1%. Do you lose sleep over that? It’s a bit more important than the price of gas😉 yet somehow you don’t obsess over the risk of nuclear apocalypse.😂
What Should Investors Do? Don’t Do Something! Stand There!😉
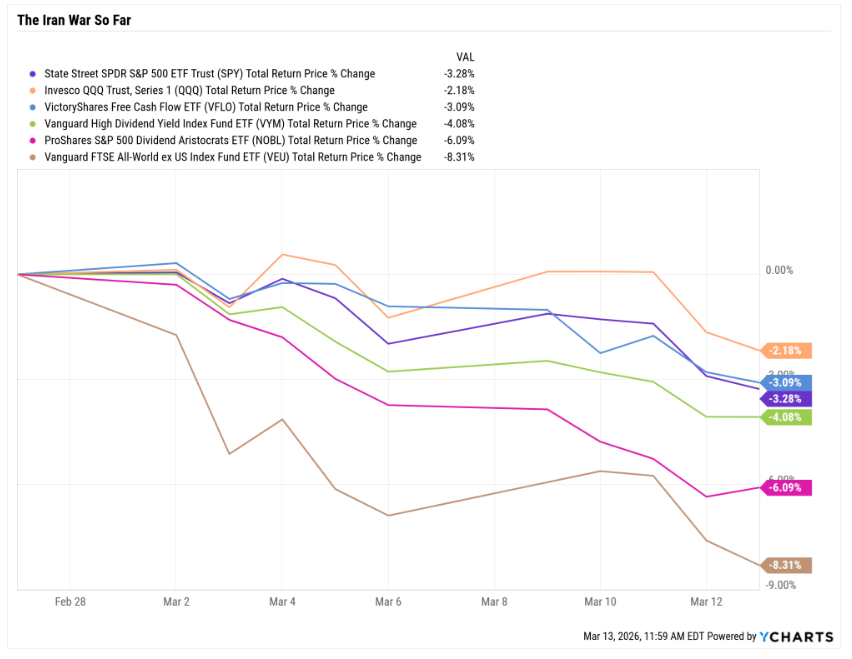
The stock market is down, but even the hardest hit indexes aren’t in a correction.
Asset allocation, diversifying into non-correlated and negatively correlated asset classes, is the key to sleeping well at night.
Unless you’re the kind of person who is kept warm at night by charts like this😉
Why Young Investors Don’t Need To Own Anything But Stocks…On Paper…If You’re A Robot, With No Emotions😂
For The Rest Of Us…You know, Who Aren’t Robots😉
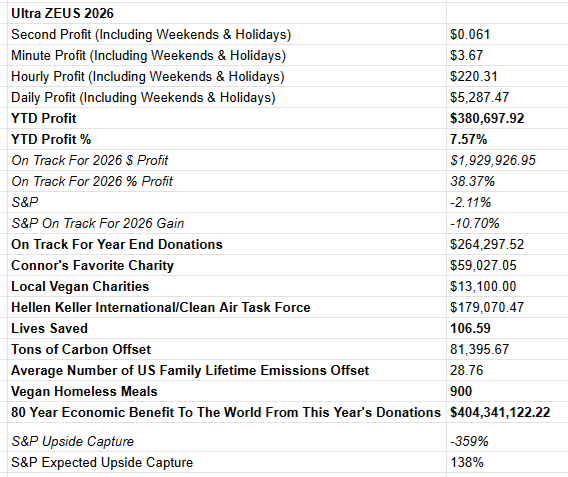
The reason I’ve built the Ultra ZEUS fund for my family is that 24 people count on it directly (and over 1,000 through the charities we support).
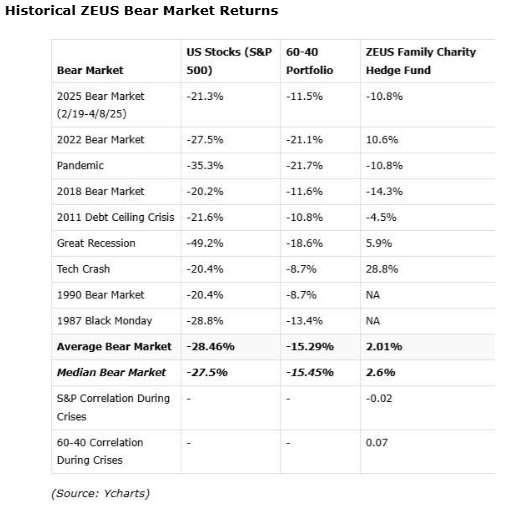
And resilience through bear markets is not the most impressive part of a diversified portfolio.
Ultra ZEUS YTD (through 3/13)
The Math Is Mathing Harder Than Expected 😉
The Science Behind The “Magic” Money Machine

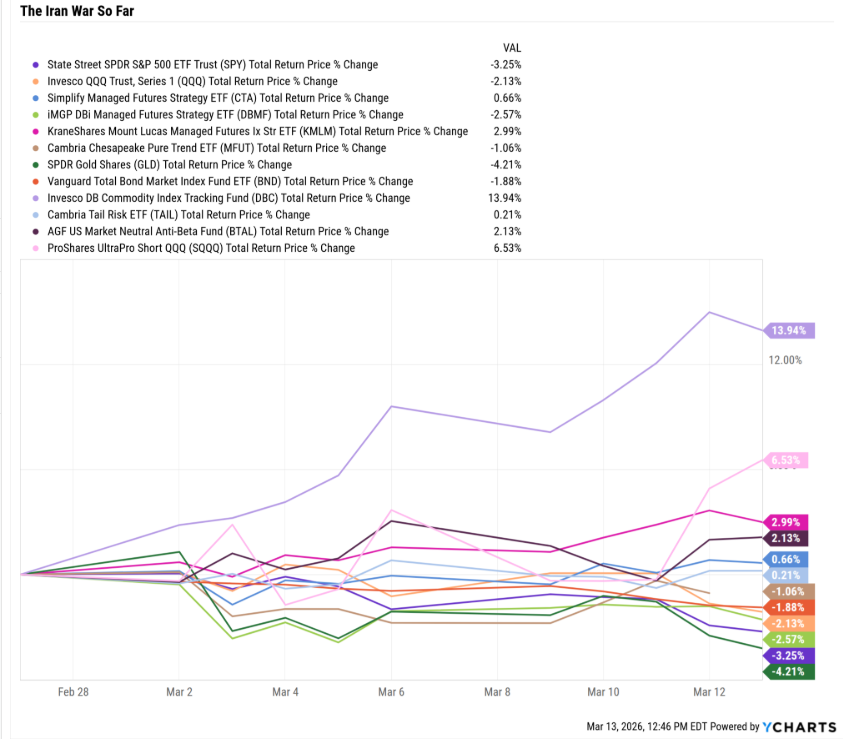
Commodities (but ot gold) are the big winners so far in this war, and that’s why CTA is one of the best performing asset classes so far in this war.
Simplify Managed Futures Holdings
Euro-BTPs are Italian government bonds
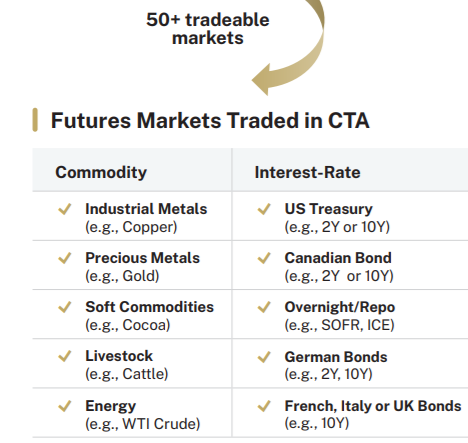
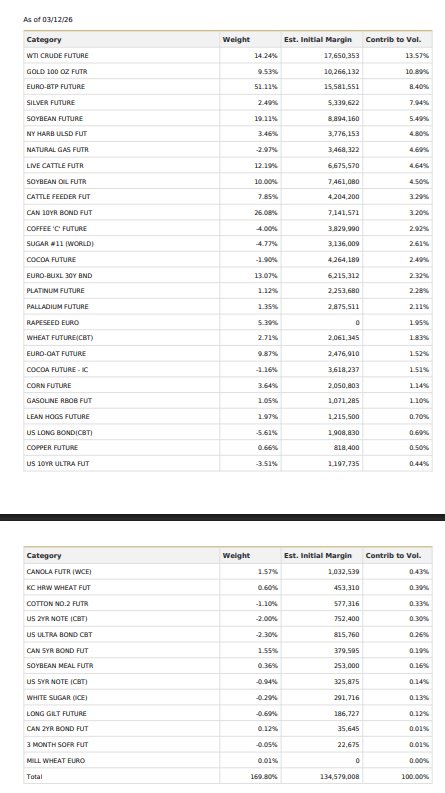
CTA's holdings. Oil is now #1 at 14% of daily volatility. If crude were to soar to $200, $300, or $400, CTA's trend-following + risk-management rules would permit it to go as much as 25% in either direction from being long crude.
CTA uses Altis Partners, which has developed 4 advanced algorithms that work together to decide which futures to go long or short in and how much, and its 100% rules-based.
There’s nothing magical behind anything on Wall Street; it’s all probability curves and asset allocation, but when done properly, and with discipline, for long enough. The results are truly spectacular.
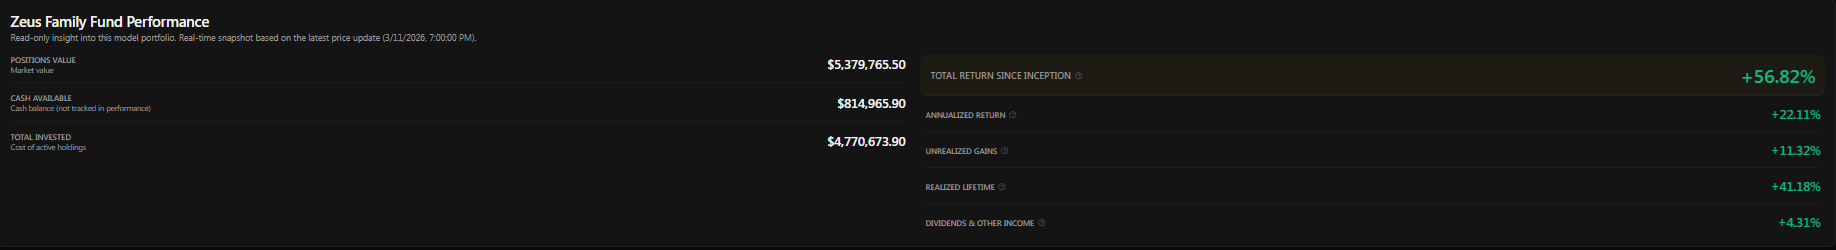
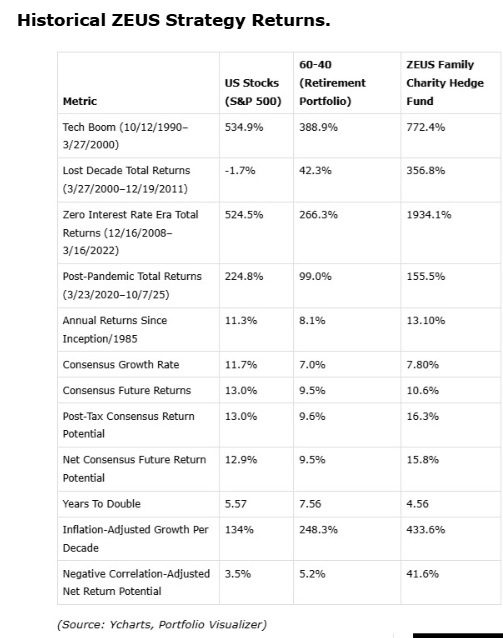
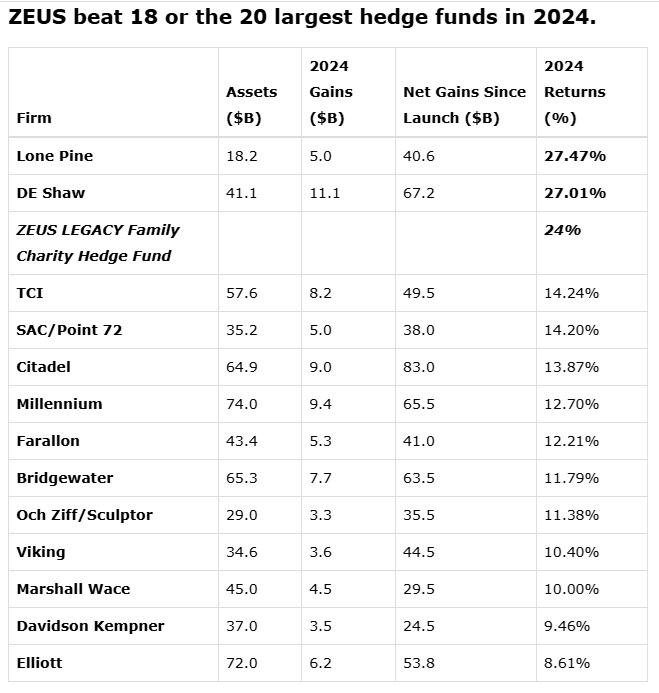
22% CAGR total returns that in 2024, beat 18/20 of the leading hedge funds in America, and are doing even better this year.
And the secret to all this “magical” performance?
20% growth
20% value/dividend stocks
20% bonds (long or short via CTA)
20% commodities (long or short via CTA0
about 20% negative convexity ETFs (TAIL, BTAL, SQQQ)
That’s pretty much what Ultra ZEUS is. It’s not complicated, it’s elegant in its simplicity, and it works. Not because I’m a genius, but because the world runs on facts, rules, and if you do the optimal thing for long enough, you have a 97% risk of success.

What About The Economy? Inflation? Corporate Profits?
Ok, so the stock market usually rebounds from shocks. But what happens if the economy goes? Won’t that trigger a major correction?
Yes, recessions = non-v-Shaped corrections, and that’s a major reason that investors (and people in general) fear recessions. But the good news is that unless there is actual negative growth, corrections are V-shaped and average 1.55X the duration of the decline to return to record highs.
A 2-month correction from peak to trough = 3 months from trough to new record highs.
We have averaged a 10% to 19% correction every 6 months since March 2009.
So every 18 months, we should expect one, and the cause will always be different.
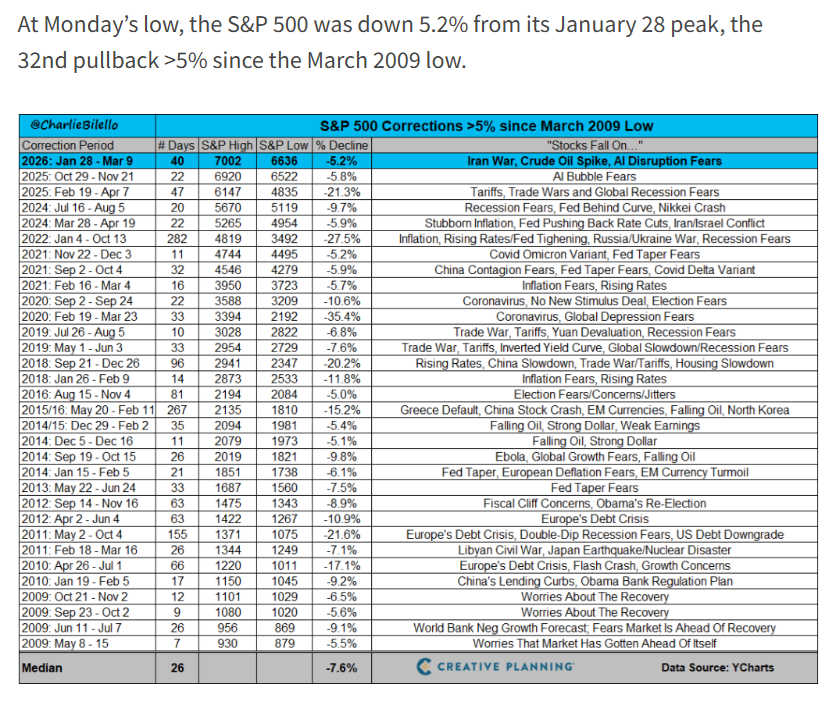
32 market corrections of at least 5% since the Great Recession bottom, and every single one was caused by something different (or a combination of factors).
For an entire month, stocks were down 6% on nothing more than bad vibes about AI.
Bubble Fears Lasted Not Even 4 Weeks!

OK, but what if this time is different?!
What if the biggest oil disruption in history causes crude to spike, inflation to go up, the Fed to raise rates, the economy to shrink, and then a bear market?
OK, let’s walk through that logic.
We’ve already seen that every $10 increase in crude prices = $0.25 increase in gas prices.
And so far?
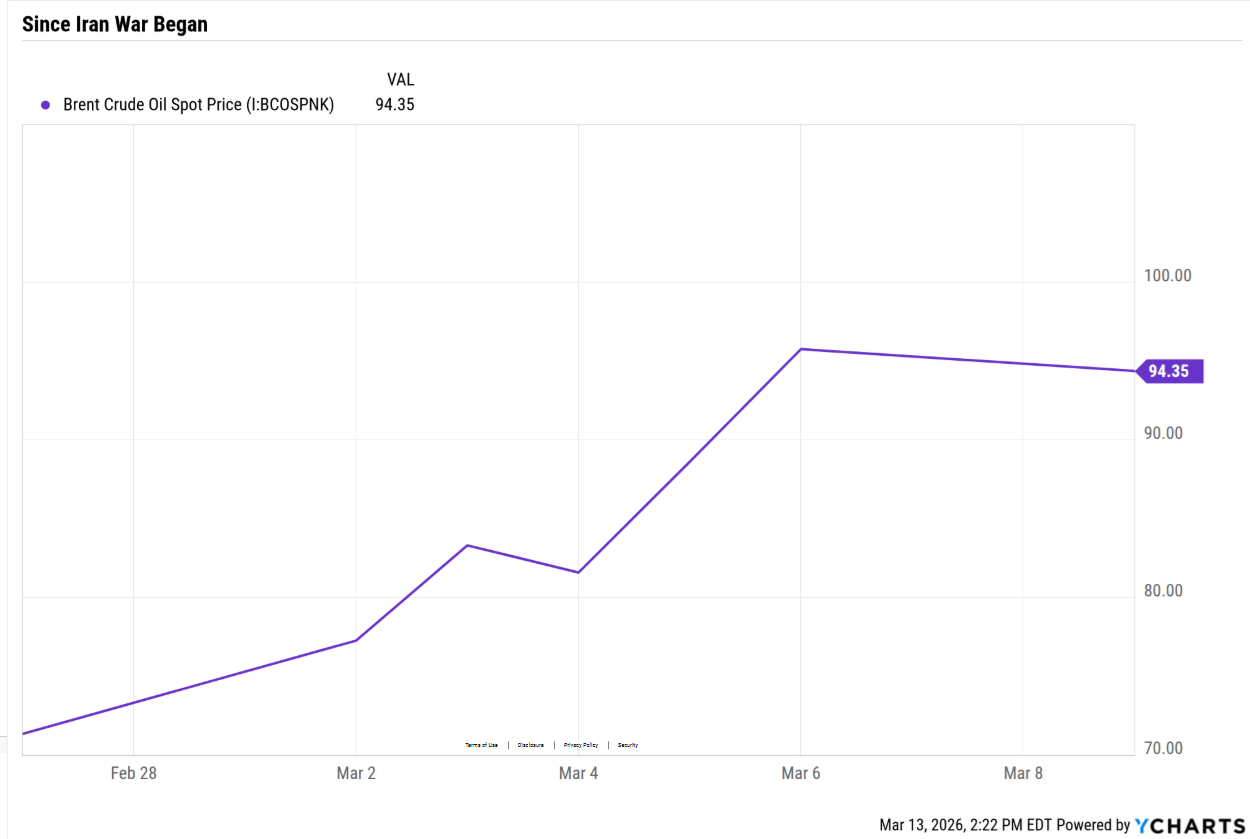
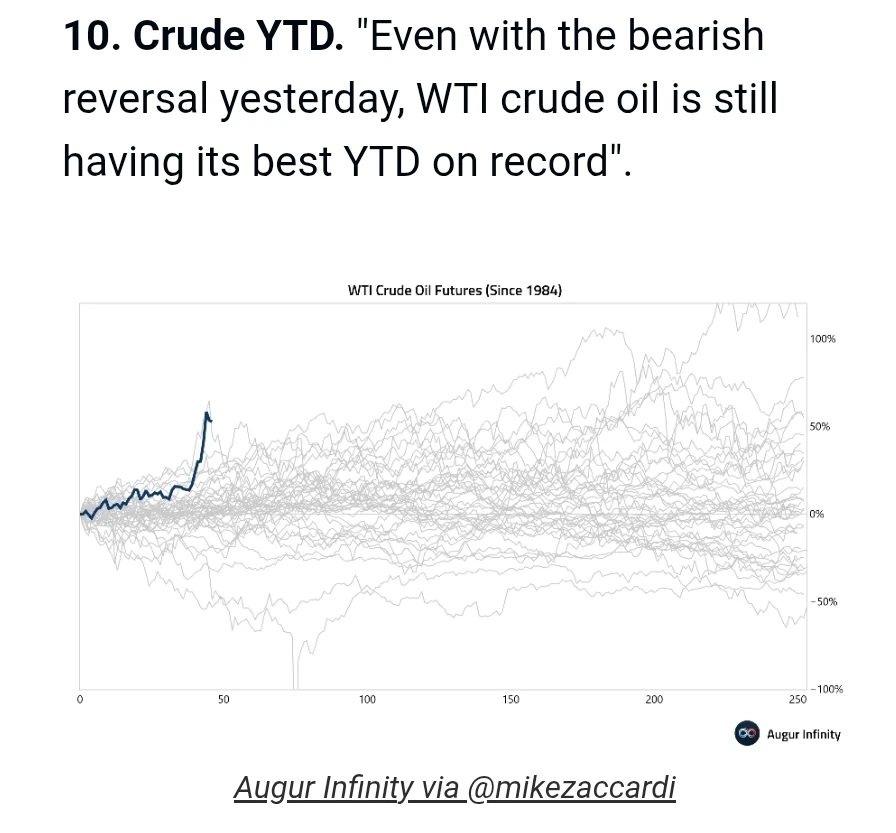
Looks scary, a 35% spike in crude. But guess what?
When in doubt, zoom out.
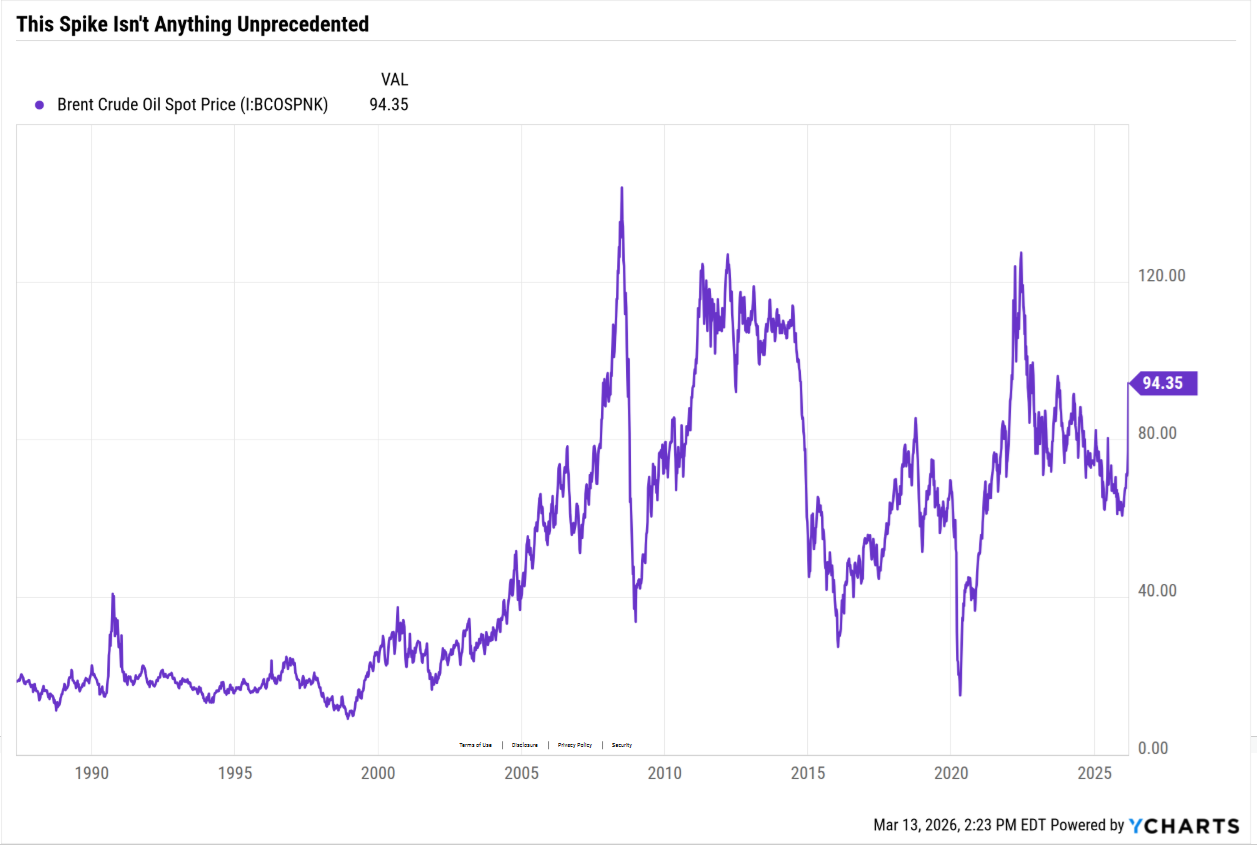
No recession from the much sharper oil spike from the Russian invasion of Ukraine.
That felt like a Vibessssion, but the 28% bear market was literally the median bear market since 1990.
That bear market was unprecedented.
worst inflation in 42 years.
Fastest rate hikes in 42 years.
Rates going from 0% to 5.5%.
Inflation above 5% (we’ve never avoided recession when that happened).
And yet, thanks to Chat GPT kicking off a massive capex spending spree, the economy avoided recession, and we’ve been supported by the combo of rich folks spending (wealth effect) + AI spending ever since.
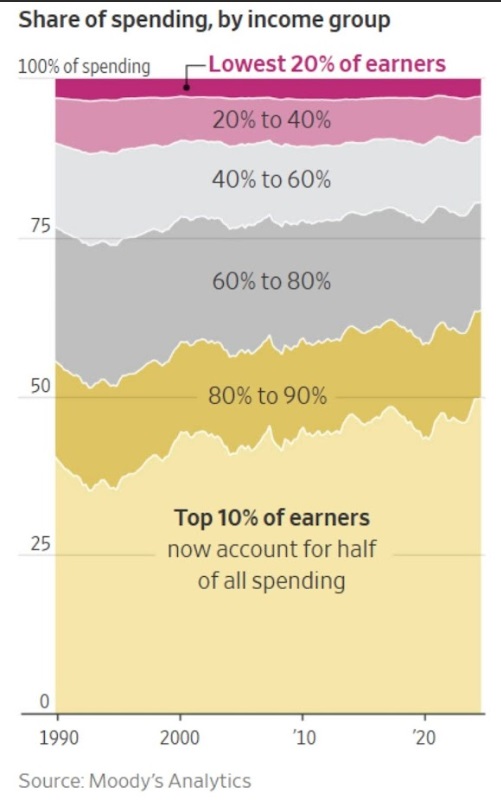
66% of retail spending driven by top 20% (own 95% of stocks)
Retirees drive 25% of spending.
Accounting for overlap 75% of spending = retirees + top 20% (who live off Assets, not income)
Just 25% of consumer spending (17.5% of GDP) is tied to job market dependent consumer spending
A weak job market?
Stop Blaming AI For A Weak Job Market When There Is A Much Bigger Reason
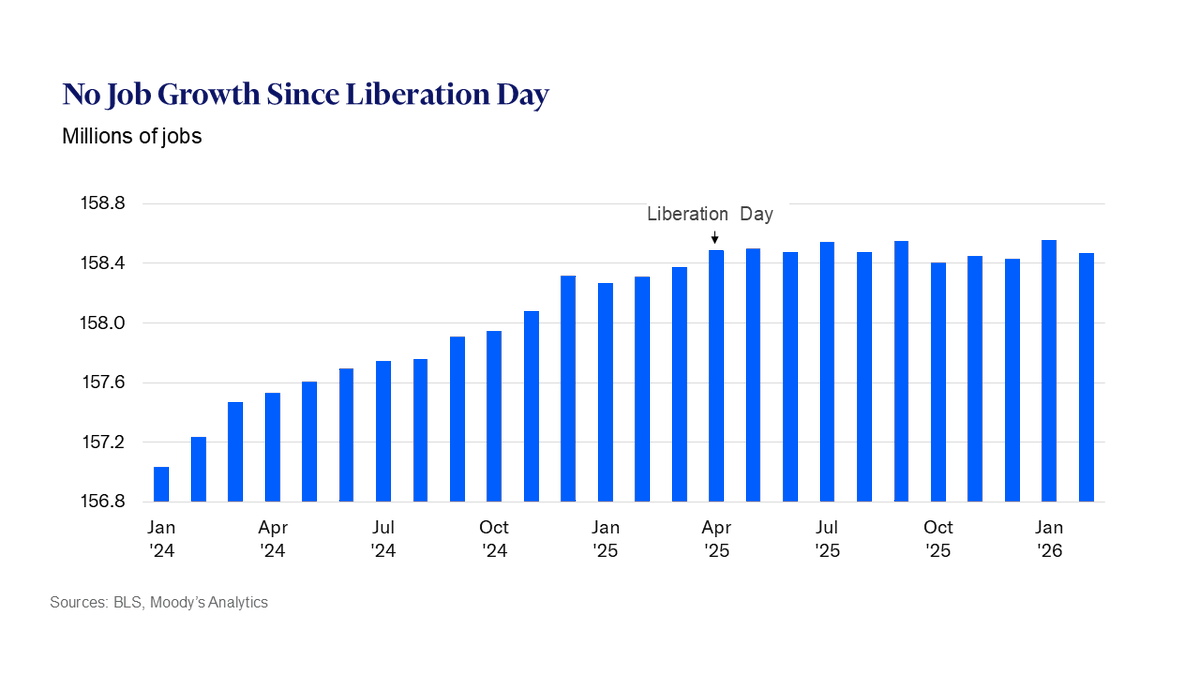
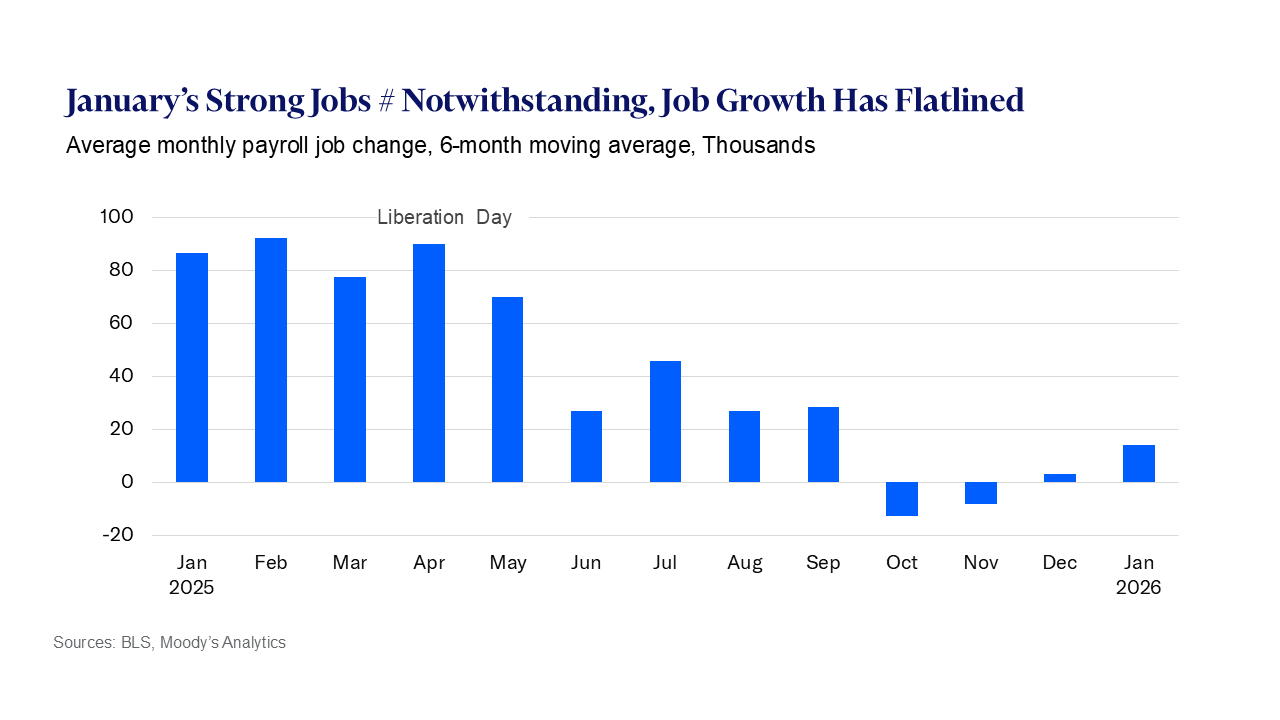
The job market was doing just fine until Liberation Day, and ever since, small businesses that create 2/3 of jobs have been gripped by uncertainty.
The data show that AI layoffs are small, and the media's focus on them just gives companies an excuse to say “I’m laying off for the obvious reason…not the one that might get us in trouble with the President if we point out the obvious.”😉
OK, so now we know the job market is weak, BUT 18% of GDP growth is driven by the job market (a lot but not nearly what people think it is).
Does that mean that young people coming out of college and not able to get a good job, and buy a house in a housing market with absurd pricing and high mortgage rates (historically average rates but record home prices that doubled in 5 years) that can’t start families and that lead to collapsing fertility rates, aren’t a problem? That human misery and rising political vitriol from a generation of people who think that the current economic system is rigged against them isn’t a bad thing? Of course there will be signifiicant issues with that. BUT guess what the stock market cares about?
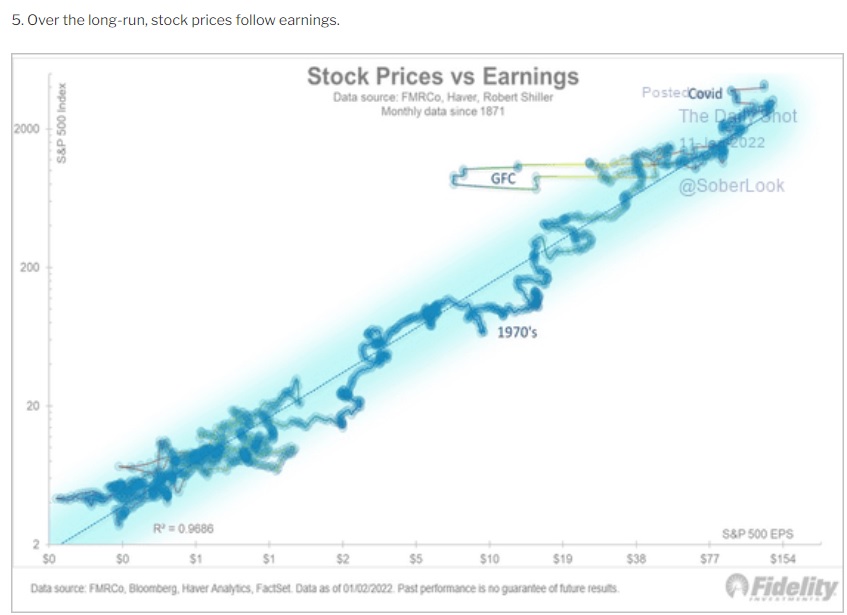
Unless something effects long-term earnings the stock market will not care about it (long-term)
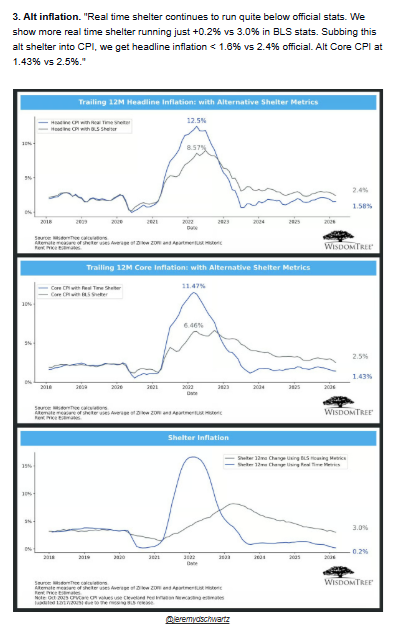
Inflation Spike? Nope
Charts like this imply that “as soon as something big happens, don’t trust the data! Assume something huge is coming!”
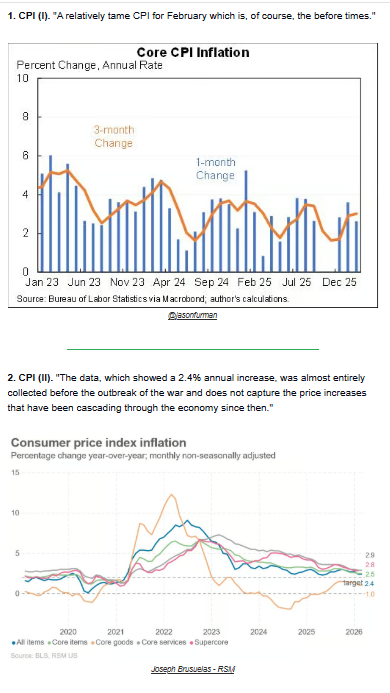
That is understandable.
War with Iran = oil + 35% = higher input prices for everything = higher inflation…it makes sense. \
But all models are wrong, and some are useful, remember😉
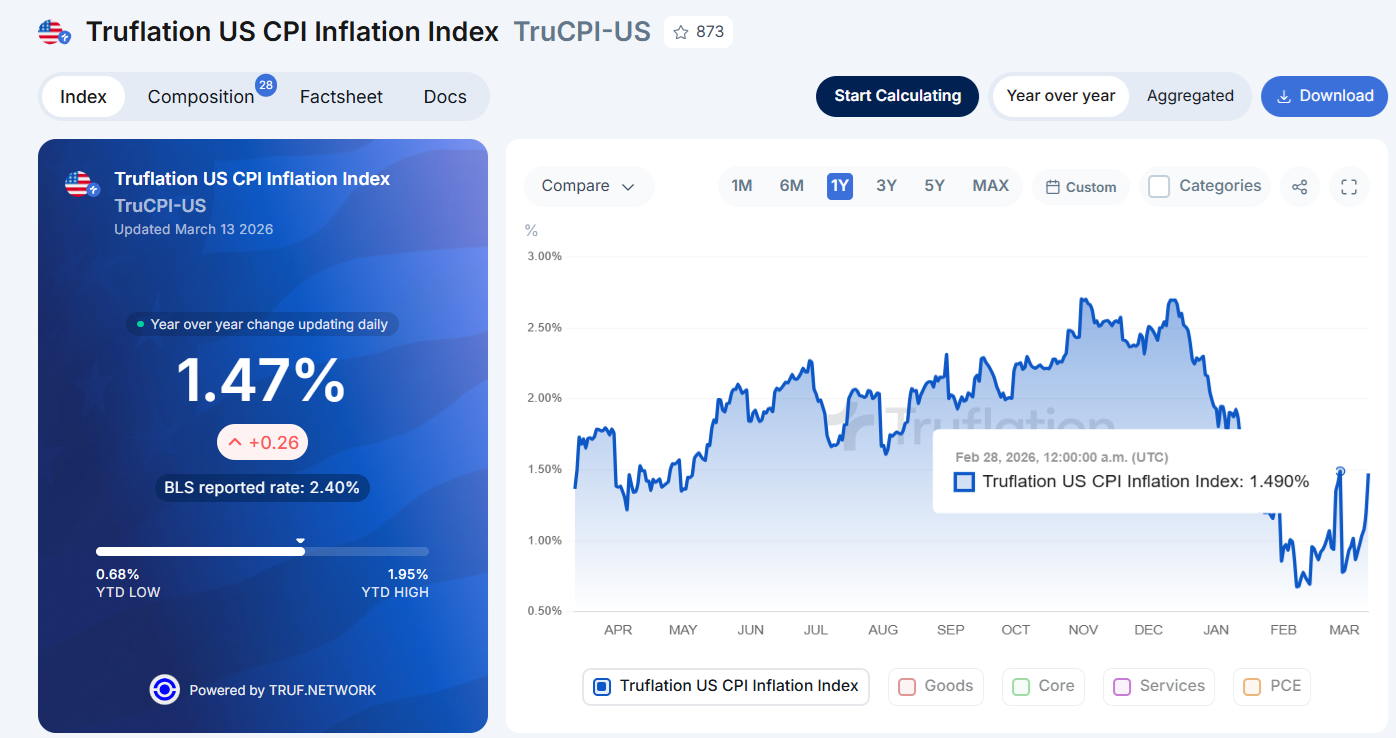
Actual inflation is much lower than the government’s stats.
OK, but the war is new! It’s only been 2 weeks! Guess what? We have daily inflation data from over 18 million daily prices.
OMG! Look at the Inflation Spike Since The War Began! From 1.5% To…1.5%!
You Don’t Have To Understand The Data…You Just Have To Live With It
And God Help You If you invest against the real-time data (that way lies madness)😉
The global economy comprises about 8.5 trillion economic agents (and that number is rising exponentially), making trillions of decisions per day. You can obsess over which economic model (or investing model) to choose…or you can just look at the data, assume that fundamentals will always win in the end, and achieve your financial dreams without watching Bloomberg all day!
As a former Bloomberg TV addict, I can attest, it’s no way to live😉
How About Interest Rates?
A decade of ZIRP conditioned investors to obsess over interest rates. But over the last 4 years, GDP growth has averaged 3.3%, a return to the 3% average since 1913. So feel free to ignore rates. But just in case you can’t help yourself😉
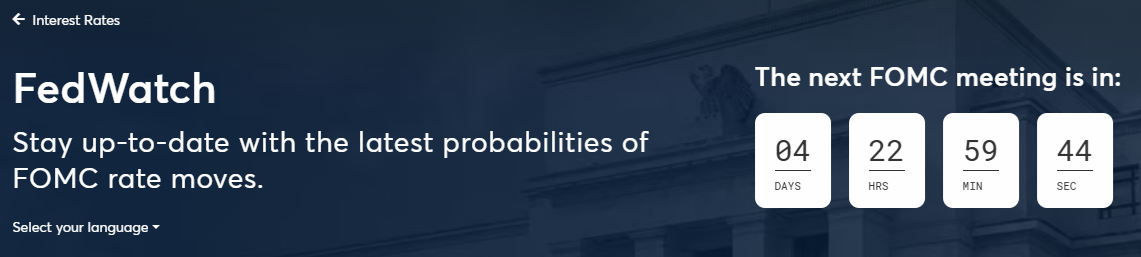
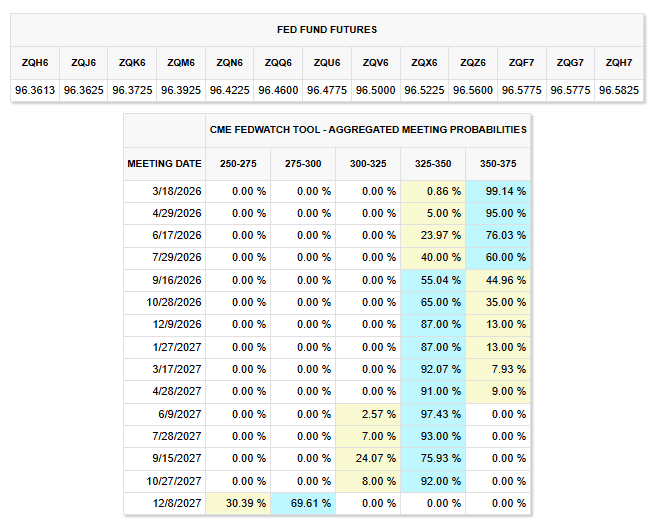
Investors pay attention to every Fed meeting when they shouldn’t pay attention to any of them. They can skip watching Bloomberg’s 3-hour-long special “The Fed Decides” and just look at a single table.
What should rates be?
Since 1929 Inflation-adjusted Fed funds rate averaged 0.4%.
Fed calls 0% to 1% inflation-adjusted rate “neutral rate” due to that historical data.
Today real time inflation is 1.5% and Fed is 3.63%. That’s 2.13%.
Fed should be Truflation + 0% to 1%
That is the best available data-driven approach to real-time monetary policy.
BUT what I think, no matter how 100% data driven and accurate it might be (explain to me how I’m wrong Charlie Bilello😉) what matters is what WILL happen.
The Fed fund futures are like prediction markets.
No single model, not even from the most accurate economist, is as accurate as the collective intelligence of the markets.
That’s how capitalism works.
Price signals.
Collective Intelligence, over the long-term, is always smarter than any expert.
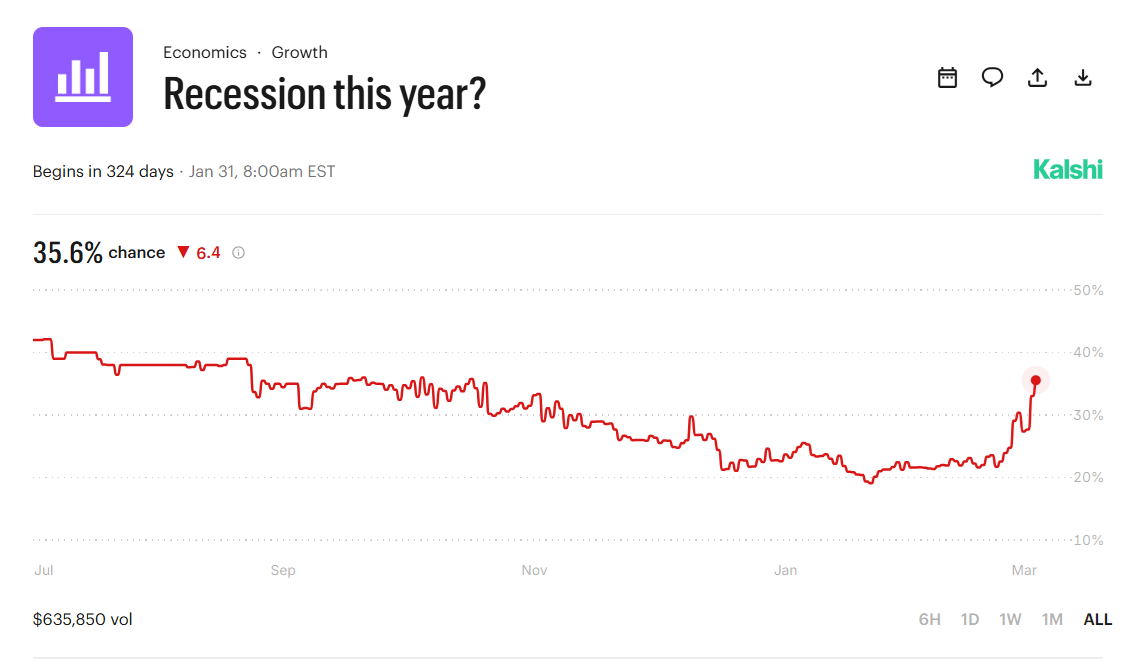
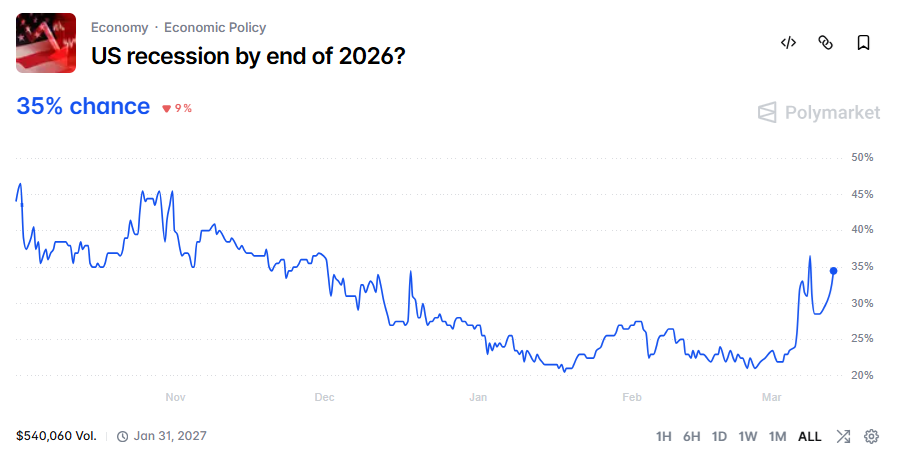
Is the risk of recession up since the war began? Yes, but look at the trend. It’s no higher than it was in September of 2025.
And remember that the prediction markets are ultimately going to converge on the truth.
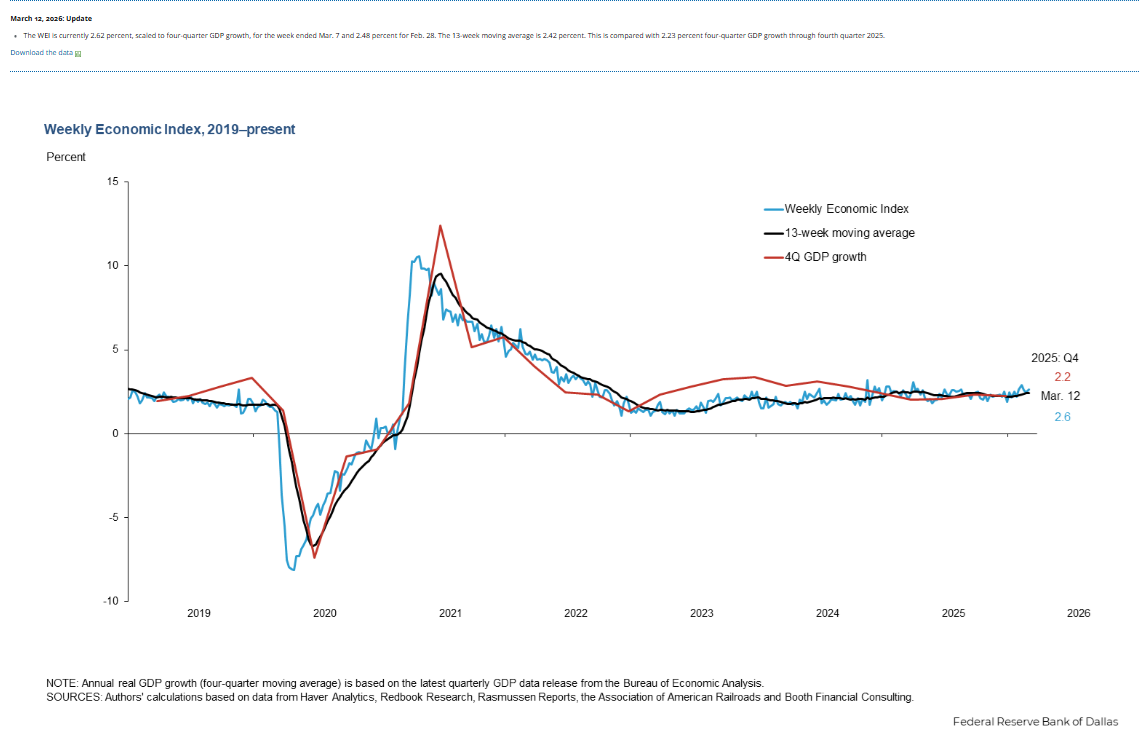
Real Time Economic Growth
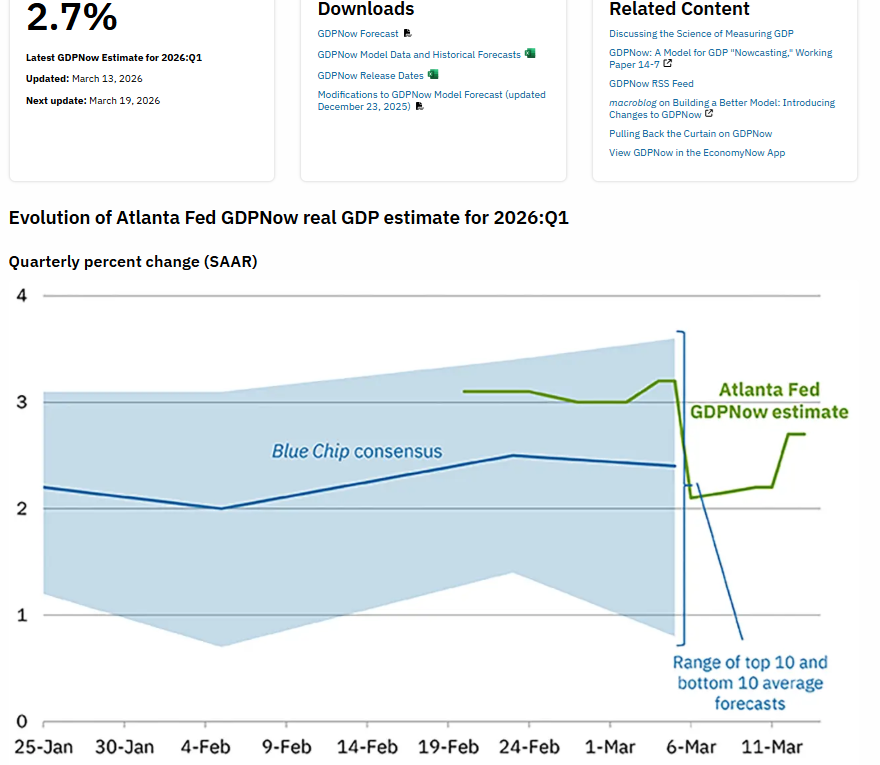
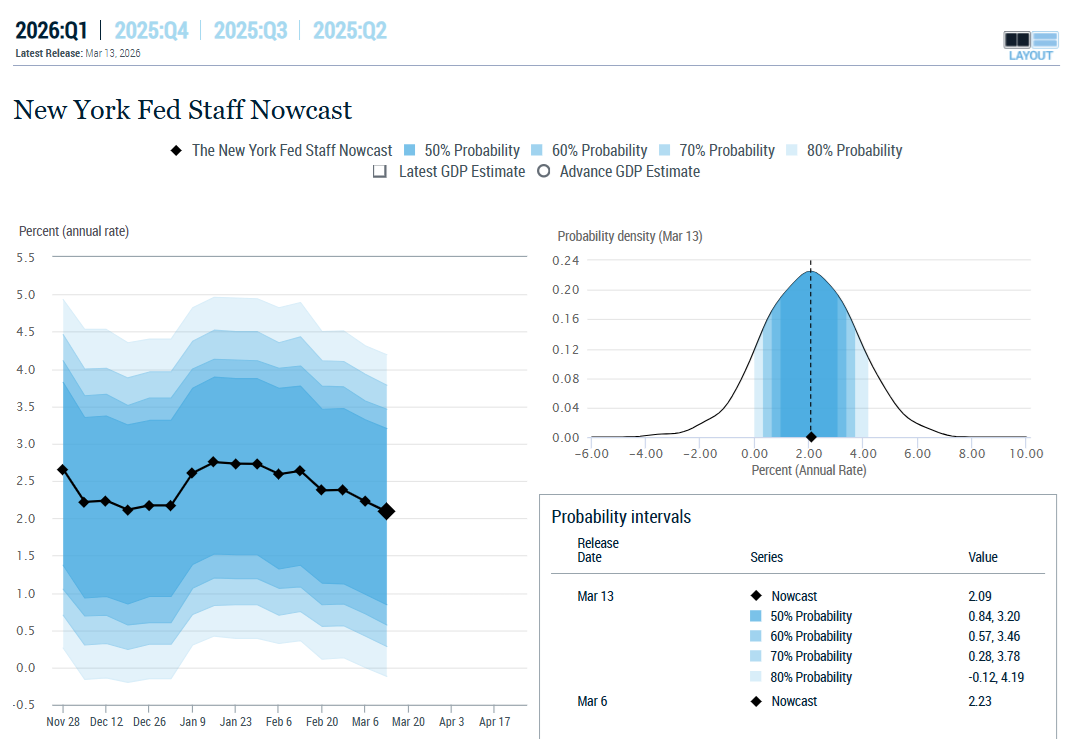
Gold Standard: 2.6%
Pure daily/weekly economic input data = Dallas Fed Weekly Economic Index
Blue-chip consensus: 2.4%
Atlanta Fed: 2.7%
NY Fed: 2.1%
Dallas Fed: 2.6%
Average: 2.45%
Median: 2.5%
Worried About Recession: Where's the question, drill sergeant? 😉
Corporate Profits
Nothing more needs to be said here. Other than Goldman Sachs, estimates the $167 billion in refunded tariffs might boost corporate profits as much as 3% more this year (or over the coming years).
That’s a 1% annual tailwind over the next 3 years, even if it takes that long.
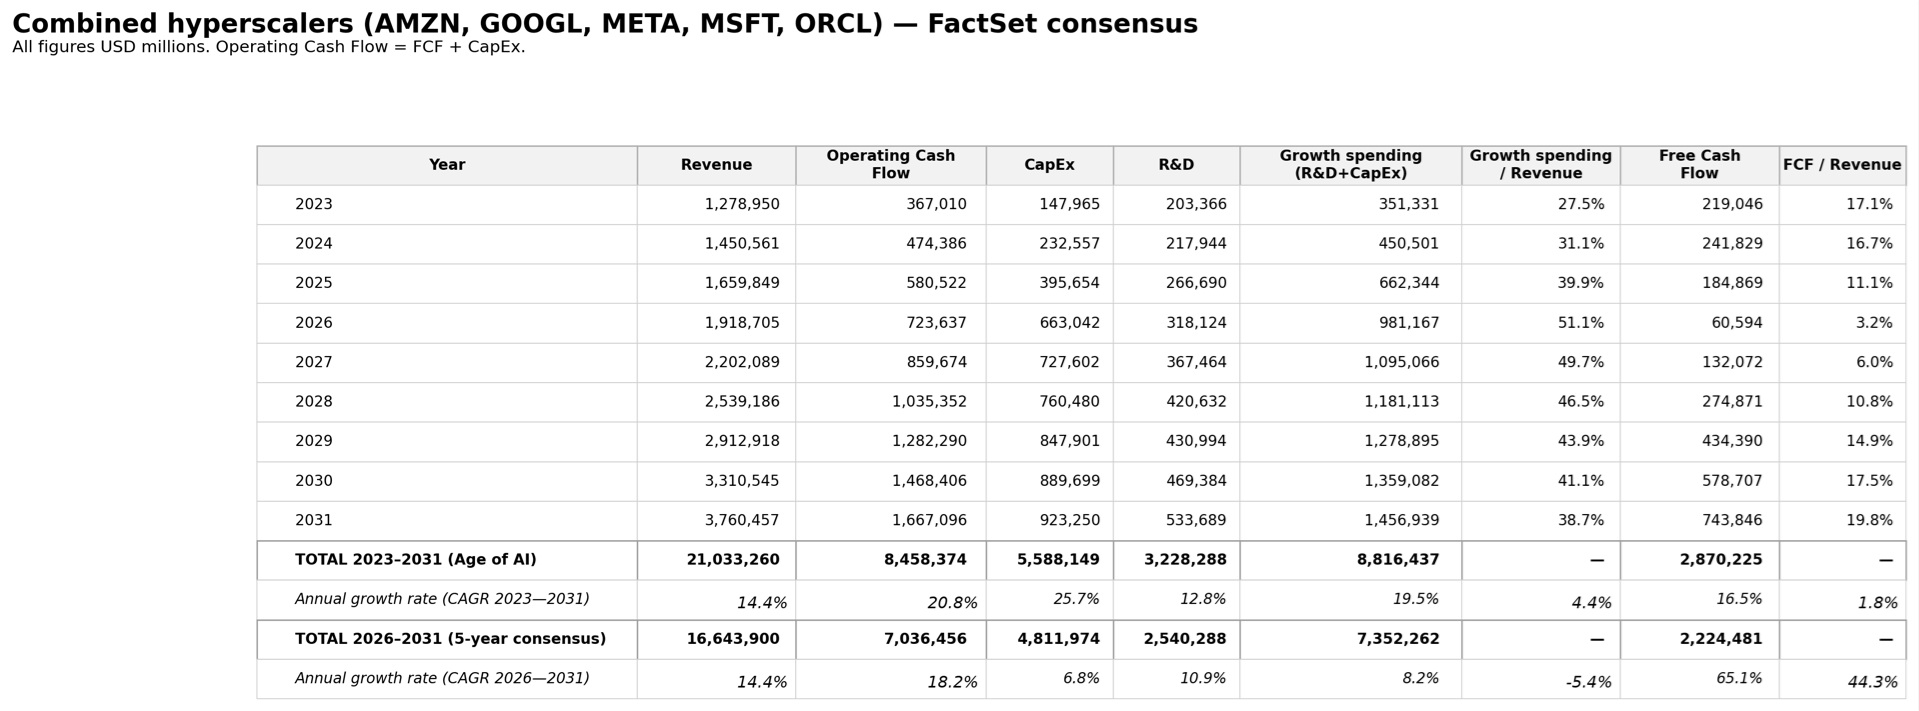
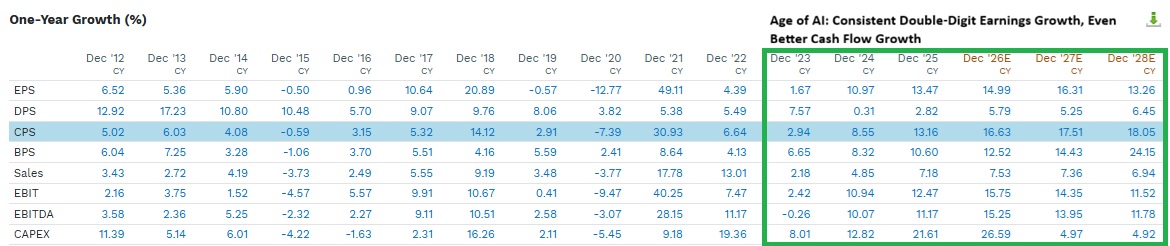
6.5% is historical EPS growth, 5.5% FCF/share growth.
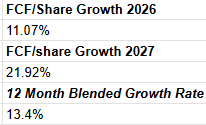
And now? We have cash flow growth rates of 15% and are accelerating towards 20%.
The cash flow growth consensus of the Hyperscalers.
As tech giants become a larger part of the market (because earnings growth is stronger) the growth rate of earnings and cash flow converges over time on the growth rate of the tech giants.
PE also converges on the PE of the tech giants.
“Historical PE of 15” is no longer relevant if tech giants spending on growth drive enough growth to sustain 20% growth and thus become 90% of the market one day.
First principles investing.
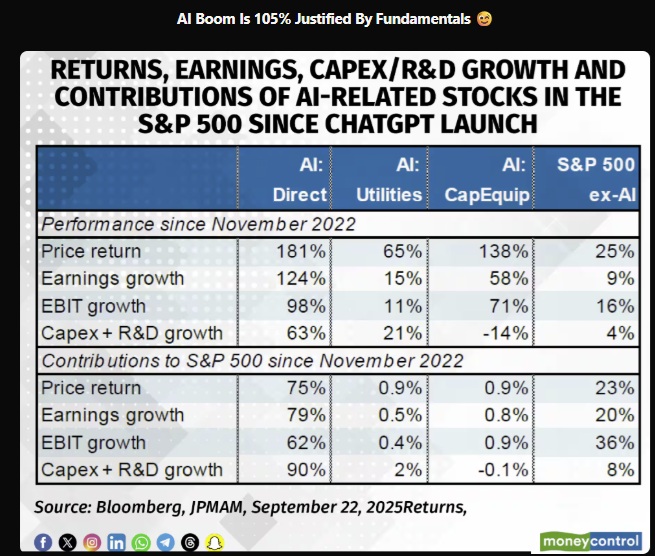
If I provide 90% of growth spending, and deliver 80% of growth and 75% of returns, at what point is that “unsustainable” and at what point is that a “bubble”?
If AI companies do 90% of growth spending then, over time, shouldn’t 90% of growth come from AI stocks? And then 90% of returns? And therefore one day 90% of the stock market will be AI stocks? And therefore, why is the stock market’s average PE since 1872, when the US was a developing economy, averaging a depression every 6 years, in any way relevant to today?
Answer? From first principles, whoever spends the most on growth, should get the most growth, and therefore get the best returns, and become a bigger part of the market, and therefore the growth rates of the market converges on the biggest growth spenders.
That’s not speculation, that’s math.
And that brings us to the question of market valuation.
S&P Valuation: PEGY Update
If you hear someone say the stock market is expensive, and they aren’t using growth-adjusted metrics, then it’s no different than saying a stock that is $100 per share is expensive, because $100 is a lot of money.
What if the PE is 10? And what if the average PE over time is 15? Then it’s cheap…as long as the growth rates are stable.
What if the average PE is 5? Then 10 is expensive…UNLESS the growth rate has doubled (sustainably).
Do you see why growth matters?
Why context matters? Why denominators matter😉
If I tell you that margin debt is at a record $1.3 trillion, you might think the stock market is a house of cards.
But what if I told you that’s 1.8% of the stock market's market cap, the long-term average is 2.0%, at the peak of the tech bubble it was 3%, and before the GFC it was 5%?
See how the denominator is the difference between “OMG stocks are going to crash” and “Oh, this is completely normal”.
Record margin debt and “totally normal” are both true at the same time.
Nvidia at $4.5 trillion market and “historically undervalued” are both true at the same time.
Big numbers alone don’t make a bubble. No matter how big the numbers might get, no matter how crazy they might seem to you and me? Big numbers that are true, are not a sign of danger, they are just big numbers.
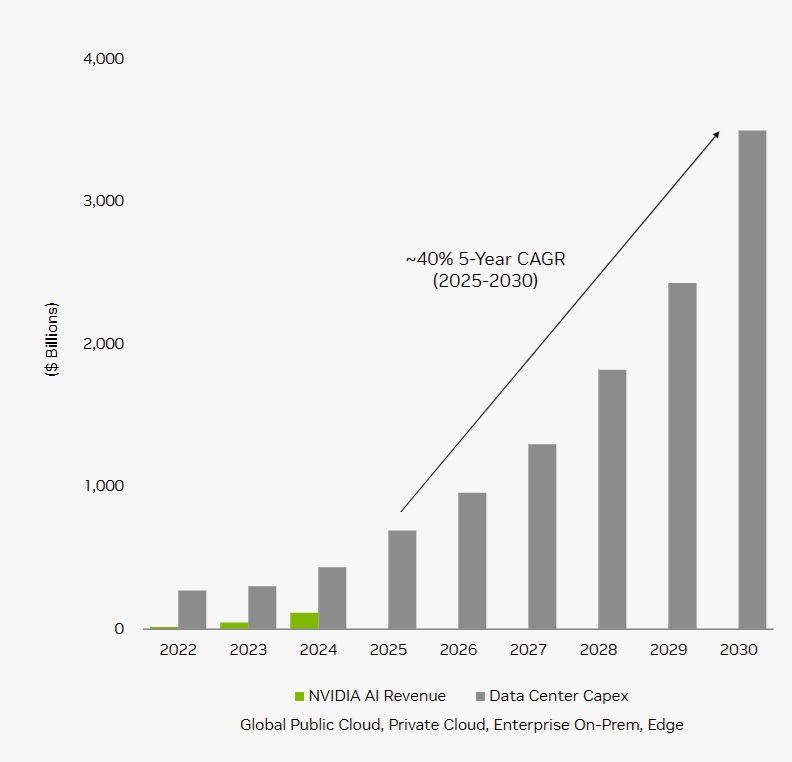
$4 trillion in AI spending by 2030 (per year) according to Nvidia, IDC, Citigroup and Morgan Stanley. That’s not a bubble, it’s just a really big number. It seems insane. And a year ago, it would have seemed insane. And then Nvidia put out this chart, Citigroup and Morgan Stanley and IDC validated and now it’s just a really big number on an impressive looking chart.
$200 billion in AI spending from a single company? A year ago not a single analyst would have dared to say it. It’s pure speculation. Until Amazon put that as its guidance, and now it’s just a really big number.

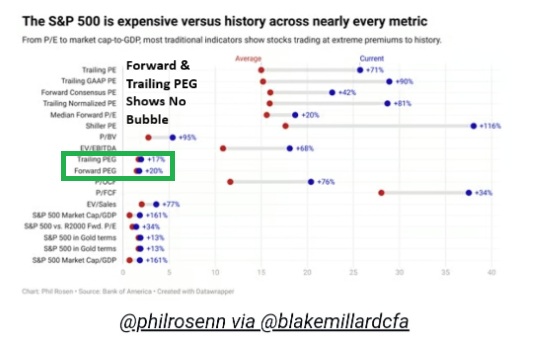
So let’s take a look at the S&P valuation, the one that so many people are worried about, because “on almost every metric, the market is expensive” * every metric that ignores growth that is😉.
FactSet S&P Growth Consensus
And what about the next 3 years? 17.3% CAGR FCF/share growth vs 5.5% historical. 3.5X faster growth in free cash flow.
Sorry, Michael Burry, Free cash flow is NOT affected by depreciation schedules😉
There is nothing more pure than free cash flow: it is THE very source of intrinsic value (Buffett’s owner earnings).
OK, so what does that mean to a stock market that is down 5% off its highs?
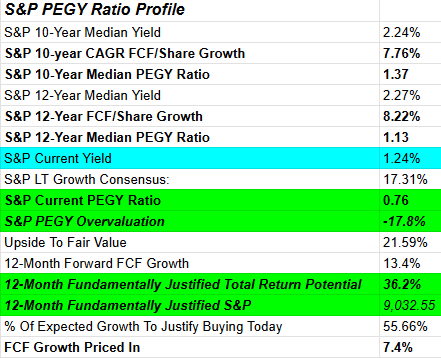
The stock market is pricing in 7.4% growth vs 13% consensus over the next year. And 17% over the next 3 years.
The stock market is, historically speaking, when adjusting for growth, 18% undervalued, about as undervalued as the market lows of March 2020, October 2022, and April 2025. And that’s why the upside potential over the next 12 months is 36%.
Just like from bear market lows, stocks can roar higher at a rate that people find baffling.
Expect it’s not speculation, it’s not animal spirits, it's fundamentals and math.
Bottom Line: The Math Is Clear: Investors Shouldn’t Worry About Iran
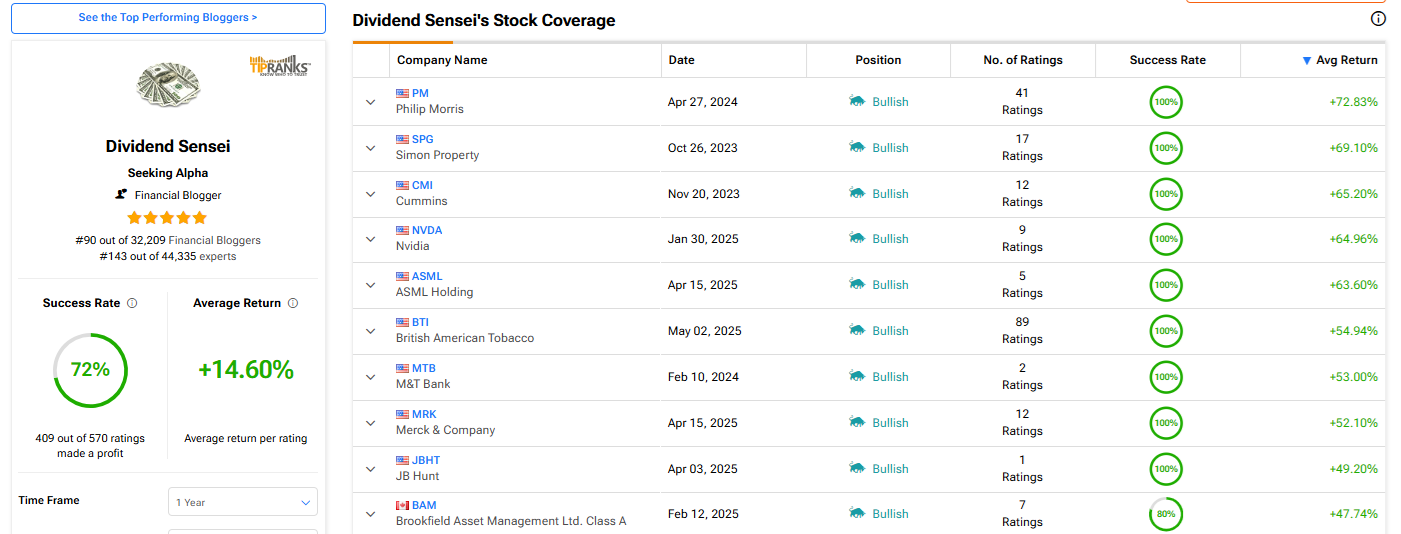
A lot of people can say things that sound smart. But Wall Street is a world where math, and only math, matters (97% at least)( in the long-term.
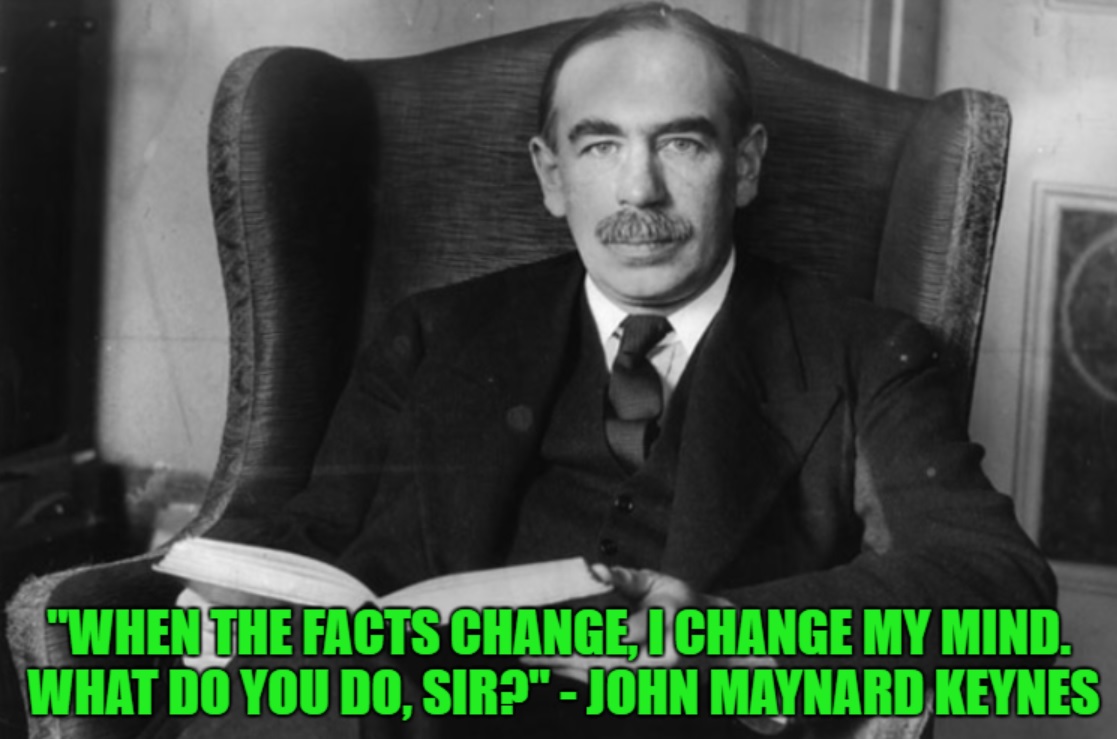
I didn’t become one of the top 0.3% of stock pickers and fund managers by saying things that sound smart. I did it by looking at the numbers that matter, and following them to their logical conclusions, acting on them, and pivoting the moment the facts changed.
My family’s future (and the company’s) rides on being right, not being popular.
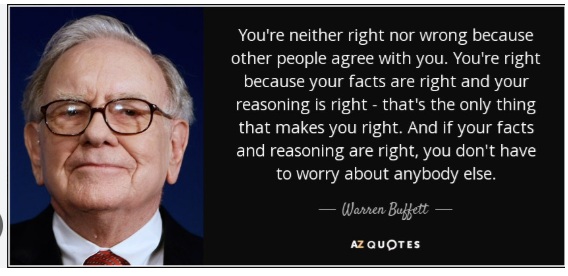
I don’t care if someone on Bloomberg or Fox Business or CNBC disagrees with me. If I’m wrong, the math will prove it. If I’m right, it will show up in the math.
And right now the math is clear. The market’s 5% pullback over Iran? 100% historically consistent, normal. And as the saying goes “I’ve seen this movie before and I know how it ends.”
And the way it ends, for smart, disciplined financial scientists who follow the first principles of math (and not the narratives the media is pushing), is always the same.
The war is not going to last forever. The AI boom won’t be affected long-term (as long as Robots are a thing in the future, the data center buildout will continue), and the economy is just fine. If that changes, I’ll let you know in another big picture update. But until then? Have a wonderful weekend and remember….😉