Backtesting Tools Suite - Complete Step by Step Guide
Now we're getting into something that I think every investor should have in their toolkit: the Backtester.
So what is backtesting? In plain terms, it's testing "what if" scenarios using real historical data. If you've ever wondered, "What would have happened if I bought these five stocks five years ago?".. that's exactly what this tool answers. Not with guesses, not with projections, but with actual market data going back to 1999.
You pick the stocks, set the rules, and the system replays history as if you'd actually made those trades. It calculates every buy, every sell, every dividend payment, and gives you a complete breakdown of how your portfolio would have performed. This guide covers the full setup, every configuration option, all six analytics tabs, and how to save, compare, and iterate on your strategies. Let's get into it.
What Is the Backtester?
The backtester lets you test how a portfolio would have performed using real market data. You pick the stocks, set your weights, choose a date range, and the system simulates every trading day from start to finish. It tracks your portfolio value, processes dividend payments, handles rebalancing, and compares everything against a benchmark like SPY.
The scale here is significant. You have access to over 4,500 stocks with 20+ years of daily price and dividend data. That means you can test strategies going all the way back to 1999 for most tickers. Want to see how a portfolio of dividend aristocrats would have performed through the 2008 financial crisis? You can do that. Want to compare a value strategy against a growth strategy over the last decade? That too.
Most backtesting tools either charge you per test, limit your date range, or don't include dividends. This one does all of it.. and it's free. No caps on how many backtests you can run, no paywalls hiding the good analytics tabs. You get the full suite.
What really sets this apart is the Dynamic Rebalancing feature. Instead of just maintaining fixed weights, the system can automatically rank your stocks by GNG metrics like Quality Score, Dividend Yield, or ROIC, and concentrate your allocation on the top performers each quarter. It's like building a rules-based investment strategy and testing it before you put real money behind it.
How to Get There
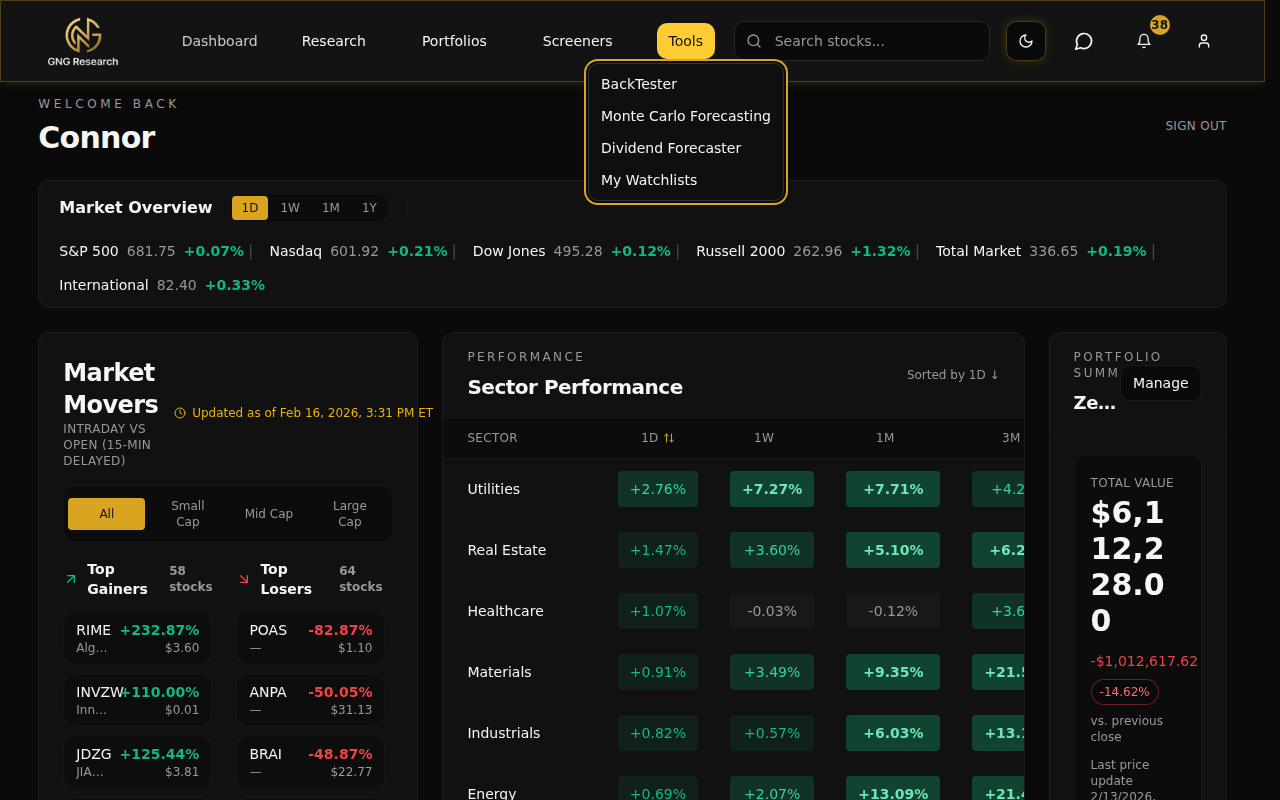
Click Tools in the top navigation bar. You'll see Backtester right there in the dropdown. Click it and you're in.
That's it.. no hidden menus, no sub-pages to find first. One click from the dropdown.
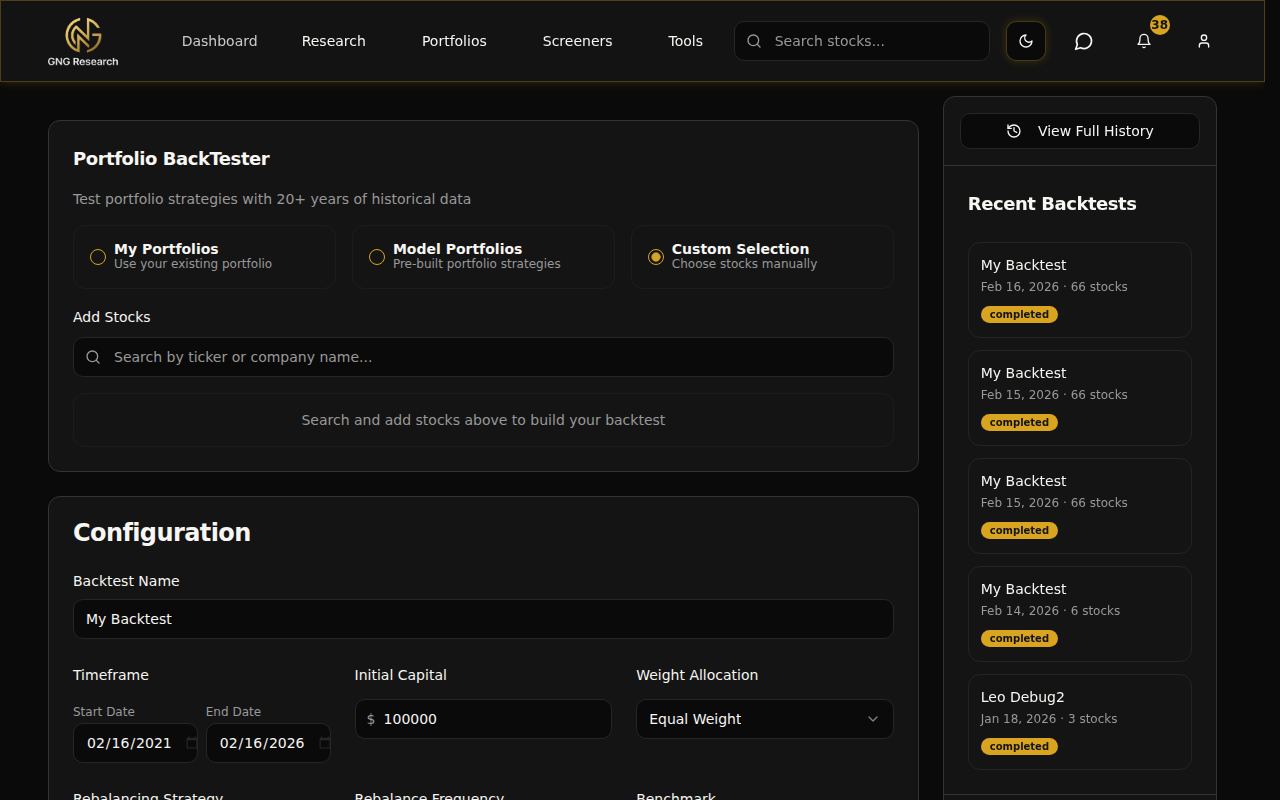
When you land on the main page, you'll see the configuration area on the left taking up most of the screen, and a sidebar on the right showing your recent backtests and quick stats. Everything you need to set up, run, and review a backtest is right here on one page.
Setting Up Your Backtest
The main page is where you configure everything before you hit Run. It's broken into a few sections, and I'll walk you through each one so you know exactly what every option does.
Choosing Your Stocks
The first thing you'll do is pick which stocks to include in your backtest. There are three input methods:
My Portfolios - Pull stocks directly from one of your saved portfolios in the Portfolio Tracker. This imports all your holdings with their actual weights based on current market value. Perfect for testing how your real portfolio would have performed over a different time period.
Model Portfolios - Use one of GNG's preset portfolio strategies. These are curated collections you can test without building anything from scratch.
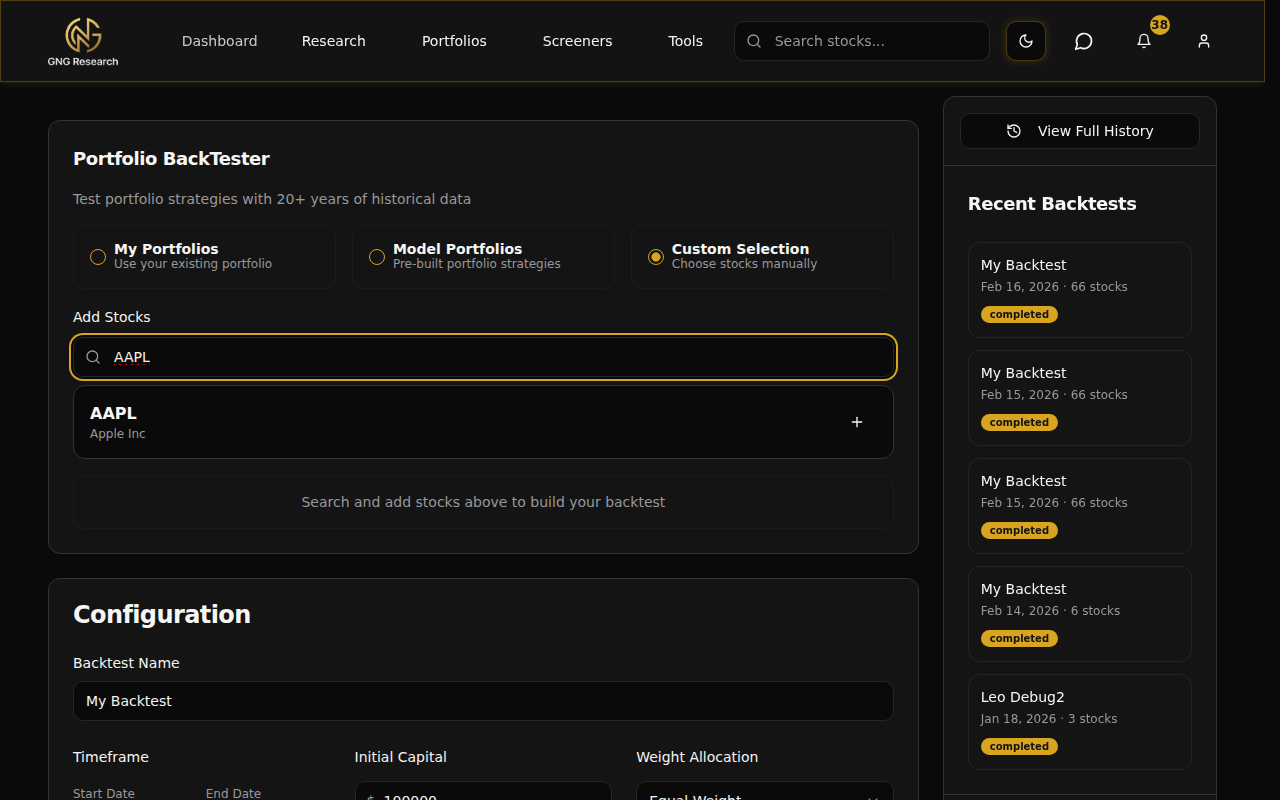
Custom - Search and pick individual stocks yourself. This is the most flexible option and the one you'll probably use the most.
For the Custom option, just start typing a ticker symbol or company name into the search box. An autocomplete dropdown shows matching results with the ticker and full company name. Click on a result to add it.
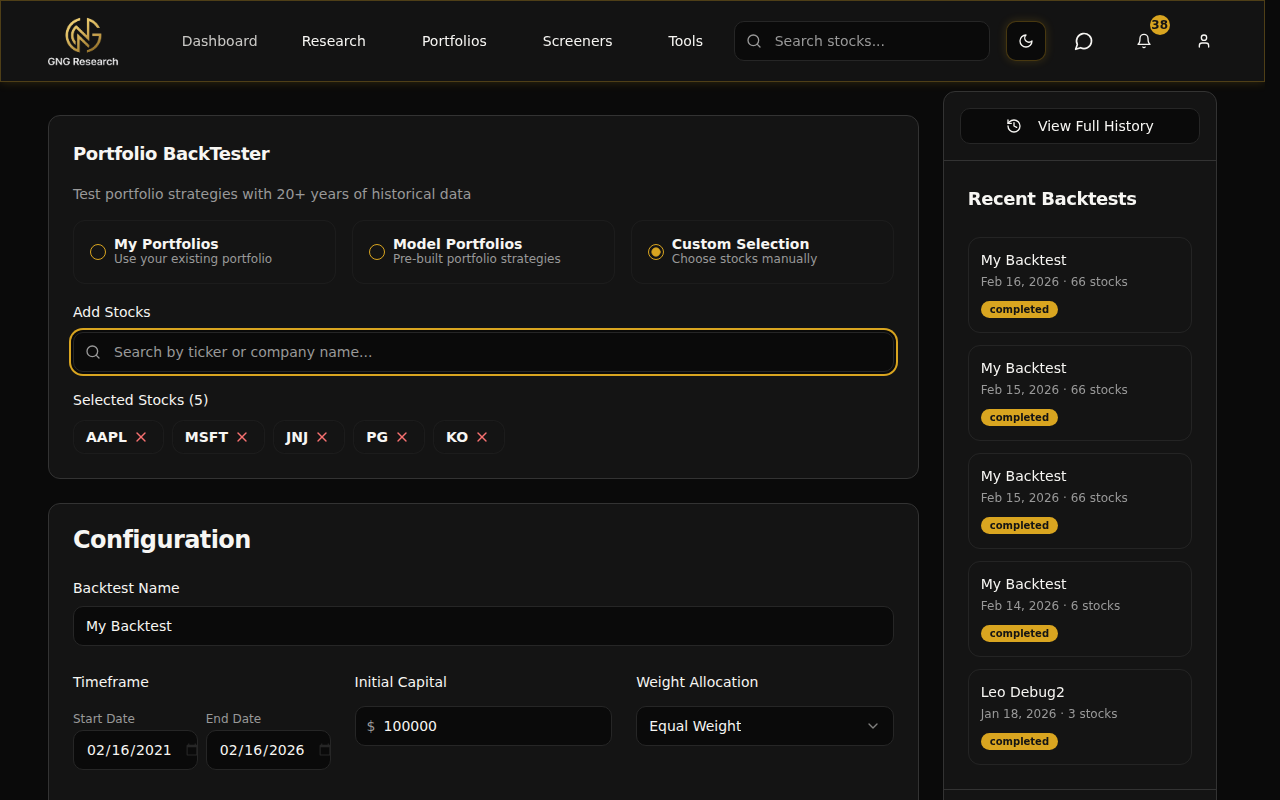
Once you've added stocks, they appear as chips below the search box. Each chip shows the ticker symbol and has a small X to remove it if you change your mind. You can add up to 100 stocks per backtest, though most strategies work best with somewhere between 3 and 20.
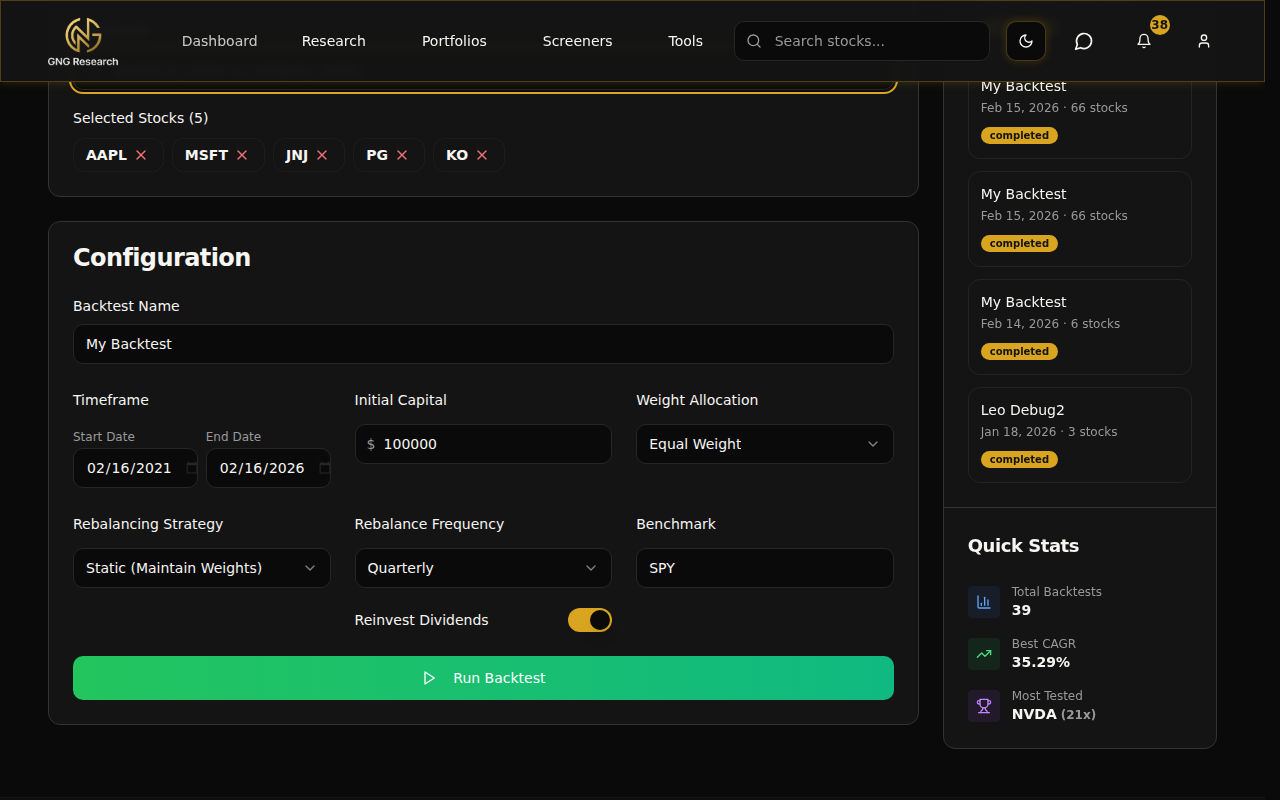
Configuring the Details
Below the stock selector, you'll see the Configuration card with all the settings that control how your backtest runs.
Backtest Name - Give your backtest a descriptive name so you can find it later in your history. It defaults to "My Backtest" but I'd recommend something like "Dividend Kings 5yr Quarterly" so you know at a glance what it was testing. This is optional but worth doing if you plan to run multiple backtests.
Date Range - Pick your start and end dates. The data goes back to January 1999 for most stocks, and you can set the end date all the way up to today. The default is a 5-year lookback ending today, which is a solid starting point for most strategies.
Initial Capital - How much hypothetical money you're starting with. The default is $100,000. You can change this to any amount. The system tracks everything in dollars so the results feel real and tangible.
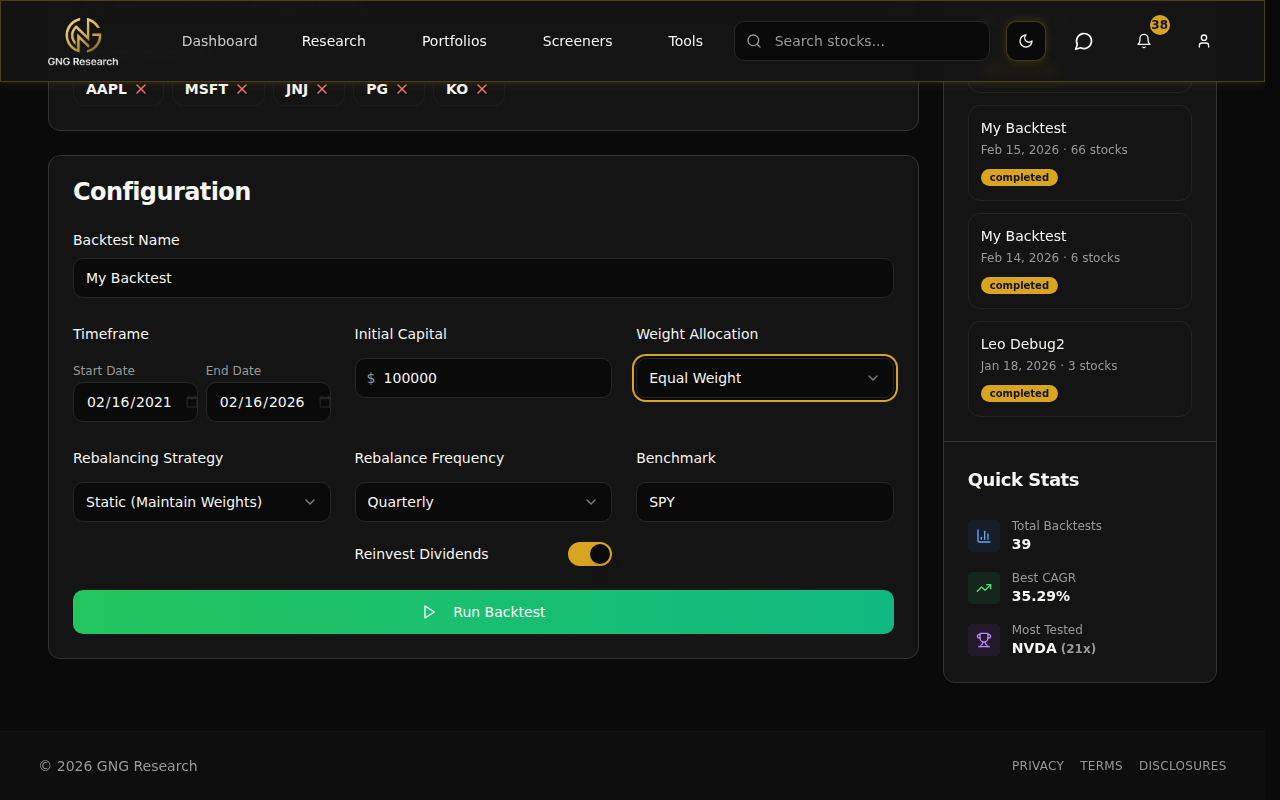
Weight Allocation - This determines how your money is split across the stocks. Two options:
Equal Weight - Splits your capital evenly across all stocks. Five stocks means each gets 20%. Simple and clean.
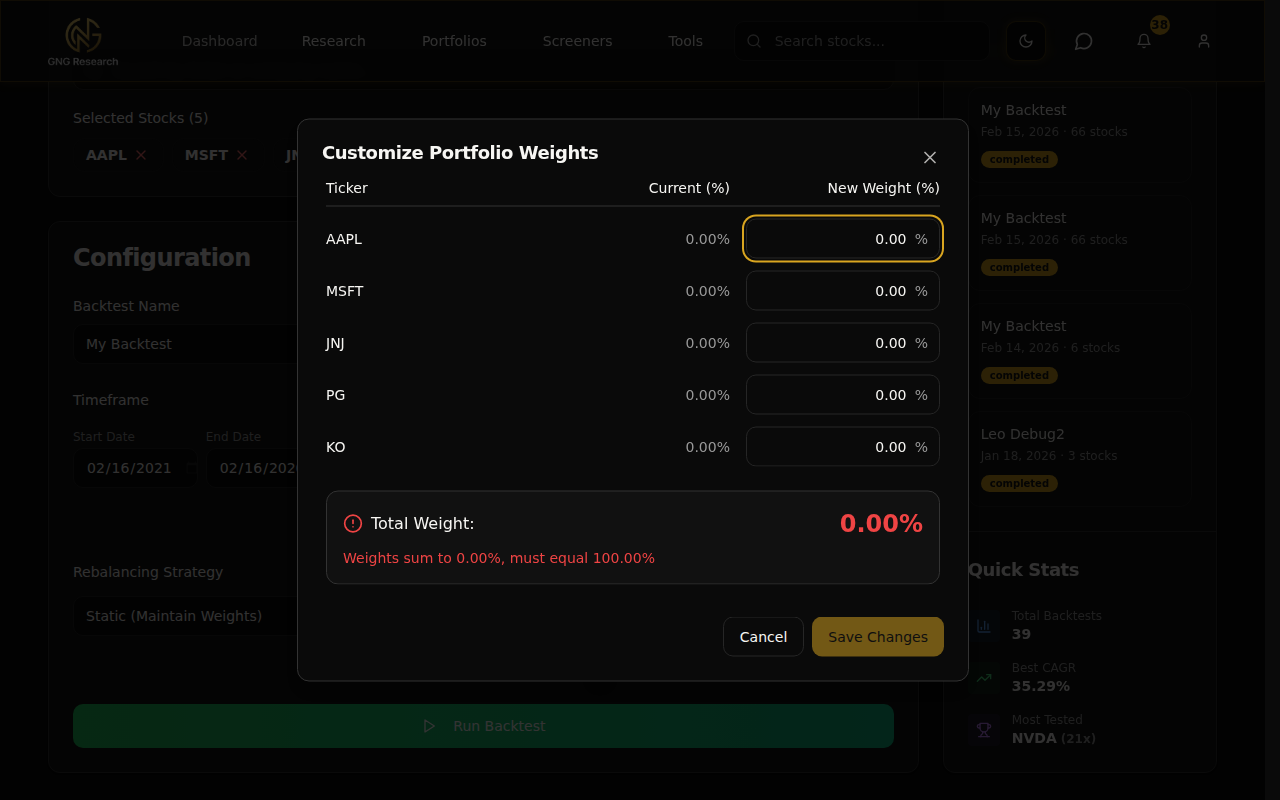
Custom % - Lets you set exact percentages for each stock. Maybe you want 40% in your highest conviction pick and 15% each in four others. That's your call.
If you choose Custom %, click the Edit Weights button to open the weights modal. Each stock shows up with a percentage input. The modal tracks your total allocation in real time and color-codes it: green when it sums to 100%, red when it's over or under. Your weights need to add up to exactly 100% before you can save.
Rebalancing Strategy
Rebalancing is how the system handles your portfolio weights over time. There are two modes:
Static (Maintain Weights) - This maintains your original weight allocation throughout the backtest. If you set AAPL at 50% and MSFT at 50%, and AAPL grows faster, the system sells some AAPL and buys more MSFT at each rebalance date to bring everything back to 50/50. It's a disciplined "buy low, sell high" approach baked into the rules.
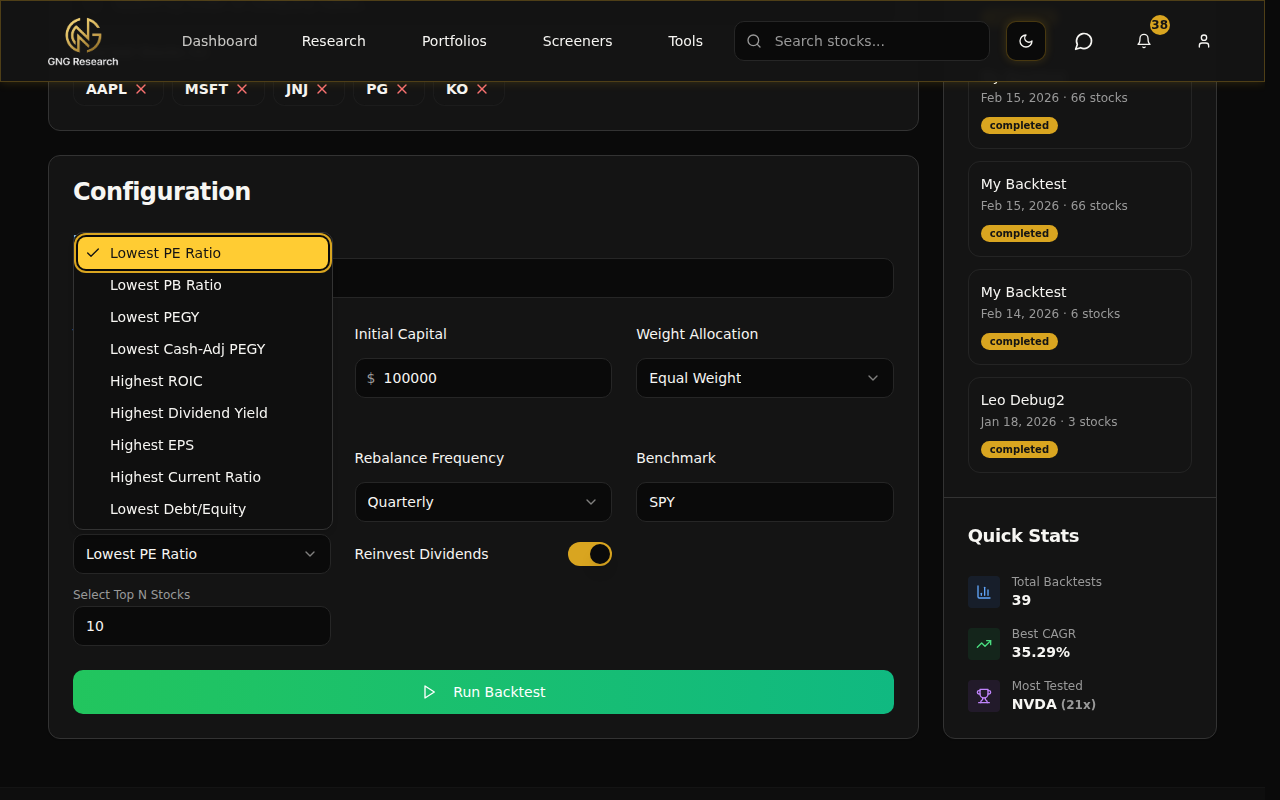
Dynamic (Top N by Metric) - This is where it gets interesting. Instead of maintaining fixed weights, the system ranks your stocks by a GNG metric at each rebalance date and concentrates your allocation on the top N performers. The rest of your stocks get sold, and the capital gets redistributed to the winners.
When you select Dynamic, a dropdown appears with the 9 available ranking metrics:
Lowest PE Ratio - Concentrate on the cheapest stocks by price-to-earnings
Lowest PB Ratio - Concentrate on the cheapest by price-to-book
Lowest PEGY - Price/Earnings-to-Growth-and-Yield ratio, a value metric that accounts for growth and dividends
Lowest Cash-Adjusted PEGY - PEGY adjusted for cash on the balance sheet
Highest ROIC - Focus on companies generating the best returns on invested capital
Highest Dividend Yield - Concentrate on the highest-yielding dividend payers
Highest EPS - Focus on the highest earnings per share
Highest Current Ratio - Favor the most liquid, financially stable companies
Lowest Debt to Equity - Concentrate on companies with the least leverage
Below the metric selector, you set the Top N value. If you have 10 stocks in your backtest and set Top N to 3, the system picks the 3 best-ranked stocks at each rebalance and splits your capital equally among them. The other 7 get sold.
Rebalance Frequency - How often the system rebalances (whether static or dynamic):
Never - Buy and hold. No rebalancing at all.
Monthly - Rebalances at the start of every month.
Quarterly - Every 3 months. This is the default and honestly what I'd recommend for most strategies.
Semiannual - Every 6 months.
Annual - Once a year.
I personally use Quarterly with Dynamic rebalancing.. it gives the strategy enough time to play out but still adapts to changing fundamentals. Monthly can create too much turnover, and Annual might be too slow to react.
Dividends and Benchmark
The Reinvest Dividends toggle controls what happens when a stock in your portfolio pays a dividend. When it's ON, all dividends are automatically reinvested back into the portfolio (DRIP). When it's OFF, dividends are collected as cash and just sit there.
If you're testing a dividend growth strategy, definitely turn this on. The compounding effect over 10-20 years is massive. I ran a backtest once with and without reinvestment over 15 years, and the difference in final value was almost 40%. That's pure compounding doing its thing.
The Benchmark field lets you set which ticker your portfolio gets compared against. It defaults to SPY, which is the S&P 500 ETF and the gold standard for performance comparison. You can change it to any ticker.. QQQ for Nasdaq, DIA for Dow Jones, or even an individual stock if you want to see if your portfolio beats a single holding.
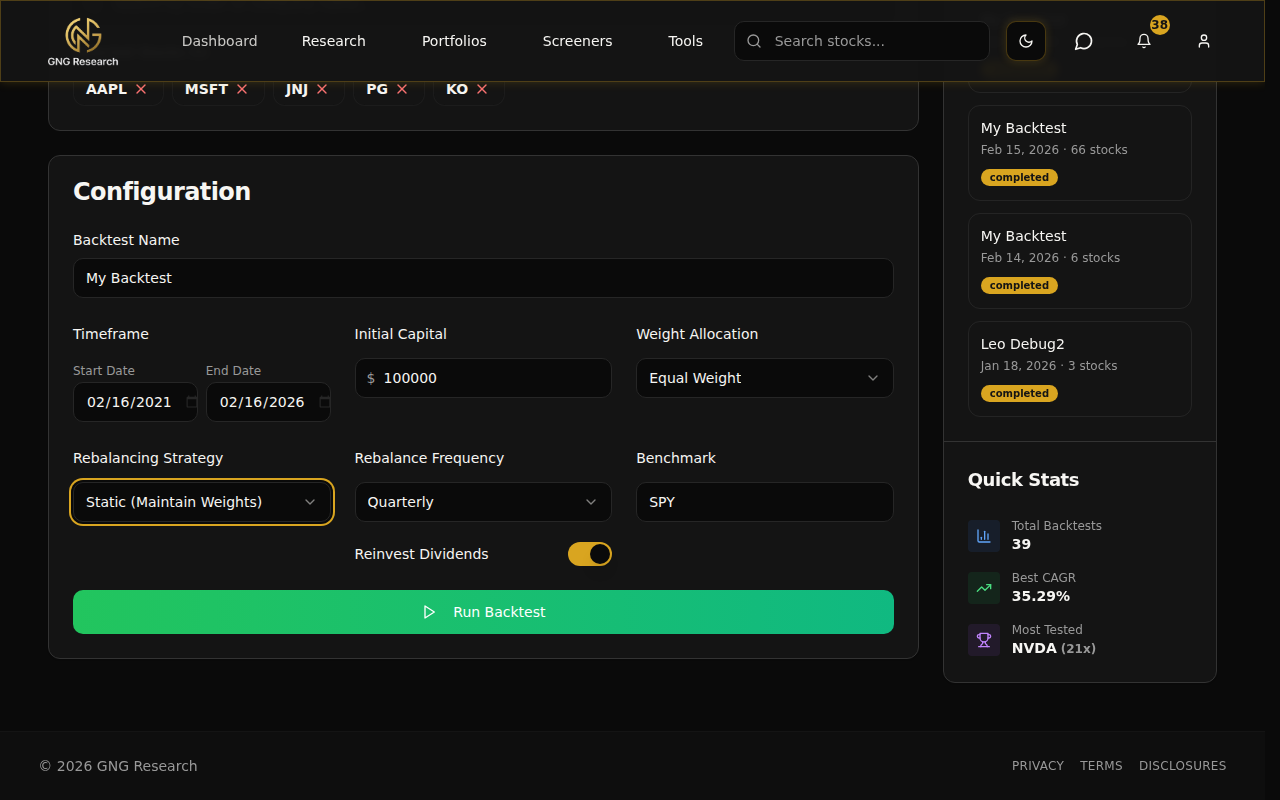
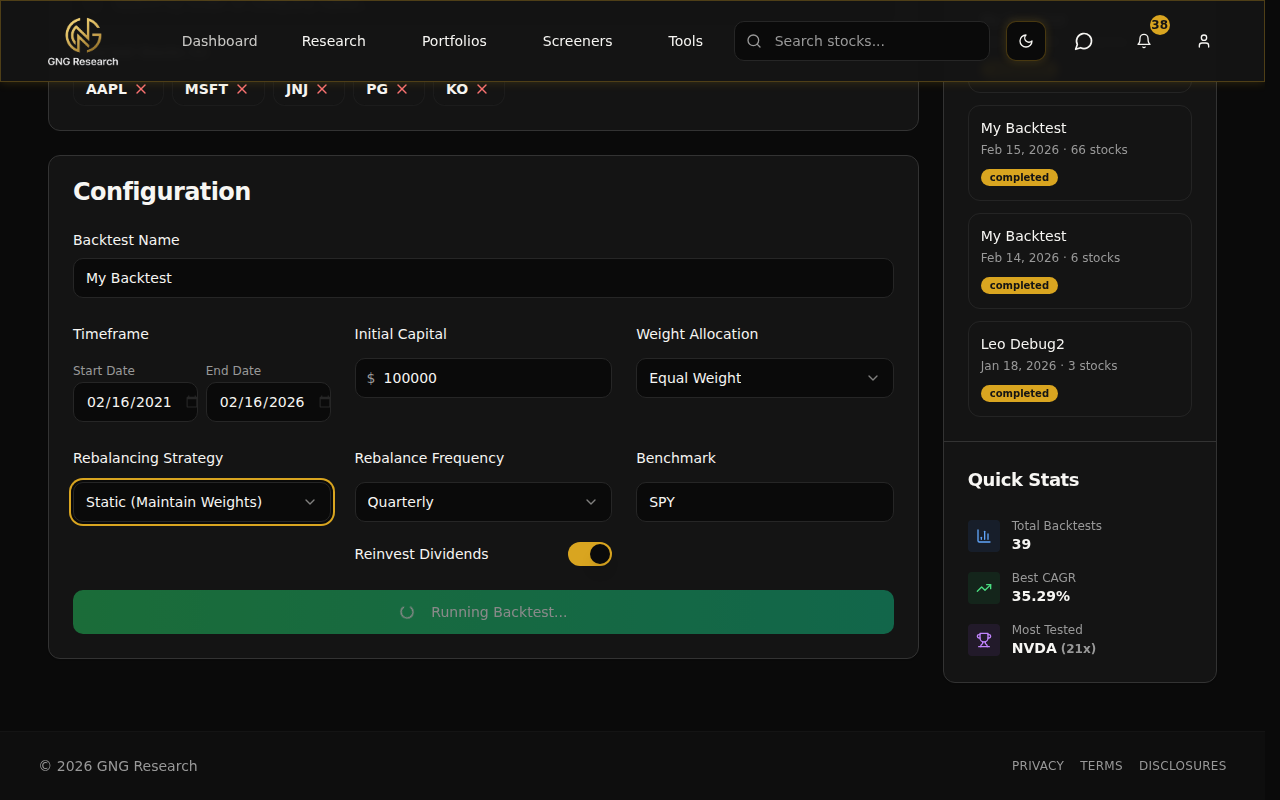
Running It
Once everything is set, click the big green Run Backtest button at the bottom of the configuration card. The system validates your setup first (stocks selected, weights add up, dates are valid) and then kicks off the backtest.
It takes about 10-30 seconds depending on how many stocks you picked and how long the date range is. You'll see a loading indicator with a spinning animation and a message that says "Running Backtest..." Once completed your our results load up right below the configuration on the same page.
Understanding Your Results
Alright, this is the good stuff. Once your backtest finishes, you get a full breakdown of how your portfolio would have performed. The results appear directly below the configuration card, starting with key metrics at the top and then a deep-dive across six analytics tabs. Let me walk through each piece.
Key Metrics at a Glance
At the very top of the results, six cards show you the most important numbers at a glance:
Total Return - How much your portfolio gained or lost over the entire period, as a percentage. Green if positive, red if negative. This is the headline number.
CAGR - Compound Annual Growth Rate. This is your average yearly return, accounting for compounding. It's the most apples-to-apples way to compare different strategies because it normalizes everything to an annual figure. A 10-year backtest with 200% total return sounds great, but the CAGR of ~11.6% tells you the real story.
Volatility - How much your portfolio value bounced around during the period. Lower volatility means a smoother ride. Higher means more stomach-churning swings. Expressed as an annualized percentage.
Sharpe Ratio - Return per unit of risk. This tells you whether you were compensated for the volatility you endured. Above 1.0 is generally considered good. Above 2.0 is excellent. Below 0 means you took on risk and got negative returns for your trouble.
Max Drawdown - The worst peak-to-trough drop during the entire backtest period. If your portfolio went from $150,000 down to $100,000 at its worst point, that's a -33% max drawdown. This tells you the absolute worst-case scenario you would have experienced. It also shows the date when the drawdown hit its worst point.
Final Value - Your ending portfolio value in dollars. You started with $100,000 (or whatever you set).. you ended with this. Simple and tangible.
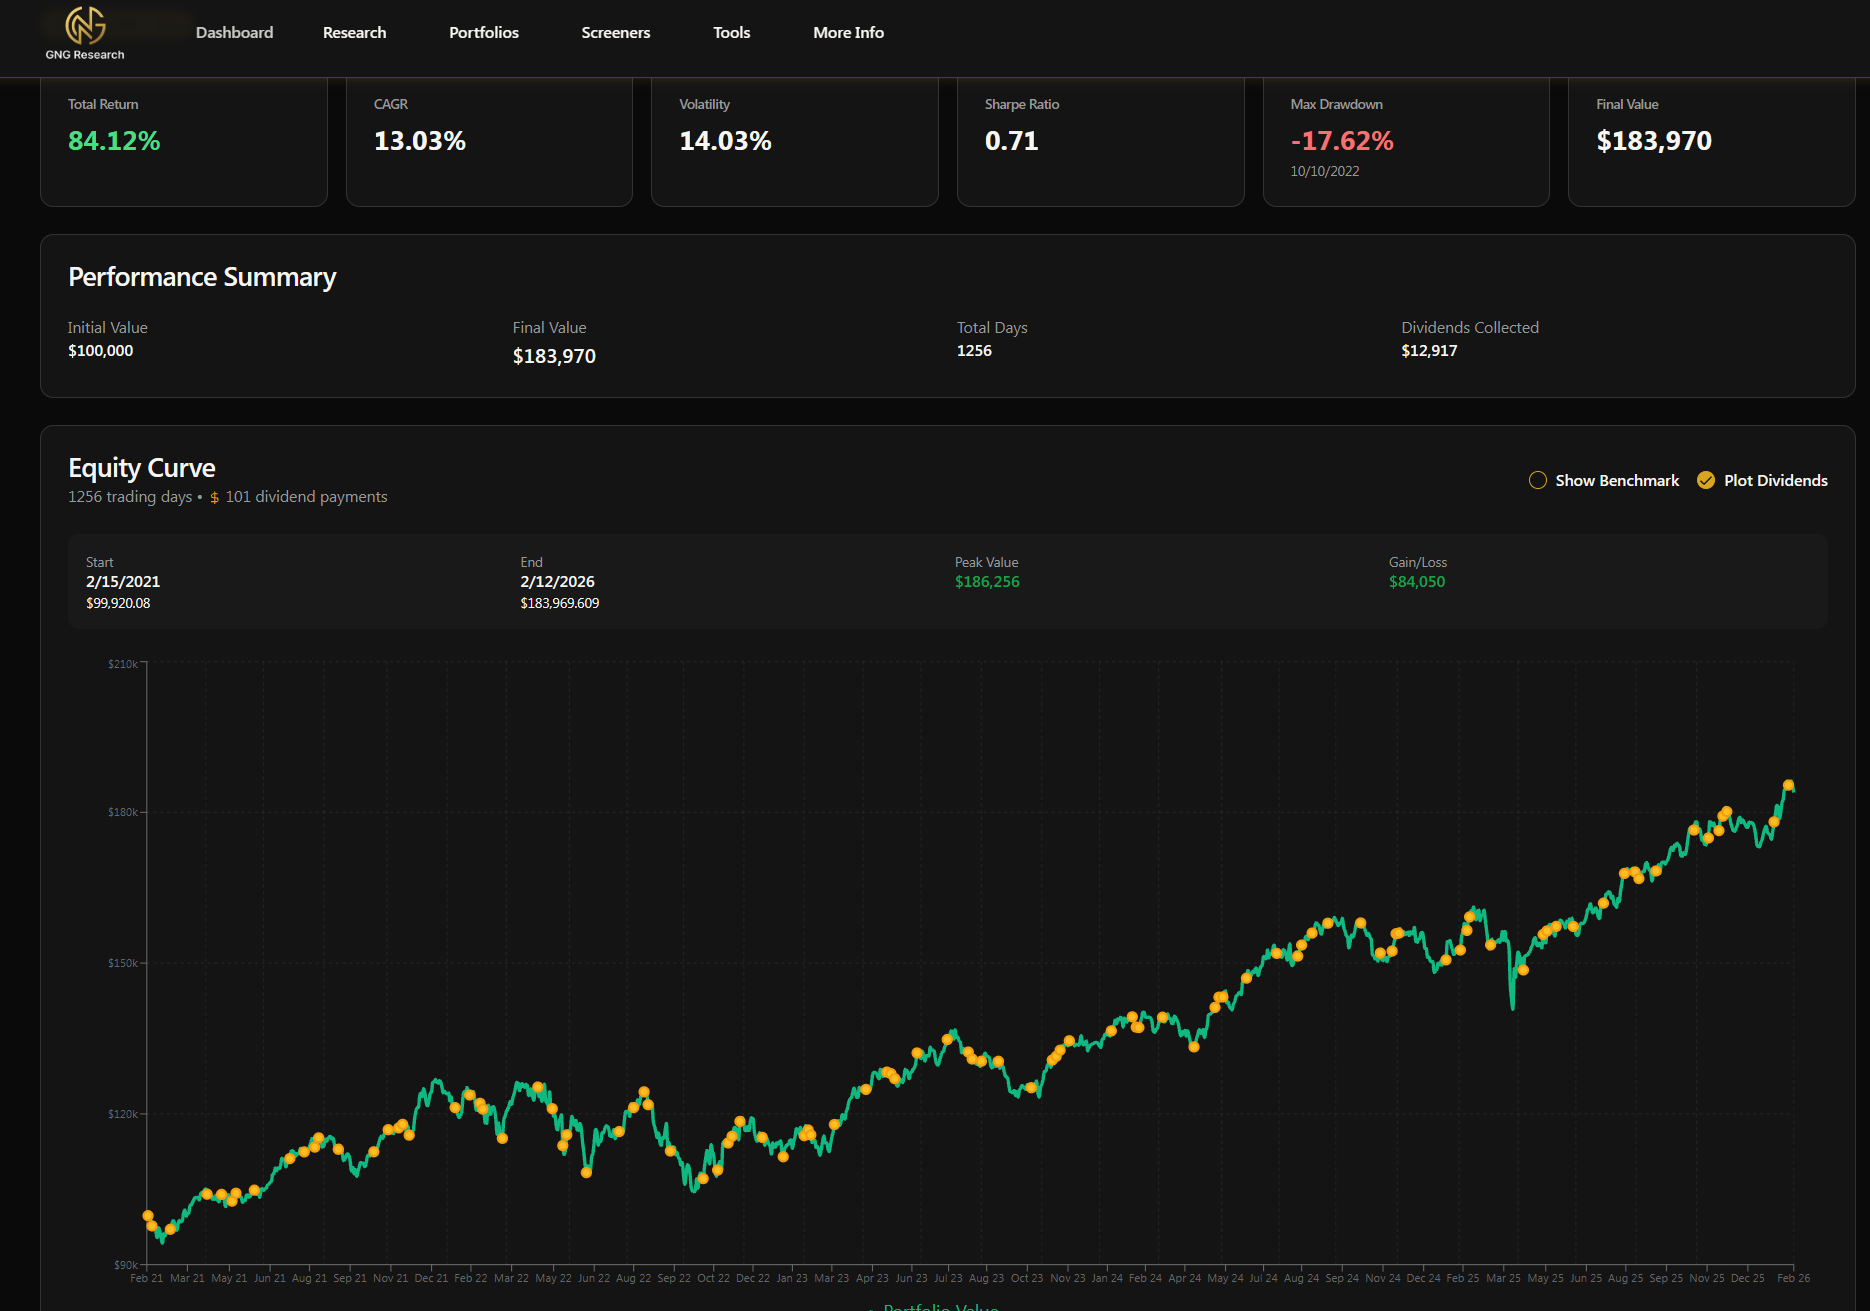
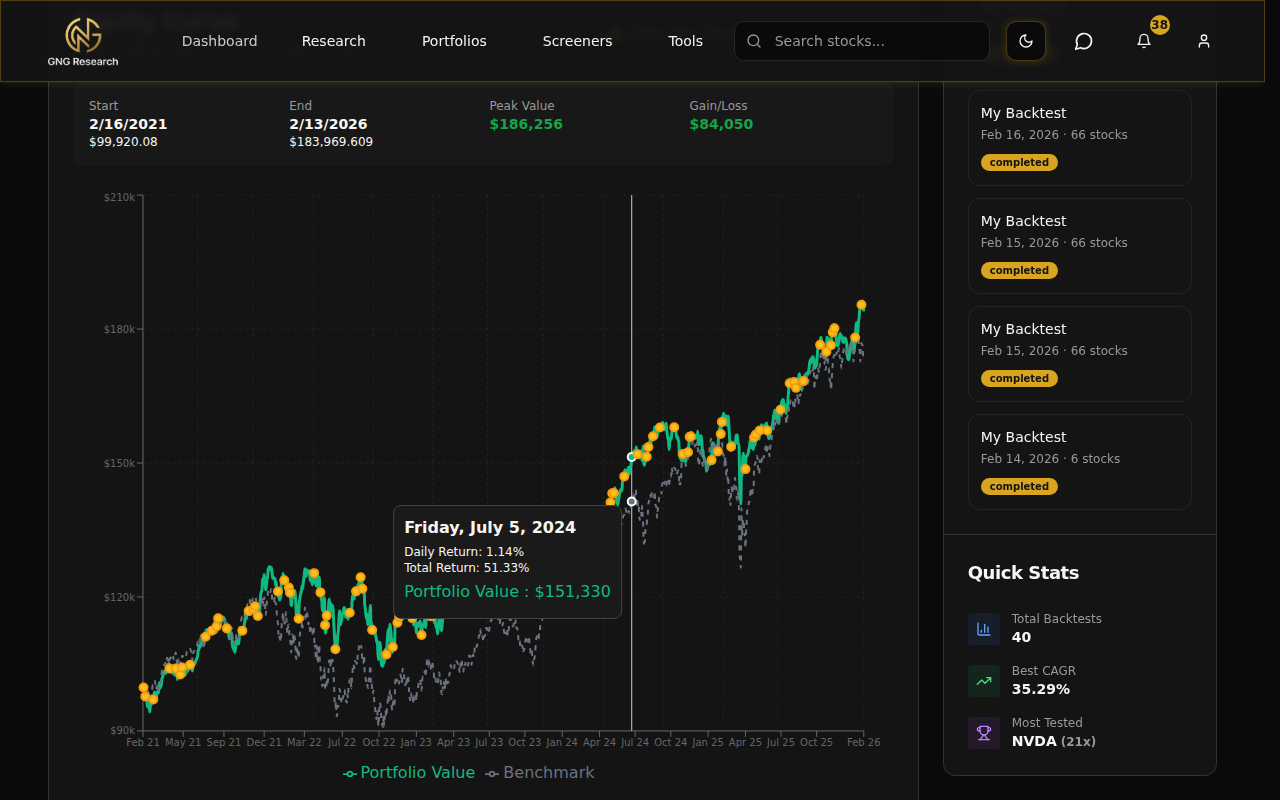
The Equity Curve
Below the key metrics, you'll see the big chart. This is the equity curve - your portfolio's value plotted over every single trading day in the backtest period.
The green line is your portfolio. The gray dashed line is the benchmark (SPY by default). You can toggle Show Benchmark to overlay or hide the comparison line. When both lines are showing, you can visually see exactly when your strategy outperformed or underperformed the market. The gap between the lines tells you the story.
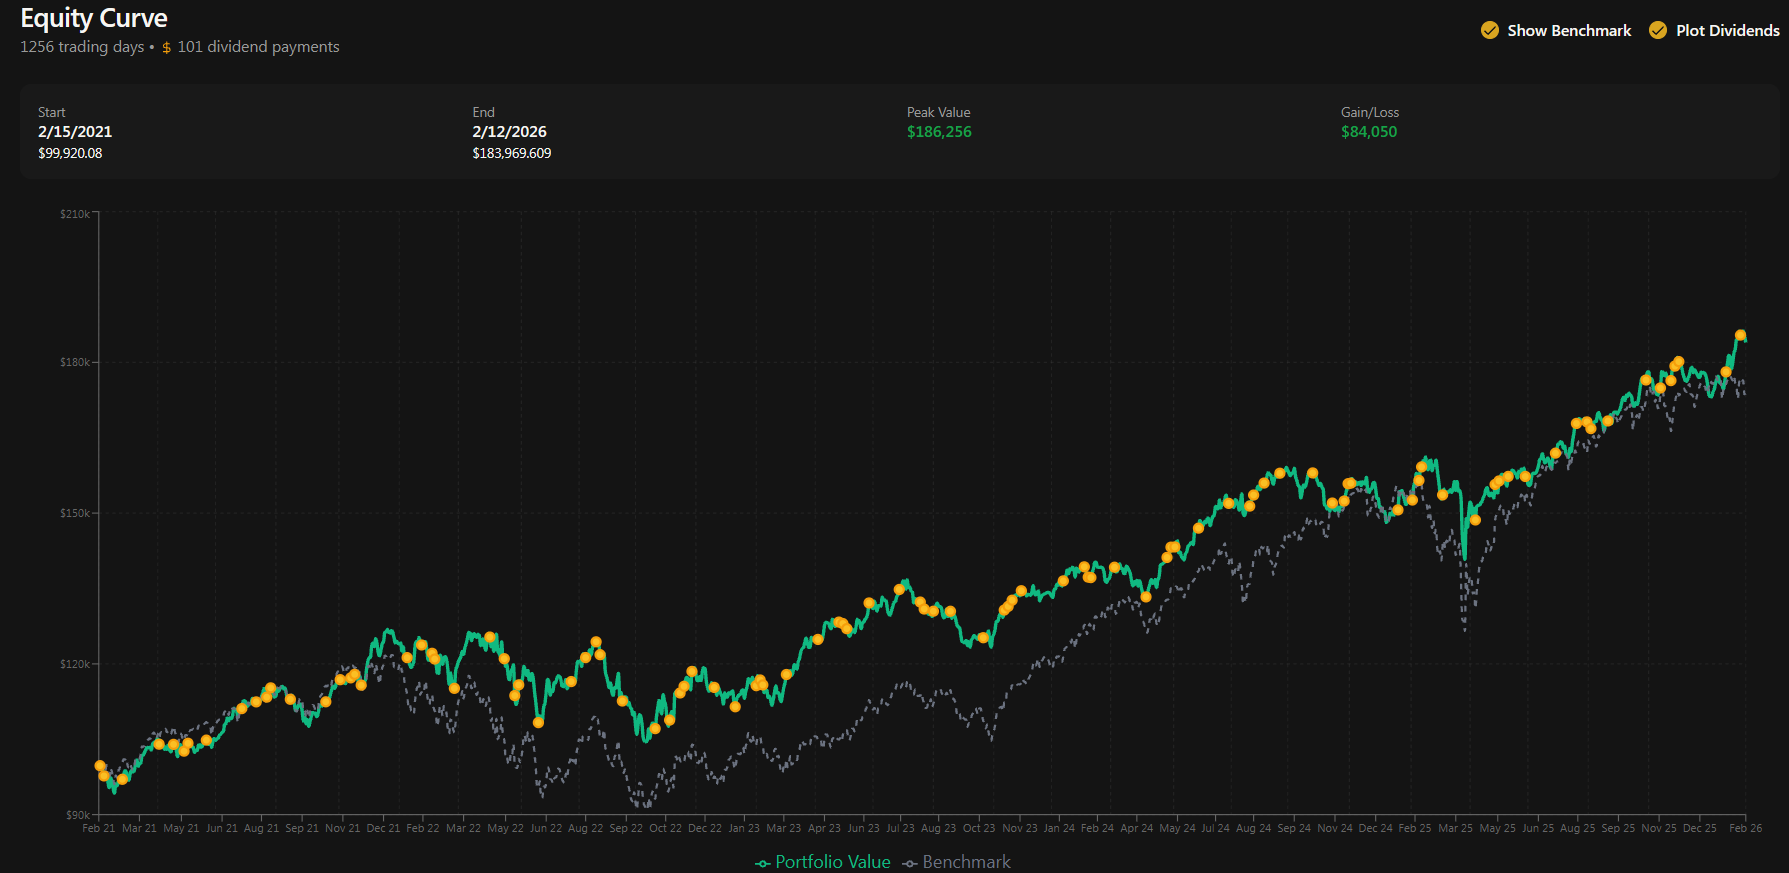
Toggle Plot Dividends to show gold dots on the chart every time a dividend was paid. This is really useful for dividend growth strategies because you can see the frequency and timing of payments visually. Hover over any point on the chart to see the exact date, portfolio value, and benchmark value at that moment.
I love this chart because it's the fastest way to understand your backtest. You can see drawdowns as the line dips, recoveries as it climbs back, and long-term trends at a glance. If your green line is consistently above the gray dashed line, your strategy is beating the market.
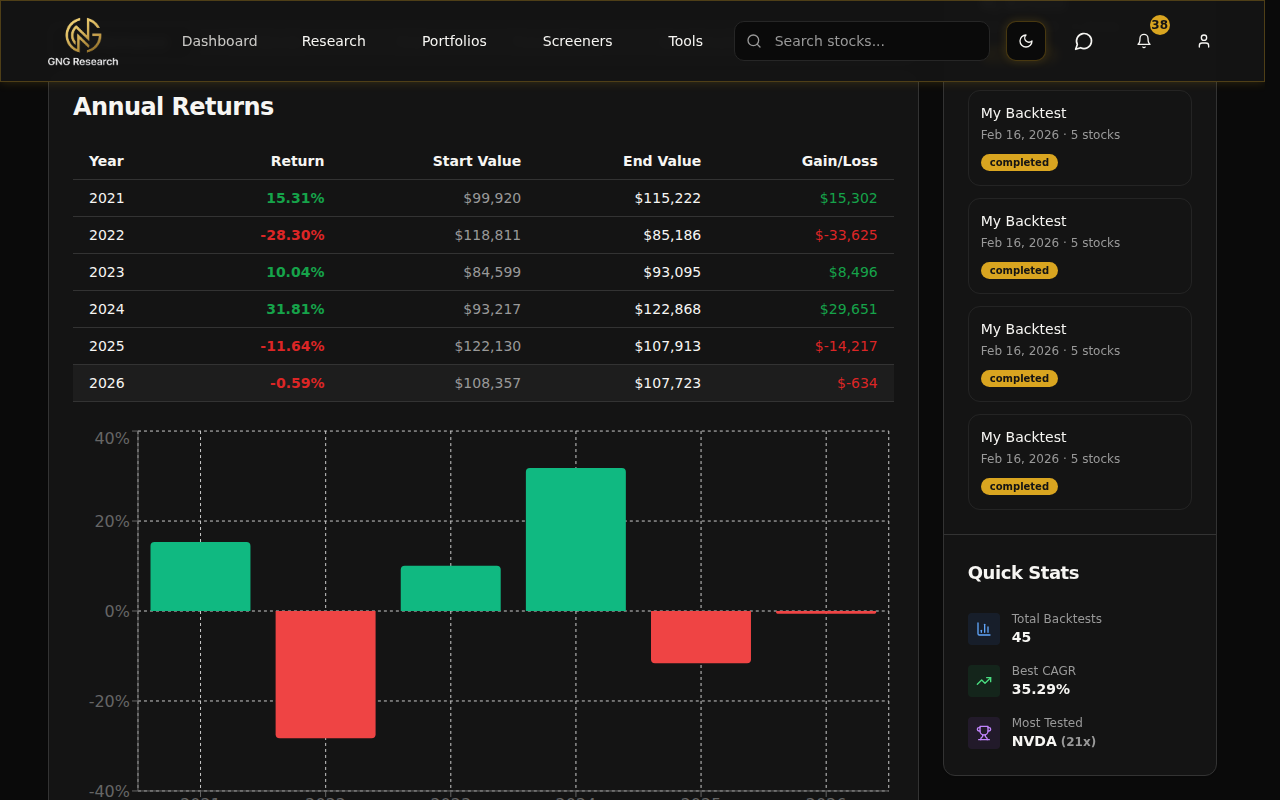
Performance Tab
The first analytics tab breaks down your returns year by year. You'll see a table with each year listed alongside its return percentage, starting value, ending value, and the dollar gain or loss. Below the table, there's a bar chart showing each year's return visually - green bars for positive years, red bars for negative ones.
This is great for spotting patterns. Did your portfolio hold up in 2022 when the broader market was down? How about the COVID crash in early 2020? Did it recover faster than SPY? Year-by-year data answers those questions at a glance and gives you a sense of consistency. A strategy that returns 15% one year and -20% the next is very different from one that returns 8% every year, even if the total return ends up similar.
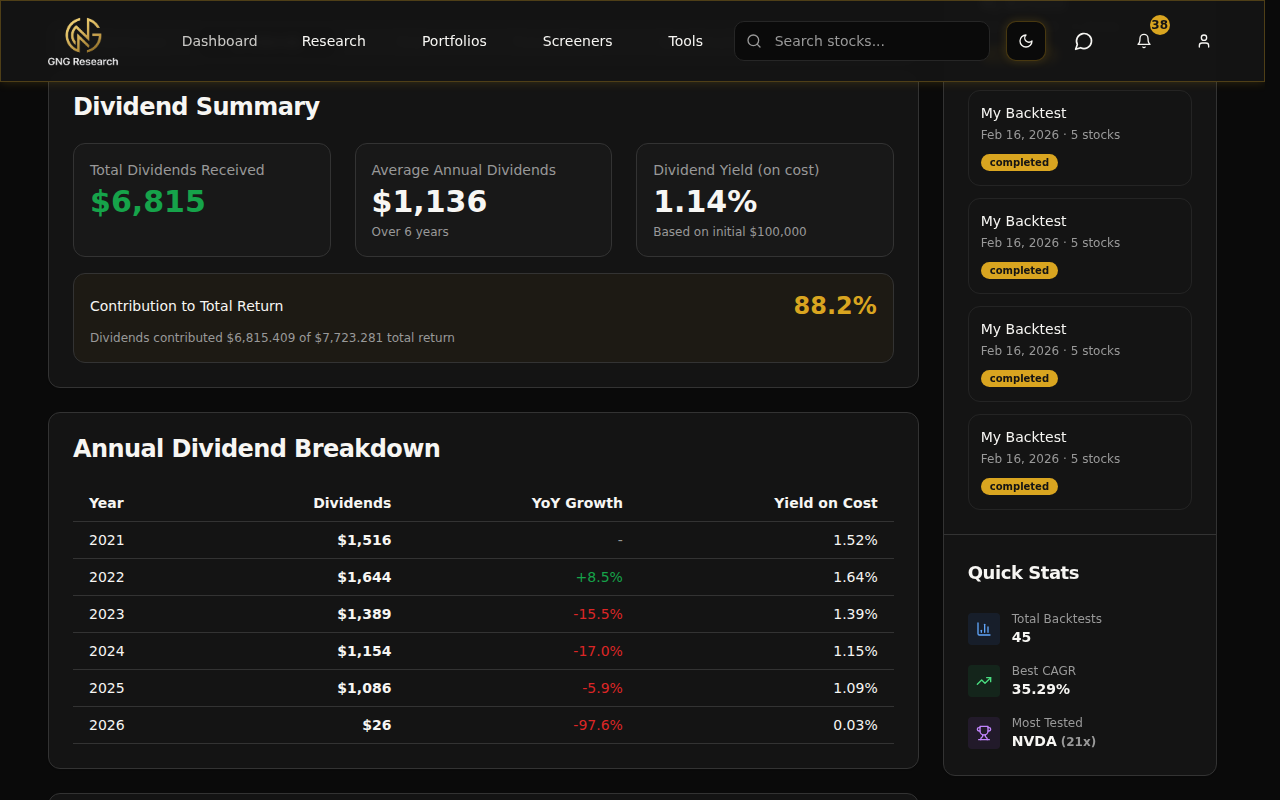
Dividends Tab
If you're a dividend investor, this tab is going to be your best friend.
At the top, three summary cards show the big picture: Total Dividends Received over the entire backtest, Average Annual Dividends, and Yield on Cost (total dividends divided by your initial investment). These tell you how much income your portfolio generated and what kind of yield you're getting on the money you put in.
Below that, there's an annual breakdown table showing how much dividend income you received each year, with year-over-year growth percentages. A dividend growth chart visualizes the trend so you can see if your income stream is growing, flat, or declining over time.
The advanced metrics section goes deeper with 3-Year Dividend CAGR and projected future income estimates. It shows how much dividends contributed to your total return, which is often more than people expect. Over long periods, dividends can account for 30-50% of your total return depending on the stocks you pick.
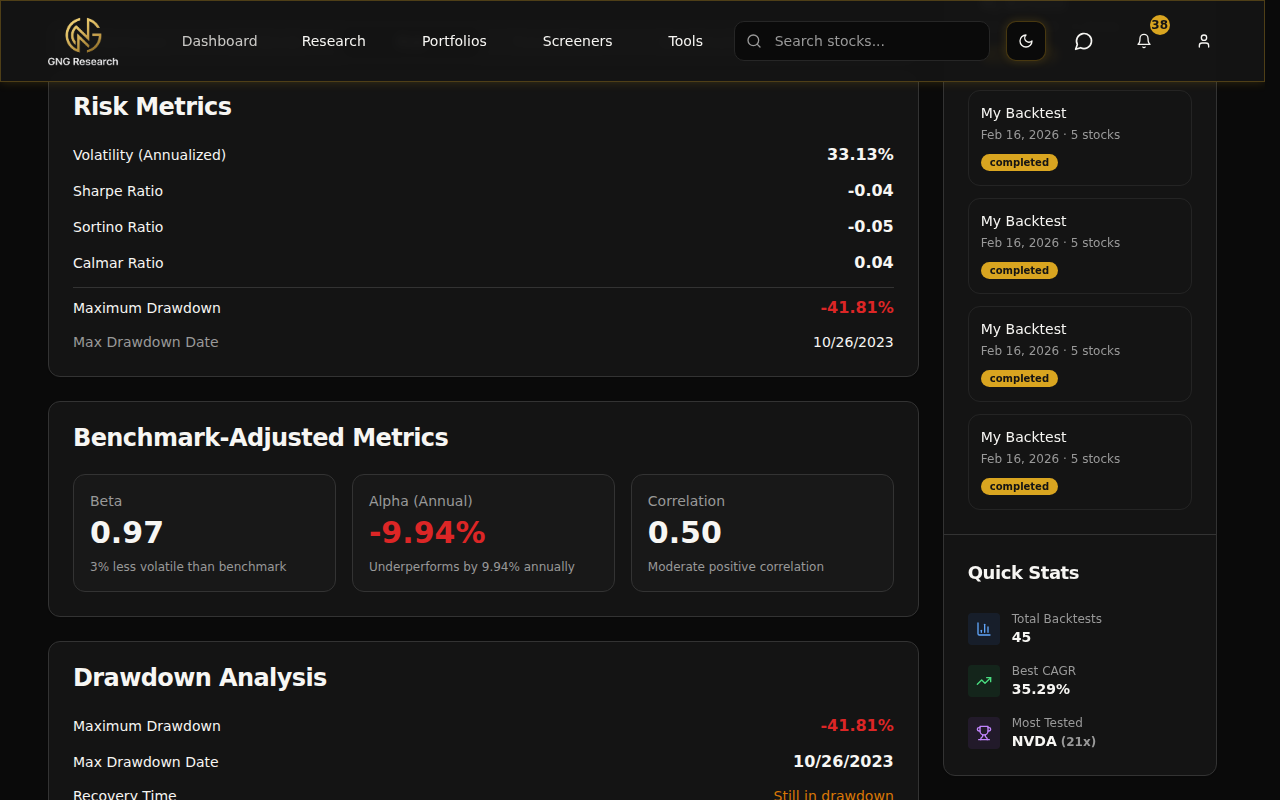
Risk Tab
The Risk tab gives you the hard numbers on how risky your strategy actually was. It's split into a few sections.
Core Risk Metrics:
Volatility - Annualized standard deviation of daily returns. How bumpy was the ride.
Sharpe Ratio - Return per unit of total risk. The gold standard for risk-adjusted performance.
Sortino Ratio - Like Sharpe, but it only penalizes downside volatility. Upside volatility (your portfolio going up a lot) doesn't count against you. This is a fairer measure if you believe that big gains aren't "risk."
Calmar Ratio - Return divided by max drawdown. Tells you how well the returns compensate for the worst drop you experienced.
Max Drawdown - The worst peak-to-trough decline, with the exact date.
Benchmark-Adjusted Metrics:
Beta - How much your portfolio moves relative to the benchmark. A beta of 1.0 means you move in lockstep with the market. Below 1.0 means you're less volatile than the market. Above 1.0 means more volatile.
Alpha - Excess return above what your risk level (beta) would predict. Positive alpha means you're generating returns beyond what the market risk alone would explain. This is the holy grail of investing.
Correlation - How closely your portfolio tracks the benchmark. High correlation means you mostly move with the market. Low correlation means your returns are independent.
There's also a detailed drawdown analysis section that shows the duration of the worst drawdown, recovery time, and the peak and trough dates. And at the bottom, a built-in educational guide explains what each metric means in plain English, so you don't need to Google anything.
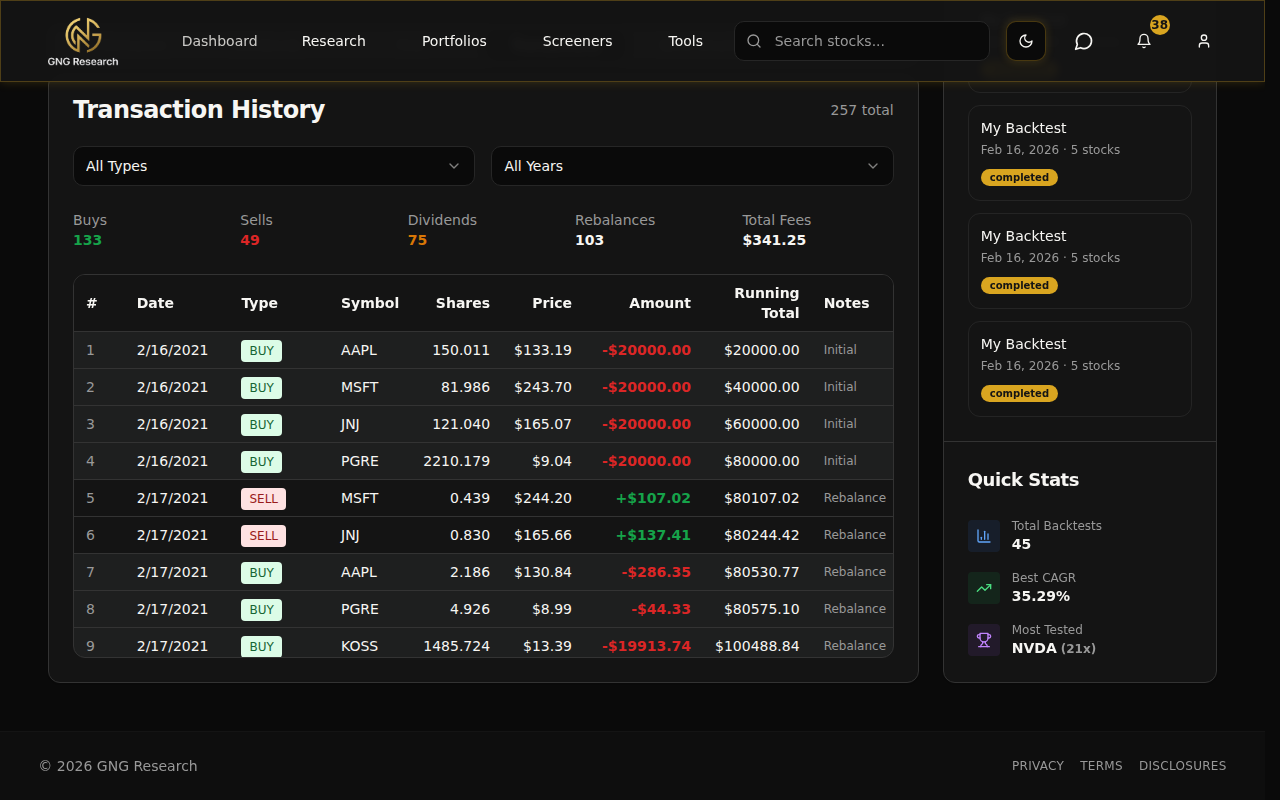
Transactions Tab
This is the complete record of every single trade the system made during your backtest. Every buy, every sell, every dividend payment - it's all here.
At the top, summary stats give you the overview: total number of trades, total dividends collected, and average trade size. You can filter the table by transaction type (buys, sells, dividends) and by year to drill into specific periods.
The table itself is color-coded so you can scan it quickly: buys in one color, sells in another, and dividends highlighted in gold. Each row shows the date, ticker, type, shares, price, and total dollar amount.
This is where you can see exactly what the system did. Every single trade, every dividend payment, all of it. If you're using dynamic rebalancing, this is where it clicks.. you can see the system selling one stock and buying another because the rankings changed. It makes the strategy real and transparent.
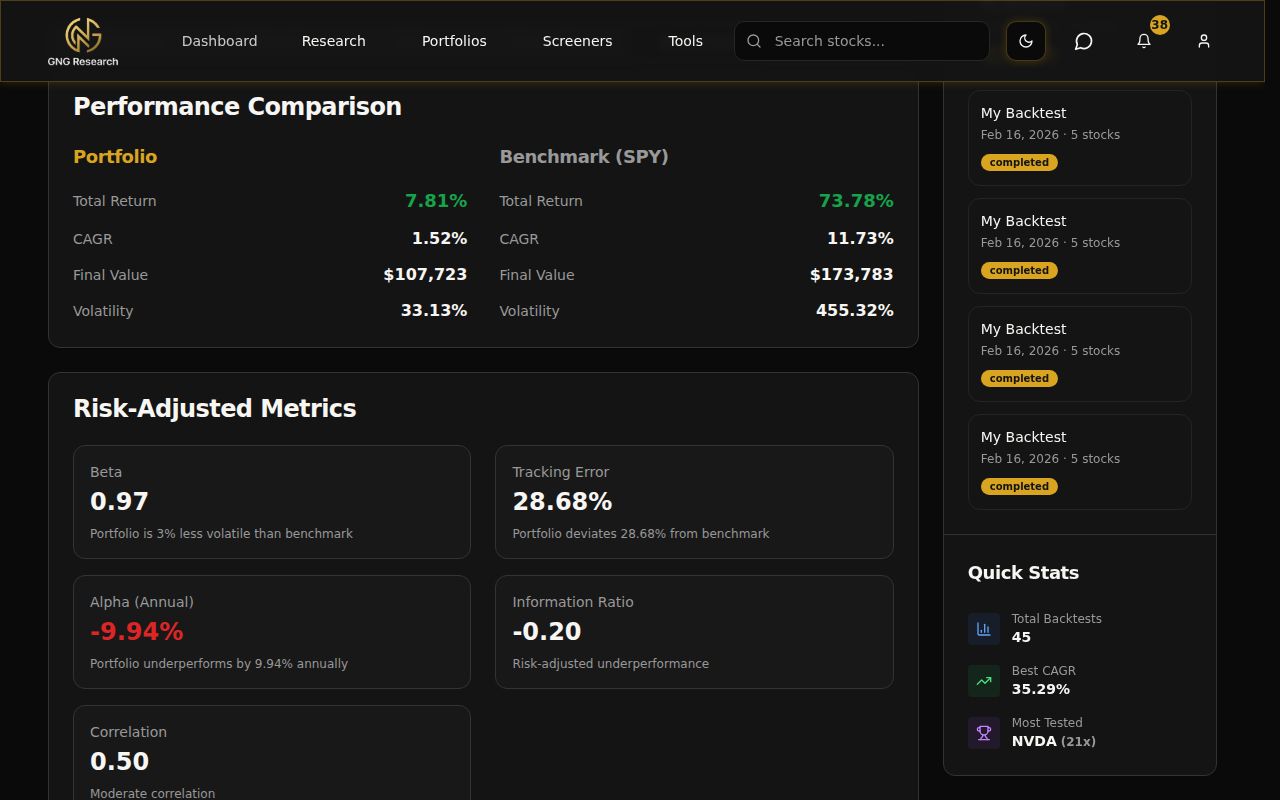
Benchmark Tab
This is where the rubber meets the road. Did your carefully picked stocks actually beat just buying SPY?
The Benchmark tab gives you a side-by-side performance comparison between your portfolio and the benchmark. Six risk-adjusted metric cards at the top show the key differences: total return, CAGR, volatility, Sharpe ratio, and more. An outperformance summary tells you the bottom line: "Your portfolio beat SPY by X% over the period" (or underperformed by X%, if that's how it went).
Below that, there's an overlay chart showing both your portfolio and the benchmark normalized to the same starting point, so you can see exactly when the lines diverge and by how much. And at the bottom, an annual returns comparison table puts your return next to the benchmark's return for every year, making it simple to see which years you won and which years you lost.
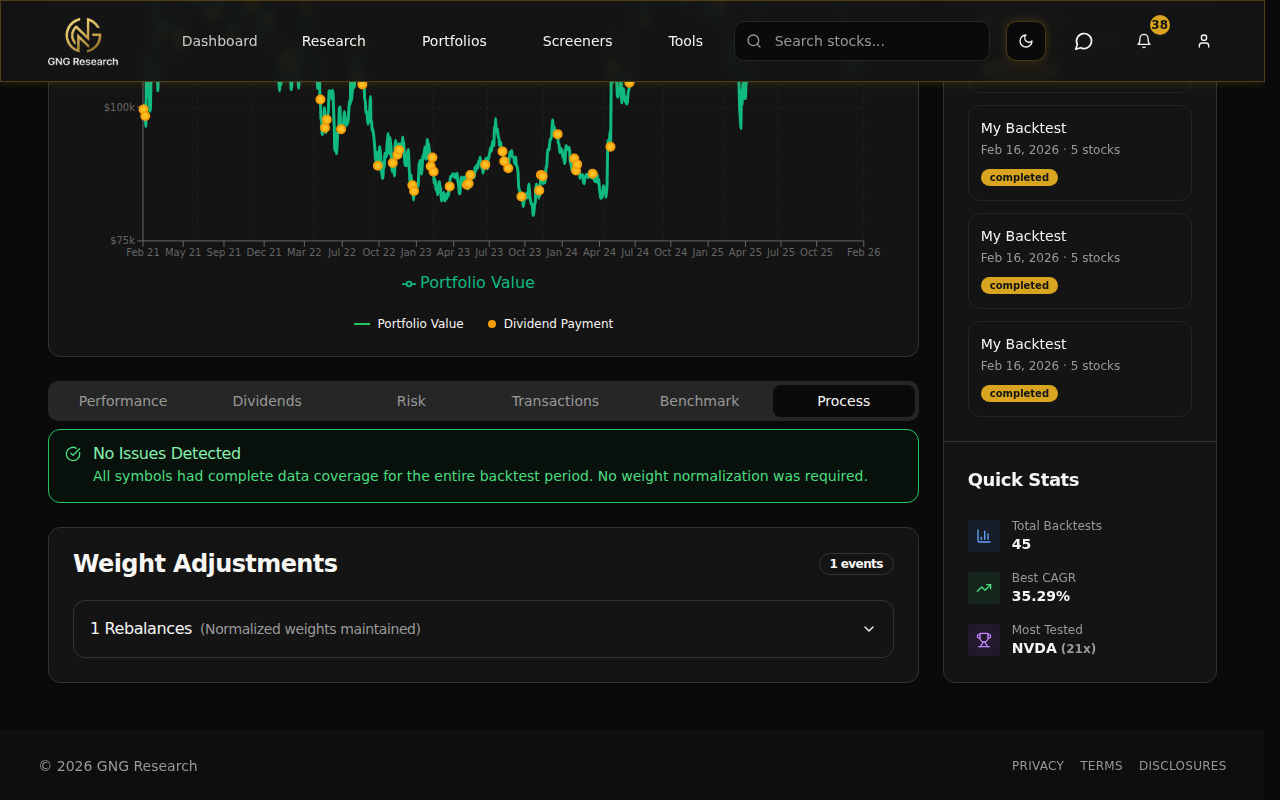
Process Tab
The Process tab is the "under the hood" view. It shows data availability info for each stock: which tickers had data for which parts of the backtest period, and how the system handled gaps.
If a stock didn't have data for your entire date range (say it IPO'd two years after your start date), the Process tab shows how the weights were redistributed among the remaining stocks until that ticker's data became available. It also flags any warnings - like if a stock had missing price data for certain dates or if weight normalization kicked in.
Most people won't need this tab, but if your numbers look off or you see unexpected results, check here first. It'll tell you exactly what happened with the data and why the system made the decisions it did. It's the transparency layer that makes everything else trustworthy.
Putting It All Together - A Quick Example
Let me walk you through a real example so you can see how this all comes together.
Say you want to test a classic dividend growth strategy. Here's what you'd do:
Go to Tools in the nav bar and click Backtester
Select Custom as your input source
Search and add five classic dividend growth stocks: JNJ, PG, KO, PEP, and ABBV
Set the initial capital to $50,000
Set the start date to 5 years ago and the end date to today
Choose Dynamic rebalancing, select Highest Dividend Yield as the metric, set Top N to 3, and keep the frequency at Quarterly
Turn on Reinvest Dividends
Leave the benchmark as SPY
Click Run Backtest
Just like that, you've tested a real investment strategy with real data. The dynamic rebalancing means every quarter, the system looks at those five stocks and concentrates your capital on whichever three have the highest dividend yield at that moment. It automatically sells the two lowest-yielding and buys more of the top three. With dividends being reinvested, you're compounding your income stream on top of the price appreciation.
Once the results load, you can see if concentrating on the highest-yielding dividend stocks each quarter would have beaten the S&P 500.. and by how much. Check the Dividends tab to see how much income the strategy generated. Check the Risk tab to see if the volatility was manageable. Check the Benchmark tab for the ultimate verdict.
Now do the same thing with your own picks. That's the whole point.. test your ideas before you put real money behind them. Run it with 10 stocks instead of 5. Try Lowest PE Ratio instead of Highest Dividend Yield. Change the rebalance frequency to Monthly and see what happens. Each test takes about 30 seconds and gives you data you can actually make decisions with.
Saving, History, and Rerunning Your Backtests
Every backtest you run gets automatically saved. You don't have to do anything special.. no save button to remember, no export to keep. It's all there in your history whenever you want to come back to it.
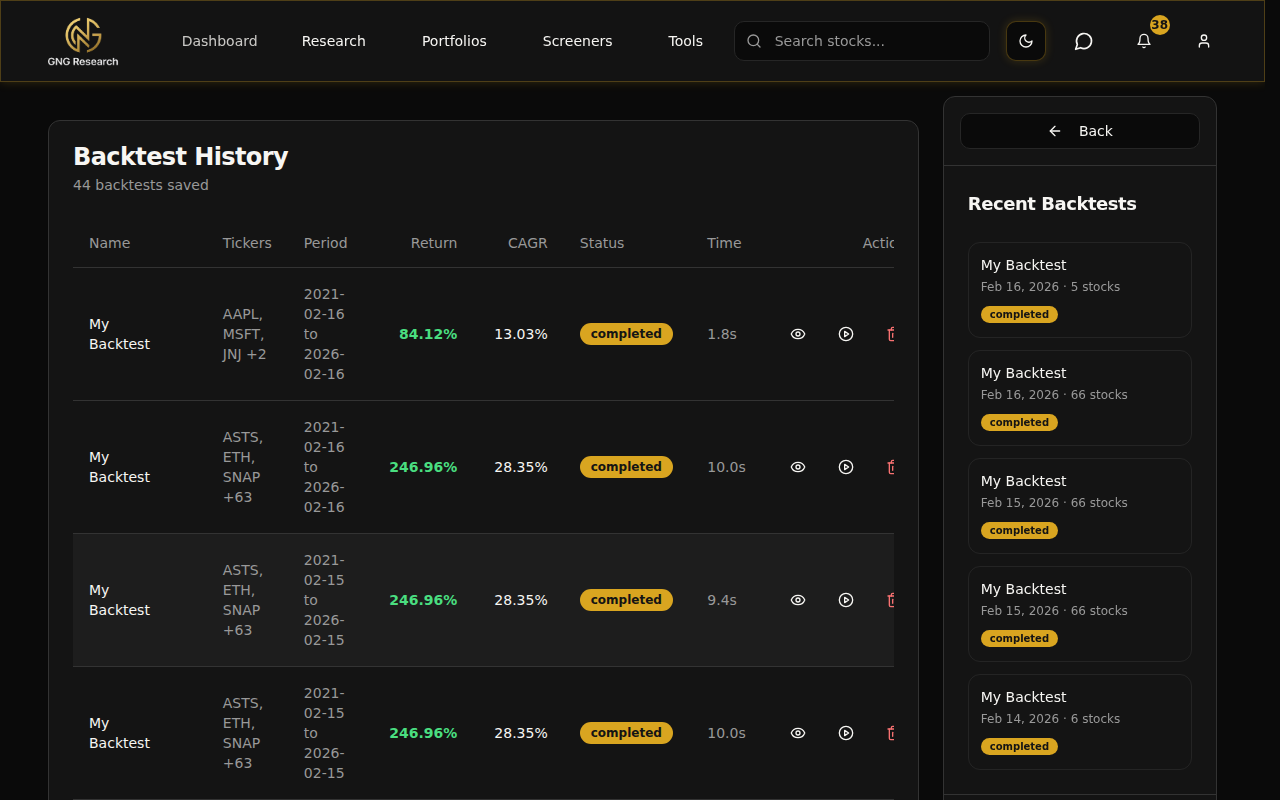
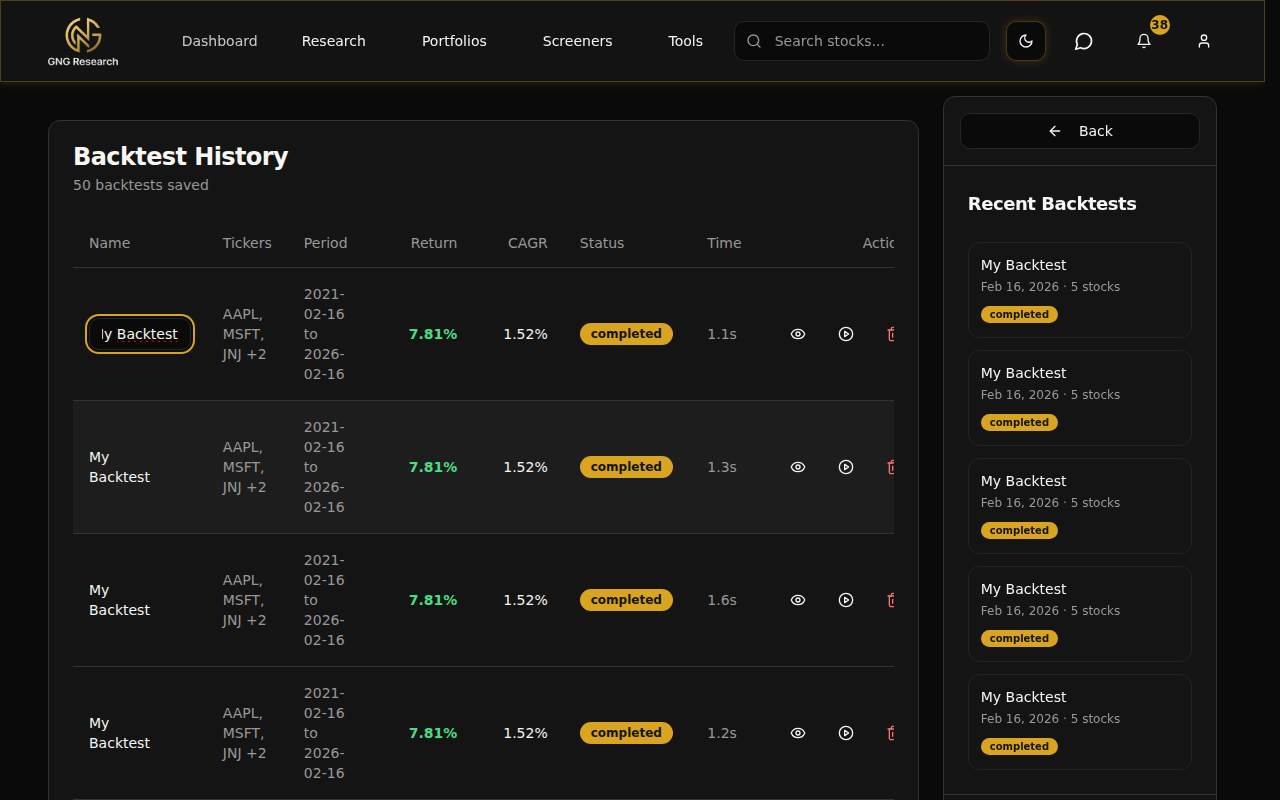
Your Backtest History
Navigate to the History page by clicking View Full History in the sidebar, or by going to the History tab at the top of the backtester. This page shows all your past backtests in a table.
Each row shows you: the backtest name, the tickers used (first three shown, with a "+N" for the rest), the date range, total return (color-coded green or red), CAGR, status badge (completed, failed, or processing), and execution time. It's everything you need to scan through your history and find what you're looking for.
Renaming a Backtest
Hover over any backtest name in the history table and you'll see a small pencil icon appear. Click it, type a new name, and press Enter to save. Press Escape to cancel.
I'd recommend naming them something descriptive so you can find them later. Something like "Dividend Kings Q-Rebal 5yr" instead of "My Backtest" haha. When you have 20+ backtests in your history, good names save you a lot of scrolling and guessing.
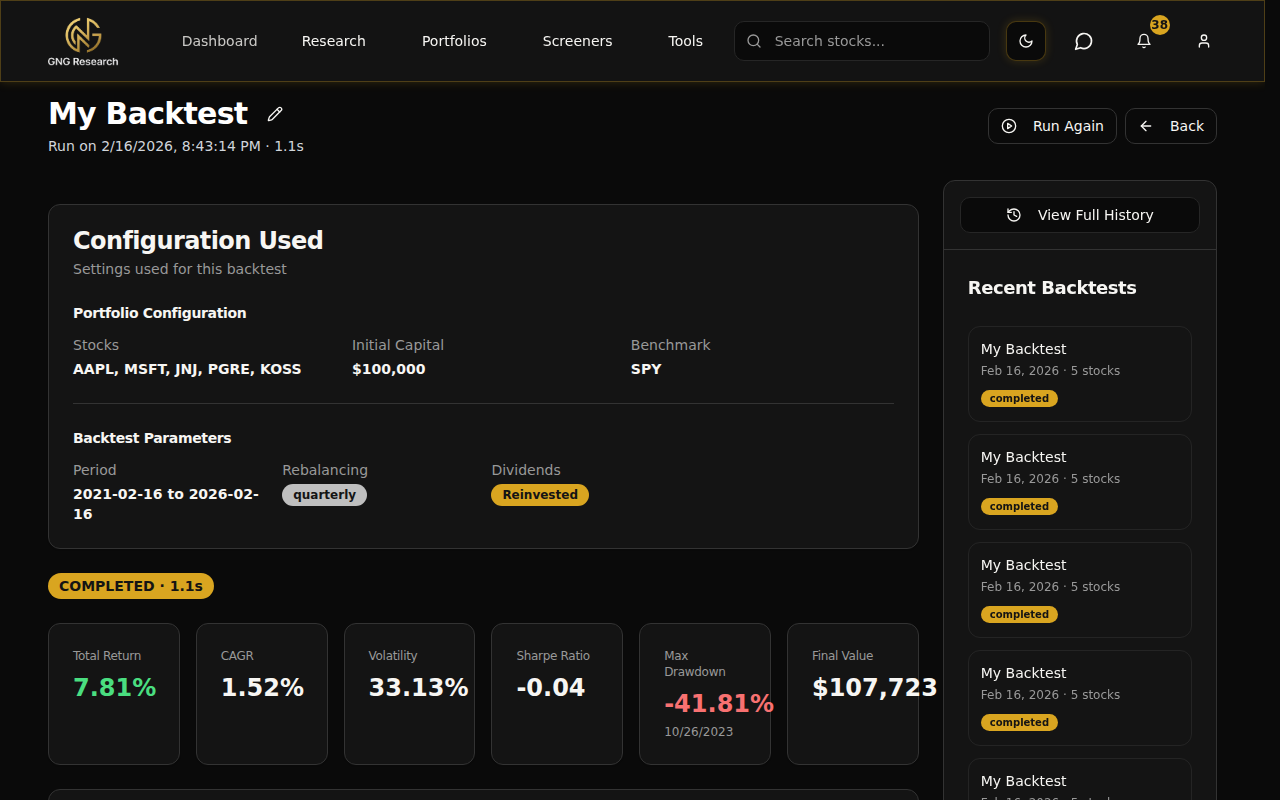
Viewing Past Results
Click the eye icon on any completed backtest to open the full results view. This is a dedicated page that shows everything about that backtest.
At the top, there's a configuration summary showing exactly what settings were used: the stocks, initial capital, benchmark, date range, rebalancing frequency, dividend reinvestment, and dynamic strategy (if applicable). Below that, you get all six metric cards (Total Return, CAGR, Volatility, Sharpe, Max Drawdown, Final Value), the equity curve chart, and all six analytics tabs with the full results.
You also get a status badge showing "COMPLETED" with the execution time, and buttons to Run Again or go Back to history.
Run Again
Click the play icon on any past backtest in the history table (or the Run Again button on the view page). This takes you back to the main backtester page with all the configuration from that backtest pre-filled: same stocks, same weights, same dates, same rebalancing settings, everything.
From there, change one thing - the date range, add a stock, switch the rebalance frequency, swap the dynamic metric - and run again. This is honestly one of my favorite features. You can take a backtest you liked, tweak one variable, and see how it changes the results. It's like A/B testing for investment strategies. Run it with Quarterly rebalancing, then run it again with Annual. Compare. Run it with Highest Dividend Yield, then with Lowest PE Ratio. Compare. Small changes can have big effects, and this makes testing them trivially easy.
Sidebar Quick Stats
On the main backtester page (and the history and view pages), the sidebar on the right shows useful info at a glance.
Recent Backtests lists your last five backtests with their name, date, stock count, and status badge. Click any one to jump straight to its full results page.
Quick Stats shows three things: your total number of completed backtests, the best CAGR across all your runs (so you know your personal high score), and your most-tested ticker with a count of how many times you've included it. It's a fun little dashboard that grows more interesting the more you use the tool.
There's also a View Full History button that takes you to the full history page.

Pro Tips
Start with SPY as your benchmark - It's the gold standard. If your custom portfolio can't beat SPY over 5-10 years, it might not be worth the extra complexity of picking individual stocks. That's not a bad thing to discover.. it just means index investing might be the right move for you, and the backtester helped you figure that out.
Use Dynamic Rebalancing with "Highest Dividend Yield" to automatically concentrate on the best dividend payers each quarter. Start with a pool of 8-10 solid dividend stocks and let the system pick the top 3-5 each quarter. It's like having an autopilot for income investing that adapts to changing yields.
Run the same portfolio with and without Reinvest Dividends to see how much DRIP actually matters. The difference over 10+ years will surprise you. I've seen cases where reinvestment added 30-40% to the total return over a 15-year period. Compounding is real.
Check the Process tab if numbers look off - Sometimes a stock doesn't have data for your entire date range (maybe it IPO'd after your start date, or it was acquired and delisted before your end date). The Process tab explains exactly what happened and how the weights were adjusted. Nine times out of ten, that's where the mystery gets solved.
Use "Run Again" to test one variable at a time - This is the scientific approach to strategy testing. Take your best backtest, hit Run Again, change the rebalance frequency from Quarterly to Annual, and compare. Then change the dynamic metric from Highest Dividend Yield to Lowest PE Ratio. Small changes can have big effects, and isolating one variable at a time tells you exactly what's driving the results.
The Transactions tab is great for learning - It shows you exactly when buys and sells happened and why. If you're trying to understand how rebalancing works in practice, or how dynamic strategy selection actually plays out, this is where it all clicks. You can trace through each quarter and see the system's logic in action.
Compare against Model Portfolios - Load up one of GNG's Model Portfolios and backtest it alongside your custom picks. See if your stock-picking actually beats a systematic approach. It's a great reality check and might give you ideas for strategies you hadn't considered.
Wrapping Up
That's the full rundown on the Backtesting Tools Suite. You've got a tool that lets you test any portfolio strategy against real historical data, compare it against benchmarks, analyze dividends and risk in detail, and iterate on your ideas with the Run Again feature. Everything saves automatically and your history is always there to reference.
If you have any questions, drop them in the comments below or come say hi in Rocket Chat. I'm always happy to help walk through a backtest setup or explain what a specific metric means.
Alright, go try it out. Pick five stocks, set up a dynamic strategy, hit Run, and see what happens. It takes about 60 seconds to configure and 30 seconds to run. No reason not to test your ideas before you put real money behind them.