Long Time No See
Its been a while.. I have a lot to share. I don’t want to waste time so lets get right to it.
Brokerage Connectivity
Finally.. plaid has arrived! (well still in alpha.. but its here!)
As of right now, all Pro members are able to connect their Brokerage account. I apologize for the delay on fidelity, but that now has been officially onboarded and is live. Follow the steps below to see exactly how to do it.
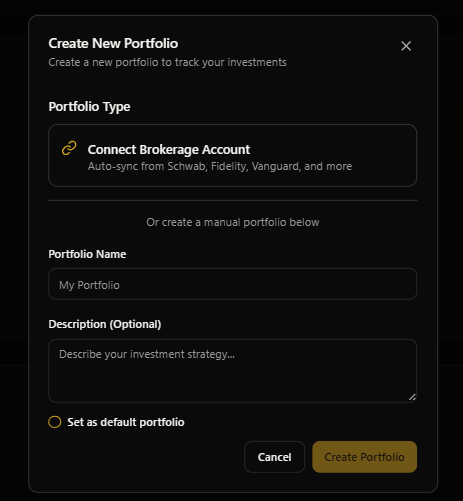
Select Create New Portfolio.
Search your broker account and follow all Plaid prompts.
You will then be prompted again by GNG to select which accounts to onboard.
And from there, sit back and relax as we go through all your transactions to try to properly clean and aggregate your data.
Data
As some of you probably know by now, there is a section where it says "mapped" and "unmapped". Essentially, the number of mapped tickers is the number of transactions where we were able to go through and map out when it was bought and sold, and we also have that ticker within the GNG system. Additionally, it is important to note that as you onboard these portfolios, we will automatically try to onboard all tickers into our system, assuming we have the data.
We plan on substantially expanding this dashboard as time goes on, but for the alpha version, we do not currently include the time series chart, nor some other data such as insider trades that will be included in the future.
We also eventually plan on being able to track options contracts. This is just not implemented for the Alpha launch.
Security
GNG’s Plaid integration was built with bank level security as the non negotiable requirement. Your brokerage login details are handled by Plaid, not GNG, so your username and password never touch our systems. We only receive a secure, read only connection that lets us display your portfolio data inside GNG.
Your connected account data is stored in our secure cloud database using strong encryption and strict access controls. Your information is kept private and isolated so only you can see your own holdings and activity inside your account. We also completed a professional security audit on February 6, 2026 to validate these protections.
What GNG can see through Plaid is limited to what’s needed to power portfolio analytics. That includes your holdings (tickers, shares, market value, cost basis, cash balances), executed transactions for up to the last 24 months (buys, sells, dividends, deposits, withdrawals, fees), and basic account details like account type and the last 4 digits. We do not see your brokerage password, Social Security Number, full account numbers, personal documents, or anything beyond Plaid’s history window.
What we do with this data is simple: better portfolio tracking. We use it to calculate performance, returns, dividend income trends, allocation breakdowns, and other analytics so you can understand your portfolio faster and in one place. We will never sell your data, never share your holdings with other users, and we cannot trade, move money, or change anything in your brokerage because the connection is read only.
You stay in control. You can disconnect at any time, which immediately stops future syncing, and your historical connected data is retained for 90 days before automatic cleanup. If you delete your GNG account, all connected data and access are removed as part of the deletion process.
Known Bugs (as of when the article was published)
Users can not connect more than one brokerage account from the same institution.
Watchlists
We've implemented a very intuitive way for users to build watchlists. Not only will users be able to build their own watch lists, they'll be able to share them publicly to the entire community. And on top of that, you can copy the link and you'll be able to send it to friends and family. They can view and access it without having an account if that's the setting and structure you so please.
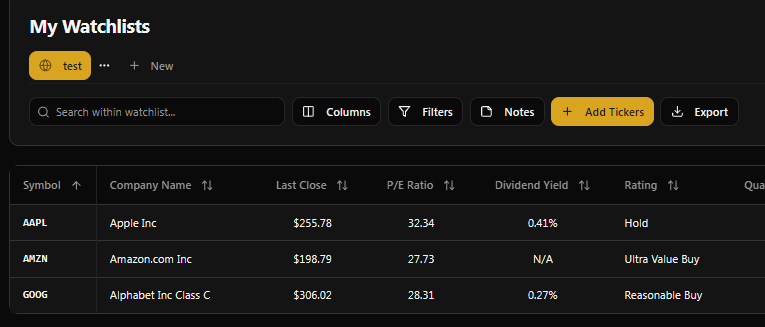
To build a watchlist:
select the tools section in the nav bar.
Select the My Watchlist page.
Create your first watch list by naming it and adding a description, you may additionally include tags to describe what kind of watchlist it is/the goal.
From here, you can add different columns and filters to your watch list, along with different notes that you will be able to see later. The benefit to adding columns to a watchlist is to expand the amount of data points shown to both you and on the community watchlist page if you decide to publish it for everyone. Additionally, filters will filter out certain things that do not meet your criteria that maybe at one point you were looking for. These filters are very intuitive and similar to the research terminal filters and columns.
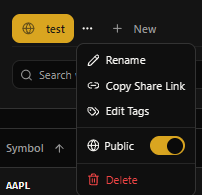
To edit settings, click the three dots that appear next to the name of the watch list you have selected. This will allow you to:
rename
copy the link to share
edit the different tags
make it publicly visible or disabled
You may also delete your watch list using this section.
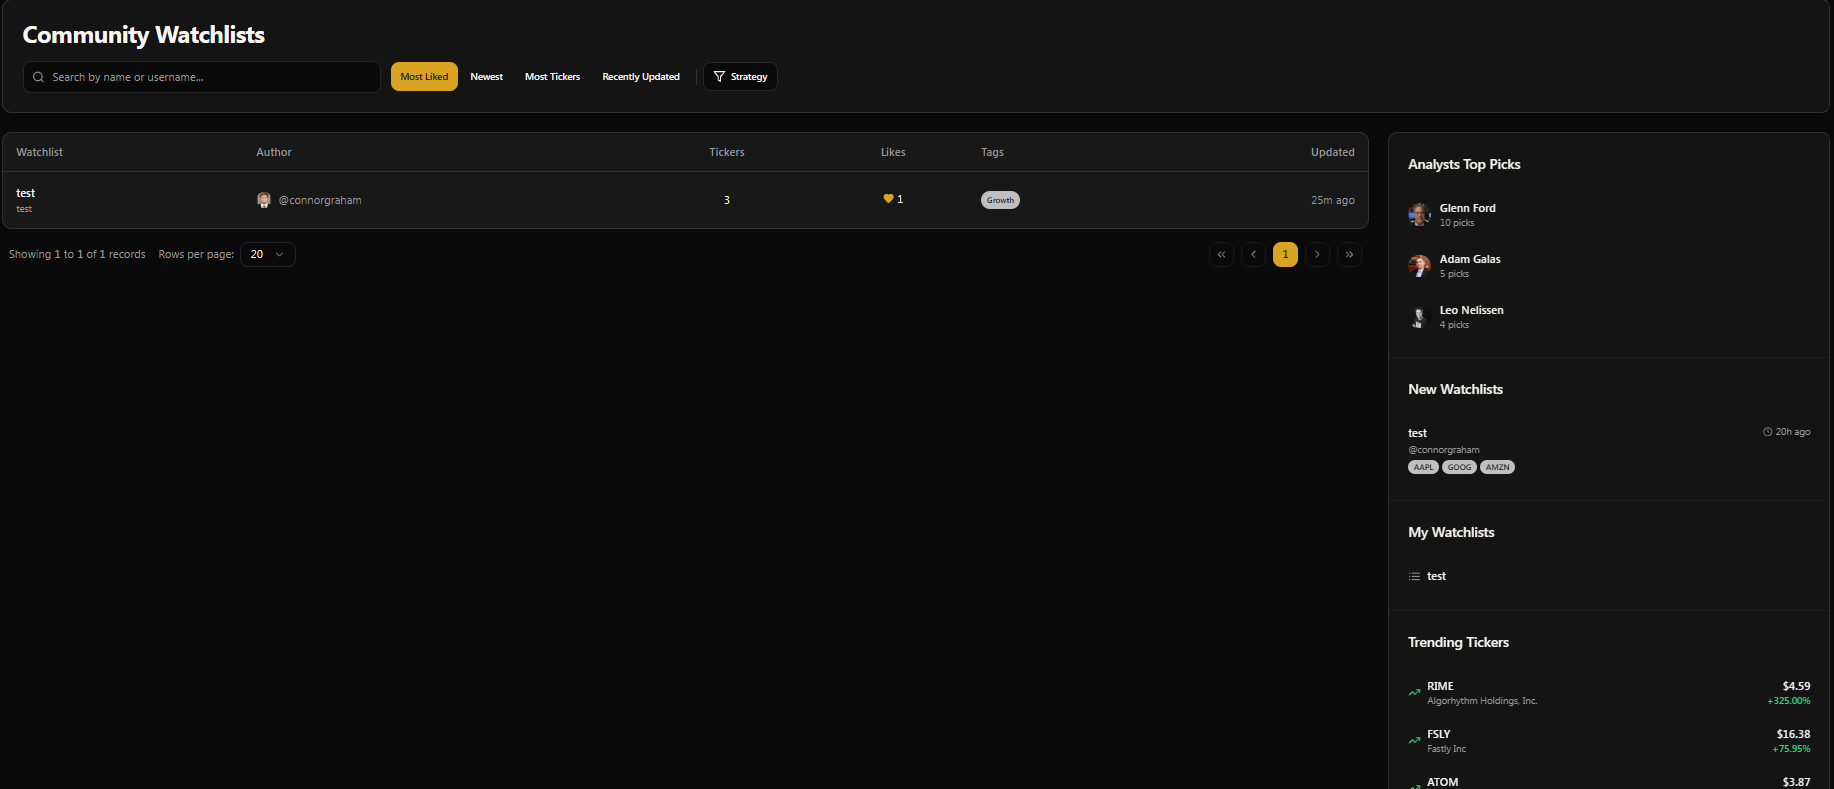
Now onto the community page
when you decide to publicly share a watch list, it will be populated on the community page in the nav bar. This can be found under the research tab near the bottom. You will be able to select other people's publicly shared watch list and view their holdings and review their notes. You make a query by most liked, most recent were based upon strategy to try to see ideas that others are considering. Feel free to share these links in Rocket Chat and like the ones that you do see value behind. I thought this would be a neat way to bridge the gap between the community and the analysts. You will also see in the side bar we include our top picks from analysts, linking just for inspiration.
The Dividend/Income Forecasting Suite
This one really excites me, and I'm proud to announce that we have finally released our dividend forecasting suite into alpha. I'm sure you've used some typical dividend forecasting tools in the past, maybe online, that use an implied growth rate that seems very deterministic and might lead to inaccurate results. Well, we built that.
BUT we added some special sauce. As you go through and use this tool, you will notice a section that says Monte Carlo Mode..
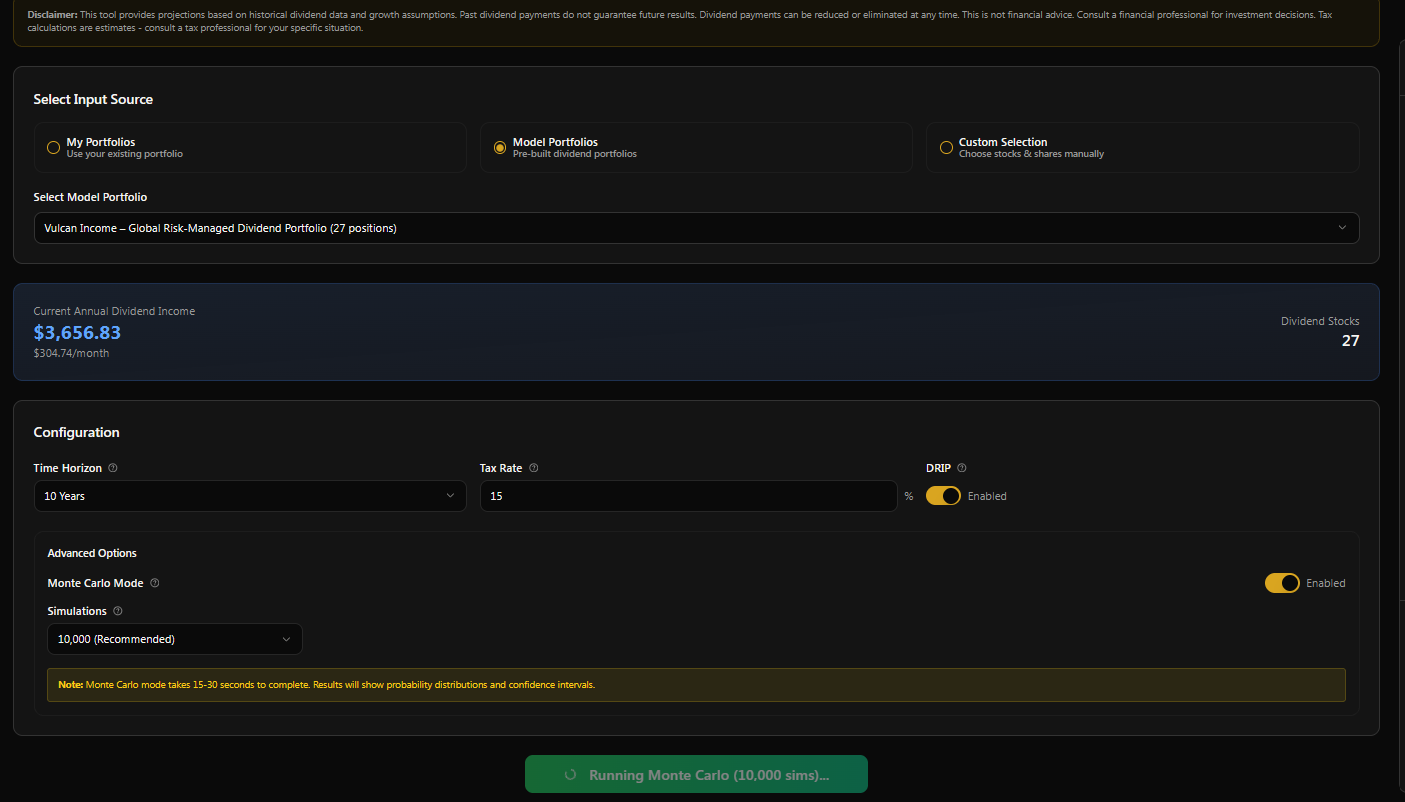
When this is enabled, our system will analyze the percent growth and decline throughout the entire history of each stock's dividend history. And create random paths and simulations to build a more accurate probability distribution to see where portfolio income will end up over a certain horizon.
I have not seen a tool or methodology similar online. Maybe we may have synthesized this one all on our own, but I do challenge you: if anyone else knows of any other system or product offering this type of dividend tooling, please drop it in the comments below because I would love to see it, and maybe even add hours if they have good ideas haha. Can you tell i’m a little proud of this one?
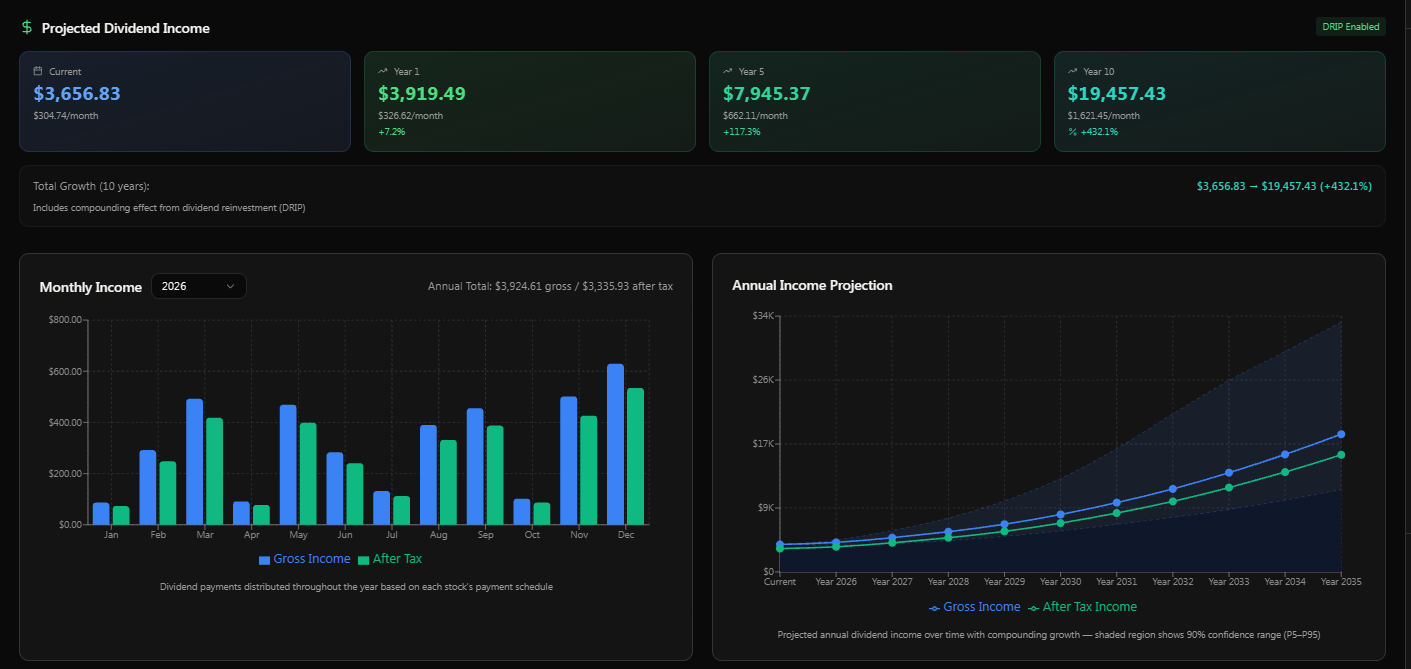
Shout out Glenn as I use his income model portfolio to show off some screenshots of this new feature. In the image below, you can see the projected timelines assuming the median option out of all 10,000 simulations that were run. Simulations can take anywhere from 10 seconds up to multiple minutes depending on the size of someone's portfolio. When hovering over the chart that says "annual income projection", you can see a general range from 10% to 90% of where income is likely to be over the time frame. Along with the 50% most likely and statistically sound estimate that we are able to make.
The the best part? With Plaid integration, for any of our tools you can simply go through connect to your portfolio and seamlessly select your real account in the UI, meaning that you can do this on your own portfolios in a matter of seconds, not minutes, hours, or days of adding thousands, if not tens of thousands of transactions.
This can be done by just selecting the My Portfolio section and selecting the account, whether it be Plaid or Manual, that you are looking to generate a forecast for.
Major Data Upgrades To Company Pages
We have enhanced the company details page that you can locate by searching in the search bar any ticker that you so please.
Sentiment scores that update daily, where you can see different time frames of how the market is feeling about a company.
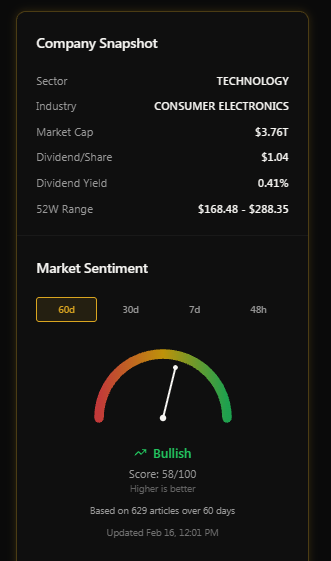
Our technical indicator suite with over 50 technical indicators added.
Our new dividend section that just gives a simplistic breakdown of the company's dividend, along with showing their valuation based solely on the Gordon growth model.
This page will also show users the same old stuff, such as the GNG scoring and valuation per company, any GNG articles on company, along with all financial statements, earnings estimates, and recent news articles, and of course, the price chart, and I'm sure there is more data I'm leaving out that wasn't a part of this initial update.. And oh yeah, I added a small share icon. As you can see, right below the price in the top right of the page. Please feel free to send this link to any family member or friend. There are some data points that are available outside of having a membership, but obviously we keep the good stuff for our members. The reason we decided to make the website a little bit more open is to try to build an organic user base - and hopefully grow some more so Adam can sleep well at night knowing that we're not running red. I hope you all don't take it the wrong way. Trust me, all the value that you are receiving largely is behind the paywall. Just some pretty charts and basic metrics are open to the internet.
Additionally, we have all the option data for every contract that is updated at the end of each day, along with charting the the Greeks and some other data. We plan on eventually majorly expanding on our charting system and having a whole charting suite just for our time series data, but here's a small sneak peek. Don't worry, it'll be better in the future. This can be found by selecting the Options area and clicking into any of the contracts seen.
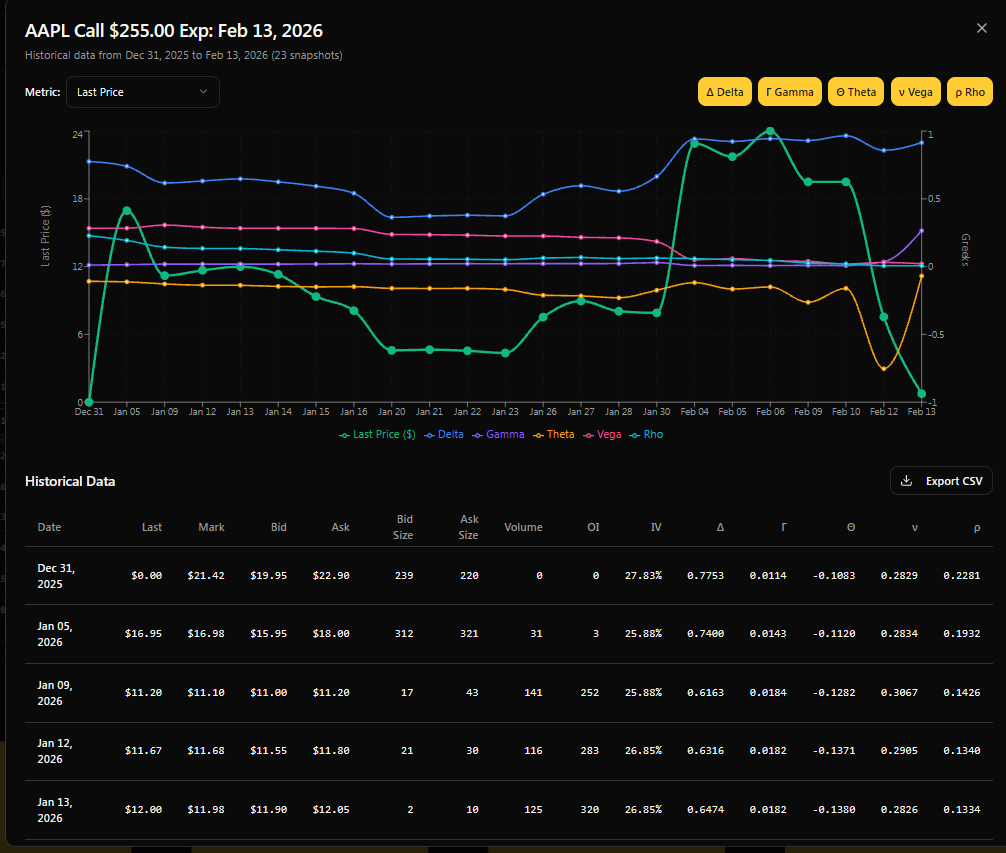
GNG options charting
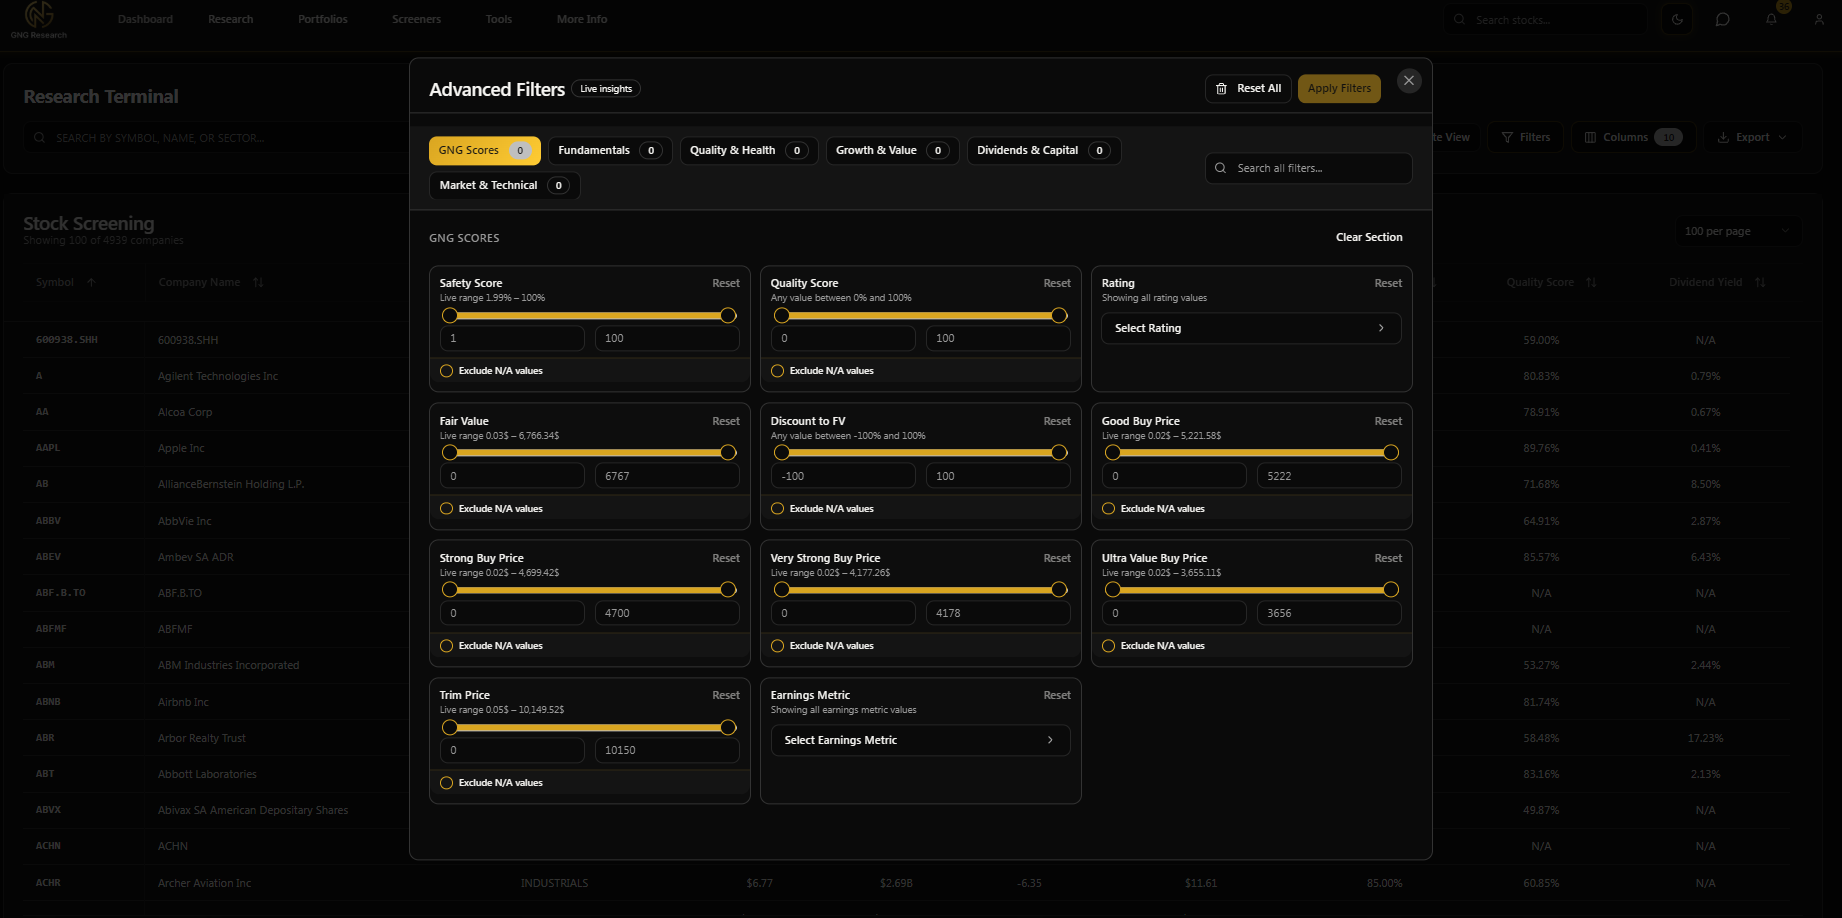
Research Terminal Updates
I made some small adjustments to the research terminal to hopefully make it more usable and a better experience for all members. First things first, I have altered the filters and columns menus to try to consolidate so we didn't have as many data option groups. As you can see below, there are now six options from GNG scores, fundamentals, quality and health, growth and value, dividends and capital, and market and technical. Each of these contains a subset of data and filters specific to the title. If you don't want to look through all 150+ columns for that specific data point, please use the global search bar. For example, if I was looking for dividend-specific metrics, I would type in div, and they would show up in the section below.
Insider trading Screener
This section gives users the ability to access and query our comprehensive data set when it comes to insider trades. We try to keep the data as fresh as possible. You will see the reported on date.
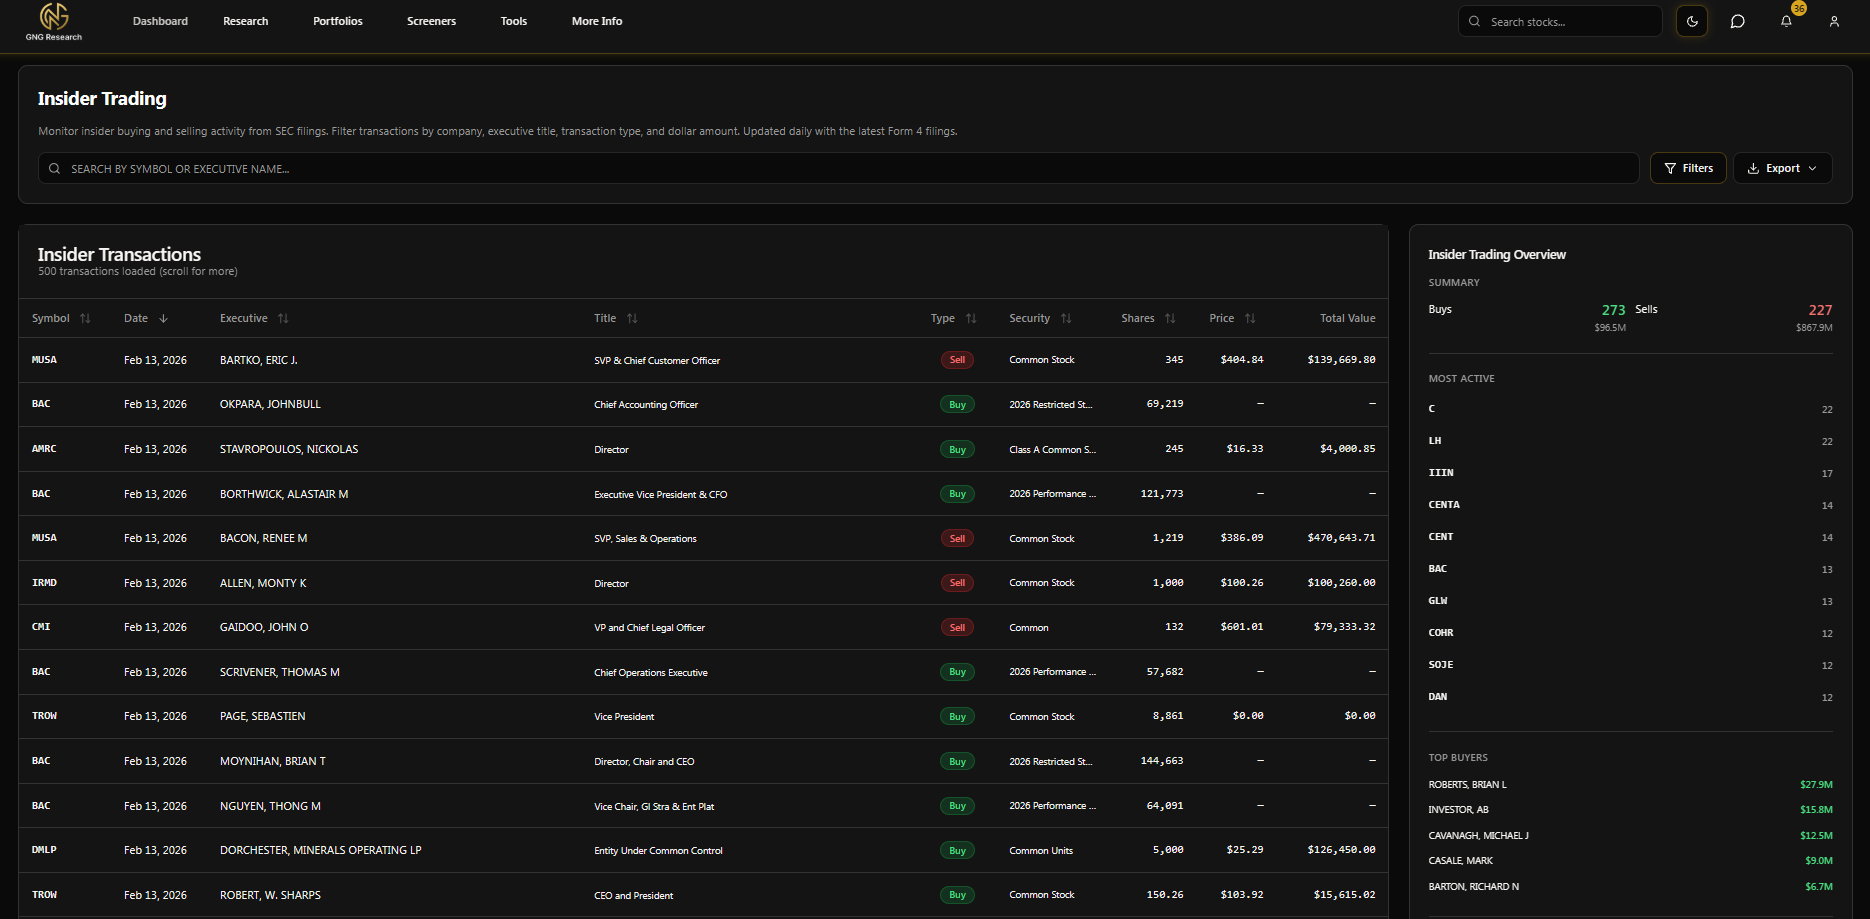
You can use the filters button to query for dates, transactions, titles, Companies (tickers), share price, shares, and total value.
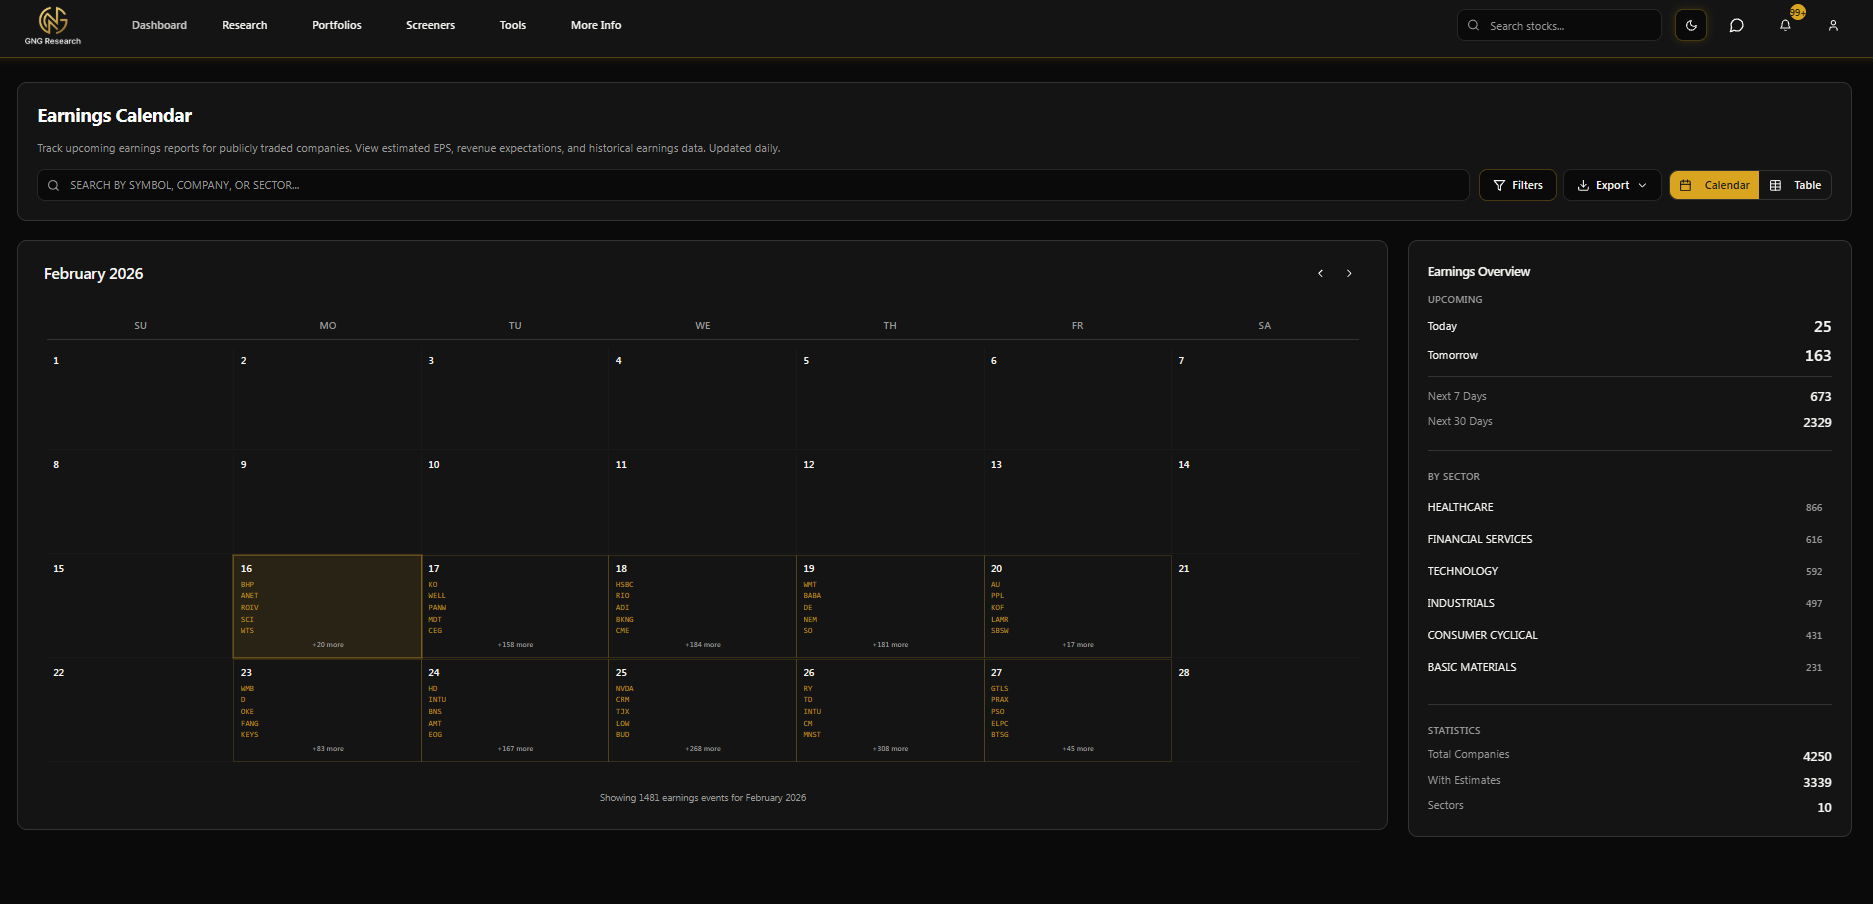
The Earnings Calendar Page
This is more of an honorable mention, but yes, this is a new page on the site. I saw it as a quick win where we already had the data aggregated. Please let me know if you want any more features implemented in this section. The earnings calendar can be found on the earnings calendar page under the screener section in the navigation bar, or simply click here.
Honorable Mentions
I did a complete UI redesign and organization of the navbar. Articles can now be found under the research tab. Just click around and explore, and let me know if you have any questions or feedback.
I redesigned the notifications tab so that all toggles, switches, and triggers are at the top, making it seamlessly easy to use on any device.
I redesigned pretty much all of the tool pages, giving them adequate sidebars with useful information.
Every tool where you enter an input now has a history section that allows you to go through and see what you've done in the past. Additionally, the Monte Carlo section has the compare feature where you can look at how different portfolios contrast.
Road Map
My next priority will be to seamlessly integrate our AI suite when it comes to these three options.
AI Scheduled portfolio reports. (1-2 weeks)
Our AI chat suite is fully and seamlessly integrated to our database using a vectorized database. It is able to communicate to you exactly what readings we have, so that you don't have to go through the trouble of searching, comparing, et cetera. (2-3 Months)
Our company reports AI, which will be generated on demand or incrementally (i.e., daily, every six hours), giving you the most fresh and updated report on every stock in our database, including:
any earnings transcripts
announcements
peer comparison news
swift price movements
technical changes
insider transaction
The list goes on. (1-2 months)
I'm proud to announce that within the next few months, our iOS app will be live, and additionally, our Android app is coming soon after. This will make the GNG experience seamless for everybody on the go.
I'll be adding alerts to both watch lists and portfolios some time after the two integrations above.
Well, I don't wanna spoil everything, so I'll keep the other tooling and stuff to myself for now, but it's going to be a very exciting year. The best part is that most of you are grandfathered in; your rate will never change.
But on a company level, I will share that we are looking into ways to externally market this more. If any of you guys have an expertise or any ideas, I would very much so appreciate it, because, like I said on day one, transparency will be key here. All these new features, compute, and tooling are going to cost money.
The good news is that the compute costs are scalable. Meaning, right now, it won't be entirely expensive, and your plans obviously include the cost, since we knew this was coming.
Another Connor Incoming..
I'm officially hiring another developer full time beginning on March 15th. I will have him do an introduction article, even though it's not really his thing. He will be helping me handle the day to day from tickets and bugs, and letting me concentrate more on the important stuff, such as growth and business operations.
I don't want to get too ahead of myself in terms of setting expectations, but I'm really hoping that pretty soon here we'll be able to move twice as fast. Upon hiring more people and keeping the ball rolling, we can deliver you the most quality and valuable product possible while keeping prices the same and our main mission morally aligned.
Thank You All!
As a lot of you know, I recently got married to my lovely wife. Life has been crazy, and I just want to finish this article by saying how much we all appreciate the support that you guys offer us. We know we are changing lives through educating people for better investing, but I hope you all can see that even more so, you changed our lives, giving us the freedom to wake up and do what we love every day. On behalf of the GNG team, Again, thank you. I can't say it enough.
I know this may seem confusing as of right now, but don't worry. I'm excited to announce that I'm officially starting my video tutorial sprint! I will be doing a video per different tool or feature that we offer to explain the full use and capabilities. I will publish these as articles, and then they will be saved under the Getting Started page and include a video and step-by-step instructions.
PS..
I wrote this article in about half an hour, mainly using voice voice to text. If anything seems like it has a weird pronunciation or I look like an idiot in spelling errors, please let me know down below so I can go through and fix it. ;)