
Just an update on the government shutdown that I discussed in yesterday’s report.

Real-time GDP Growth is down from 2.16% last week and 2.54% 2-weeks ago. Over 2 weeks, the shutdown is expected to slow growth by about 0.3%. It's showing up in the data.

Growth is likely to be 1.8% to 1.9% next week, which will put us into the growth scare zone according to Charles Schwab’s Chief Equity Strategist, Liz Ann Saunders.
Right now, betting markets are estimating a 41-day shutdown, so that would be through growth of 1.6% to 1.8% if they are correct.
1.7% was the lowest of the year, and 1.6% is the lowest growth seen in the past year.

The 1.23% real-time GDP growth rate was the weakest since the Pandemic, so if we go below that (in about 4 to 8 weeks of shutdown), then stocks are likely to be in a 10% to 15% correction.
If the shutdown lasts another 11 to 22 weeks, we’ll likely be in a negative growth environment.
Mind you, a mild recession (2001 was -0.2% GDP decline) is not the end of the world, though it will likely feel that way for many.

This is the biggest earnings week of the season, with Meta, Microsoft, and Alphabet announcing after the bell on Wednesday and Amazon and Apple (and Visa) announcing on Thursday.
Big tech earnings week is often a time of intense price volatility like this.

My preliminary take.
FRACK YES! Amazon blows the cover off the ball! Beats across the board, upper end of the analyst range, guidance above consensus, and AWS growth back over 20% due to AI. Other than announcing a dividend, I couldn't have asked for more!
I don’t expect a dividend until Amazon’s cash pile surpasses Apple’s at $250 billion —the largest in history —and they can’t use growth spending as an excuse to start paying a dividend.
Here me now, quote me later: Amazon will announce a dividend by the end of 2030… or there will be riots in the streets, and cities will burn.😉

$336 billion in net cash by the end of 2030….If true, here me now, quote me later, Amazon will announce a dividend by the end of 2030…or there will be riots in the streets and cities will burn.😉


I wanted to take this opportunity to showcase some of the most surprising facts about the AI boom, which can provide context and calm amid headlines that scream, “Meta's $70B AI spending spree triggers $155B stock plunge.”
Ignore The Price Action And Watch The Fundamentals

Meta beat on revenue by 3% and earnings by 8%, and increased its capex guidance, and then announced
"We expect the set of investments we're making within our ads and organic engagement initiatives next year will enable us to continue to deliver strong revenue growth in 2026…CapEx dollar growth will be notably larger in 2026 than in 2025. We also anticipate total expenses will grow at a significantly faster percentage rate than in 2025, with growth primarily driven by infrastructure costs.” CFO Susan Li
Investors might be worried about Mark Zuckerberg’s earlier comment about spending too much on AI.
“If we end up misspending a couple hundred billion dollars, that’s going to be very unfortunate obviously. But I would say the risk is higher on the other side. If you build too slowly, and superintelligence is possible in three years but you built [as if] it would be there in five years, then you’re out of position on what I think is going to be the most important technology that enables the most new products and innovation and value creation in history.”
During its quarterly earnings call, Jensen Huang, CEO of Nvidia, mentioned $3 to $4 trillion in hyperscaler spending by 2030. Analysts thought he meant cumulative spend.

That was the basis for the first $1 trillion 2030 sales forecast on Wall Street, from New Street Research’s Pierre Ferrague.

That $1 trillion sales target appears to be an extrapolation from the 60% to 70% of spending share that Jensen said goes into a 1GW data center ($50 to $60 billion cost).
Right now, about 45% of Nvidia's sales are from hyperscalers
$4 trillion over 5 years = $800 billion in annual spending.
$520 billion going to Nvidia from 5 hyperscalers alone
So $1 trillion (ish) potential sales in 2030
Of course, with 71 analysts covering Nvidia, the optimistic forecast of one analyst hardly warrants excitement. While not all analysts are willing to forecast Nvidia’s 2030 sales, here is the current FactSet median consensus.

Remember that due to Nvidia’s odd January fiscal year, what it considers 2031 is what the world calls 2030.
$208 billion in sales is the consensus for 2025, and the sales estimates are likely to keep rising if Nvidia’s recent chart is to be believed.

If that chart is right, NVDA has the potential to grow sales, earnings, and FCF by 13X in 5 years.
And that means the price could be 15X, and it would be 100% justified by fundamentals.
Not saying it will happen, just saying that's what the chart says.
Jensen's chart...from his latest presentation😉
Ride or die with the techno wizard of Denny's🤣
*by which I mean a 12.5% allocation to NVDA through 2030 or until the facts change.
Remember my meme about “Welcome to the age of AI”?

We live in a world where the numbers are so large and crazy sounding that even quoting Jensen Huang, the most successful CEO in the history of capitalism, makes me sound like Cathie Wood😉

And it’s not just Nvidia expecting 40% growth in AI infrastructure spending, it’s also IDC, Citigroup, and Morgan Stanley.
$4 trillion in annual spending is potentially as much as $2.8 trillion in Nvidia sales in 2030, so you can see why analysts are likely to slowly and carefully keep raising their forecasts over time.
Few are willing to step out on a ledge and say something as crazy sounding as New Street’s “$1 trillion in 2030 sales for Nvidia,” even though the actual potential is now as high as $2.8 trillion.
Sam Altman announced spending plans totaling $2.2 trillion, with “more deals coming soon.”
He sounds crazy announcing his plans, and I sound almost as crazy if I simply add up (after fact-checking) the combined costs of all of his announced deals.

$2 trillion in deals, and so far, OpenAI has raised $71 billion, with plans to borrow hundreds of billions on top of the largest IPO in history.

OpenAI has said they expect US GDP to rise 5% over 3 years just from their AI spending, which is mathematically accurate.

In fact, $2 trillion over 4 years, or $500 billion per year, is nearly as much as the $600 billion in capex from hyperscalers in 2025… every year, from one company!
Genius Or Madness: A Little Bit Of Both - Alternative Financing
Recently, a GNG member told me he was worried about circular deal flow.

There are two essential things to remember about these kinds of deals.
First, this kind of alternative financing is innovative and worth understanding the risks, BUT it’s not necessarily a sign of a bubble.
GMAC was the financing arm of GM, created to finance cars and dealerships, and by the late 1910s, its loan book accounted for about 1.5% of US GDP.
Remember that Sam Altman is trying to fund $2 trillion in growth projects over 4 years.
And Morgan Stanley, Citi, IDC, and Nvidia are expecting around $4 trillion in AI spending in 2030 alone.
The US government spends around $650 billion per year on infrastructure and R&D.
In other words, each of the hyperscalers is like its own large country.
Let’s consider Amazon as an example.


$300 billion in growth spending from Amazon in 2031 vs $650 billion for the entire US government!
Amazon’s growth spending in 2031 is expected to rank 4th globally, behind the US, the EU, and China.
Yes, Amazon’s growth spending will soon rival entire continents like Europe!
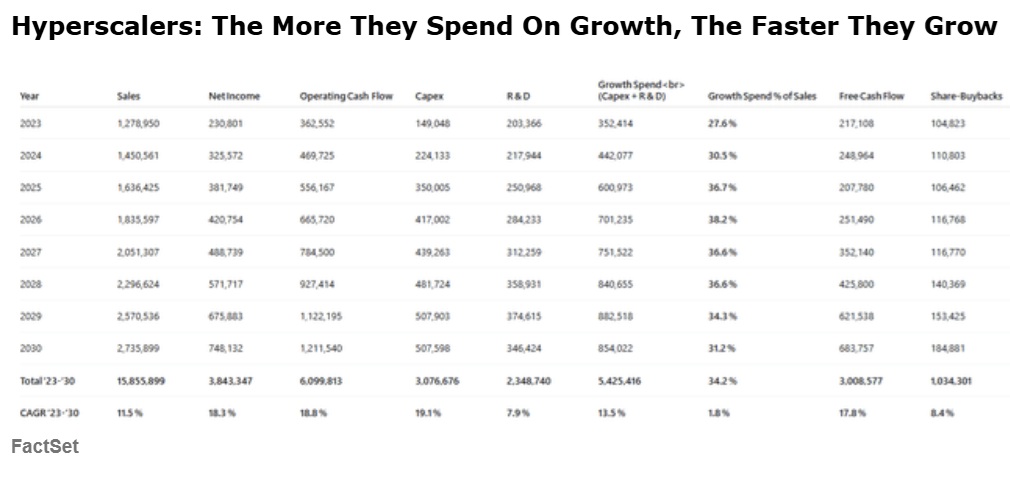
This was the FactSet consensus for hyperscalers before earnings (and all those OpenAI deals).
$5.4 trillion in cumulative R&D and capex spending from 2023 through 2030. Crazy! But these companies are, so far, spending MORE than capex estimates (which keep going up).
And yet, despite spending an average of $680 billion per year, free cash flow is expected to grow at 18% (and FCF/share 19% to 20% due to buybacks!)
AND now in 2030 we’re potentially looking at $4 TRILLION….PER YEAR! In Spending?!
These numbers sound absolutely insane! And the alternative financing deals? They are necessary because the hyperscalers are spending more on growth than the US, EU, or China.
And within a few years, they will be spending more on growth than the US, EU, or China….COMBINED! EACH YEAR!
Assuming these consensus numbers come true, of course.
Why This Isn’t (Yet) An AI Bubble
$4 trillion in spending is 11.4% of % current 2030 GDP estimates of $35 trillion.
That’s an 11.4% GDP boost if true.
We’ve never seen stimulus spending outside of wartime exceed Japan’s 8.5% of GDP effort in 1995.
So if these numbers are accurate, we’re in for the most substantial economic growth ever recorded.
How on earth is this NOT a bubble?!
Isn’t vendor financing what blew up the stock market and economy in 2000?
Fact 1: This is Free Cash Flow Financed
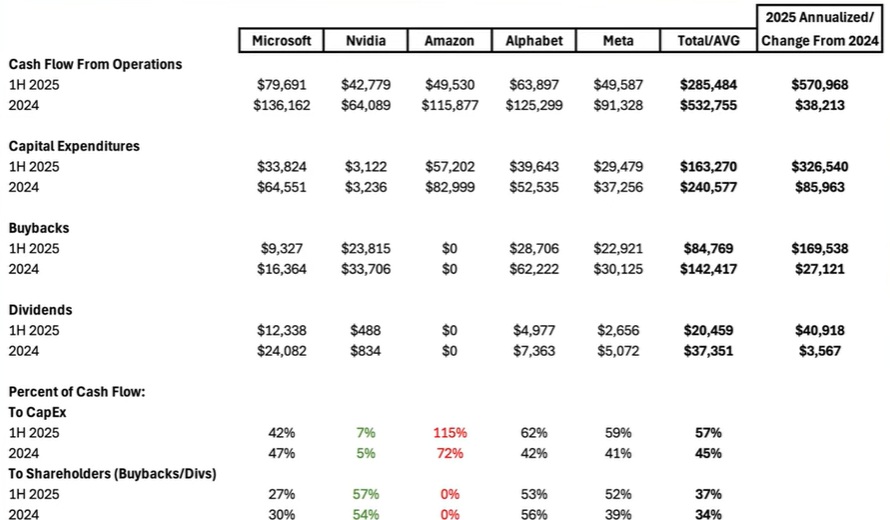
The hyperscalers are generating almost $600 billion in free cash flow AFTER spending on growth at an annualized rate of $650 billion (and Microsoft just raised quarterly growth capex from $22 billion to $30 billion!).
Buybacks? $170 billion of them in the first half of 2025 or $340 billion annualized.
Dividends? $41 billion or $82 billion annualized.
Profit growth? 19% to 20% CAGR FCF/share growth isn’t good enough?
Where’s the profitability in AI spending?
Alphabet just reported 22% operating profit growth.

In the last 25 years, the hyperscalers (other than Amazon, which is trying to maximize growth) have averaged about 20% free cash flow returns on invested capital. And that’s about what they have averaged since ChatGPT kicked off the AI boom.
Demand is so high that new data centers are at full utilization as soon as they come online, with Amazon CEO Andy Jassy noting that “as fast as we put the capacity in, it’s being consumed” Azeem Azhar & Nathan Warren
Growth in demand for AI is around 50% CAGR, according to Jensen Huang and the IEA’s estimates.
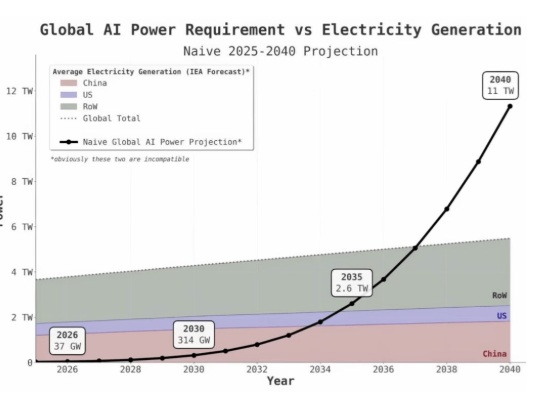
Of course, these forecasts might prove false, and other estimates of demand growth aren’t as high.

Revenue: What Makes It All Work

AI sales growth is currently around 500% for this year (Anthropic has been growing at 10X since 2023 and expects to do it again this year, approximately).
Morgan Stanley estimates 2025 AI sales at $153 billion, growing at 122% to approximately $1 trillion in 2028.

During the final year of the railroad bubble —22% revenue growth —the telecom bubble? 16%.
Right now, we’re looking at triple-digit sales growth over the next few years and potentially close to $2 trillion in AI revenue by 2030.

The Most Important Fact About The AI Boom: Hyperscaler Spending Is NOT Speculative
Remember what Andy Jassy said about “as fast as we put the capacity in, it’s being consumed”?
Azure and Google Cloud just reported growth of 34% and 39%, respectively, and that was capped by limited AI-enabled data center capacity.
Amazon has said the same; they would be growing faster if they had more capacity.
In other words, there is zero speculative about hyperscaler spending right now, at least outside of Oracle (because OpenAI might not exist to pay that $300 billion).
It’s all contracted revenue. Remember how Enterprise Products Partners won’t build a new NGL fractionation plant without 15 years of 100% capacity under contract?
Well, that’s the same for AI datacenter demand.
Every single watt of compute Microsoft can build is spoken for before construction is complete.
As long as demand grows faster than supply, the backlog of AI demand grows larger, and the longer the AI boom lasts, the larger that backlog grows.
In other words, as long as everyone is supply-constrained, everyone charges full price, and returns are strong (20% cash returns on invested capital and 18% CAGR in free cash flow growth despite unbelievable growth spending).

Remember, hyperscalers are expected to generate 19% to 20% CAGR free cash flow growth through 2030 BECAUSE of (not despite) this growth spending.
Microsoft Capex Spending & Cash Flow Consensus 1 Day After Earnings

And keep in mind, these estimates keep going up. Microsoft isn’t being reckless; this is nothing like the telecom bubble, where companies were going public and rising 600% in a day on no plans to generate sales, much less free cash flow.
What is OpenAI doing? Anthropic? XAI?
Yes, that’s very speculative.
What are Alphabet, Microsoft, Nvidia, and Amazon doing?
Or even Meta?
They have the free cash flow to pay for this, and they are fully booked. Their profitability on these projects is not in question, because they would not be raising growth spending if they weren’t still supply-constrained.
So the bottom line on the AI boom?
The “crazy” numbers keep getting crazier.
They aren’t actually crazy, since these companies are generating 20% cash return on invested capital and growing cash flow per share around 20%.
Any and all spending when supply is constrained is, by definition, not speculative (capacity is sold as soon as it becomes available).
The revenue growth from AI services is currently running 6X to 8X faster than the railroad or telecom bubble (through 2028, 30X faster than the telecom bubble)
No matter how “crazy” numbers might seem, IF they are justified by fundamentals (like free cash flow), they are true.
If these facts change, I will change my mind and tell you.
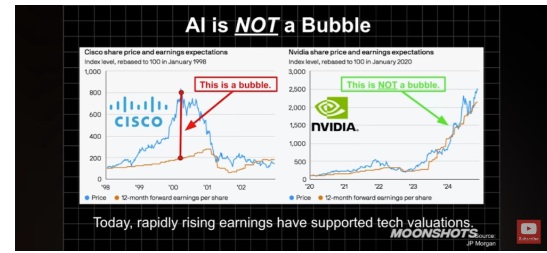
A bubble is not big numbers; it's not stocks going up.
It's when stocks go up because the valuation multiples rise to levels not supported by fundamentals.
If fundamentals go up 16X, like NVDA's FCF, and the price is up 16X, that's not a bubble.
My Promise To You: When The Facts Change, I Change My Mind
There are lots of speculative things going on right now, including quantum stocks reaching 371X sales recently, meme stocks, and of course, all manner of non-profitable tech stock mania.
There are lots of dangerous debt deals going on, and if the AI boom becomes a bubble, disconnected from cash flow, I will point it out.
I constantly check the most reliable sources to ensure my facts and reasoning are correct.
My only loyalty is to the truth, because that is how I stay loyal to you, and to my family, who are relying on the success of ZEUS and GNG Research to achieve our dreams.
And you can trust me, because I’m not just a data nerd, I’m also a Star Trek geek😉

PEGY Analysis Company Updates
I have promised GNG Research members that I would update and upgrade the Master List, which includes about 100 to 150 DK members connecting to their personal portfolio trackers.
GNG’s portfolio tracker is coming soon.
But we don’t want to take away a valuable tool that many members like.
Thus, PEGY analyses using FactSet data in every article (except special reports).
So, starting with the requests from members (please remember I have to get through all 500 companies, so I can only take requests for companies that haven't been updated yet).
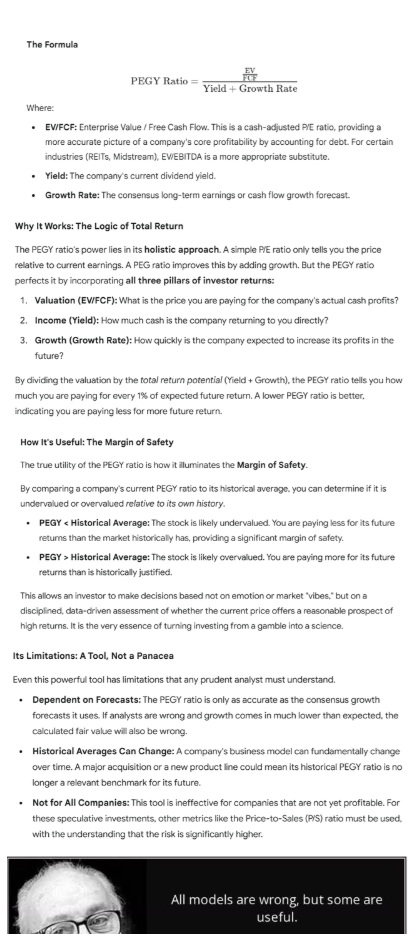
And for those that don’t know what the PEGY ratio is.
Roper Technologies (ROP) PEGY Analysis

This is a very interesting member request based on the 52-week low list. Let’s take a look at whether Roper Technologies, one of my favorite dividend aristocrats no one has ever heard of, is a value trap, or a potential Buffett-like “fat pitch”.

Here is Morningstar with a brief summary of earnings (which is what triggered the big collapse).

OK, so Roper is growing at 13%. How does that compare to what’s priced in? Is it a good deal?

For 14 years, Roper grew at 10% to 11% and traded at a premium 27X EV/FCF.
Its historical median PEG ratio of over 4 tells us how high-margin and high-quality this company is —basically a software conglomerate like a modern Berkshire (but with a 33-year dividend growth streak).

Most importantly, right now, the consensus is for 13.6% FCF/share growth, which matches the 13% sales growth management is now guiding for.
Historically, ROP is priced for 8% growth, far below the 13.6% expected.
That means it’s about 40% historically undervalued, relative to its growth and balance sheet, and offers significant upside potential.
If you believe Roper can grow at least 8%, you’re not overpaying if you buy today.
And if you believe it can keep growing at the current rate, it potentially offers returns like this.
PEGY Adjusted Total Return Potential

Non-Growth Adjusted Total Return Potential
And for those who want to be more conservative and not adjust for growth, here’s what that looks like.

Union Pacific (UNP) PEGY Analysis


As a fundamental quant, looking at these charts makes me think UNP was in a significant bubble, which led to the 35% bear market, followed by a lack of new record highs.

The short-term growth rate is expected to be modestly slower than over the last 14 years, BUT now that UNP has had time to work off its excessive valuation… is it a good deal?
Let’s turn to the PEGY analysis to find out.

UNP is a historically high PEGY stock because of the capital-intensive nature of railroads.
The PE is below its historical norm, BUT the growth rate is also significantly lower, so it actually appears to be pricing in 7% growth vs. the 6% expected, thus an 11% overvaluation.
UNP is a hold, something you only see when adjusting for balance sheet and growth, as you can see in the PEGY and traditional FAST Graphs.
Non-Growth Adjusted Total Return Potential (Just PE vs Historical PE)

Growth Adjusted Total Return Potential (PEGY vs Historical PEGY)

PEGY analysis indicates that UNP might spend another 2 years in the wilderness, trading flat (for a total of 5 years of flat returns).
If that happens, the PE vs historical PE analysis would leave you disappointed and thinking that maybe UNP was becoming a coiled spring. Actually, it was just reverting to a lower PEGY fair value PE.
Remember that the PEGY fair value is not arbitrary; it’s based on the last 14 years of valuation metrics.
Basically, it means that, based on how investors have valued UNP in the past, the current growth rate justifies a 15.6 PE, which is lower than normal but consistent with its pre-2013 PE ratio.
Abbot Labs (ABT) PEGY Analysis

About 33% of the S&P is in a bear market, and ABT is in a mild correction. Let’s take a look at how much of that is justified.

Abott historically grows at 8% and trades at 25X EV/FCF (a high premium for a great company).
And today it’s priced for that same 8% historical growth, but growth is expected to be about 25% faster through 2030 than it was over the last 14 years.
Which means that it’s actually around 19% undervalued, factoring in the 10% correction.
The 23 median PE over 14 years would lead you to think it’s fairly valued, but if it grows 25% faster than before, it might have additional upside beyond what the PE alone is showing.
Non-Growth Adjusted Total Return Potential (PE vs Historical PE)

The regular PE analysis makes you think that ABT is overvalued and has no upside return potential over the next 2 years.
Growth Adjusted Total Return Potential (PEGY vs Historical PEGY)

When ABT was growing faster, you could see how the PE suddenly traded around 27X. If it can continue growing at a steady 10% (the next 3-year consensus), it might actually have 40% return potential over the next two years.
If that happens, and people wonder “how did an overvalued ABT pull off 17% CAGR returns! It’s in a bubble!” Actually, that would be 100% justified by fundamentals.
PEGY valuation is sensitive to growth rates, and if ABT’s growth outlook falls, its PEGY will rise.
PEGY always assumes that the current expected growth rate will be stable over time.
One of the limitations of the model.
Reinsurance Group of America (RGA) PEGY Analysis


RGA is significantly undervalued as you’d expect from a stock trading at 7.5X earnings.
The growth rate has not fallen below historical norms, indicating that it’s currently priced for 5% growth while it’s expected to grow 7%.
That might not seem like a big difference, and in the long term, returns of 8% to 9% are expected, BUT take a look at the potential returns on offer from RGA.
Non-Growth Adjusted Total Return Potential (PEG vs Historical PE)

Growth Adjusted Total Return Potential (PEGY vs Historical PEGY)

In this case, the PEGY is just confirming what is obviously an undervalued blue chip, and we can see it’s not a likely “cheap for a reason” value trap.