Today’s special report is focused on the big picture.
I have 5 appointments and meetings today, so I have an undefined amount of time to accomplish this report.
The goal is to cover the most important 3 aspects that investors need to know at any given time to stay sane, calm, and rational whenever the headlines get scary, and things like this happen.
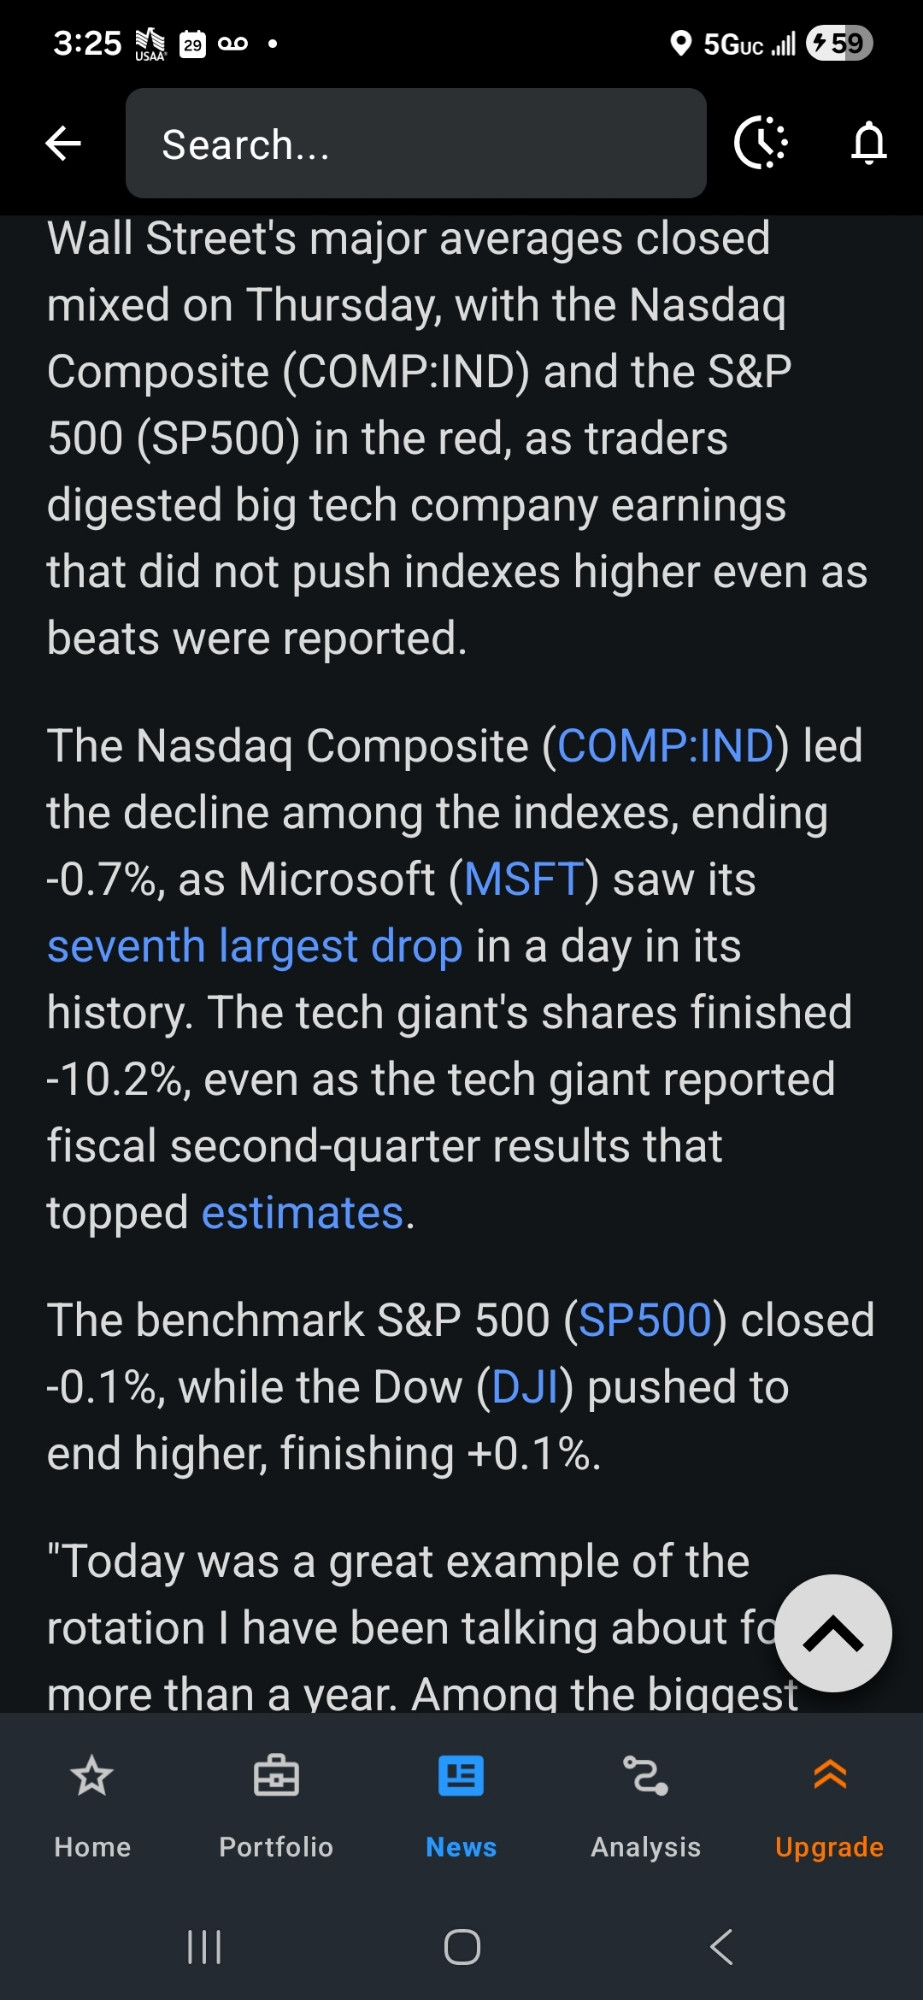
Microsoft Drops 10% In A Day (After reporting GREAT results)
So let’s review the 3 things that investors always have to know.
The Holy Trinity Of The Big Picture
GDP Growth (determines whether a correction is V-shaped)
corporate profit growth (97% of long-term returns)
market valuations
GDP Growth
Remember the reason that GDP growth is so important.
Yes Or No: Is GDP Growth Negative? If not, V-shaped correction
Also remember what Liz Anne Saunder’s (Chief Equity Strategist at Schwab)’s research team discovered. If GDP growth is below 2%, there is a potential for a “growth scare” correction.
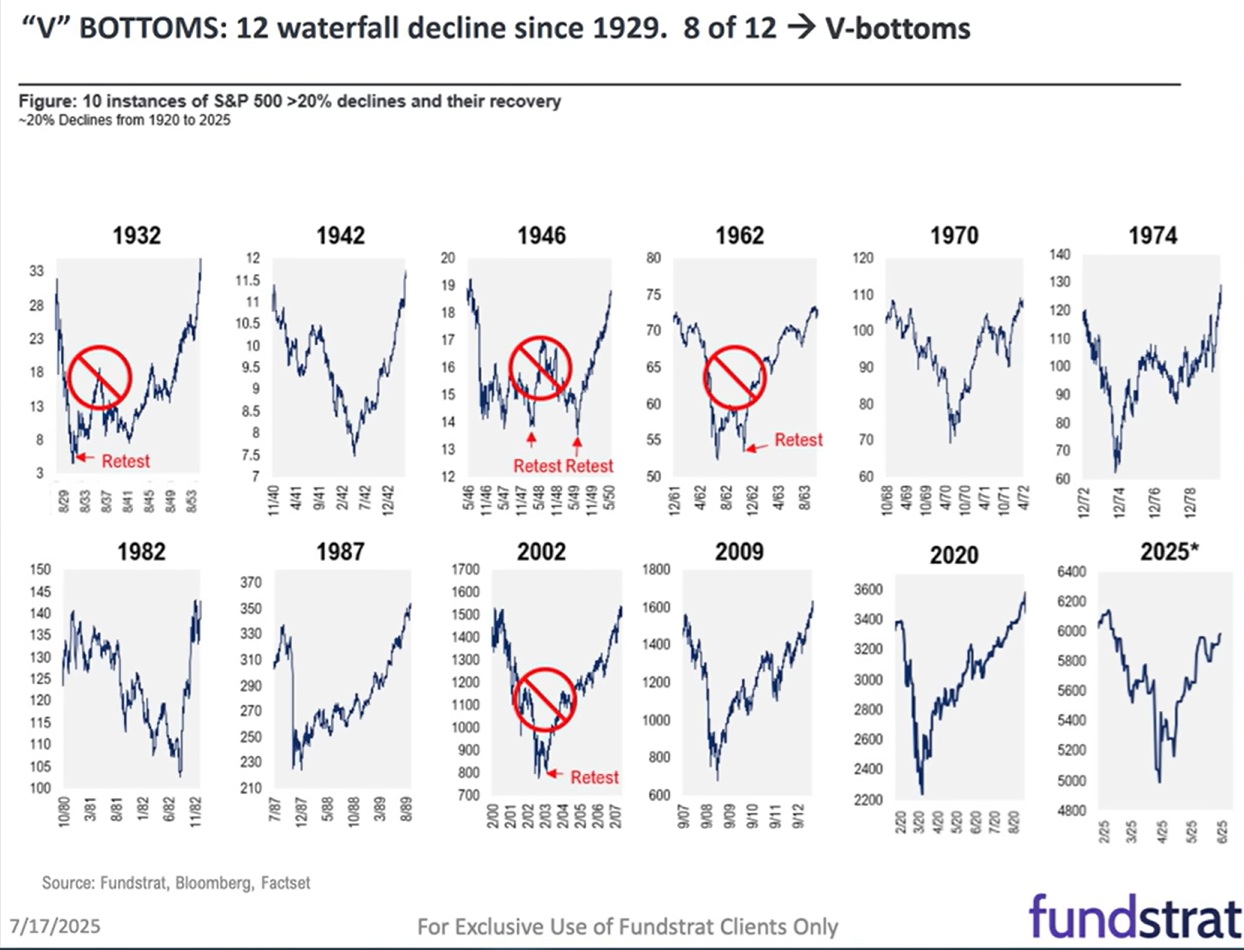
10% to 15% corrections are normal and average 1 everry 6 months since 2020
Once every 6.2 months since March 2009 lows.
Whether or not a 10% to 15% correction becomes a 15% to 20% “growth scare correction” (like 2022 and 2025) depends on whether growth is above or below 2% and what direction it’s trending.
2022: -28% growth scare bear market (would have been a recession except for AI boom kicking off)
April 2025: Trade war crisis bear market (-21% peak decline)
Dec 2018 was also a growth scare correction (-21% intra-day bottom).
March 2020 (Pandemic) was a growth scrare (2 month recession) but strongest recovery in history ($9 trillion in stimulus)
1.4X to 1.7X is the recovery time to new record highs.
If stocks fall 2 months from peak to trough, then on average, 3 months later, new record highs (if there is no recession).
2 months from April 7th trough to new record highs this time.
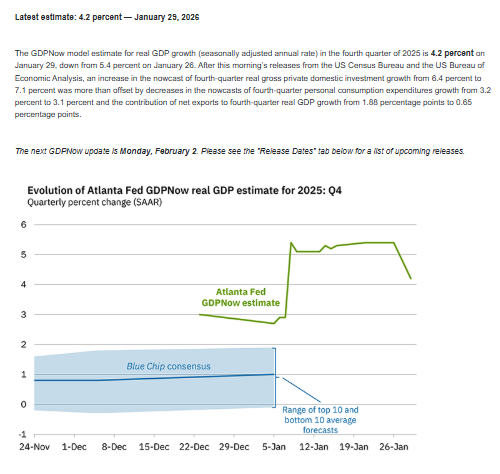
February 20th is when the first estimate of Q4 GDP Growth Comes Out
The government shutdown created havoc with data (we didn’t get Q3 estimates until the start of January), and hopefully, we avoid another shutdown (because if there is one, we don’t get Q4 or Q1 estimates, and the ATL and NY Fed will be working with incomplete data).
According to the Congressional Budget Office, a shutdown is 95% temporary damage.
-0.25% GDP growth (for that quarter) per week of shutdown.
95% reversed after the government reopens and everyone gets back pay.
The 5% damage is due to Contractors (6 million of them) not getting back pay.
The Atlanta Fed has been the most accurate at estimating growth since the Pandemic triggered a return to historical GDP growth.
3.3% median GDP growth since 2021.
3.2% average.
Since 1913 US GDP growth has averaged 3.0%
It appears that US growth is back to its 112-year normal levels.
Economists currently believe that 1.9% is trend growth, above this creates inflation, and therefore the Fed would slam on the brakes through rate hikes, and that’s why 2% growth is everyone’s base-case.
3.3% average inflation since 1913 vs 3.0% inflation-adjusted GDP growth (GDP growth is always adjusted for inflation).
In other words, each 1% growth fuels 1% inflation. So if the Fed says “2% inflation target,” then “2% is OK growth above this, the Fed has to hit the brakes by raising rates”.
However, I would argue that if US growth has been 3% for 112 years, and inflation 3.3%, then today’s inflation rate (3% officially) is normal, healthy, and let’s stop pretending that 2% is some sacred inflation rate handed down by God as part of the 10 commandments. 😉
The 2% inflation target used by almost all OECD countries was created by New Zealand in 1994.
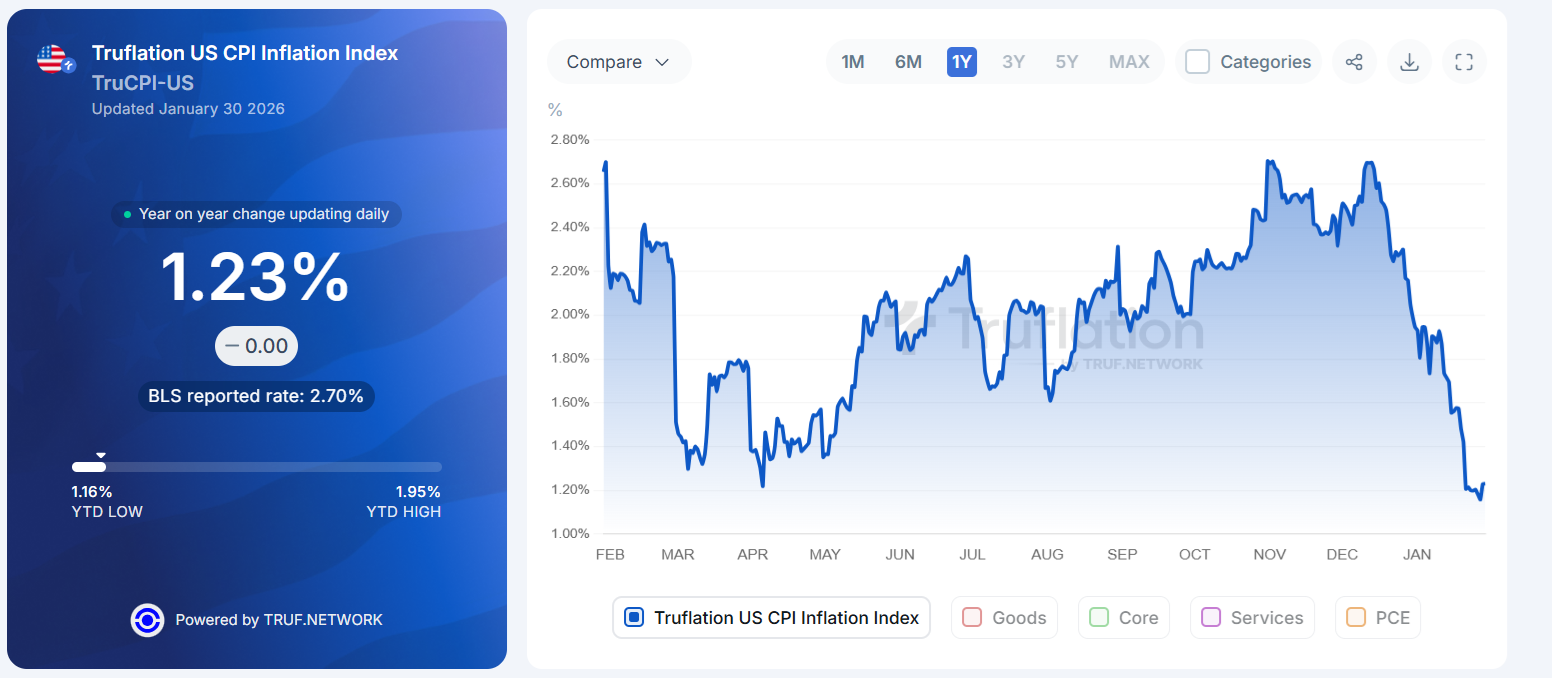
18 Million Daily Prices Show That Inflation Is Not A Problem
Historical inflation-adjusted (since 1929) Fed Funds Rate: 0.4%
Today’s real-time historically optimal Fed Fund rate: 1.63%
Fed estimates 0% to 1% is “neutral” (0.5% mid-range consistent with historical average).
3.63% Fed Fund Rate -1.23% real time inflation = 2.4% (historically at 2.5% financial crises occur)
So the Fed is using slow and lagging data, and it is much too high.
OK, so me and Charlie Bilello may have a Canadian Style chart beef over monetary policy (he believes that the Fed should have left rates at 5.33% until average inflation since 2020 was 2%), but it doesn’t matter what I think or what Charlie thinks (the academic and historical evidence says I’m right😉) but here’s what the Fed is actually going to do.
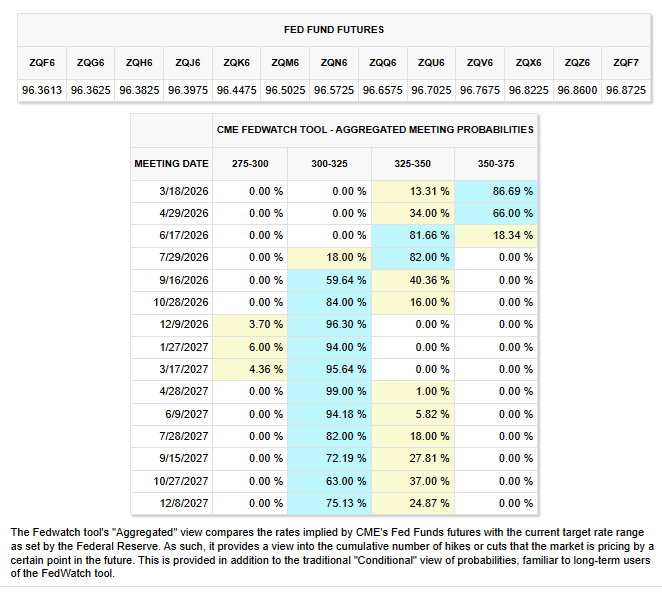
The bond market is pricing in 3.13% long-term Fed funds rate, with the current rate-cutting cycle ending in September 2026 (it began in September 2024).
3.13% long-term Fed funds rate - 2% long-term inflation = 1.13% real Fed funds rate.
Vs 0% to 1% long-term range.
Tighter than is historically optimal (I have several studies confirming this)
BUT Also not dangerous (2.5+% real rates are dangerous).
Some Good News About The Economy And Inflation
GDP growth over the long-term = labor force growth rate (historically workers, but soon robots) + productivity growth (defined as output per worker (soon to include robots).
If GDP growth is 6% and productivity growth is 1%, then inflation is going to be around 5%.
Government spending on infrastructure (or anything) can boost growth, but if productivity is weak, then the spending will stoke inflation.
If there is slack in the system, then stimulus boosts growth but not inflation.
If there is no slack, k, then a stimulus boosts inflation.
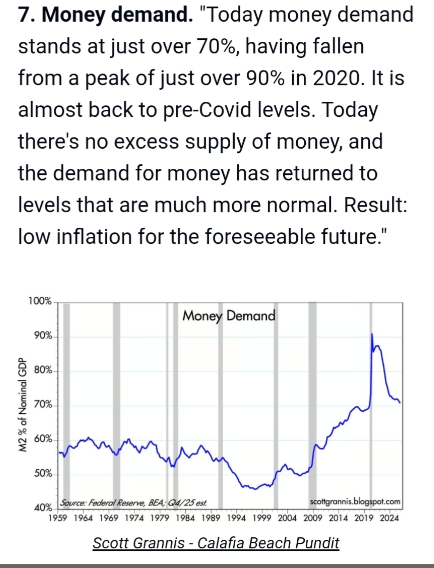
Post-pandemic, we had supply chain disruption AND $9 trillion in stimulus (thus 28% inflation within 2.5 years).
11.6% peak real-time inflation on June 16th, 2022.
9.2% official CPI peak inflation.
The decline in inflation to 1.2% might hold, or we might fall slightly below 1%.
Zero inflation is not a good thing.
It means parts of the economy (more of them) will be in recession.
2% to 4% GDP growth and 2% to 4% inflation have historically been the sweet spot for American prosperity and worker happiness.
If inflation were to fall to 0%, for example, then it would mean the economy (parts of it) would be in recession, and the Fed would be 2.8% too tight.
80% of job openings are at small businesses.
The rate-sensitive ones who borrow money.
Big companies have net cash (more cash than debt) and collect “risk-free” interest from the US government.
Big companies LIKE higher rates because it means their moats get wider.
Small companies can’t compete when rates are high, but big companies mint cash (Berkshire, too).
Back to GDP Growth
Where Is The St. Louis Fed Nowcast?
The true econ geeks amongst you might be wondering, “Didn’t you use to report the St. Louis Fed nowcast”? If you are one of those geeks, congratulations on really great memory😉.
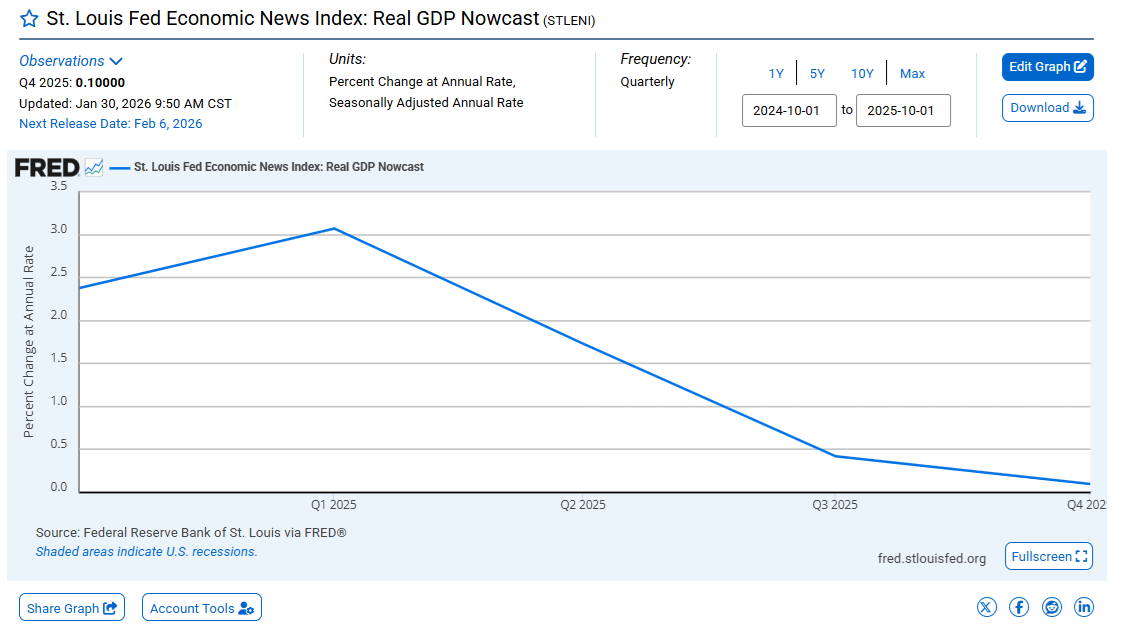
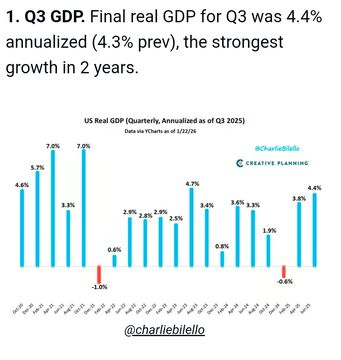
I’m not looking at the St. Louis Fed nowcast because it’s unreliable. Q3 growth was 4.4%, and it was reporting 0.5% with weakening growth.
This is a broken model, and that’s why we’re ignoring it (even the pearl-clutching blue-chip consensus is 1.2% and rising each week).
Some people don’t trust the Atlanta Fed (their model is most accurate but volatile), so let’s take a look at the NY Fed (which updates every Friday at 11:30 AM EST).
New York Fed: The Stat Geek’s Favorite Nowcast 😉.
Because stat geeks love probability curves.
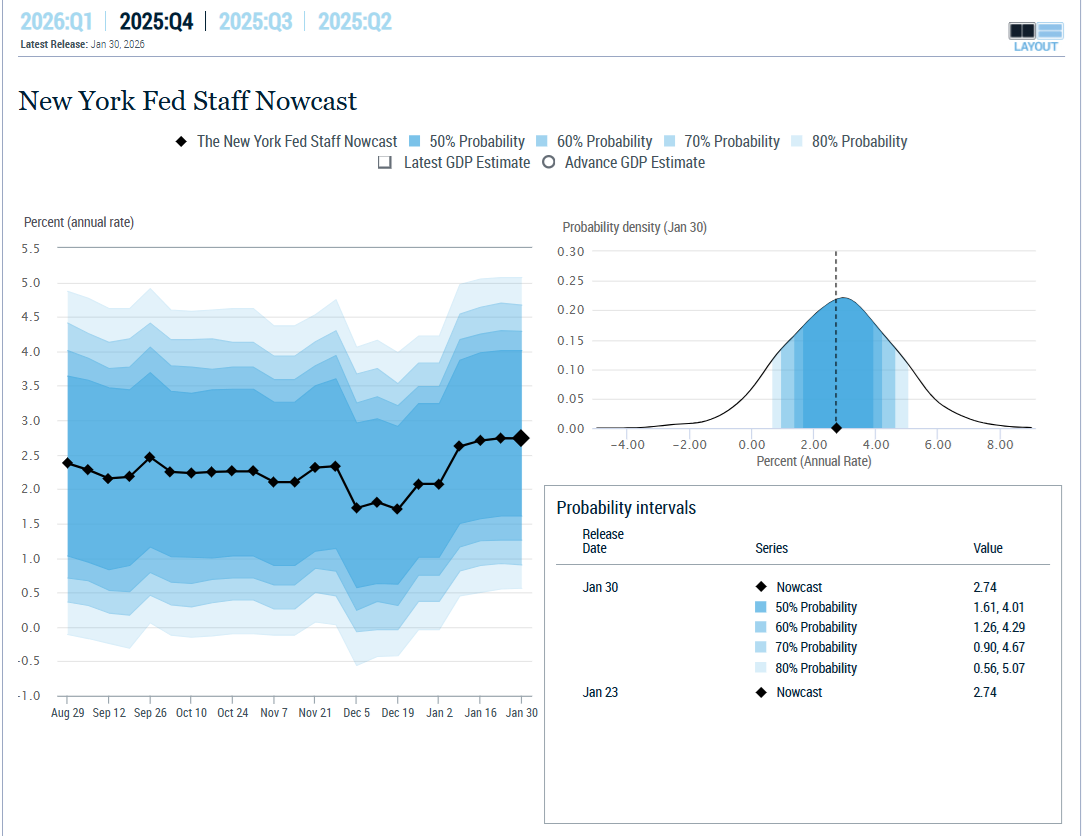
I love the probability curves the NY Fed provides, and also the overall probability ranges. All of economics, finance, and life is probability curves. Therefore, this is the most honest real-time GDP forecasting model.
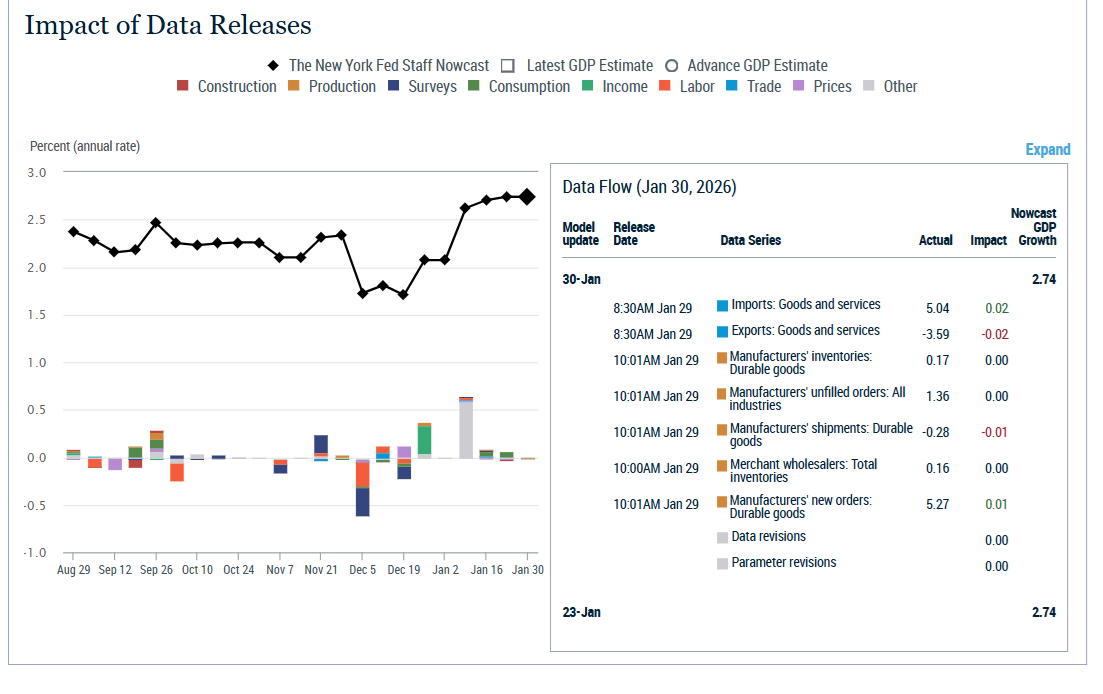
You can also see how each report changes the estimates.
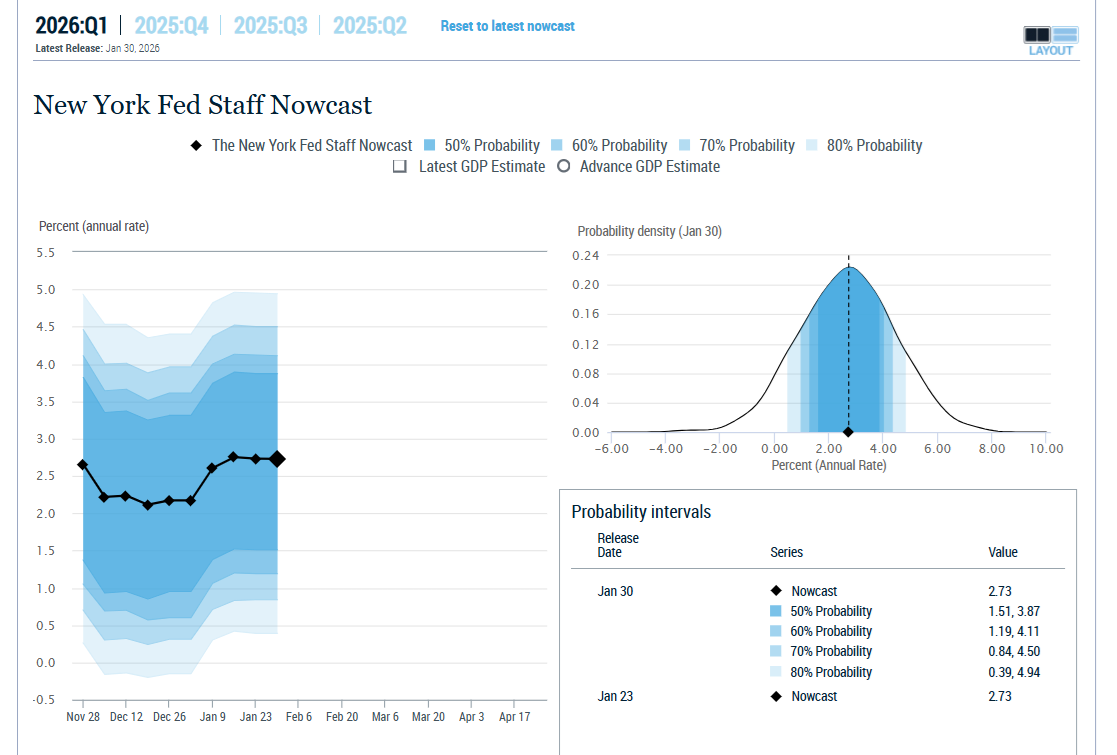
The NY Fed also provides a real-time (current-quarter) estimate after the first week of the new quarter.
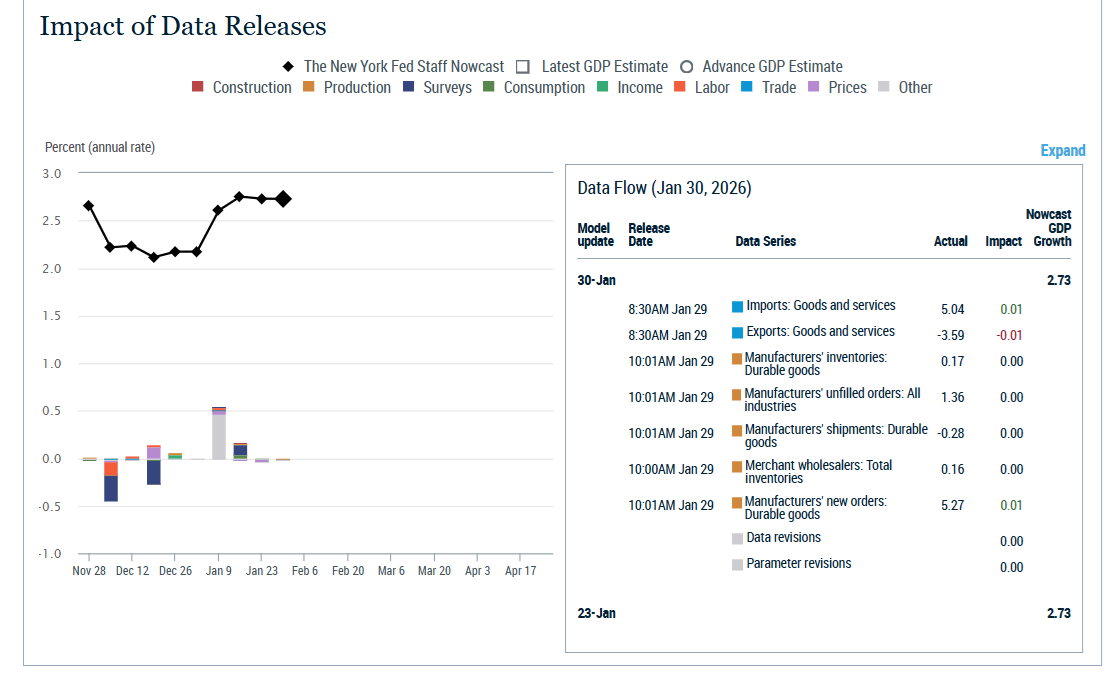
OK, but aren’t these estimates based on 1 month laggin reports? Including many, which are sentiment surveys?
All Hail The Hard-Data Gold Standard Model Of The Dallas Fed!
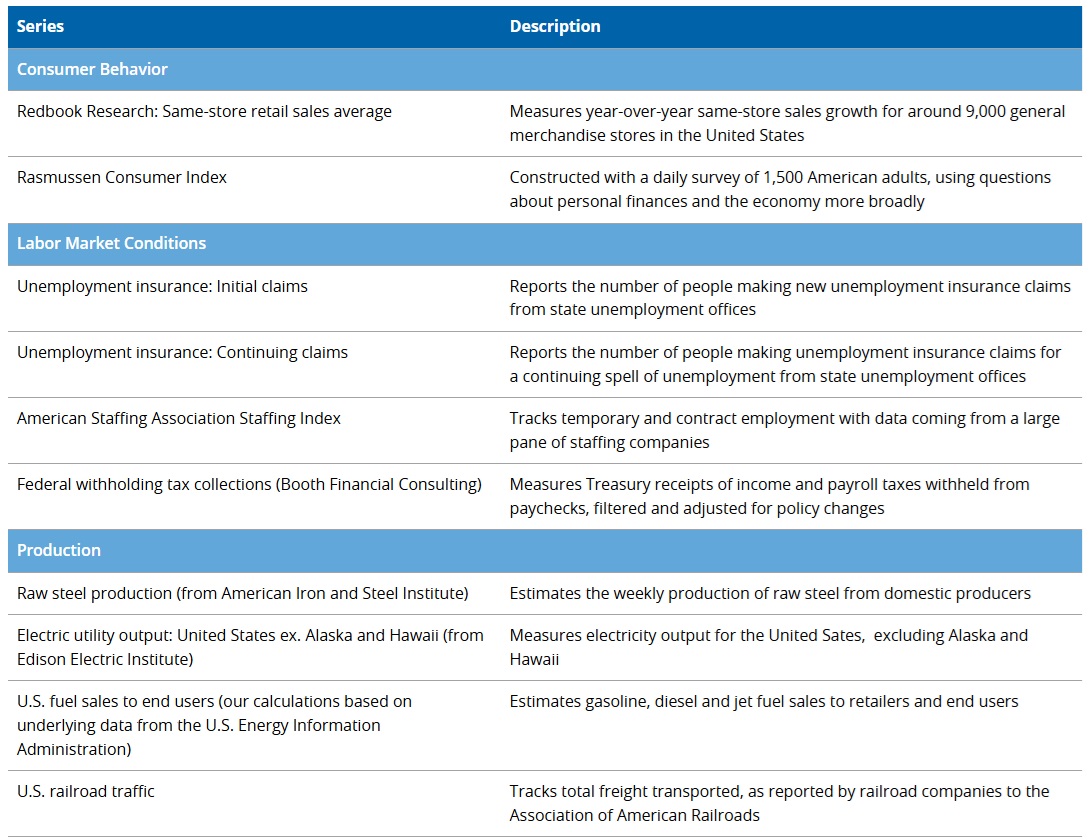
The Dallas Fed created a real-time economic model that has been highly accurate since the Pandemic, based on inputs rather than surveys. Not asking people “are you going to shop more because you’re confident” but “What are you ACTUALLY buying (regardless of how you feel)”.
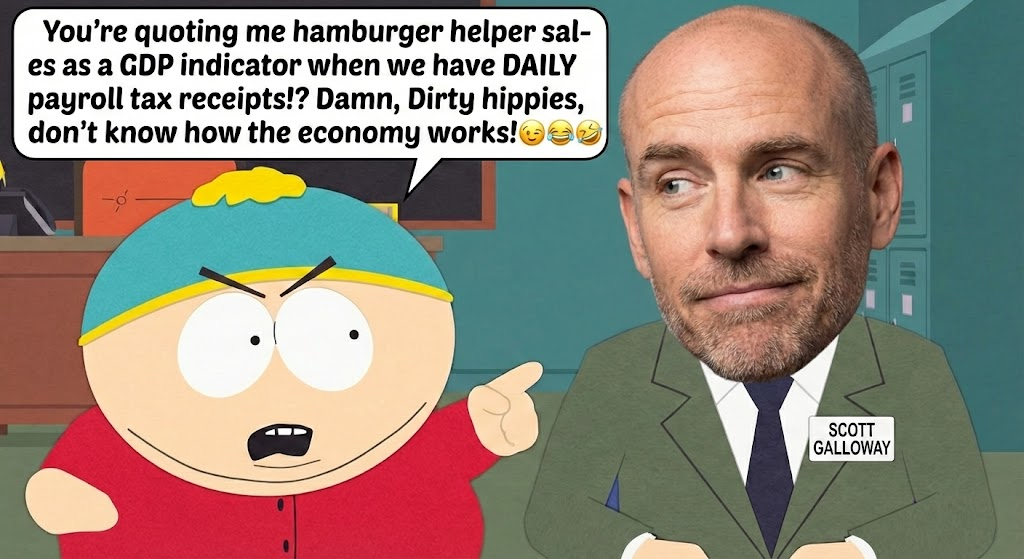
Most importantly, its based on DAILY and WEEKLY data, such as payroll tax receipts (daily) and steel, gasoline, and electricity consumption.
Also, things like trucking volumes and railroad traffic.
So what is the gold standard of real-time GDP growth, say?
Updated every Thursday at 11:30 AM EST.
2.5% growth up from 2.45% last week, so basically stable at 2.5%, which is 0.6% above trend growth.
One reason Jay Powell said, “We’re not in a hurry to cut more.”
I wouldn’t dare dream of Canadian-style chart beefing with anyone at the Fed (it would be impolite to pressure FOMC members to do what I want, as Fed independence is proven to be highly optimal over the long term).
But I respectfully disagree with Powell, since he is looking at Core PCE data (40% of which is owner-equivalent rent, on an 18-month lag).
We now have real-time inflation data from 18 million prices rather than 80,000 monthly prices from official sources.
And if you replace the owner-equivalent rent with real-time housing data (from Zillow and ApartmentList, for example), CPI and Truflation line up almost exactly (98% historical correlation, in fact).
Give me a magic wand, and I would make the Fed Funds rate update daily to match truflation.
1.23% today and 11.6% on June 16th, 2022 (peak inflation).
I may be a dove, but I’m a fact-based dove😉
And I never argue; I only use the Canadian Style Chart for Beef (very politely and tongue-in-cheek, via memes) because there is no room for name-calling in a civilized discussion of public policy.
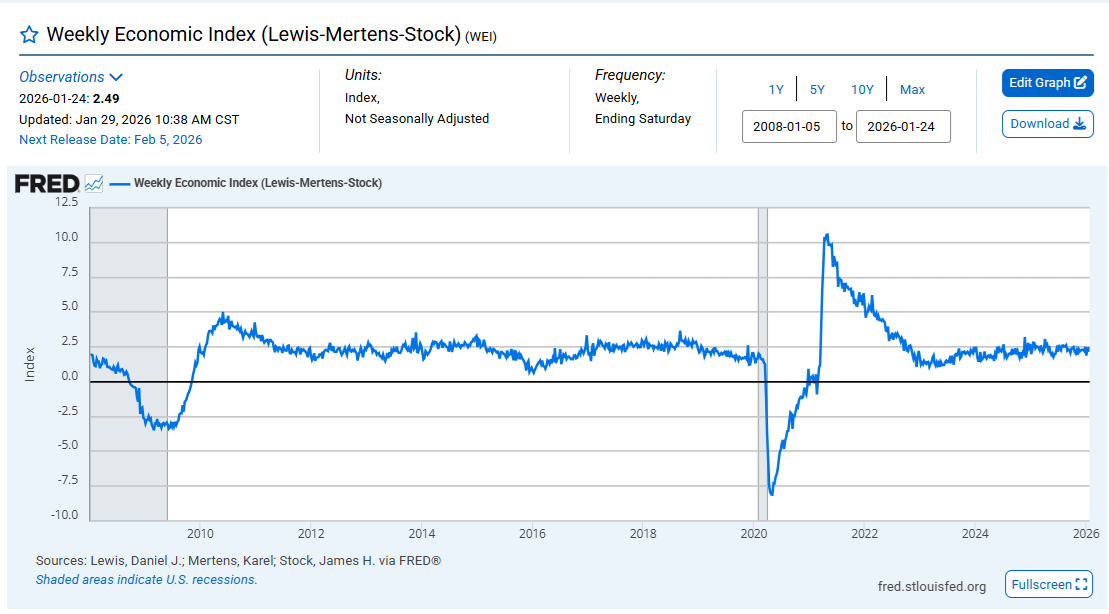
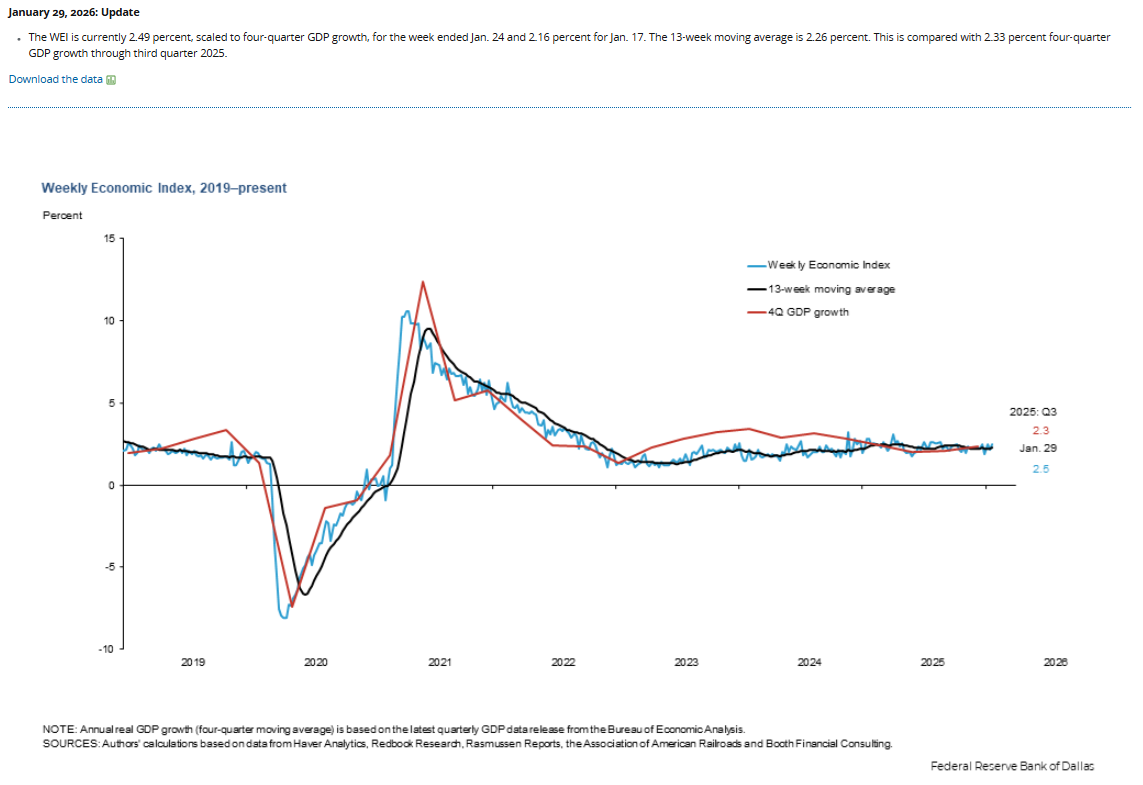
This is why the WEI is so useful. We can get weekly GDP estimates that are very closely correlated to the final official (revised) estimates.
Real Time GDP Over The Past Year
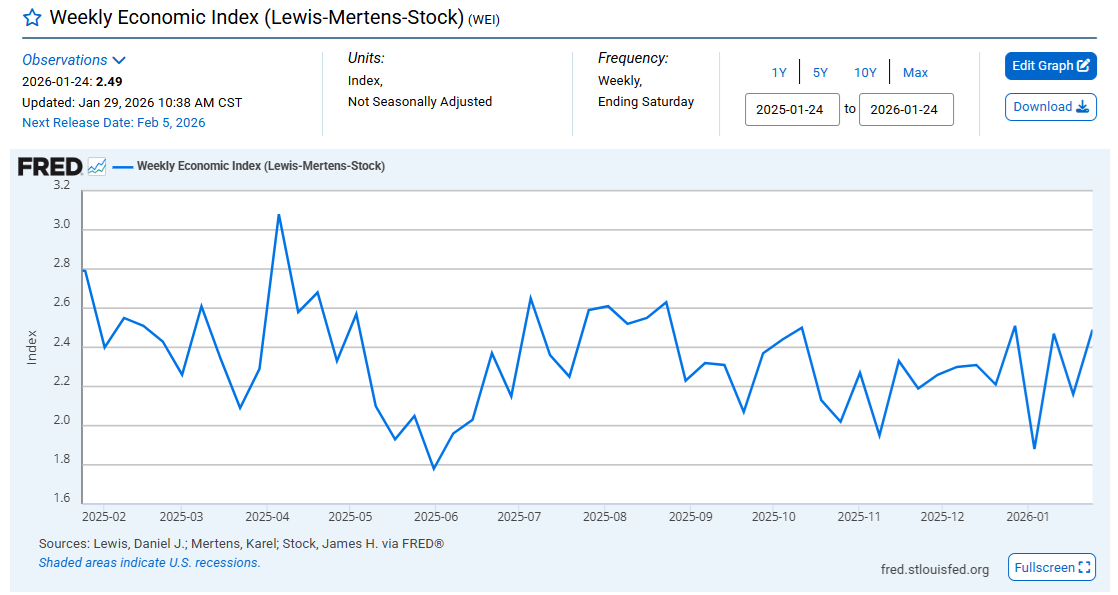
Did the trade war crisis, with the extreme uncertainty, hurt the economy? Sure, by about 1%.
And then we rebounded and are running around 2.5% (which some economists now consider the new baseline growth rate).
Sure, if GDP growth is 2.5% on average over the last 5 years ,it’s prudent to say “Growth rates have accelerated” instead of clutching our pearls and saying “1.8% is trend growth and faster than this raises inflation”.
Look at the real-time data; if your models can’t explain it, adjust your models.

So, the bottom line is the economy is doing really well.
If the Atlanta Fed is correct, then GDP growth in 2025 was 2.9%, about 1% above “trend growth” projections.
Investor Takeaway: 2.5% Stable Growth = Regular 10% to 15% Correction + V-Shaped Recovery
What About The US Dollar?
Some GNG members asked me about the US dollar, which has recently fallen to a 4-year low.
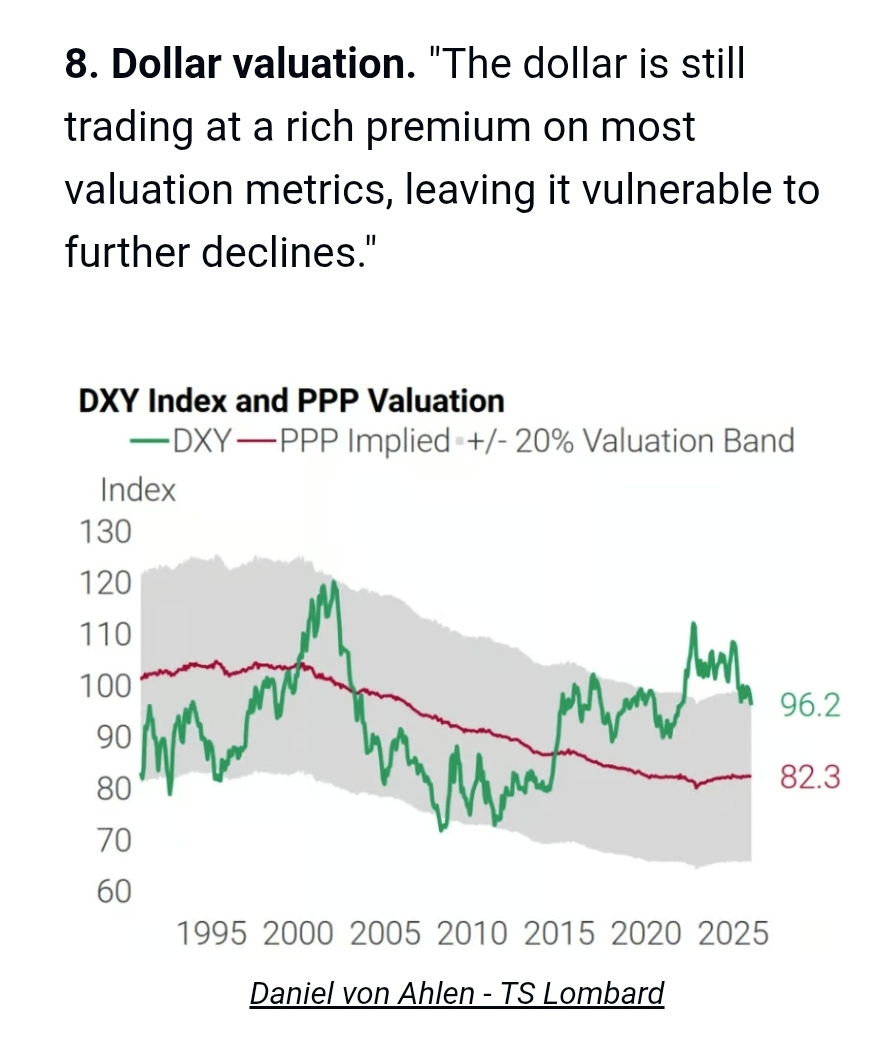
Many people claim the dollar is weak because the world has lost confidence in America. Actually, it’s probably just mean reversion.
I’ve also read people claiming that “Government money printing is debasing the dollar and risking hyperinflation”.
Nope, plausible sounding arguments like “Everything is going up so the dollar must be debasing!” Sorry, it’s just mean reversion.
OK, so how can you protect yourself from a mean-reverting dollar?
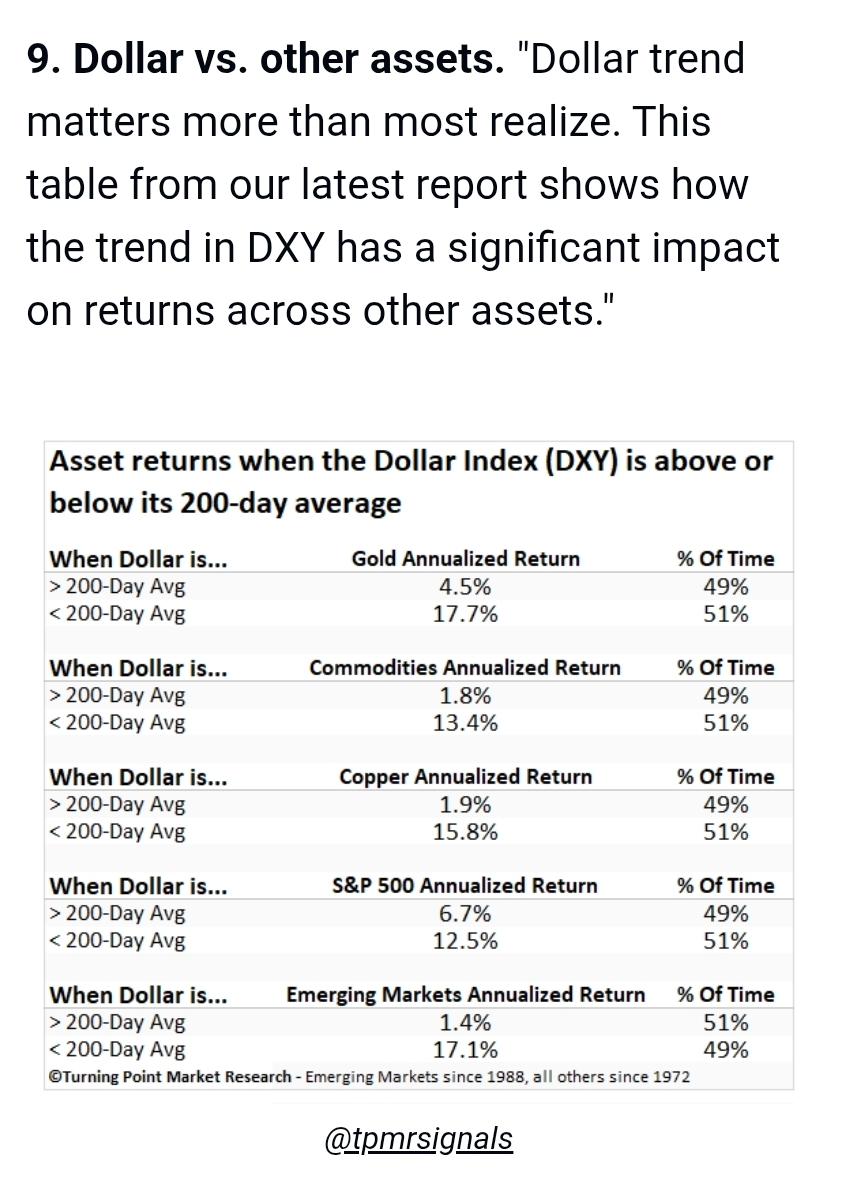
Stocks go up if the dollar falls.
60% of S&P profits are foreign-denominated, so a falling dollar BOOSTS S&P EPS growth.
Foreign stocks go up, commodities go up, pretty much everything does.
So if you are a diversified investor (or just an investor in anything), you are protected from a mean-reverting dollar.
Let’s Hear It For Managed Futures!
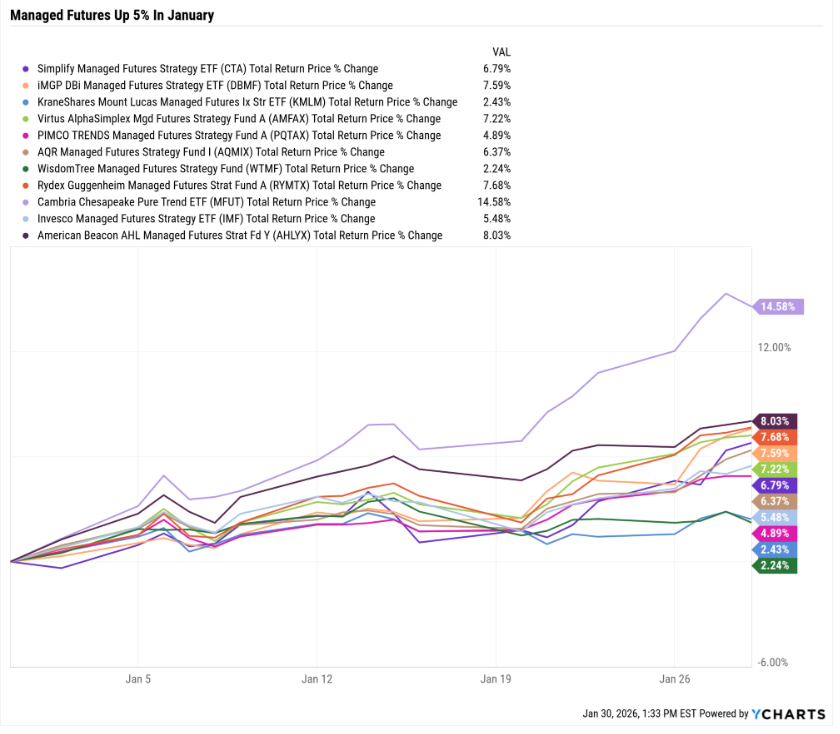
A strong rally in commodities helped managed futures lock onto the trends and set them up for the best year since 2022 (+20% for the Soc Gen CTA index).
So What’s Up With Today’s Bloodbath?
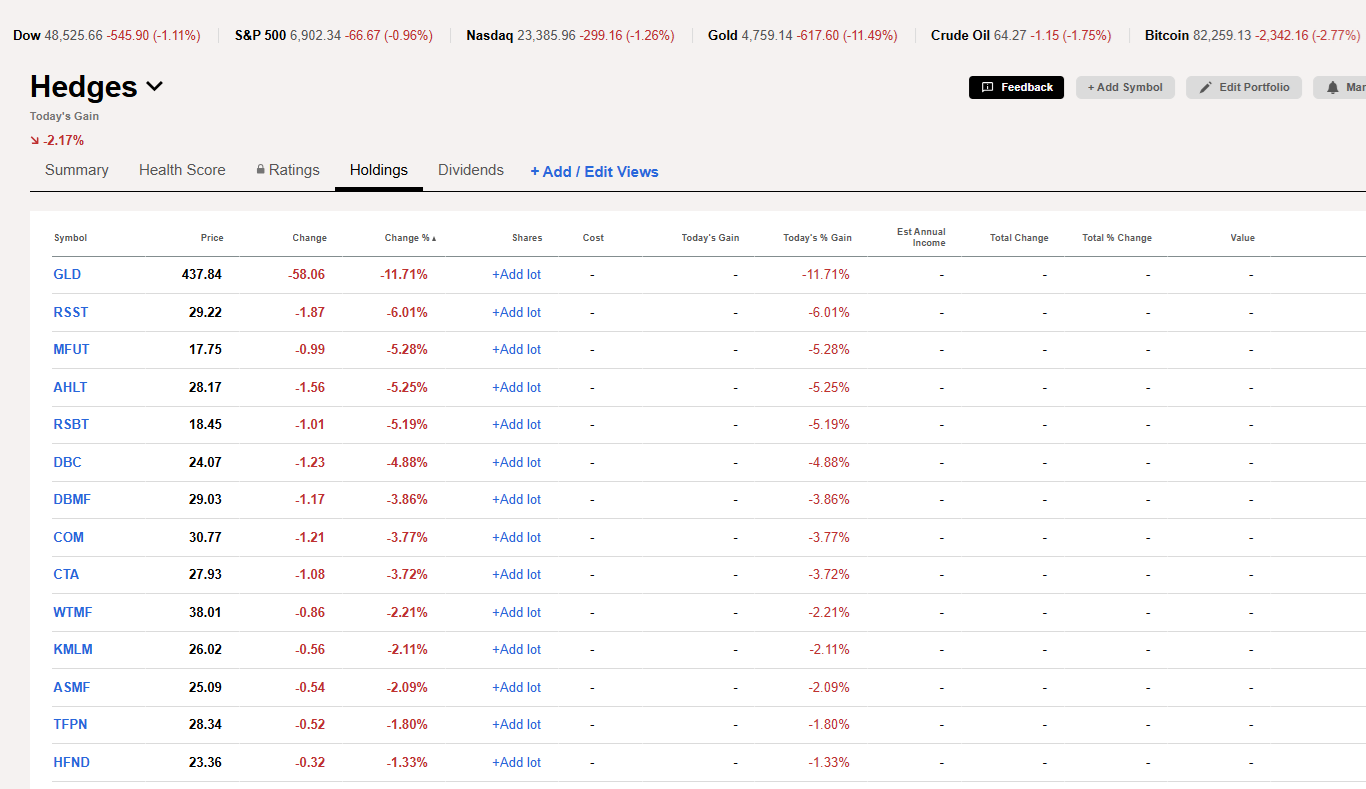
Managed Futures Are Having A VERY Bad day (one of the worst ever) due to a sharp (and historic) bad day for commodities.

Why?
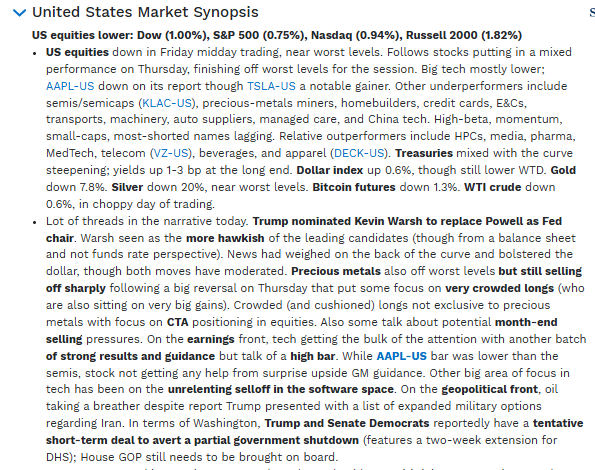
President Trump nominated a slightly more hawkish (on balance sheet only) Fed chairman, and due to extreme positioning, the dollar strengthened and unwound a lot of the recent gains.
I’m guessing that a 20% to 30% decline in some of these metals is an overreaction.
Algo driven.
It’s one of the worst days EVER for many commodities, including a 31% crash in silver prices, 11% decline in Gold, and 23% for Platinum.
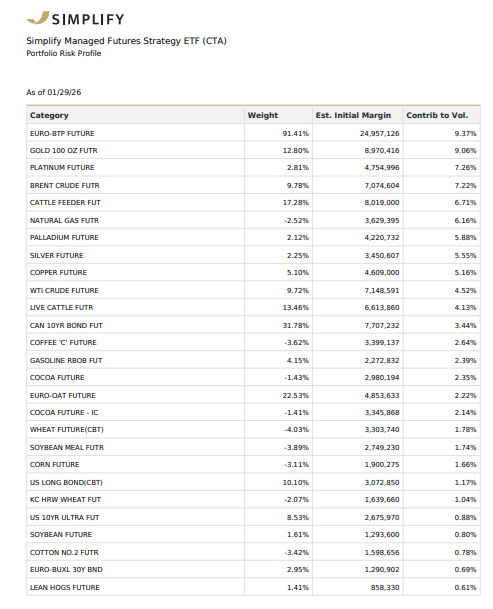
CTA Went Into “Black Friday For Commodities” 23% Long Precious Metals + 6% short Nat Gas (29% of the portfolio REALLY moved against it)
With 30% of the portfolio moving against it, here’s how CTA is performing.
Gold decline: -1%
Silver decline: -1.7%
Platinum Decline: -1.7%
Copper: -0.3%
Nat Gas: -0.36%
These 5 Positions Alone (Commodity Crash): -5.1%
Actual Decline: -3.7%
Other positions (70%) +1.4%
Painful? Yes. But it could have been much worse.
The worst managed futures funds are -6% today.
CTA’s 4 algos have actually been taking profits in gold, platinum, and silver (which peaked at 10% volatility in each) because of the mean reversion algo and option roll yield vs historical yield (valuation) algos, warning about a potential reversal.
Getting 30% Long Precious Metals Wasn’t As Crazy (Or Reckless) As It Seemed
Days like this? They are historic, BUT at the same time, this is why rules-based investing exists. The S&P was up 2% YTD yesterday (Thursday’s close) and managed futures were up 3X as much, with CTA up 3.5X as much, and some managed futures funds (the ones without risk management caps) up as much as 14%.
You don’t get that kind of trend following gain without ignoring “gut feelings” because, as Mr. Pies says, “These trends always go higher and last longer than investors think.”
Context Makes All The Difference
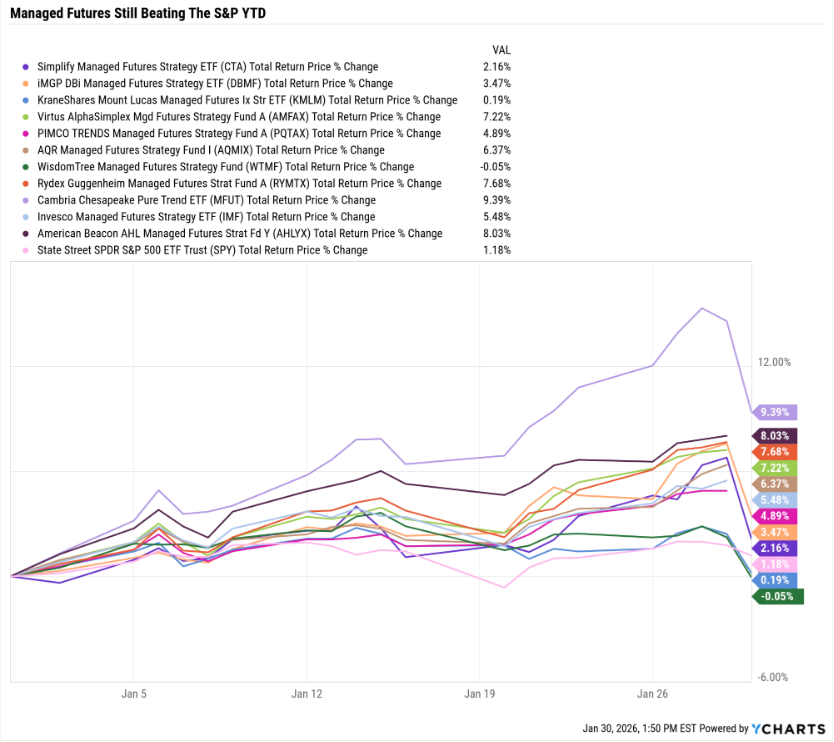
The market is up 1.18% this month.
On track for 14% gain this year (12% consensus) vs 16% GNG Monte Carlo base-case at start of the year.
So…with today’s bad day for stocks? The Math is mathing!
Including Today’s “Unpleasantness” 😉
And what about managed futures? Yes, even those that are down 4% to 6% today are still mostly beating the market.
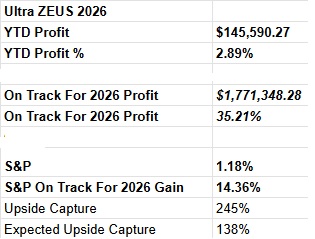
Before today’s $90K decline (ZEUS has fallen as much as $220K in a single day) Ultra ZEUS was up $220K and on track for a $2.4 million gain for the year.
Base-case at the start of the year was 22%
With a $1.1 million profit vs $400K GNG expenses + $200K charitable donations + $100K family support (like my father’s eye surgery).
Or to put it another way?

Everything is on track, just not as nicely as yesterday, before the historic dollar reversal triggered a historic one-day commodity crash.
I’m sure that DailyShot & Daily Chart Book will have some REALLY cool charts putting these crashes in context.
In other words, when things are pretty much going as expected, or slightly better, to freak out over a single bad day (no matter how bad) is illogical, inefficient, and downright ungrateful to the gods of market math😉😂🤣
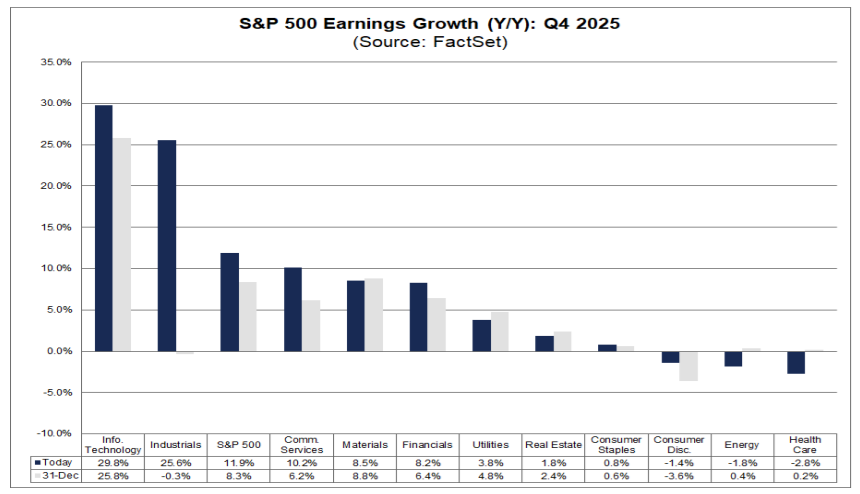
Earnings Update (Macro Only, No Time For Specific Companies Though Microsoft’s 38% cloud growth was INCREDIBLE!)
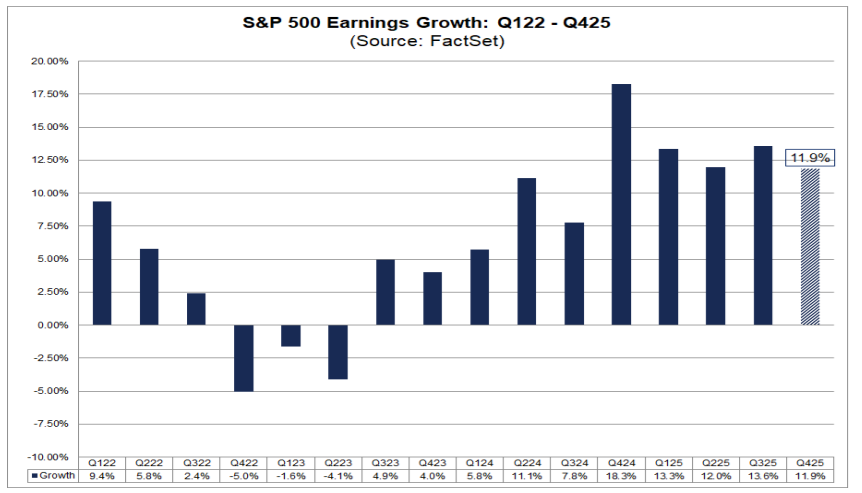
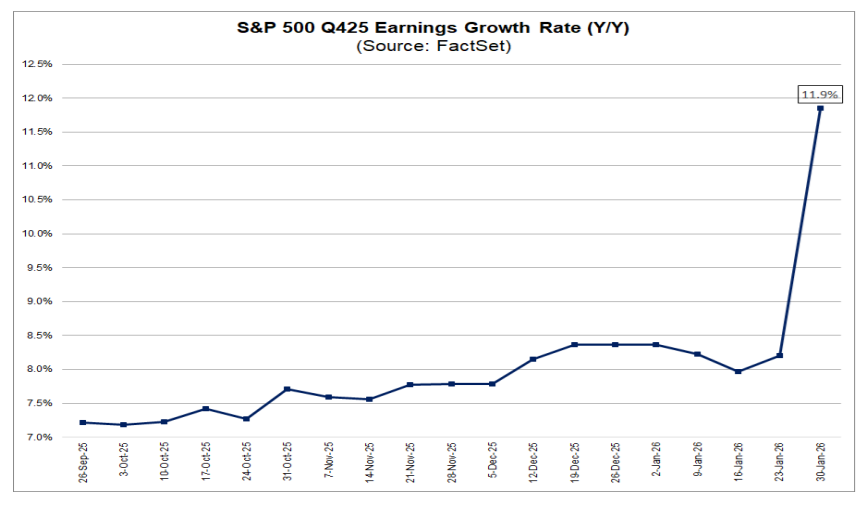
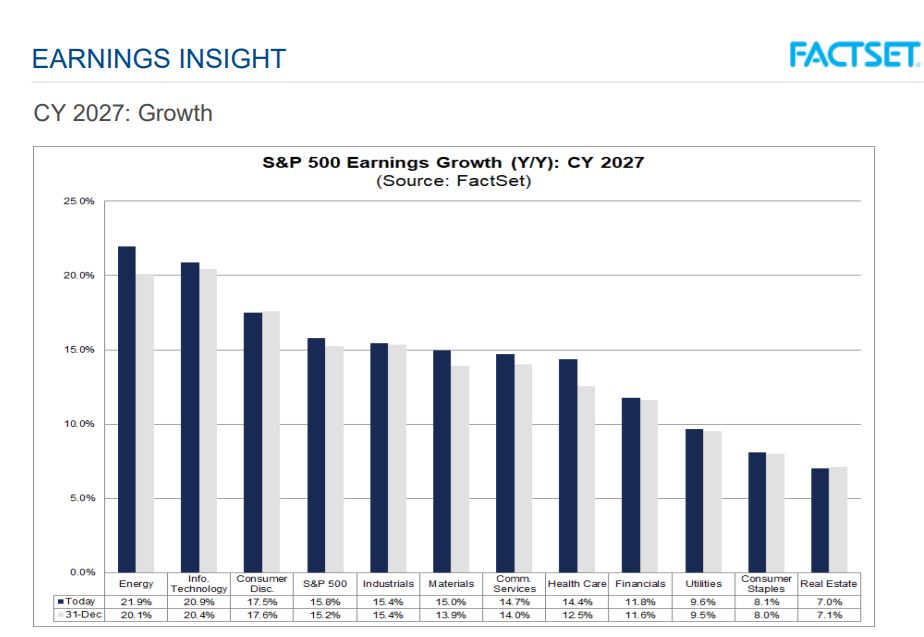
OK, now onto the most important fundamentals of all, earnings.
It’s tempting to clutch our pearls and worry about what MIGHT go wrong with earnings in the future, BUT what MIGHT go wrong, never EVER matters more than what is actually OBJECTIVELY happening.
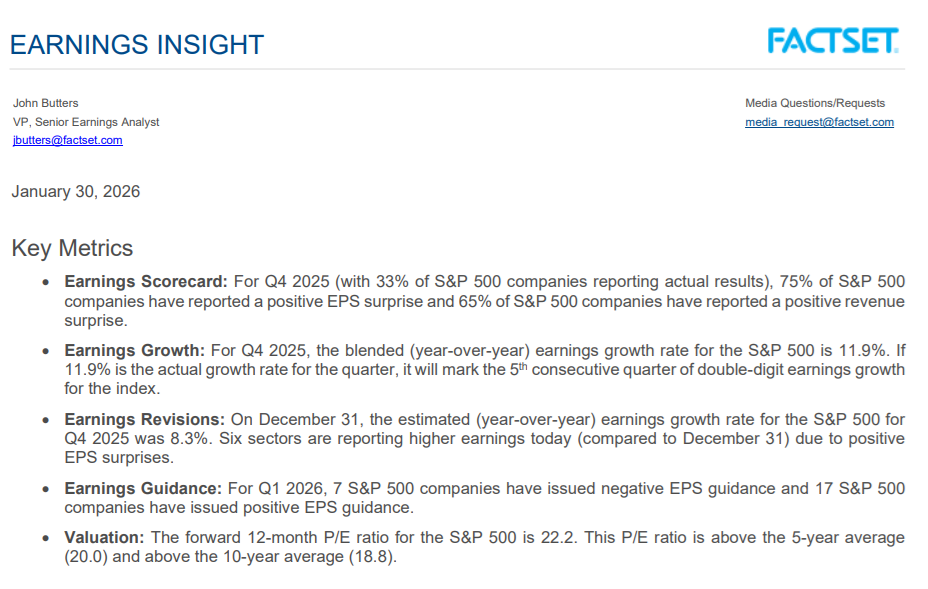
1/3rd of companies have reported with Alphabet & Amazon announcing next week, and Oracle not until March 9th.
NVIDIA on February 25th
Earnings growth is running 12% right now. And 3X more companies are issuing positive guidance than negative.
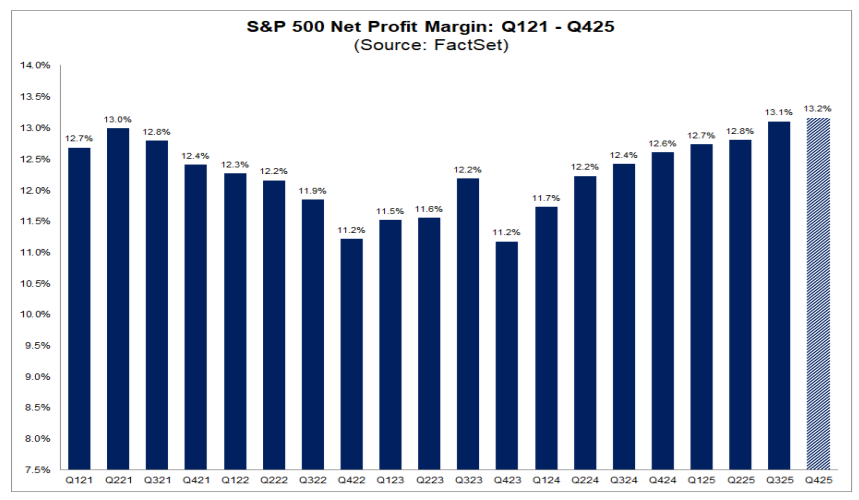
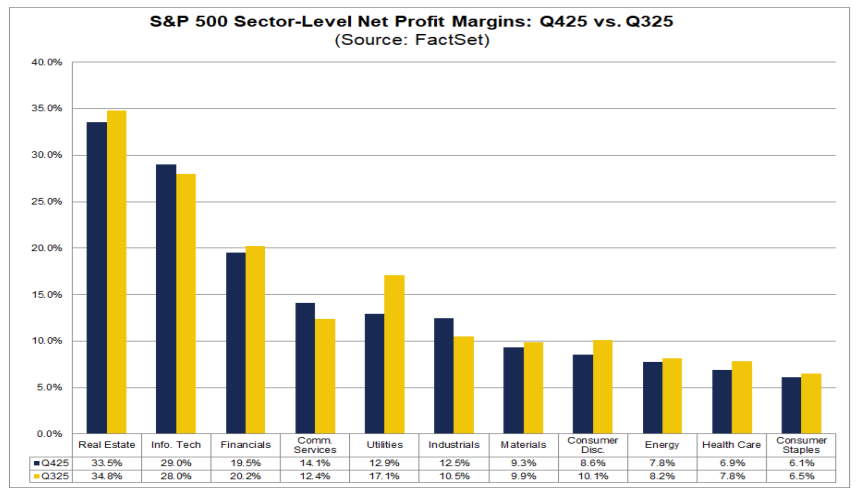
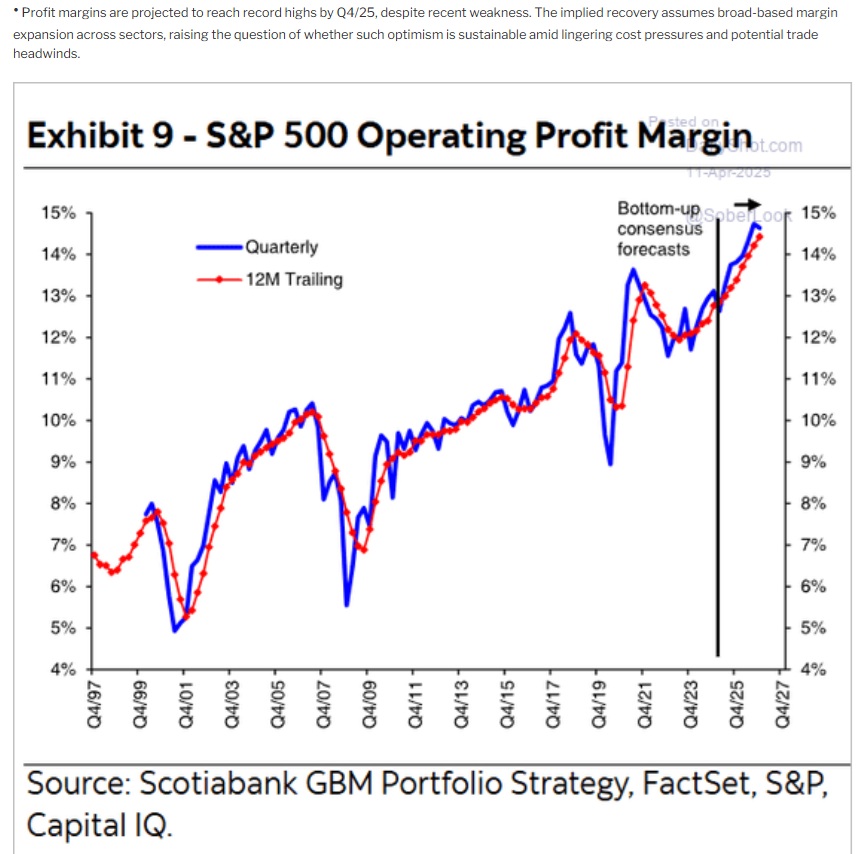
Highest Profit Margin In US Corporate History
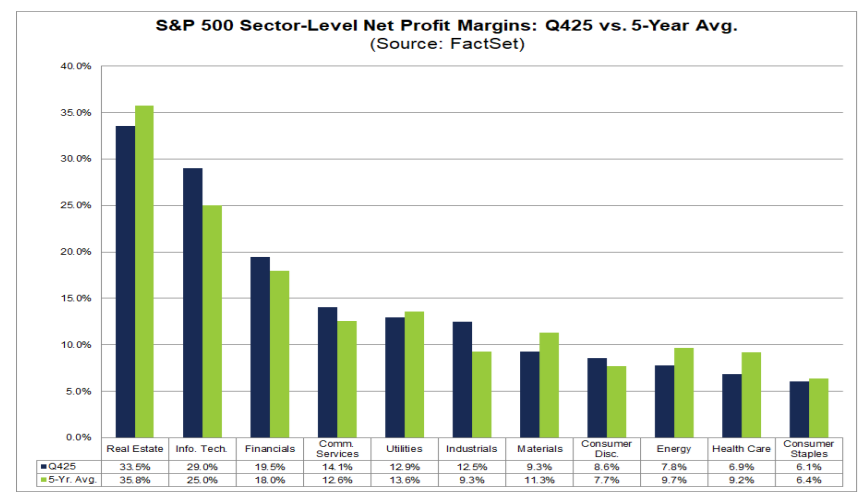
Margin Expansion In The Last Year Is Broad-Based
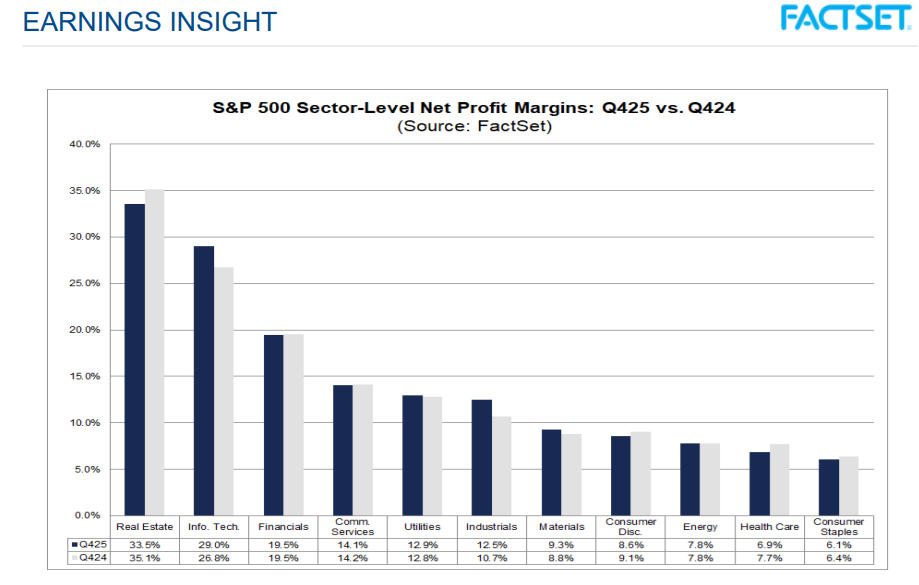
Margins are rising fastest for the tech companies, and Bank of America expects that to continue.
The Biggest Margin Expansion Over Time Is Tech
Makes sense since tech = growth, spending = higher growth
Tech margins up 1% from last quarter alone
Almost as if smart companies spending more on growth isn’t bad for margins because every $1 spent pays for itself and then some.
Almost as if positive cash return on invested capital is still a thing😉
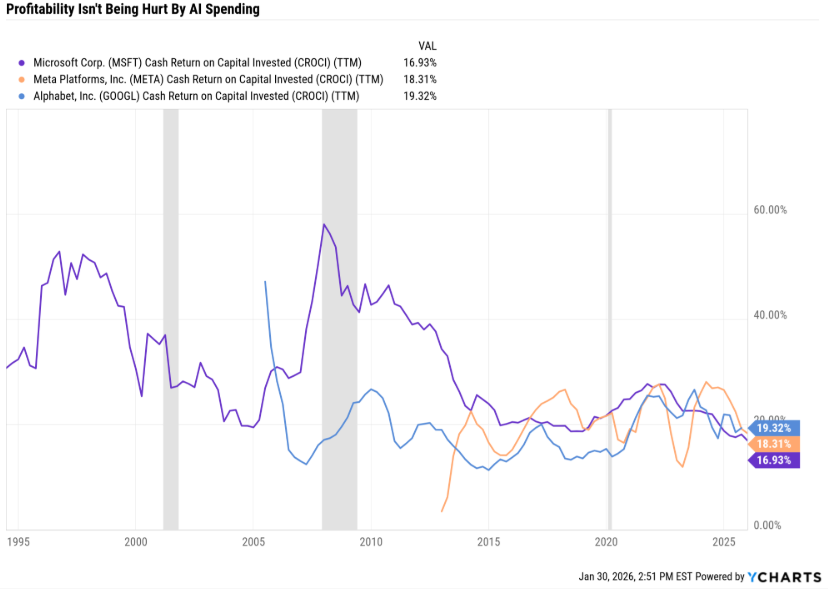
More Growth Spending = Better Growth
Growth Was 8% Until Microsoft and Meta Announced And It Jumped 60%
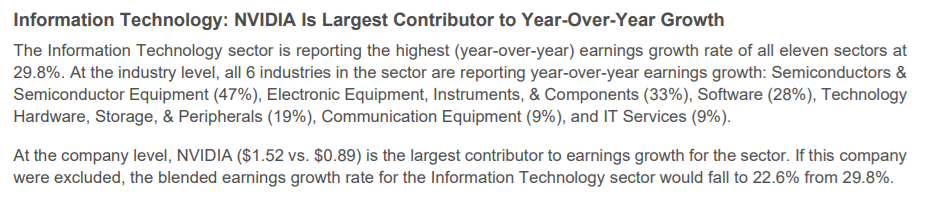
Tech On Track For 26% EPS Growth This Quarter
Estimates keep rising for most sectors, and companies keep clearing the higher bars.
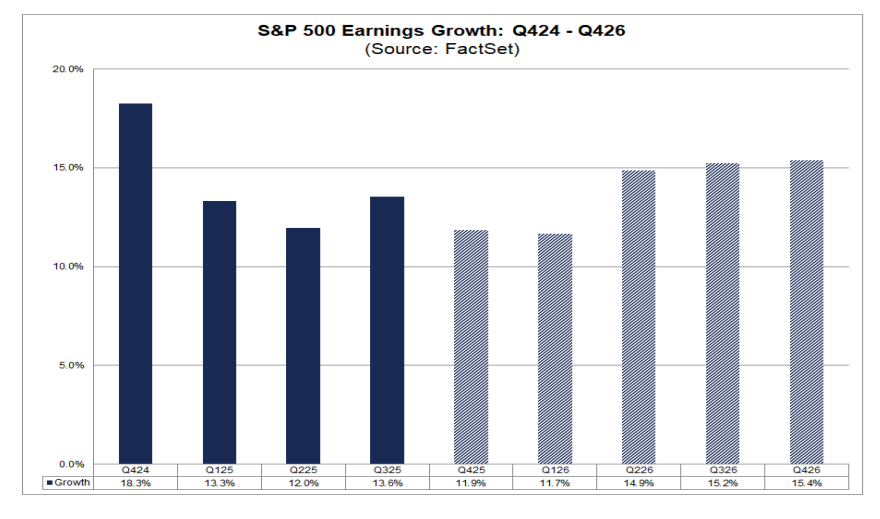
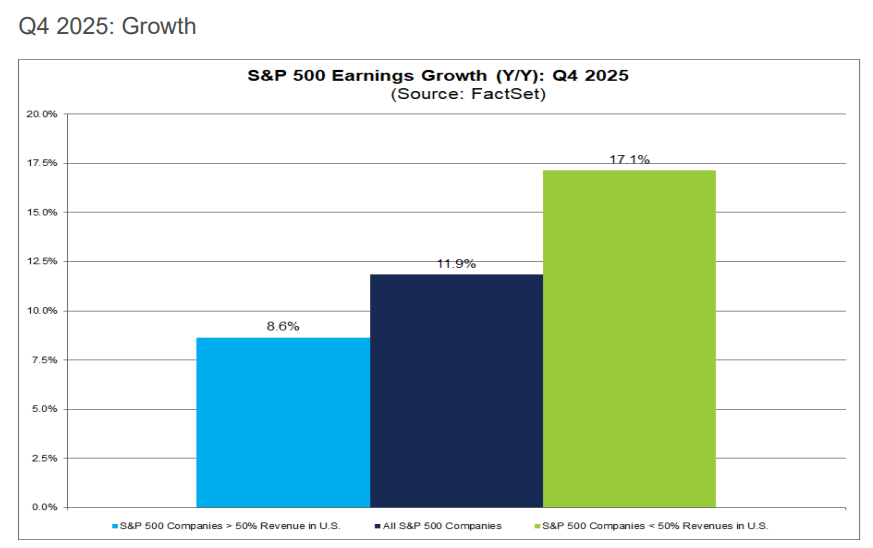
Q4 estimates are down from 17.5% at the start of the year, BUT companies will likely beat expectations, and these consensus estimates are exceptionally strong.
China Allowing H200 Imports Boosts Nvidia’s Likely 2026 Growth To 70%
None of that is a factor in NVDA’s strong growth this quarter, ’s 71% YOY growth estimates.
32% of the tech sector’s growth is from Nvidia this quarter.
5.6% of the S&P’s 14% expected growth is from Nvidia this year.
40% of S&P EPS growth this year is from Nvidia.
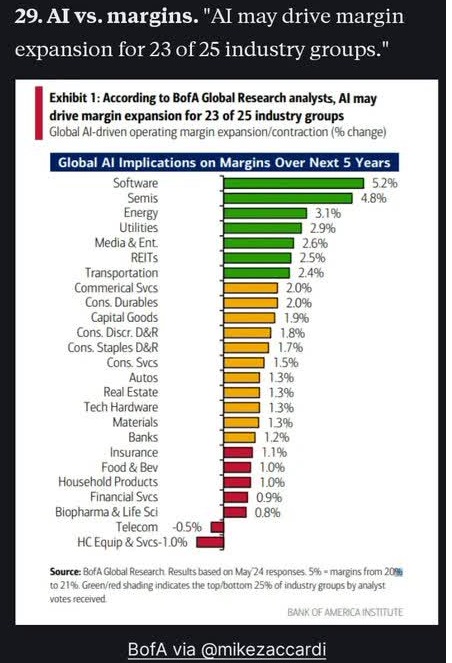
Margins Rise if Sales Grow Faster Than Costs
Margin Mean Reversion Hasn’t Been The Case For 30 Years
Anyone Predicting Margin Compression Has To Explain Why It Hasn’t Been The Case For 30 Years
“This time is different”? Not speculation, stone-cold, objective fact.
This is why Jeremy Grantham has been wrong for 16 years and counting.
His models assume margin mean reversion to 50-year averages (and the world is a very different place now).
58% of the S&P Will have reported by the end of next week.
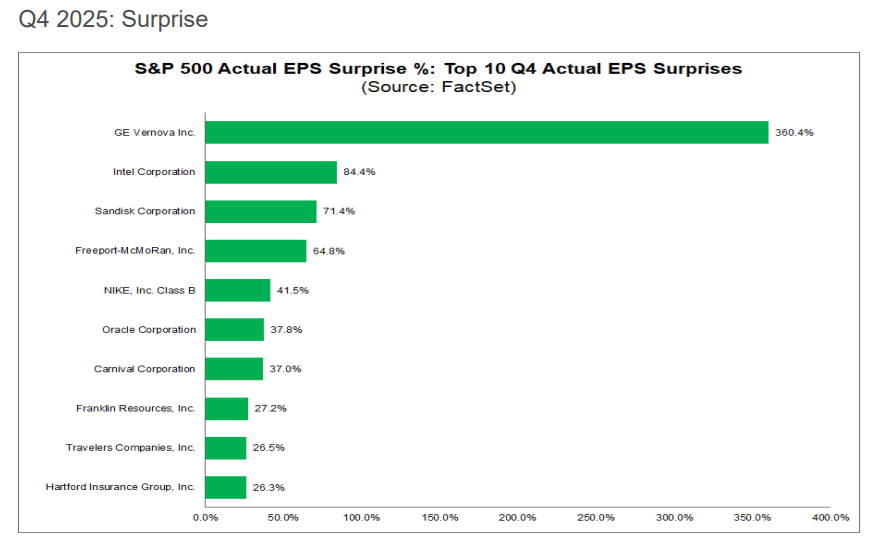
Most sectors are beating nicely.
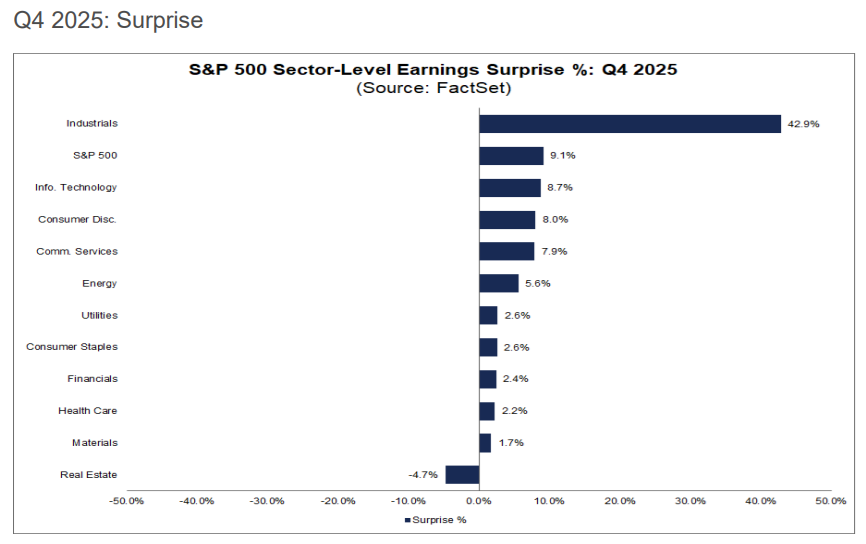
The Industrial Beat Outlier is due to GE Vernova
Companies with more international growth markets experience stronger growth. If you’re stuck in the US? Less growth opportunities.
2025 Growth (Based On Earnings Reported So Far)
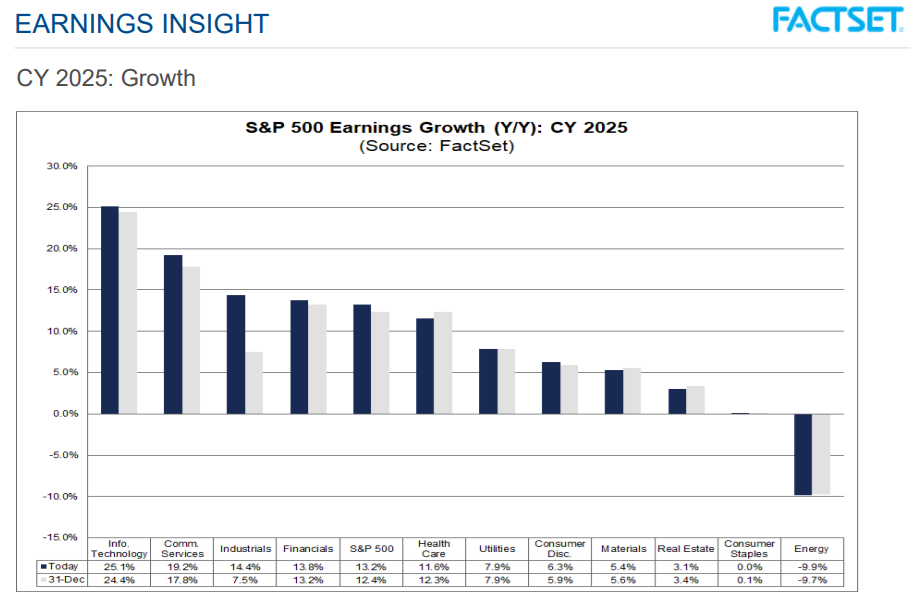
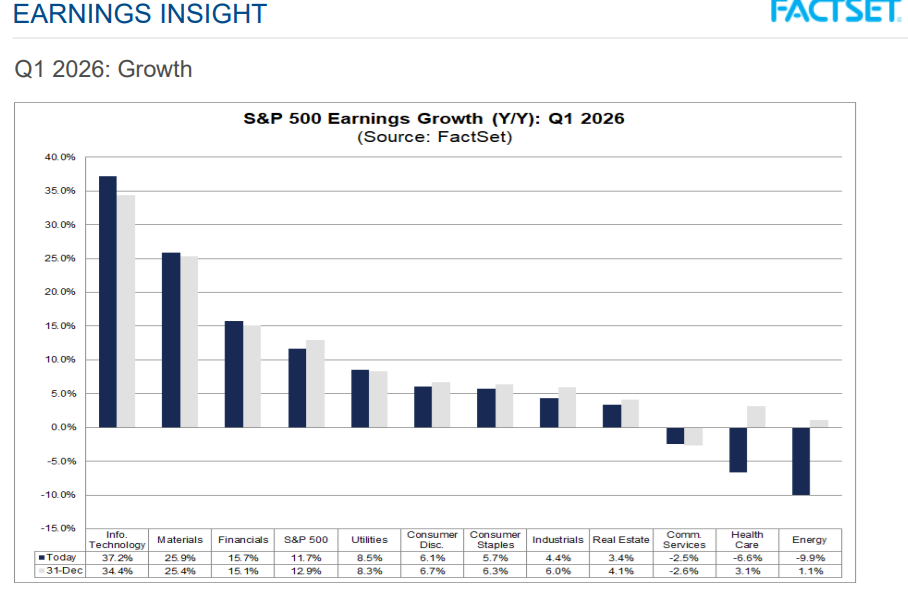
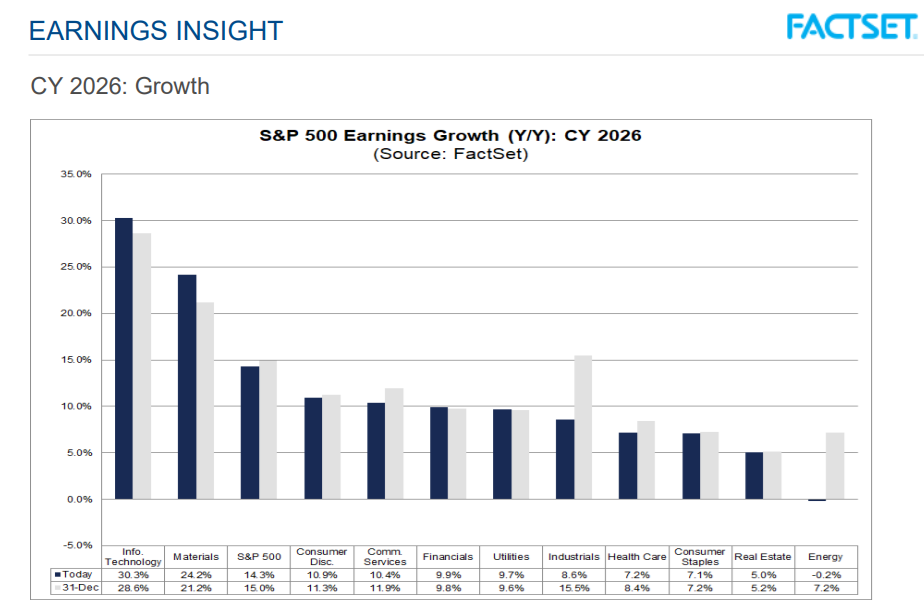
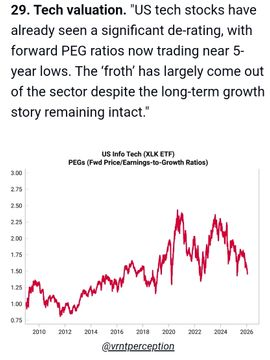
25% EPS growth for Tech in 2025, 37% growth in Q1, and 30% growth in all of 2026…And Tech PEG Is At A 5 Year Low…So Bubble? 😉
4 Consecutive Years Of Accelerating EPS Growth
4 Consecutive Years Of Double-Digit Tech Earnings Growth
3 Consecutive Years of 20+% cash flow growth
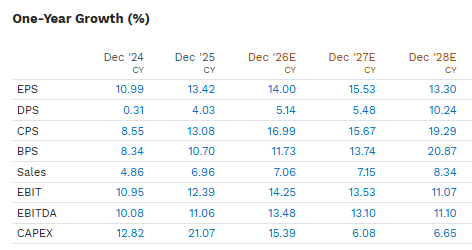
S&P Growth Consensus
First 5 Year Streak of Double-Digit Growth In US History May Be Underway
Jan 1st 10.2% 2028 growth consensus, now 13.3%
Growth outlook keeps improving.
S&P Cash Flow Growth accelerating to 19% by 2028
Valuation Update
Due to the time I had to take to explain the commodity crash today (and I’m sure a lot of GNG members wanted to know).
Plus, it helps me sleep at night to understand WTF just happened😉😂🤣
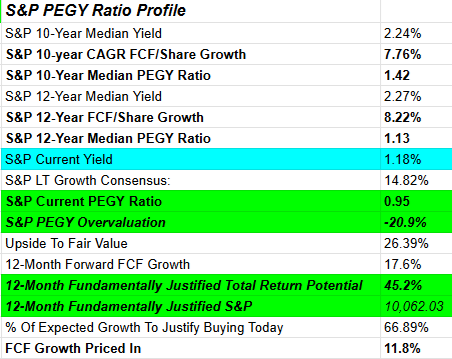
The growth in FCF/share between 2024 and 2028 is expected to be 14.8% CAGR (3X the historical norm) and that is why, at an EV/EBITDA of 16X the PEGY ratio is 0.95.
Which means that stocks today, despite being near record highs, are still trading at a historical discount similar to bear market lows.
If expected growth rates are achieved, the S&P is a screaming buy.
From bear market lows, 45% gains within a year are common.
If and only if S&P growth is as expected (14.3% in the next year) and then growth estimates remain steady, a 45% gain in the next 10 months would bring the PEGY ratio back to its 12-year median of 1.13.
The probability of this being a bubble? Statistically, based on a PEGY ratio of 0.95 is around 9%.
More Proof It’s Not A Bubble
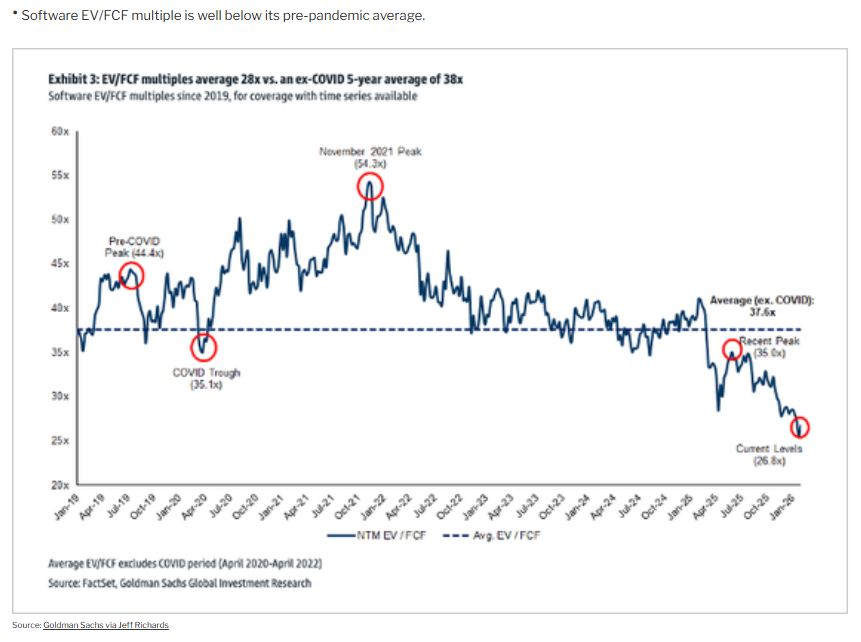
EV/FCF Shows Tech is NOT In A Bubble
Tech is flat for the year (this is 100% due to explosive earnings growth)
PEG Shows Tech Is NOT In A Bubble
So even though I don’t have time to run the full S&P PEGY ratio analysis, have confidence that US stocks (and tech stocks) are NOT in a bubble.
Just In Case You Think I’m Crazy😉 Morningstar also agrees, no bubble
Have a Wonderful Weekend Everyone!

Bonus Memes
Because Amazon, Nvidia, and Microsoft are “in talks” to invest up to $60 billion into OpenAI.
Amazon is up to $50 billion on its own.
Which would give the Hyperscalers 35% ownership of OpenAI
60% of shares owned by the Foundation + Hyperscalers.
My theory is that OpenAI would prefer to remain private for 2 to 3 more years and only hyperscalers have $300 billion in annual free cash flow + $1.4 trillion in borrowing power (Per Goldman Sachs) to raise all the money OpenAI needs (without an IPO).
That would mean 6 CEOs are all Sam Altman needs to cut a deal with (rather than millions of retail investors, just ask Elon how much fun it is when your fickle share price threatens your long-term plans).
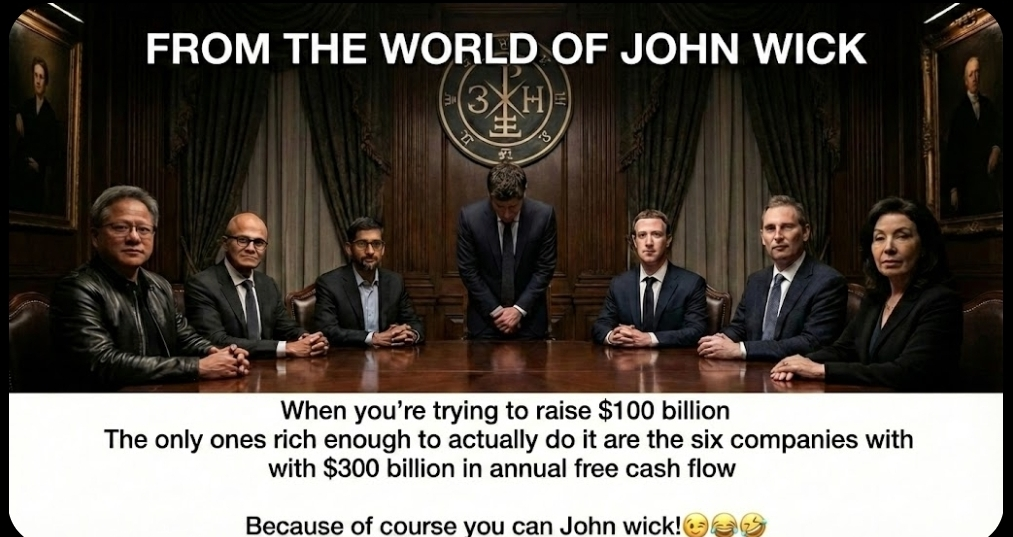
And IF OpenAI can raise $1.7 trillion (over 8 years) from the hyperscalers + Nvidia? Then OpenAI doesn’t need anyone other than its 6 ally CEOs. So…