AI Portfolio Reports - Your Personal Investment Analyst
Alright.. this one has been a long time coming. If you've been using the Portfolio Tracker, you already know how powerful it is for tracking your positions, monitoring performance, and keeping tabs on your dividends. But what if you could take everything in your portfolio and turn it into a comprehensive, professional-grade investment report.. with one click?
That's exactly what AI Portfolio Reports does. I built this feature because I wanted something that could take a portfolio and give me the full picture. Not just "here's your return." I'm talking safety scores, valuation analysis, Monte Carlo dividend forecasts, insider activity, sentiment data, fundamentals, earnings growth.. the whole nine yards. And it generates a beautiful 12-15 page PDF that you can download, save, or have emailed to you on a schedule.
This guide is going to walk you through everything. How to generate your first report, what each section means, how to customize it, how to set up automated scheduling, and all the little details in between. Let's get into it.
What Are AI Portfolio Reports?
AI Portfolio Reports are comprehensive PDF documents that analyze your entire portfolio using a combination of real data and artificial intelligence. Each report is 12-15 pages and covers up to 14 different analysis sections.
Here's what makes them special:
AI Summary - An AI-powered narrative that reads your portfolio's data and writes a professional analysis covering health, valuation positioning, and income trajectory. This isn't generic boilerplate. It actually looks at your specific holdings and gives you a real summary.
Monte Carlo Dividend Forecast - 3,000 simulations projecting your dividend income 5 years into the future with DRIP reinvestment. You get P5/P25/P50/P75/P95 confidence bands so you can see the range of outcomes.
Risk & Stress Testing - 10,000 simulations modeling your portfolio's total value over time, plus Sharpe/Sortino/Calmar ratios, VaR, CVaR, and drawdown analysis.
Fair Value Analysis - Discount-to-fair-value for each holding, with buy and trim price targets. A chart shows you which stocks are undervalued (green) and overvalued (red) at a glance.
Safety & Quality Heatmap - A visual heatmap showing safety, quality, leverage, and payout scores for every position. Red means watch out, gold is solid, green is great.
Plus 9 more sections covering performance attribution, fundamentals, earnings growth, dividends, sector allocation, sentiment, technicals, insider activity, and market news.
The whole thing runs in about 60-240 seconds - or longer depending on portfolios size.
How to Get There
Getting to AI Reports is simple. Navigate to your Portfolio page and select the portfolio you want to analyze. You'll see an "AI Reports" button right there in the action bar at the top of the page, next to your other portfolio tools.
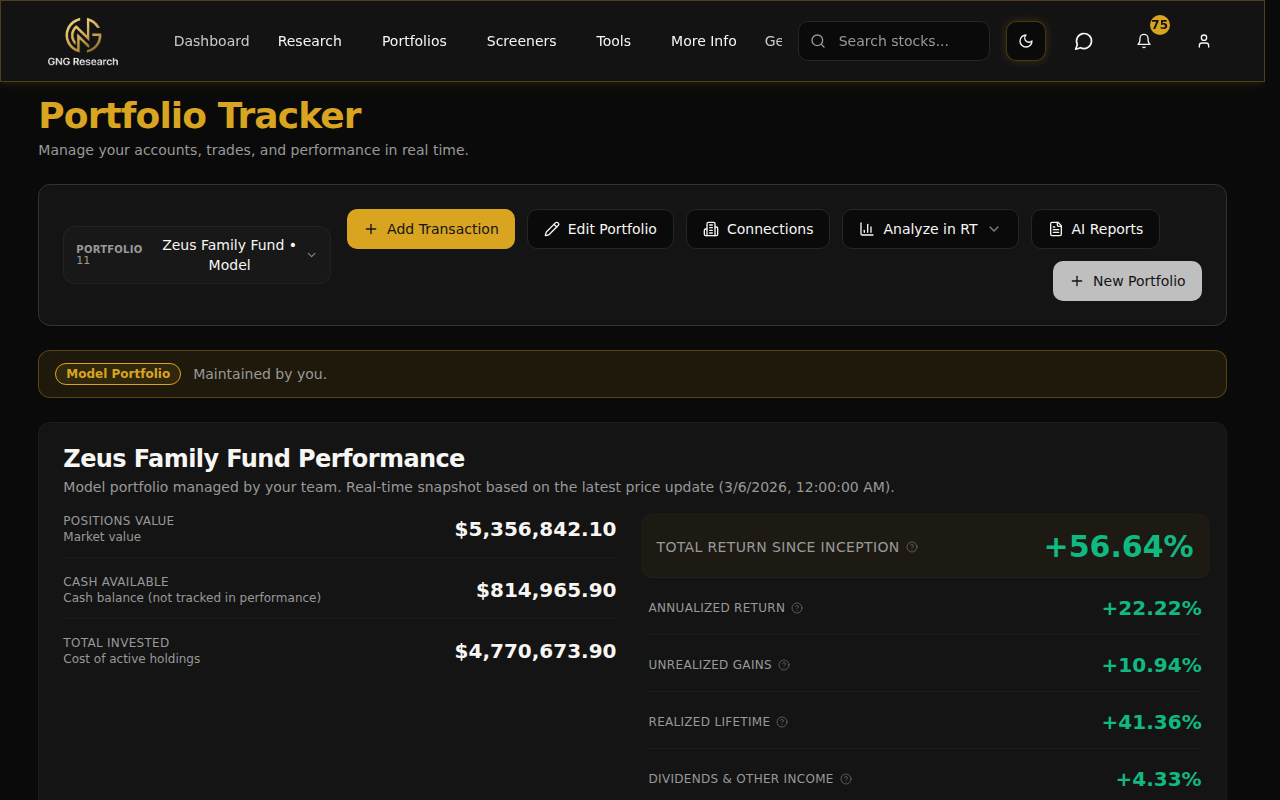
Click it and the AI Reports modal opens up. That's it.. one click and you're in.
You can also find it in the three-dot menu on mobile on the portfolio page. Click the menu icon and you'll see "AI Reports" in the dropdown.
Generating Your First Report
When the screen opens, you'll land on the Generate tab. This is where you choose what goes into your report.
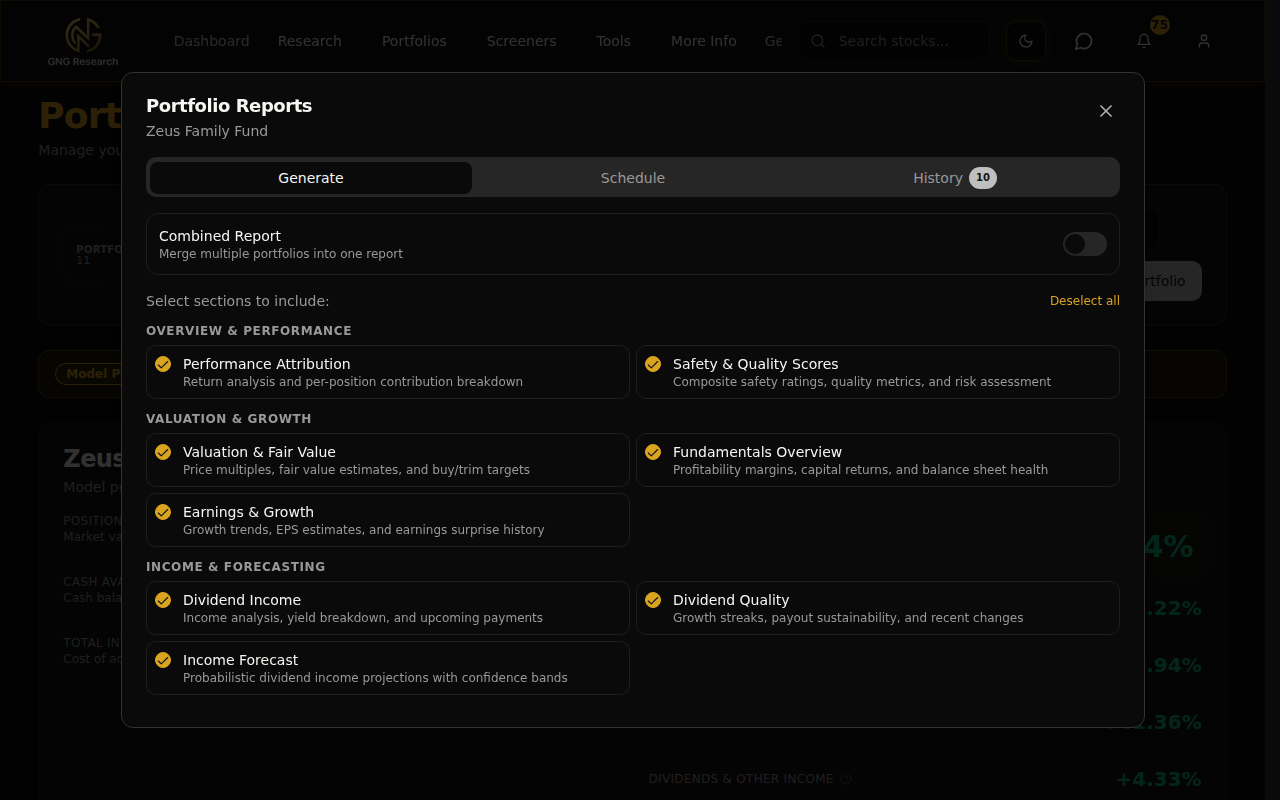
Choosing Your Sections
You'll see all 14 sections organized into four groups. By default, everything is selected, and honestly that's what I'd recommend for your first report. But if you want a faster, more focused report, you can uncheck sections you don't need.
Here are the four groups:
Overview & Performance
Performance Attribution - Return analysis and per-position contribution breakdown. Shows you which stocks are carrying the portfolio and which ones are dragging it down.
Safety & Quality Scores - Composite safety ratings, Altman Z-Score, Beneish M-Score, and a risk heatmap across all your holdings.
Valuation & Growth
Valuation & Fair Value - Price multiples (P/E, P/B, P/FCF, EV/FCF) plus fair value estimates with buy and trim targets for each position.
Fundamentals Overview - Profitability margins, capital returns (ROE/ROA/ROIC), and balance sheet health metrics.
Earnings & Growth - Revenue, EPS, and free cash flow growth CAGRs, plus earnings estimates and EPS surprise history.
Income & Forecasting
Dividend Income - Your portfolio's income analysis, yield breakdown, and upcoming payments.
Dividend Quality - Growth streaks, payout sustainability, FCF coverage, buyback yield, and total shareholder yield per stock.
Income Forecast - The Monte Carlo simulation. 3,000 runs projecting 5 years of dividend income with DRIP reinvestment and confidence bands.
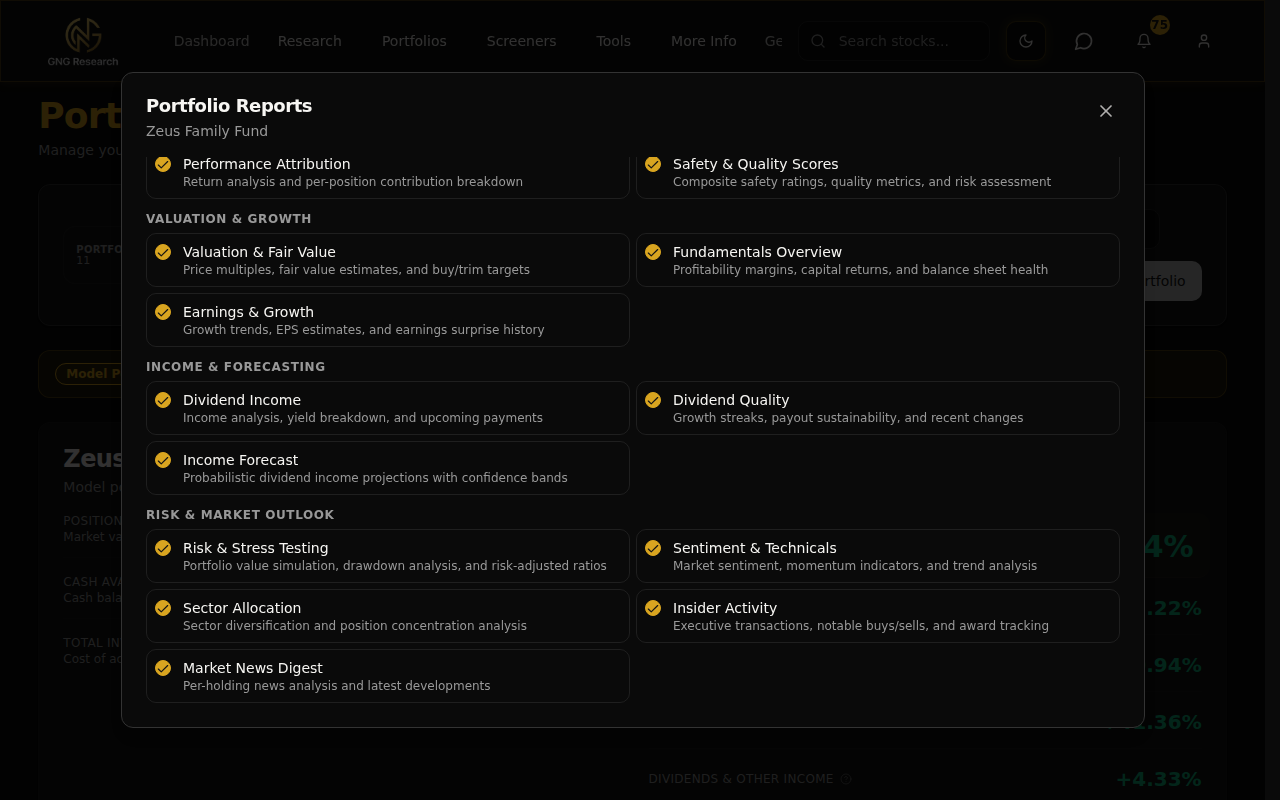
Risk & Market Outlook
Risk & Stress Testing - Portfolio value simulation (10,000 sims), Sharpe/Sortino/Calmar ratios, VaR, CVaR, and drawdown analysis.
Sentiment & Technicals - Market sentiment scores (7-day and 30-day), RSI, price vs moving averages, and 52-week range position.
Sector Allocation - Sector diversification breakdown with a pie chart and top-10 position concentration analysis.
Insider Activity - Executive transactions, notable buys and sells by dollar value, and overall buy/sell trend per ticker.
Market News Digest - AI-powered analysis of recent news for each holding in your portfolio.
There's also a "Select all / Deselect all" toggle in the top right corner of the section list. Makes it easy to start from scratch and only pick what you want.
Hitting Generate
Once you've got your sections selected, hit the "Generate Report" button at the bottom. The button shows how many sections you've selected, so you always know what you're getting.
After you click it, a couple things happen:
You get a notification confirming "Report Generation Started"
The screen automatically switches to the History tab so you can watch the progress
Behind the scenes, the system is fetching your portfolio data, running Monte Carlo simulations, generating charts, and building the PDF
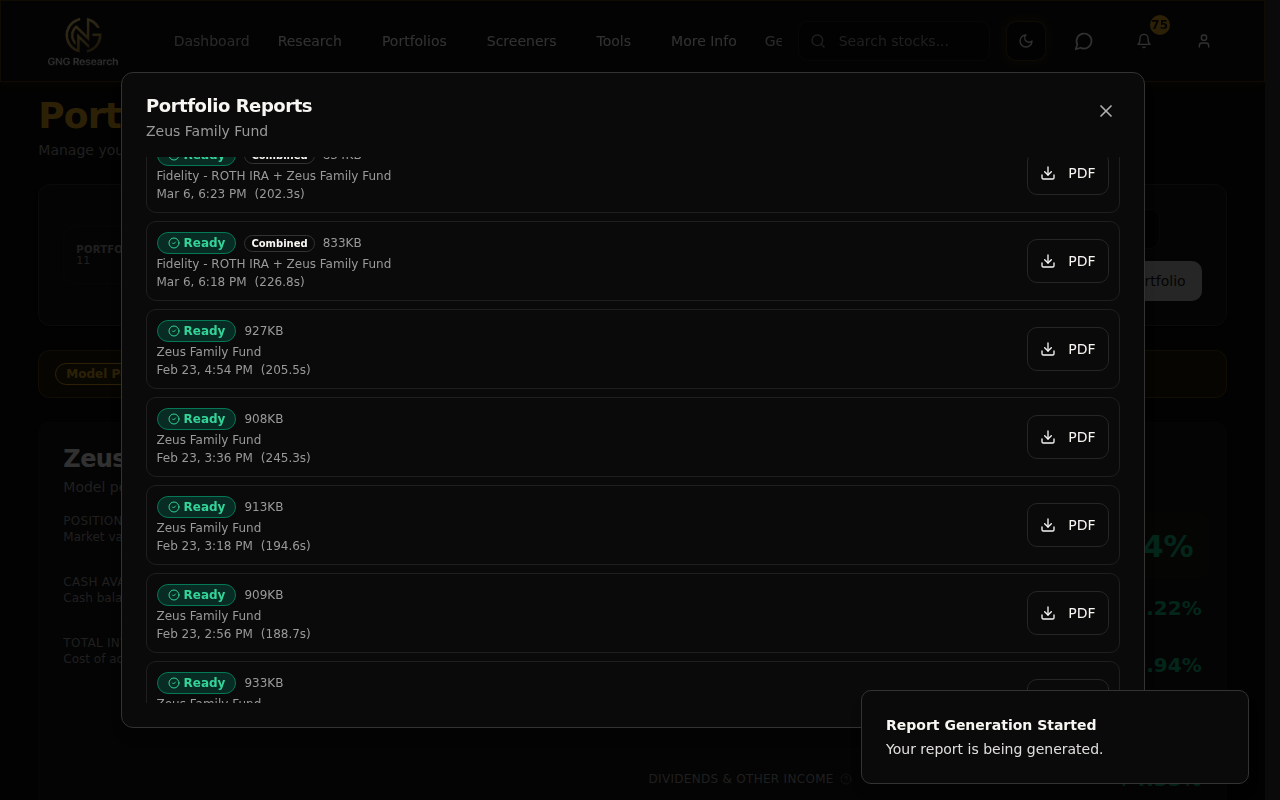
Your Report History
The History tab is where all your reports live. Every report you've ever generated shows up here with its status, file size, generation time, and a download button.
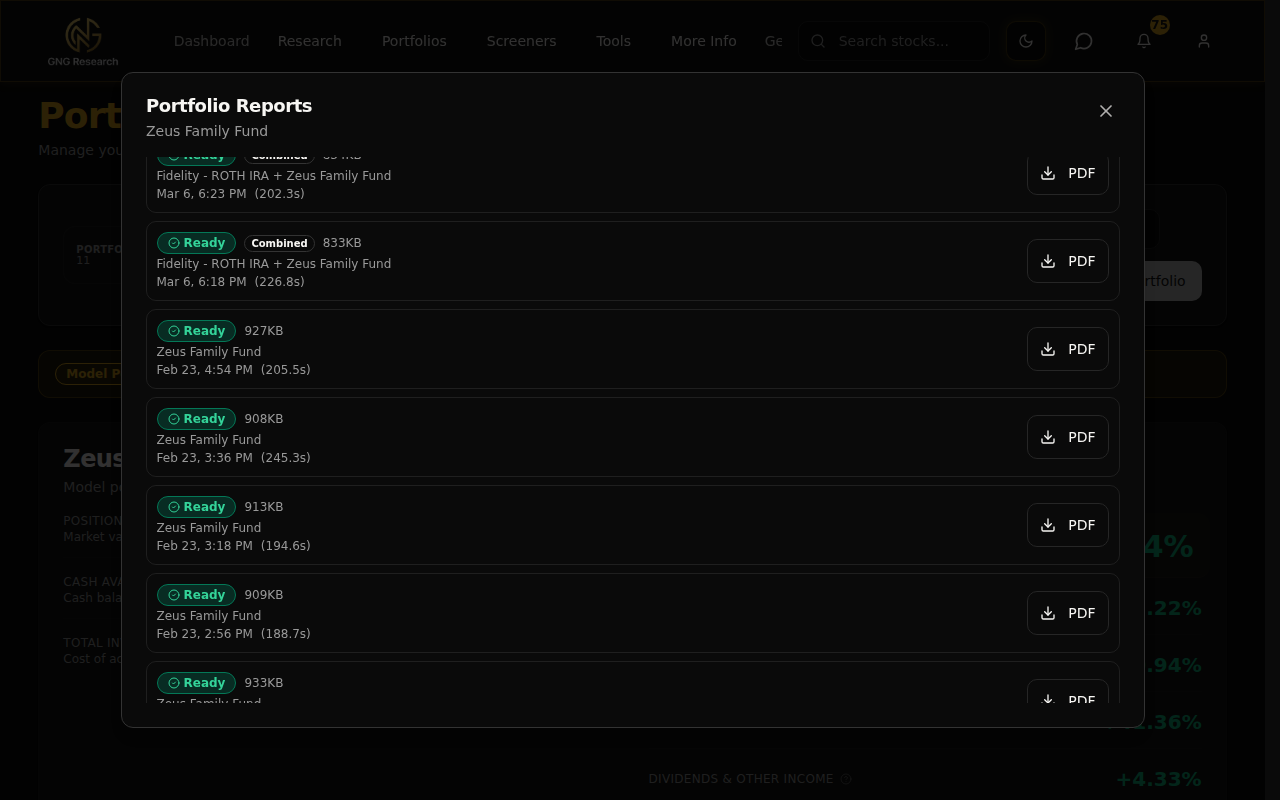
Here's what each status means:
Queued (yellow) - Your report is in the queue, waiting to be picked up
Generating (blue, spinning) - The report is actively being built. Data is being fetched, Monte Carlo simulations are running, AI is writing your summary.
Ready (green) - Your report is done and ready to download
Failed (red) - Something went wrong. The error message will tell me what happened so we can fix as needed.
The page polls automatically every 3 seconds, so you don't need to refresh anything. Just sit back and watch the status change. Most reports complete in about 60-240 seconds depending on how many positions you have and which sections you selected.
Each entry also shows you useful info like the file size (usually around 900KB), how long it took to generate, and whether it was a combined report across multiple portfolios.
Downloading Your Report
Click the "PDF" button next to any completed report and it opens in a new browser tab. From there you can save it, print it, or share it however you like. The download link is valid for one hour, but you can always come back to the History tab and download it again. Reports are stored for 90 days.
What's Inside the Report
Let me walk you through what you actually get in the PDF. I generated a report on my Zeus Family Fund portfolio (8 positions: NVDA, MRK, EPD, MELI, BTAL, CTA, TAIL, SQQQ) so you can see a real example.
Safety & Quality Heatmap
This section gives you a visual heatmap showing four key scores for every position: Safety Score, Quality Score, Leverage Safety, and Payout Safety. The colors go from red (concerning) to gold (decent) to green (strong). You'll also see Altman Z-Scores (bankruptcy risk), Beneish M-Scores (earnings manipulation risk), and the overall risk sub-scores.
I built this because I wanted a quick visual way to spot any red flags across the whole portfolio without having to check each stock individually.
Performance Attribution
Shows your returns across multiple timeframes (1-day, 1-week, 1-month, 3-month, 6-month, 1-year) plus per-position beta, realized volatility, and gain/loss contribution in dollars. So you can see exactly which stocks contributed the most to your gains and which ones cost you.
Valuation & Fair Value
This is one of my favorites. It shows all the key multiples (P/E, P/B, P/FCF, EV/FCF, EV/Revenue) for each holding, plus a fair value analysis with discount-to-fair-value percentages and specific buy/trim price targets. There's a horizontal bar chart that makes it immediately obvious which stocks are trading below fair value (green bars) and which are stretched (red bars).
Fundamentals Dashboard
Three panels covering profitability (gross/operating/net margins, FCF yield), capital returns (ROE, ROA, ROIC, Cash ROIC), and balance sheet health (current ratio, debt-to-EBITDA, interest coverage). Everything laid out cleanly so you can compare across holdings.
Earnings & Growth
Revenue, EPS, and free cash flow growth CAGRs for 3-year and 5-year periods. Current and next quarter earnings estimates. And an EPS surprise track record showing how consistently each company beats or misses estimates.
Dividends
Full income analysis including yield, annual income, upcoming payments, and a chart showing your monthly income distribution. Plus per-ticker dividend quality metrics: growth streak, 5-year CAGR, dividends-to-FCF ratio, buyback yield, and total shareholder yield.
Monte Carlo Income Forecast
This is the big one. 3,000 Monte Carlo simulations projecting your dividend income 5 years out with DRIP reinvestment. You get a confidence band chart showing P5 through P95 outcomes, annual income bar charts with error bars, and a per-stock contribution pie chart. There's also an AI-written narrative explaining what the numbers mean in plain English.
Risk & Stress Testing
10,000 geometric Brownian motion simulations modeling your total portfolio value over 10 years. Shows confidence bands, a distribution histogram of final values, drawdown analysis (median, severe, worst-case), and risk-adjusted performance ratios: Sharpe, Sortino, and Calmar.
Sentiment & Technicals
Per-ticker sentiment scores (7-day and 30-day) with color-coded labels, RSI status, price relative to 50-day and 200-day moving averages, and 52-week range position. Gives you a quick read on market mood and technical positioning.
Sector Allocation
A pie chart showing your sector breakdown plus a concentration analysis (top 5 and top 10 position weights). Helps you see if you're too concentrated in one area.
Insider Activity
Per-ticker summary of insider transactions including buy/sell counts and dollar values, trend indicators (net buying vs selling), and the top notable transactions by dollar amount.
Market News Digest
AI-powered analysis of recent news (last 7 days) for each holding. The AI reads the articles and gives you a concise summary of what's happening with each company. The news articles are also linked below.
Scheduling Recurring Reports
Alright, this is where it gets really powerful. Instead of manually generating reports, you can set up a schedule and have them delivered automatically.
Click the "Schedule" tab in the modal and you'll see three configuration options:
Frequency - Choose from Daily, Weekly, or Monthly
Day - For weekly schedules, pick the day of the week (Monday through Sunday). For monthly, pick a day of the month (1-28).
Time - Select the time in Eastern Time. Options are available in 15-minute increments from 12:00 AM to 11:45 PM.
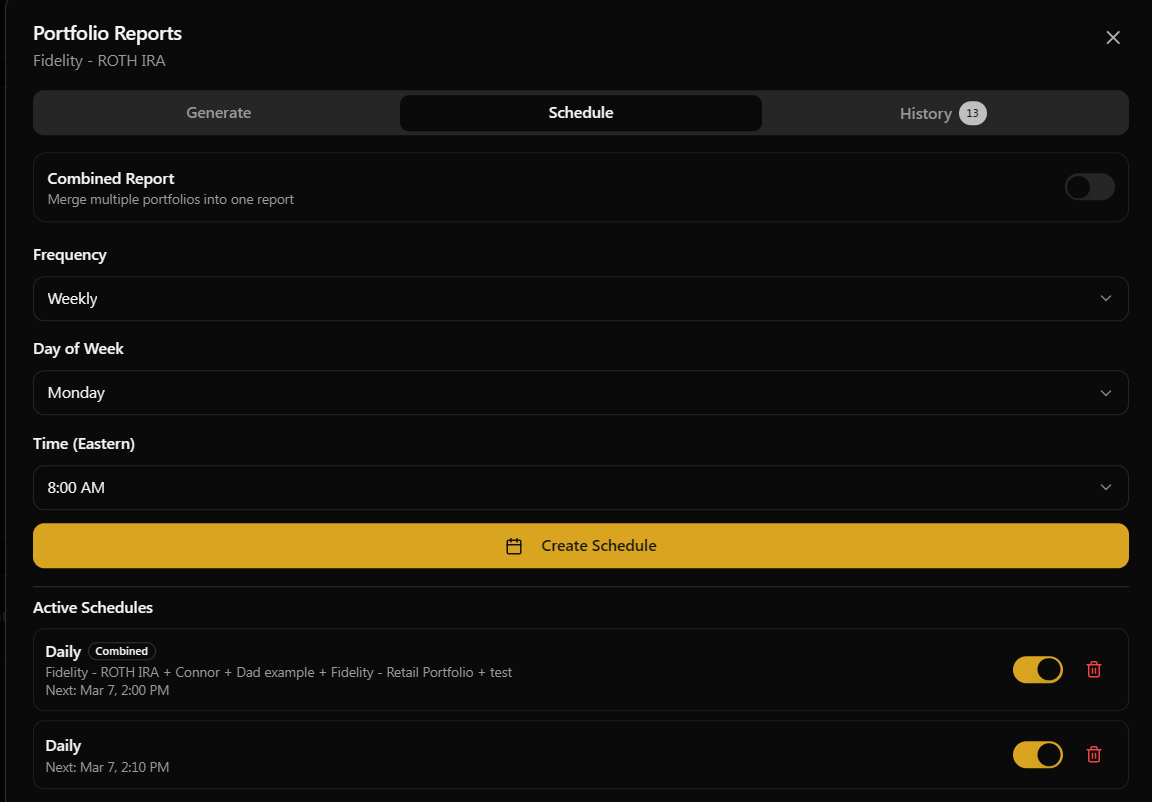
Example: Weekly Monday Morning Report
Let me walk you through setting up a weekly report. Here's how I'd do it:
Open the Schedule tab
Set Frequency to "Weekly"
Set Day of Week to "Monday"
Set Time to "8:00 AM"
Click "Create Schedule"
Just like that, every Monday at 8 AM Eastern you'll get a fresh report generated for that portfolio. When the report completes, you'll receive an email with a download link.
Managing Your Schedules
Once you create a schedule, it shows up in a list below the configuration form. Each schedule shows:
The frequency (Daily, Weekly, Monthly)
When the next report will be generated
A toggle switch to pause/resume the schedule without deleting it
A delete button to remove it permanently
The toggle is really handy if you want to temporarily pause a schedule, say during a vacation or a quiet market period, without losing your configuration.
Combined Reports
If you have multiple portfolios, you can merge them into a single report. This is great if you have separate portfolios for different accounts (taxable, IRA, Roth) but want to see the big picture across everything.
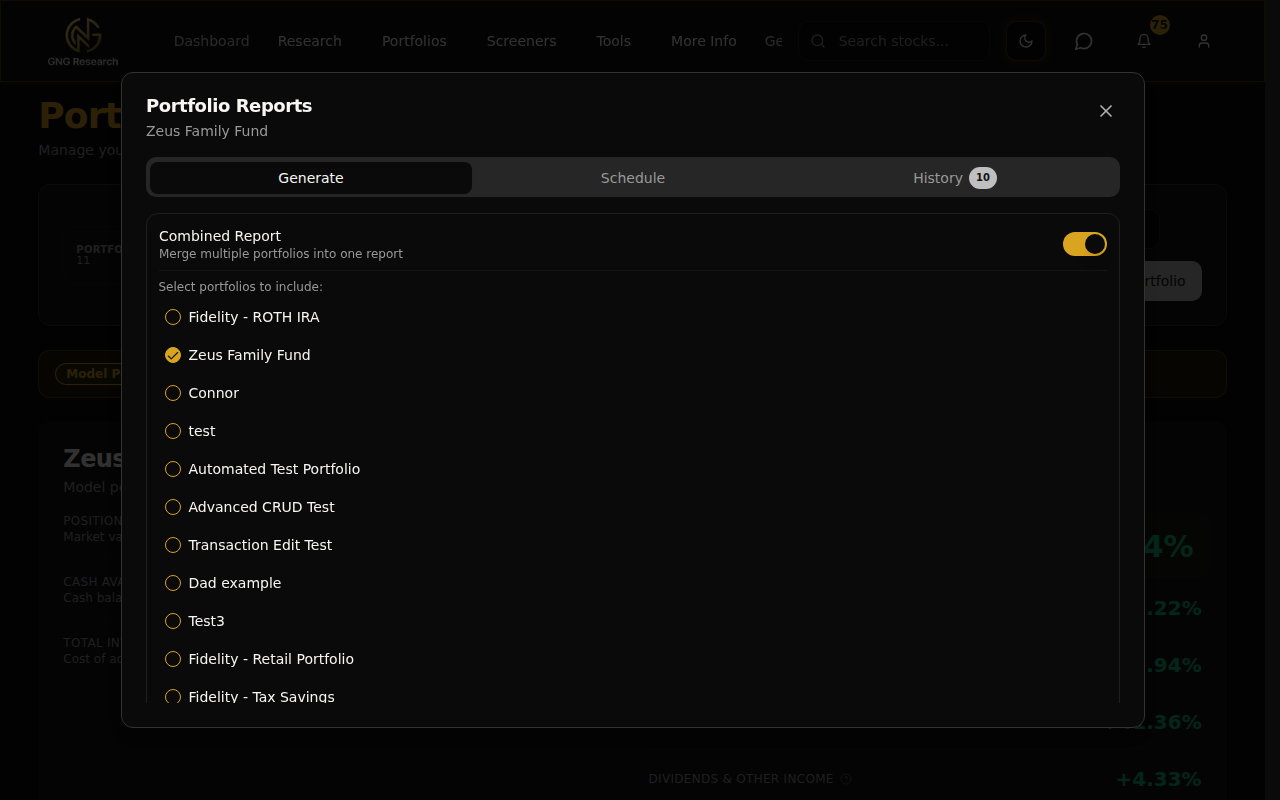
Here's how it works:
In the Generate tab (or Schedule tab), you'll see a "Combined Report" toggle
Flip it on
A list of all your portfolios appears with checkboxes
Select the portfolios you want to combine (minimum 2)
Hit Generate (or Create Schedule)
The report will treat all the selected portfolios as one big portfolio. All the analysis, all the charts, all the AI commentary will be based on the combined holdings. Combined reports are labeled with a "Combined" badge in your History tab so you can tell them apart.
What's Available on Each Tier
I always want to be transparent about this stuff. Here's the honest breakdown:
Report Generation Limits
Free: No access.
Pro: 5 reports per day, up to 3 per individual portfolio. Plenty for regular use.
Platinum: 15 reports per day, up to 10 per portfolio. For the power users who want reports across multiple portfolios.
Enterprise: Unlimited. No caps, no restrictions.
Scheduling Access
Free: No access.
Pro: Up to 3 active schedules total.
Platinum: Up to 10 active schedules.
Enterprise: Unlimited schedules.
Pro Tips
Here are the shortcuts and tricks I use myself:
Start with all sections on your first report. It only takes about 60-90 seconds and you get the complete picture. After that, you'll know which sections you care about most and can trim it down for faster reports.
Set up a weekly Monday morning schedule. There's something really satisfying about starting the week with a fresh portfolio analysis sitting in your inbox. I run mine at 8 AM Eastern every Monday.
Use combined reports for your total net worth view. If you have a taxable account and a retirement account as separate portfolios, combine them to see your overall allocation, diversification, and income projection across everything.
Pay attention to the fair value chart. The green and red bars make it immediately obvious which positions are trading at a discount and which are stretched. I use this to decide where to add more or where to trim.
Check the Monte Carlo confidence bands. The P50 line is your median expected outcome, but the P5 and P95 bands show you the range. If the P5 (worst case) still looks acceptable to you, that's a good sign about your portfolio's resilience.
Watch the insider activity section. If executives are buying their own stock, that's usually a bullish signal. If they're all selling, it's worth investigating why.
Reports expire after 90 days. If you want to keep a historical record, download the PDFs and save them somewhere. They auto-clean from the system after 90 days to keep storage manageable.
Wrapping Up
That's AI Portfolio Reports from top to bottom. You've got a one-click tool that turns any portfolio into a comprehensive 12-15 page investment analysis, complete with AI narratives, Monte Carlo projections, fair value targets, risk modeling, and 11 more data-rich sections.
Whether you're using it to review your own portfolio, share an analysis with a friend, or just get a professional-looking snapshot of where things stand.. this tool was built to make your life easier. And with scheduling, you can set it and forget it. Your reports will be sent via email when you want them.
If you have any questions or feedback about AI Portfolio Reports, drop it in the comments below or jump into Rocket Chat and let me know. I read everything. And if you haven't tried generating a report yet, go do it right now. Pick any portfolio, hit that AI Reports button, and see what comes back. I think you'll be impressed.