Your Complete Guide to the Portfolio Tracker
Alright.. this is the one a lot of you have been asking about. Welcome to the second guide in the Getting Started series, and this time we're covering the Portfolio Tracker from top to bottom. Whether you track everything manually, connect your brokerage through Plaid, or just want to browse our model portfolios for ideas.. this guide has you covered. Let's get into it.
What Is the Portfolio Tracker?
The Portfolio Tracker is your central hub for managing and analyzing your investments on GNG. You can create manual portfolios where you log your own trades, or you can connect your brokerage account through Plaid and have everything sync automatically. Either way, you get a full performance dashboard, detailed analytics, dividend tracking, sector breakdowns, valuation metrics, and more. All in one place.
Think of it as the other half of the platform. The Research Terminal helps you find stocks. The Portfolio Tracker helps you manage the ones you actually own and see how they're doing. They even talk to each other, but more on that later.
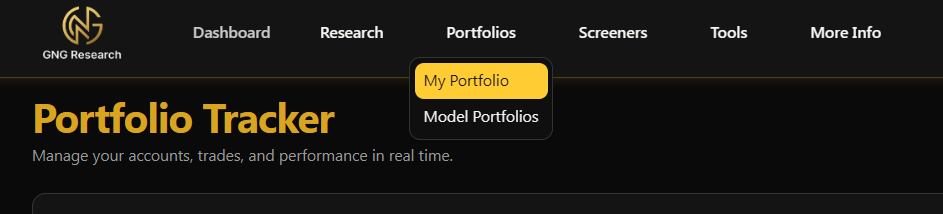
Finding the Portfolio Tracker
In the navigation bar at the top, look for Portfolio. Click it and you're in. If you haven't created a portfolio yet, you'll see a clean welcome screen with a button to get started. That's it.. no hidden menus.
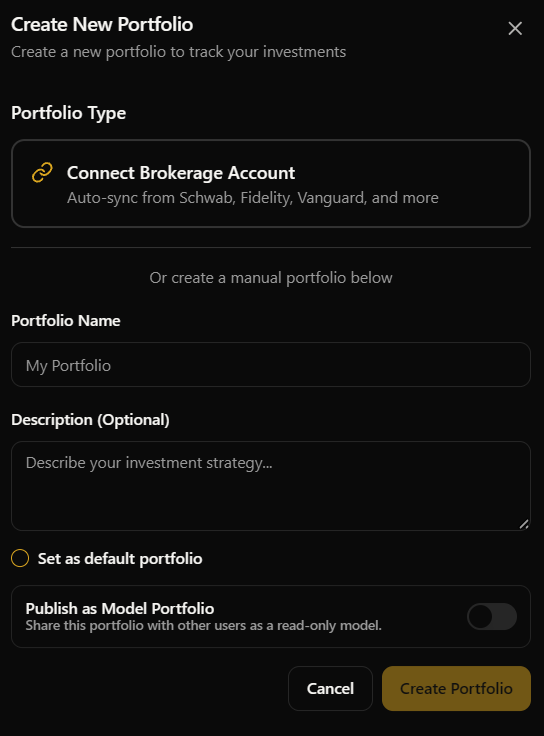
Creating Your First Portfolio
When you land on the Portfolio page for the first time, you'll see a card that says "Get Started" with a button to create your first portfolio. You've got two paths here depending on how you want to track things.
Manual Portfolio
This is the traditional way. You create a portfolio, give it a name, and then manually enter your trades. Here's how:
Click "Create Your First Portfolio" (or the + button if you already have portfolios)
Give it a name, something like "My Dividend Portfolio" or "Growth Picks 2026"
Hit Create
You'll land on your new empty portfolio, ready to add transactions
That's it. Your portfolio is live and waiting for you to start adding positions. I'll walk you through adding transactions in the next section.
Connecting Your Brokerage via Plaid
If you'd rather not enter every trade manually (and honestly, who would), you can connect your actual brokerage account through Plaid. This pulls in your real holdings, transactions, and cash balances automatically.
Click "Create Your First Portfolio"
Choose the Connect Brokerage option
You'll see a Plaid window pop up where you search for and log into your brokerage
Select which accounts you want to sync
Confirm, and GNG will create a portfolio linked to your brokerage data
The initial sync takes a moment while we pull everything in. After that, your portfolio updates automatically so you never have to manually enter a trade again. Pretty nice.
What Gets Synced
When you connect through Plaid, here's what comes over:
Holdings - Every position in your selected accounts with current quantities and values
Transactions - Your buy/sell history so you can see what happened and when
Cash Balances - How much cash is sitting in the account
There's also a mapping system that matches your brokerage's holdings to our database. The vast majority map automatically, but if something doesn't, you'll see an unmapped indicator and we handle it on our end. You don't need to worry about it.
Adding Transactions (Manual Portfolios)
If you're running a manual portfolio, this is how you build it up over time. Every buy, sell, deposit, and withdrawal gets logged here.
Buy and Sell
To add a trade:
Click the "Add Transaction" button
Select the type: Buy or Sell
Enter the ticker symbol (it'll autocomplete as you type)
Enter the number of shares
Enter the price per share
Pick the date the trade happened
Optionally add any fees
Hit Submit
The total amount calculates automatically as you enter shares and price. If you're buying and don't have enough cash in the portfolio, the system will offer to auto-deposit the difference for you. One less step to think about.
Deposits and Withdrawals
Cash management is straightforward. Select Deposit or Withdrawal as the transaction type, enter the amount and date, and submit. Deposits add cash to your portfolio that you can then use for buys. Withdrawals take cash out. Simple.
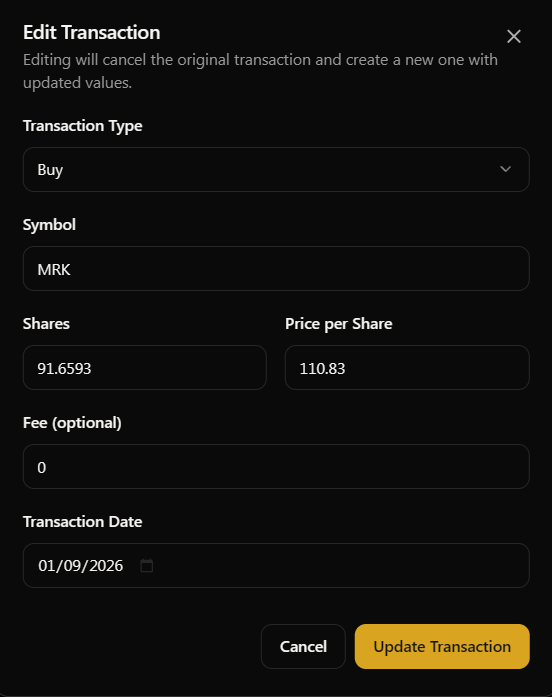
Editing and Deleting
Made a mistake? No problem. In the Transactions tab, you can edit or delete any transaction. Click the edit icon to change details, or delete it entirely if you entered something wrong. The portfolio recalculates everything automatically after any change.
Understanding Your Dashboard
Once you've got positions in your portfolio, the dashboard comes alive. There's a lot here so let me break it down piece by piece.
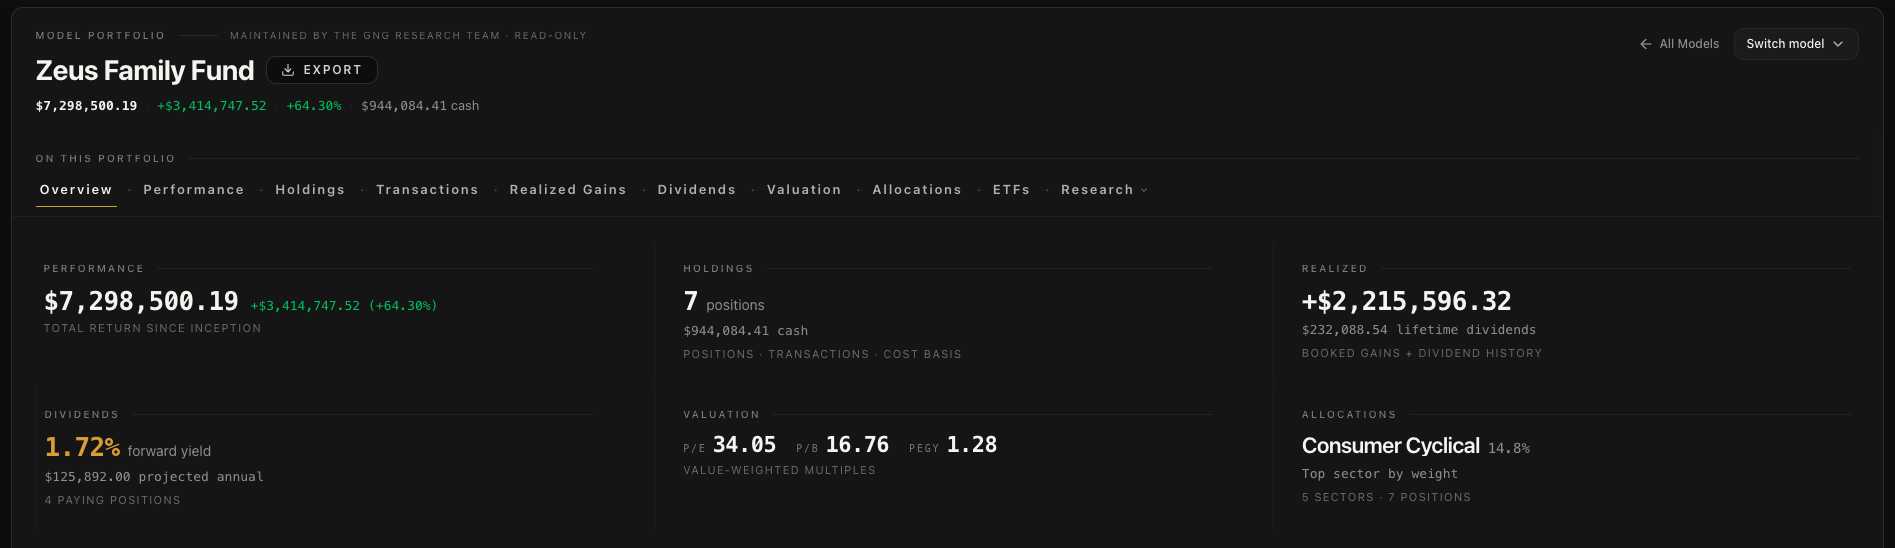
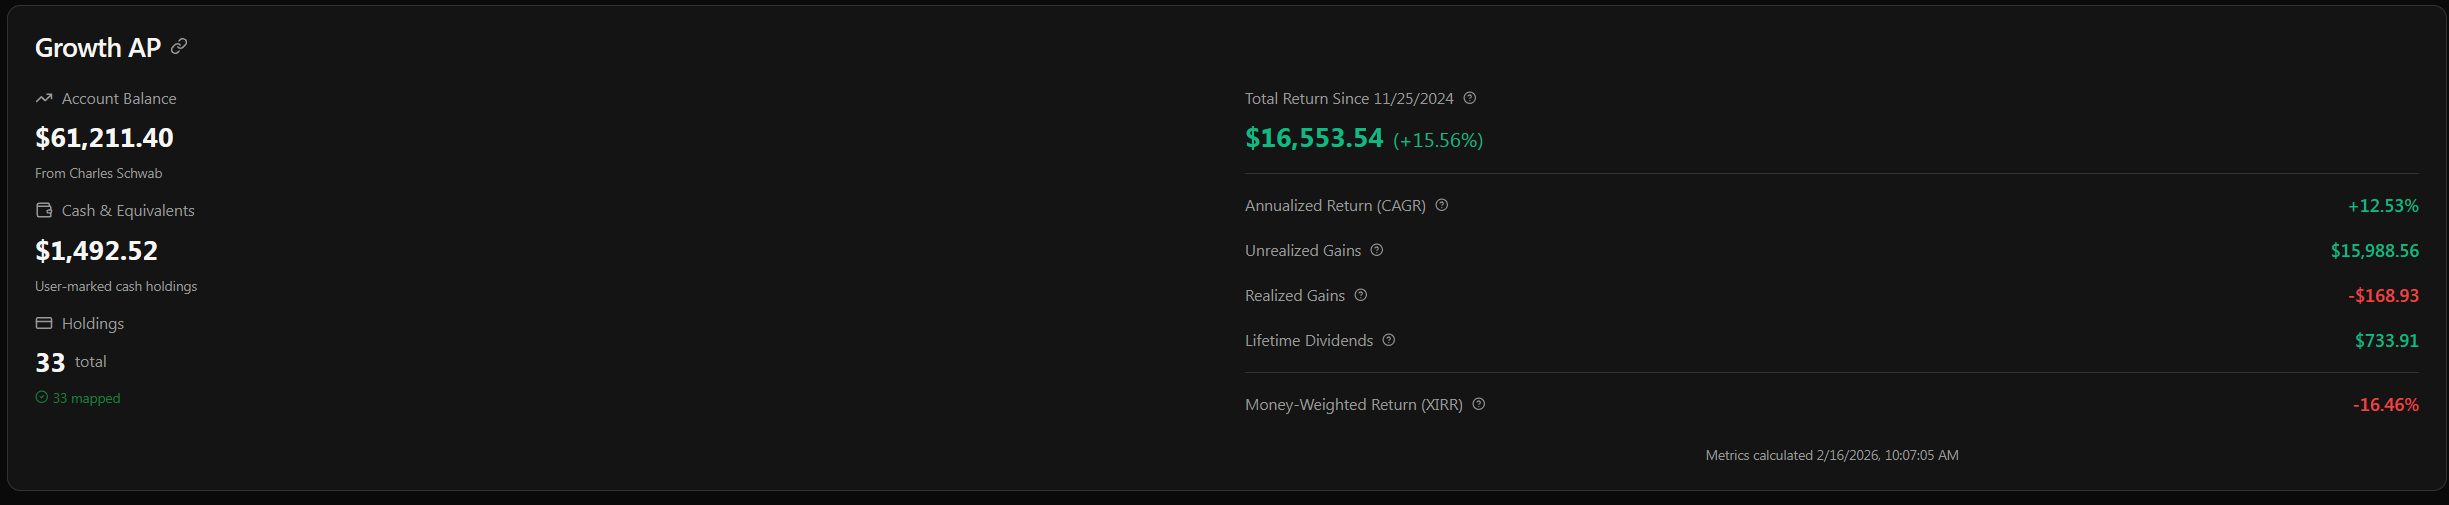
The Performance Card
This is the big card at the top of your portfolio. It shows you the key numbers at a glance:
Total Portfolio Value - What everything is worth right now
Cash Balance - How much cash is available
Unrealized Gain/Loss - How much your current positions are up or down
Realized Gain/Loss - Profits or losses from positions you've already sold
Total Dividends Received - All dividend income collected
CAGR - Your compound annual growth rate since inception
For Plaid-connected portfolios, this card automatically uses your real brokerage data. For manual portfolios, it calculates everything from your entered transactions. Either way, you get the same comprehensive performance overview.
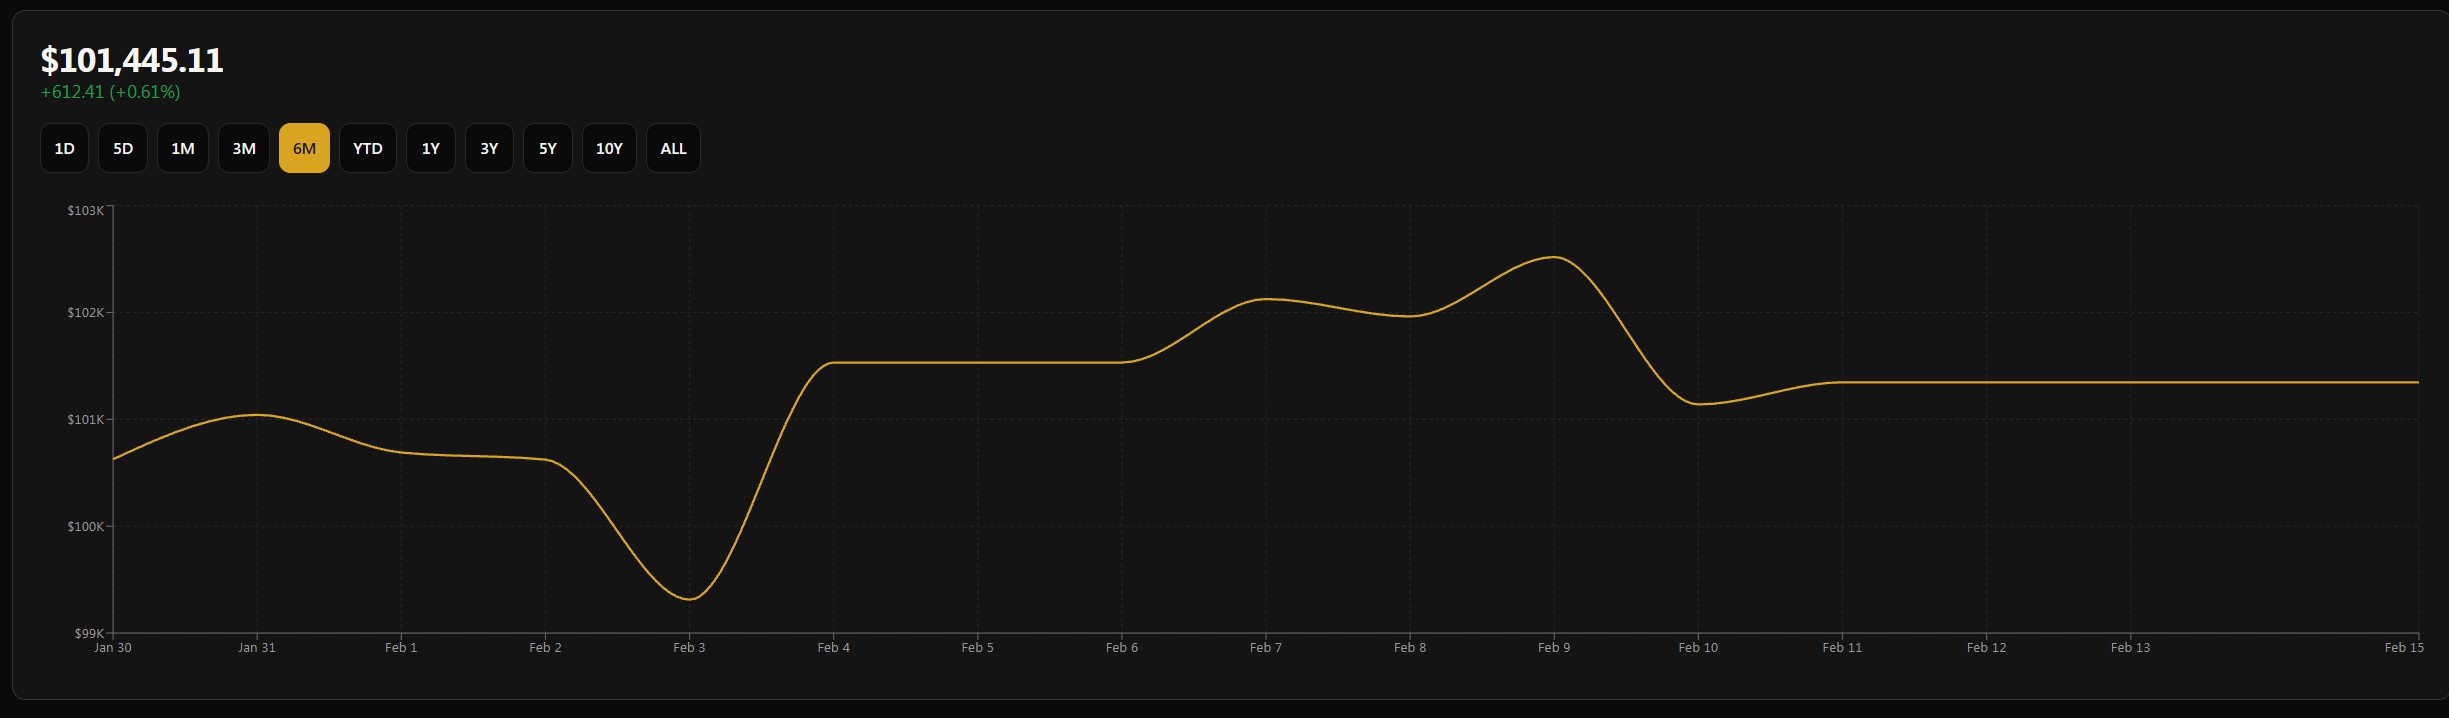
The Portfolio Chart
Right below the performance card you'll see the portfolio value chart. This shows how your portfolio has performed over time. You can switch between different timeframes:
1D, 5D, 1M, 3M, 6M, YTD, 1Y, 3Y, 5Y, 10Y, ALL
Click any of those buttons and the chart updates instantly. It remembers your last selected timeframe too, so when you come back it'll be right where you left it. The chart shows your total portfolio value plotted over the selected period, and at the top you'll see the gain or loss for that specific timeframe. So if you switch to 1Y, you'll see exactly how much your portfolio grew or shrank over the last year.
For intraday timeframes like 1D and 5D, we show timestamps with hours. For longer periods, you'll see dates.
Positions Tab
This is where you see everything you currently hold. The positions table shows:
Symbol and Company Name
Shares - How many you own
Average Cost - What you paid on average per share
Current Price - Latest closing price
Market Value - Current value of the position
Gain/Loss - Both dollar amount and percentage
DRIP Toggle - Turn dividend reinvestment on or off per holding (more on this below)
For Plaid portfolios, you'll see a similar table but populated with your real brokerage data.
Transactions Tab
Your complete trade history lives here. Every buy, sell, deposit, and withdrawal is logged with the date, type, symbol, shares, price, and total amount. You can filter by transaction type, date range, or symbol to find exactly what you're looking for. There's also pagination for portfolios with a lot of history so the page stays fast.
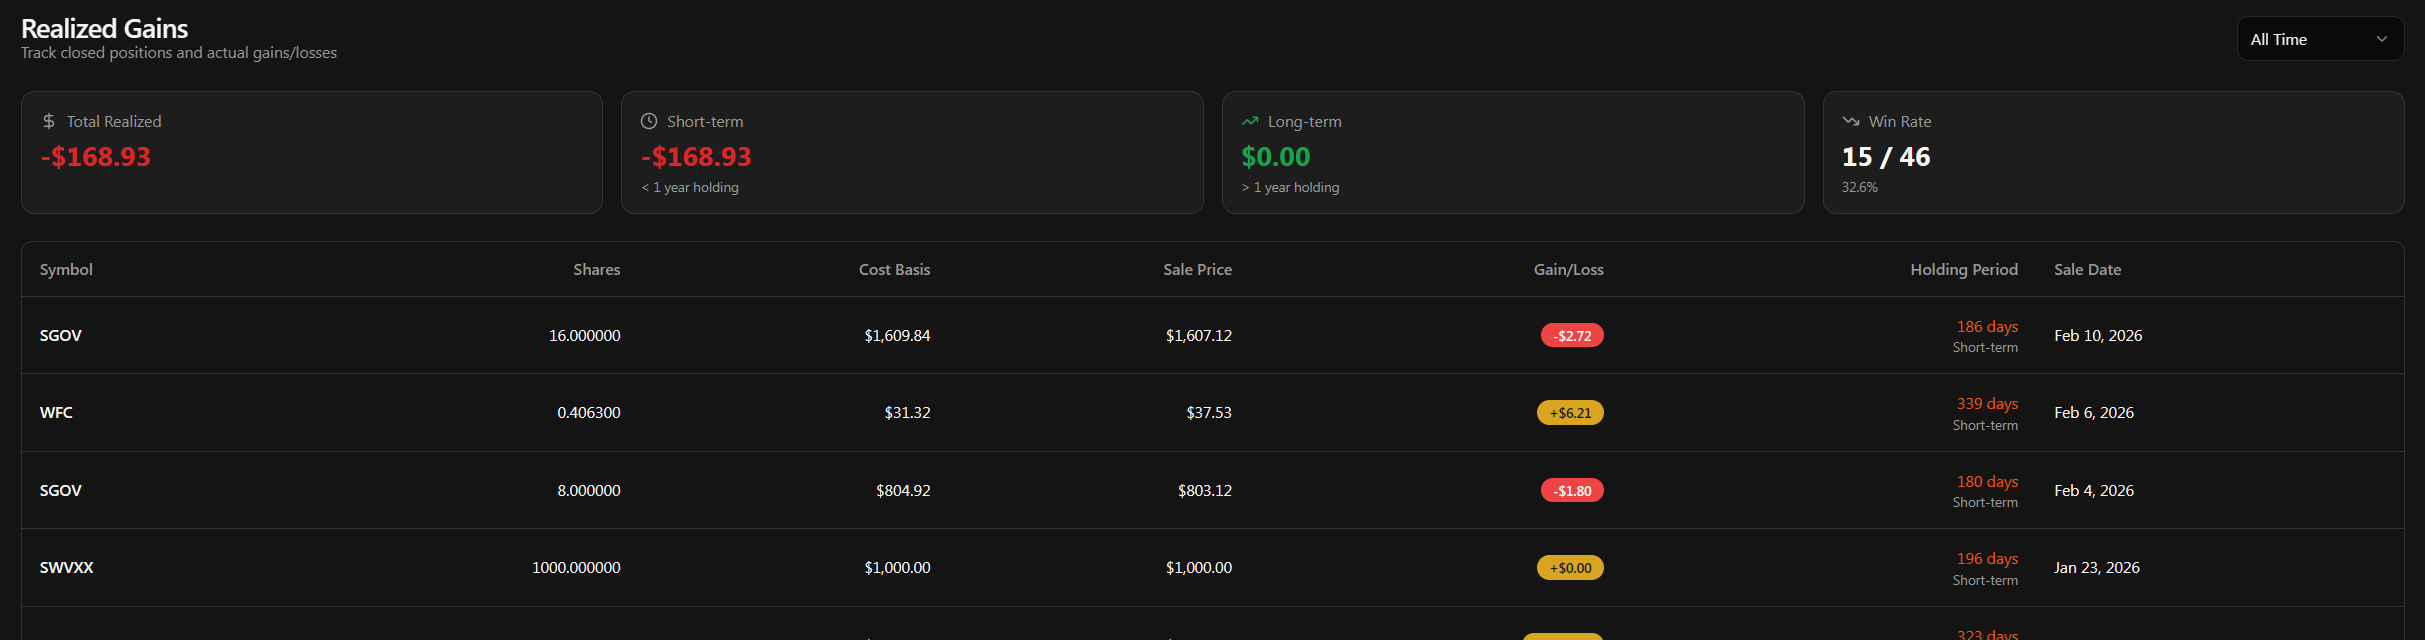
Realized Gains Tab
This one's important come tax season. The Realized Gains tab shows you every position you've closed out, with:
Symbol - What you sold
Buy Date and Sell Date - When you bought and sold
Gain or Loss - How much you made or lost
Short-Term vs Long-Term - Automatically calculated based on holding period (under 1 year = short-term, over 1 year = long-term)
You can filter by year to see just your 2025 gains, your 2026 gains, or whatever period you need. Really helpful for keeping track of your tax obligations without having to dig through your brokerage's confusing tax documents.
Analytics - The Deep Dive
Alright, this is where it gets really interesting. Below your chart and above the tabs, you'll find the Analytics section. This gives you a bird's-eye view of your portfolio from multiple angles. Once you have positions, it populates automatically.
Sector Allocation
A visual breakdown of how your portfolio is distributed across sectors. You'll see a chart showing what percentage of your portfolio is in Technology, Healthcare, Financial Services, Energy, and so on. This is incredibly useful for spotting concentration risk. If you see 60% of your money in one sector, that might be intentional.. or it might be a wake-up call to diversify a bit.
The chart also shows position counts per sector so you know if you've got 10 tech stocks and only 1 healthcare stock, for example.
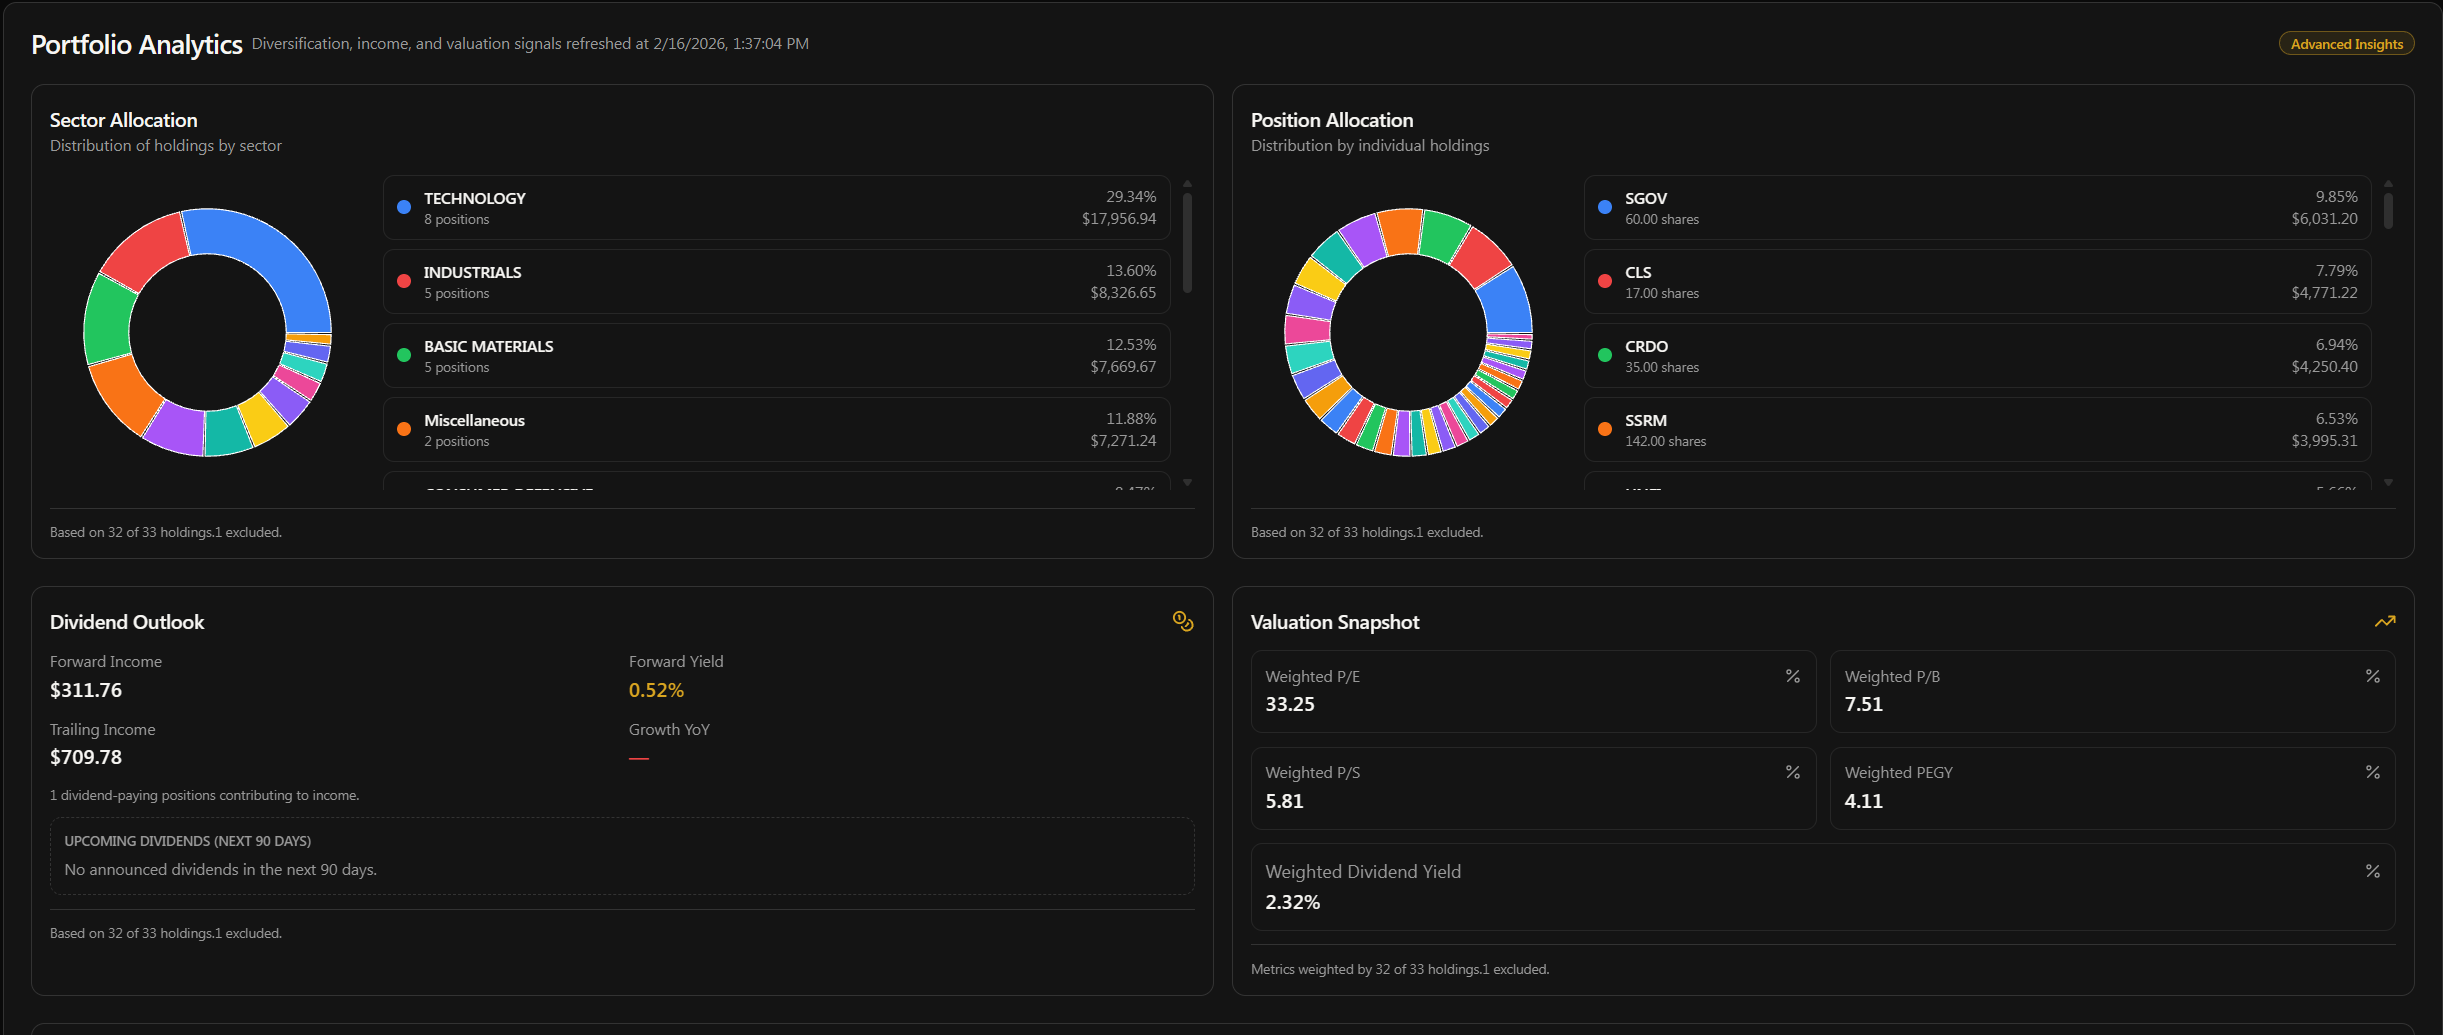
Dividend Outlook
If you hold any dividend-paying stocks, this section is gold. Here's what you get:
Forward Annual Income - Projected income based on current dividend rates
Forward Yield - Your portfolio's blended dividend yield
Trailing Income - What you actually received over the last 12 months
Income Growth % - Year-over-year change in your dividend income (requires 24+ months of data)
Dividend-Paying Positions - How many of your holdings actually pay dividends
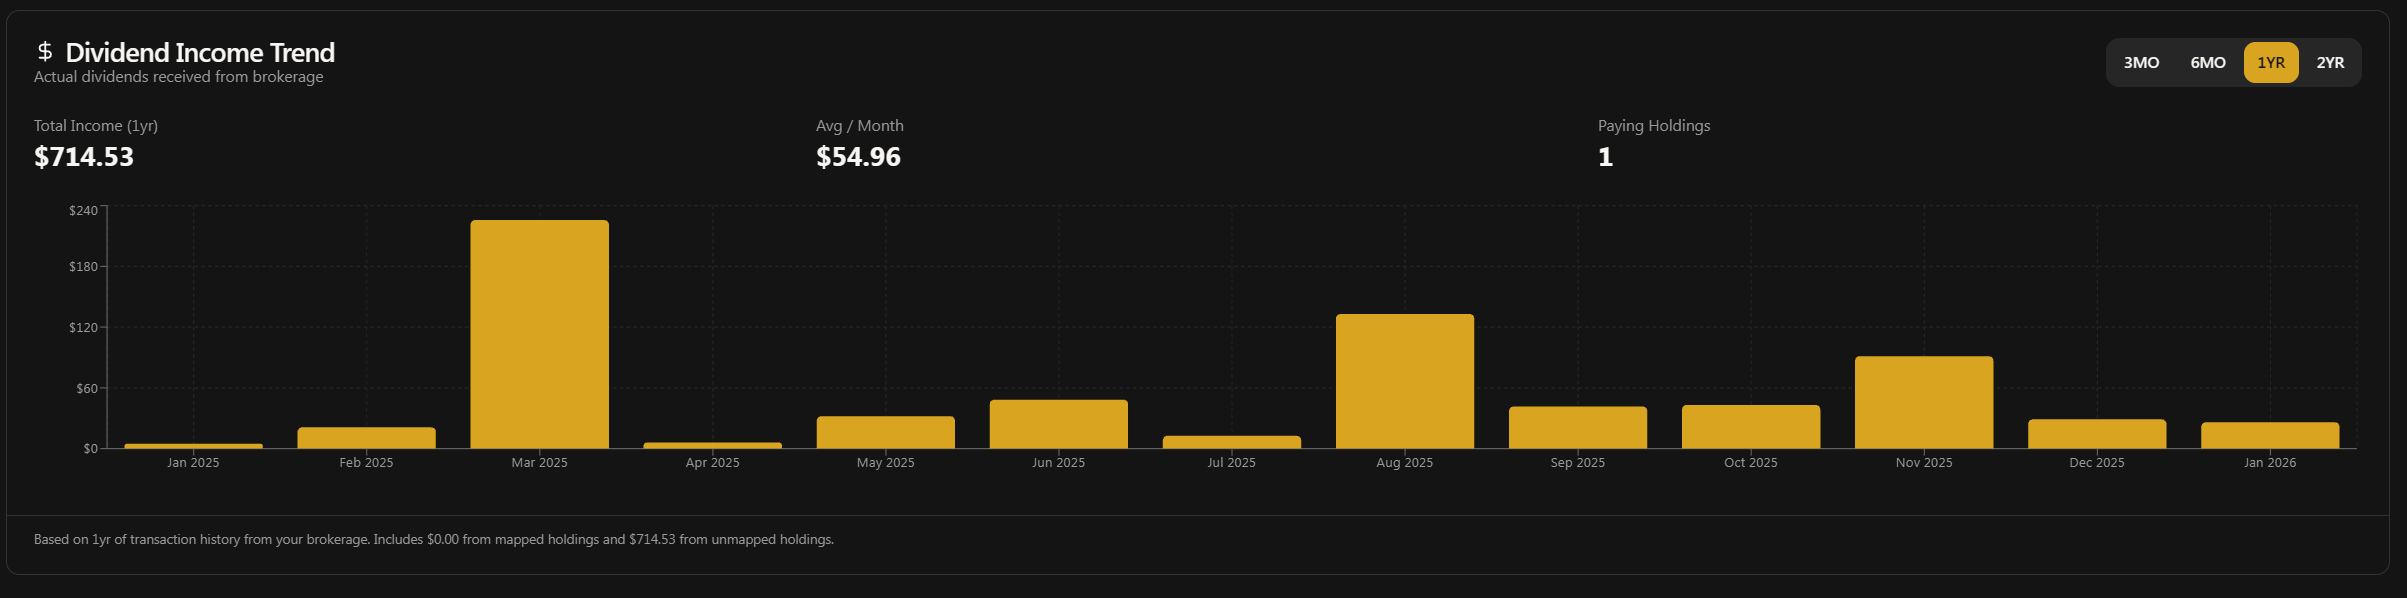
Monthly Income Trend Chart - A bar chart showing your dividend income month by month
Portfolio Valuation Metrics
This shows weighted valuation metrics across your entire portfolio. Instead of looking at each stock individually, you get the big picture:
Weighted P/E Ratio - Portfolio-weighted price-to-earnings
Weighted P/B Ratio - Portfolio-weighted price-to-book
Weighted P/S Ratio - Portfolio-weighted price-to-sales
Weighted PEGY - Portfolio-weighted PEG-yield ratio
Weighted Dividend Yield - Blended yield across all positions
These are calculated based on each position's weight in your portfolio, so a stock that's 20% of your portfolio has more influence on the weighted metrics than one that's 2%. It's a quick way to see if your portfolio overall is trading at a reasonable valuation or if it's getting stretched.
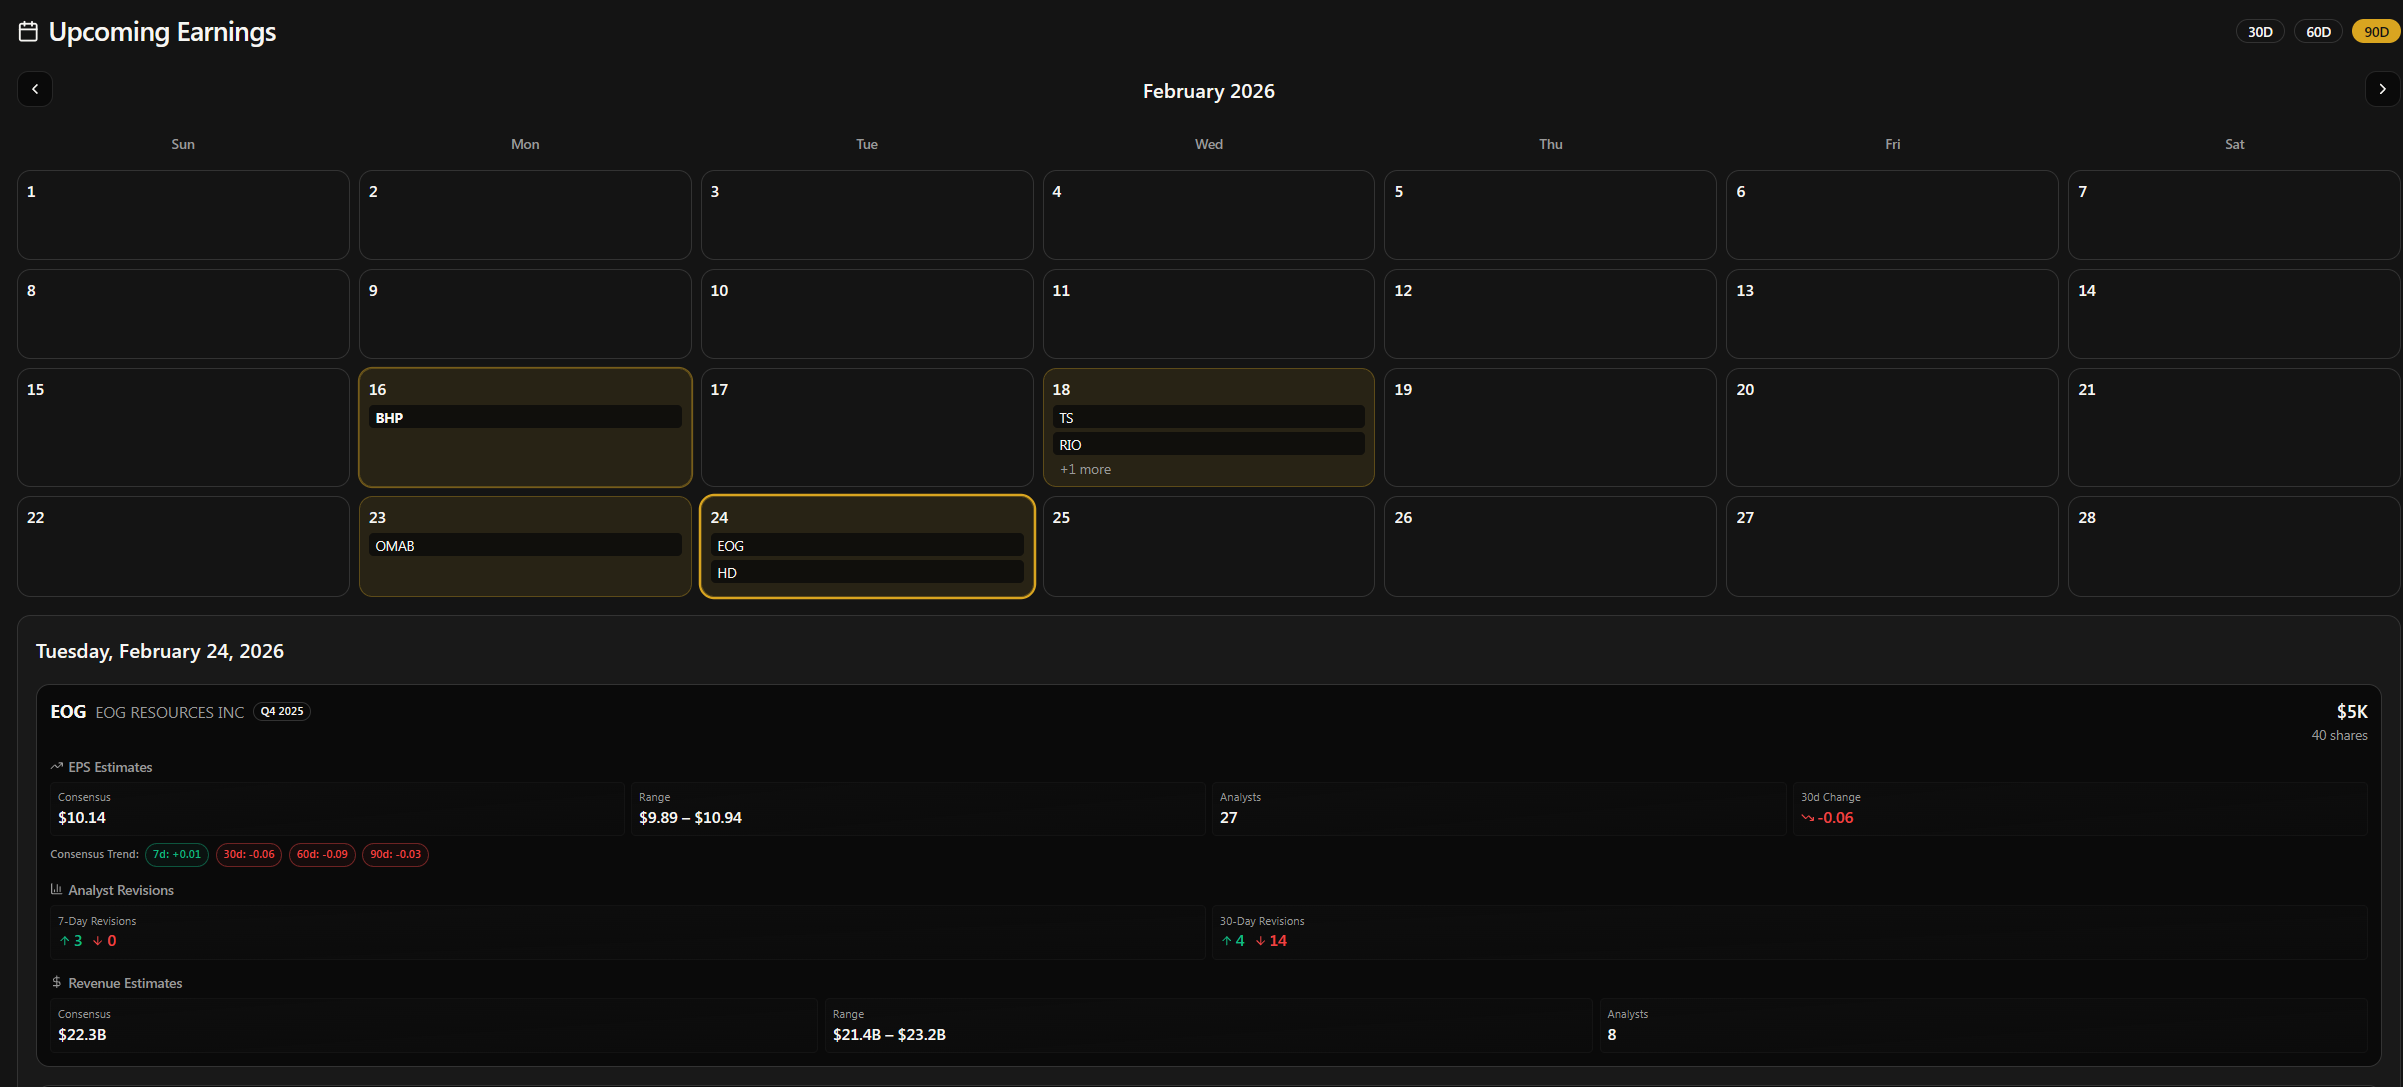
Earnings Calendar
Below the analytics card, you'll find the Earnings Calendar. This shows you when your holdings are scheduled to report earnings. No more getting surprised by an earnings miss on a stock you forgot you owned. The calendar lays it all out so you can prepare ahead of time. You may additionally click on any of the dates to see earnings details and estimates.
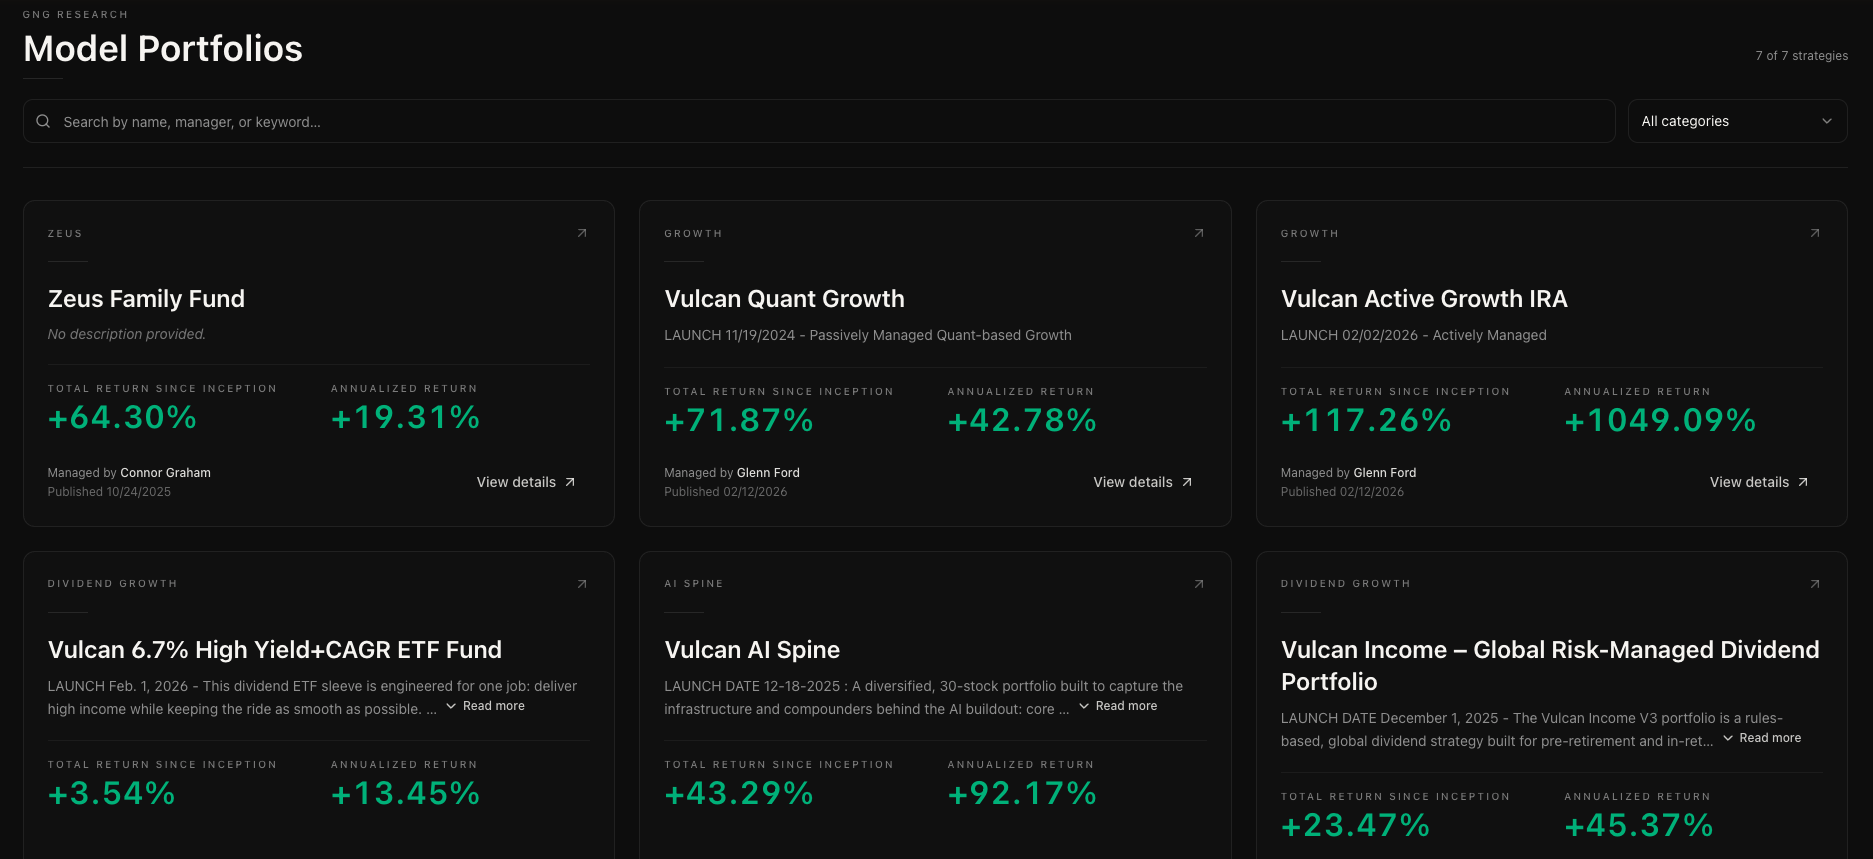
Model Portfolios
In addition to your own portfolios, GNG has a collection of model portfolios curated by our research team. These are real portfolios with real positions that we maintain to showcase different investment strategies.
What Are Model Portfolios?
Model portfolios are read-only portfolios maintained by the GNG team. You can browse them, study their holdings, see their performance, and use them as inspiration for your own strategy. Think of them as "here's one way to do it" examples.
How to Browse Them
Navigate to Model Portfolios in the navigation menu. You'll see all available models listed with their names and descriptions. Click into any one of them to see the full portfolio view, complete with positions, performance, analytics.. everything you'd see on your own portfolio, just in read-only mode.
Using Them for Inspiration
The best way to use model portfolios is as a starting point for your own research. See a stock in the Dividend Growth model that catches your eye? Click the ticker to go to its company details page. Or use the "Analyze in Research Terminal" button to pull all the model's holdings into the screener for deeper analysis. They're meant to spark ideas, not to be copied blindly.
DRIP - Dividend Reinvestment
DRIP stands for Dividend Reinvestment Plan. On GNG, you can toggle DRIP on or off for each individual holding in your manual portfolio.
How It Works
In the Positions Tab, you'll see a DRIP toggle next to each holding
Turn it on and when that stock pays a dividend, the system automatically reinvests it by buying more shares at the current price
Turn it off and dividends just go to your cash balance
This is great for long-term compounding. Instead of manually re-buying shares every time a dividend hits, just flip the toggle and let it work for you. You can mix and match too.. maybe you want DRIP on for your growth holdings but dividends in cash for your income positions. Totally up to you.
Connecting to Other Tools
One of the things that makes the portfolio more than just a tracker is how it connects to other tools on the platform. Your portfolio isn't isolated.. it feeds into everything else.
Research Terminal Bridge
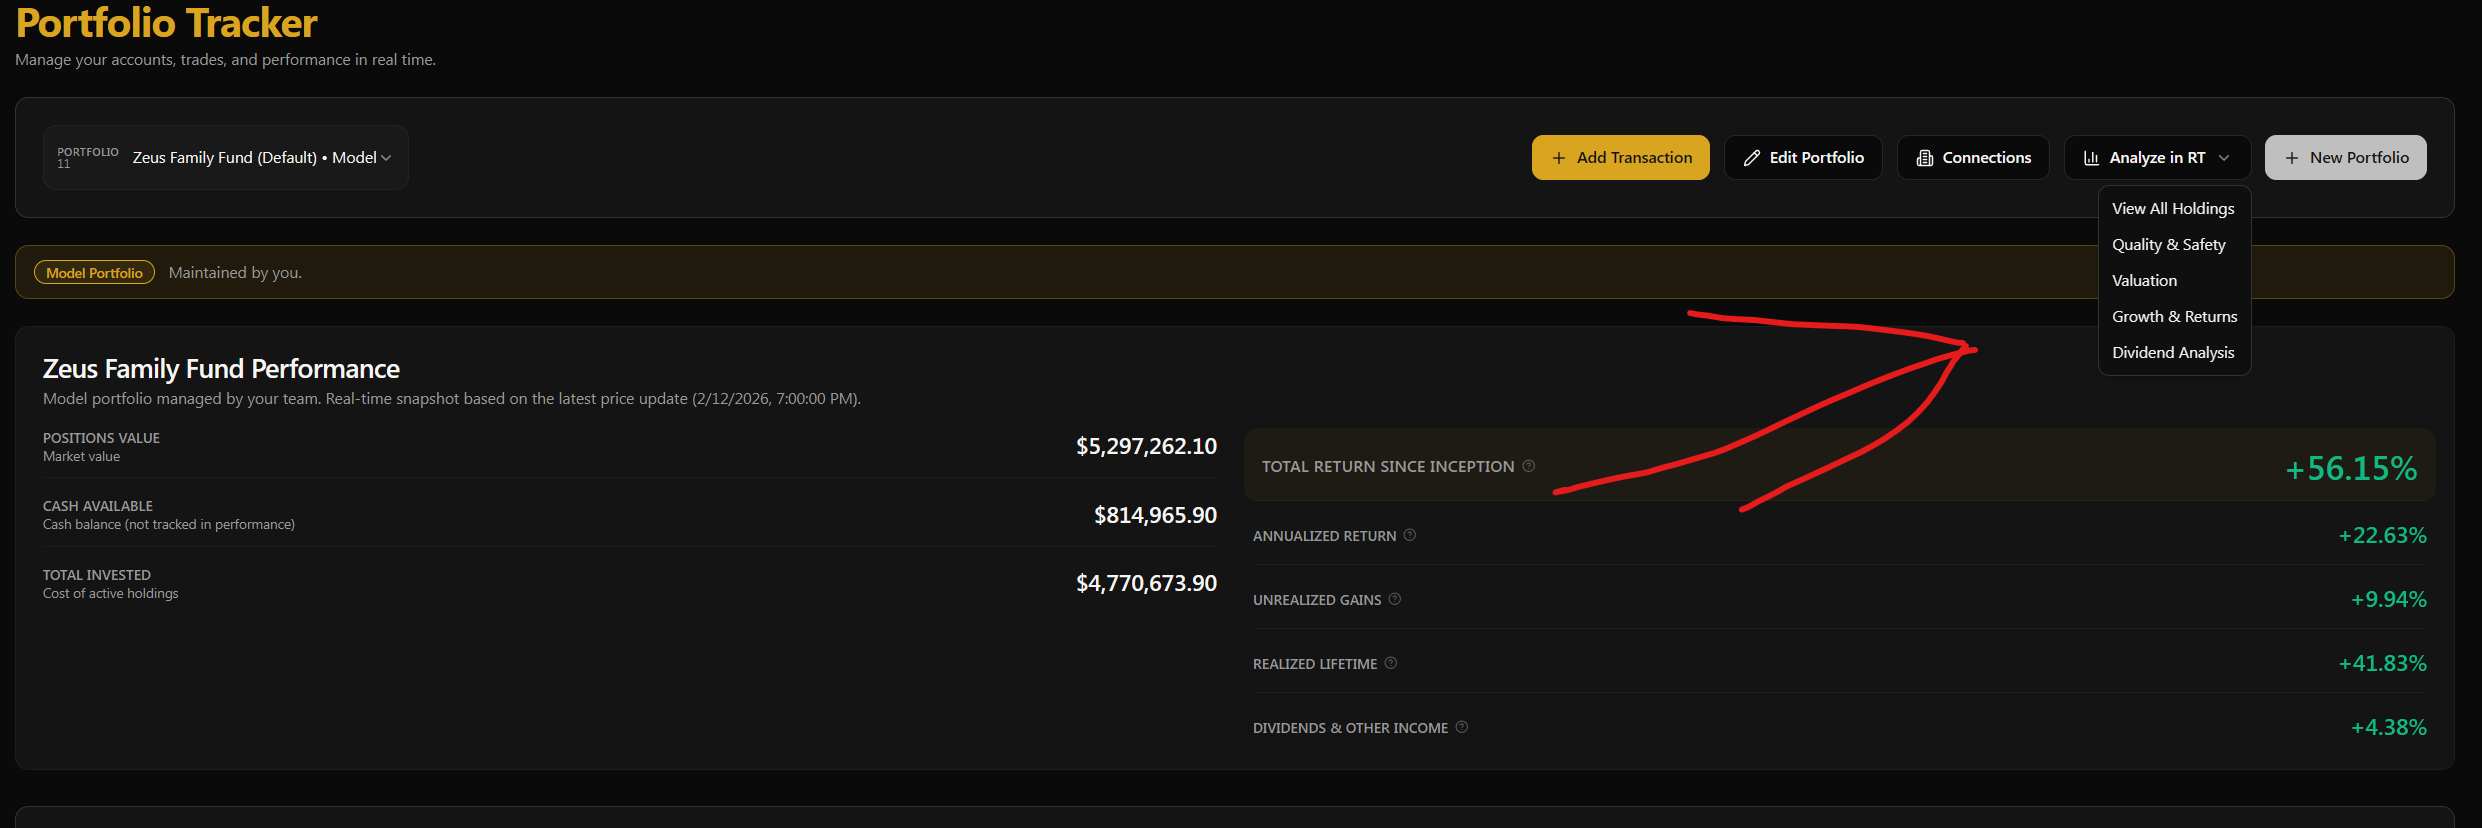
This is one of my favorite features. On your portfolio page, you'll see an "Analyze in Research Terminal" button (or "Analyze in RT" on mobile). Click it and you get a dropdown with pre-built views:
View All Holdings - See every position in the Research Terminal
Quality & Safety - Jump to quality and safety scores for your holdings
Valuation - See valuation metrics for everything you own
Growth & Returns - Growth rates and return metrics
Dividend Analysis - Dividend-focused view of your portfolio
It sends all your portfolio symbols directly to the Research Terminal with the selected view pre-loaded. So you go from "what do I own?" to "how does what I own look on 150+ metrics?" in one click. Honestly, once you use this, you won't go back to looking up stocks one at a time.
Dividend Forecaster
Head over to the Dividend Forecaster tool and you can select your portfolio as the input. It'll run Monte Carlo simulations on your actual holdings to project future dividend income under different scenarios. Really powerful for retirement planning or just seeing where your income stream is headed.
BackTester
The BackTester lets you test strategies against historical data. You can pull in your portfolio positions to see how different allocation changes or timing decisions would have played out in the past. It's not a crystal ball, but it's a great reality check on your strategy.
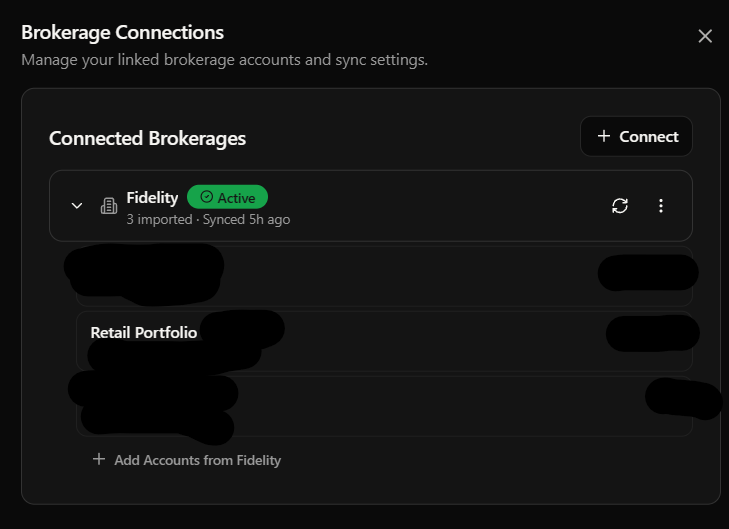
Plaid Security and Control
I know connecting your brokerage sounds like a big deal, so let me be transparent about how this works.
Read-only access. Plaid only reads your holdings and transaction history. It cannot place trades, move money, or make any changes to your brokerage account. Period.
Bank-level encryption. Plaid is used by thousands of financial apps and handles the security so we never see your brokerage login credentials.
Disconnect anytime. You can disconnect your brokerage from the Brokerage Connections manager. Once disconnected, syncing stops immediately.
Data retention. After disconnecting, synced data is retained for 90 days and then automatically cleaned up.
If you want the full technical details on how Plaid works in GNG, check out the technical updates article from February 2026 where I go deep on the architecture. But the short version is: it's safe, it's read-only, and you're in control.
What's Available on Each Tier
I always want to be transparent about this stuff. Here's the honest breakdown:
Free members get a limited number of manual portfolios with basic performance tracking. You can add transactions, see your positions, and get the core experience. It's genuinely useful for getting started and seeing if the platform is right for you.
Pro members unlock unlimited manual portfolios, Plaid brokerage connections, full analytics (sector allocation, dividend outlook, valuation metrics), the earnings calendar, DRIP toggles, and the Research Terminal bridge. This is where the real analytical power lives.
Premium and Enterprise gets everything, including collaboration features for shared portfolios. The full suite with nothing held back.
The free tier is a real portfolio tracker, not a demo. It just has limits on how many portfolios you can create and doesn't include the advanced analytics. If you're tracking one or two portfolios manually, free works great. If you want the full experience with Plaid and analytics, Pro is where it's at.
Pro Tips from Someone Who Built It
Here are the shortcuts and tricks I use myself. These will save you time and help you get more out of the portfolio tracker:
Use Plaid if your brokerage supports it. Manual entry is fine, but automatic syncing means zero data entry mistakes and you never forget to log a trade. It's just easier and more accurate.
Turn on DRIP for your long-term compounders. If you're not touching a position for years, let the dividends automatically reinvest. You'd be surprised how much those small reinvestments add up over a decade.
Check the Dividend Outlook regularly. Your forward income projection changes as you add or remove positions and as companies adjust their dividends. It's a great pulse check on your income strategy.
Use Model Portfolios as starting templates. Don't just look at them.. use them as inspiration for building your own strategy. See how we allocated across sectors, what yield range we targeted, and then adapt it to your own goals.
Hit "Analyze in RT" before making changes. Before you buy or sell anything, send your current holdings to the Research Terminal and check the Quality & Safety or Valuation views. It takes two seconds and might save you from a bad decision.
Check Realized Gains before tax season. Don't wait until April to figure out your capital gains situation. The Realized Gains tab with year filtering gives you everything you need to plan ahead. Know your short-term vs long-term gains early.
Use the Dividend Forecaster with your actual portfolio. The Monte Carlo simulations are way more meaningful when they're running on your real holdings instead of hypothetical ones. Select your portfolio in the forecaster and see where your income stream could be in 5, 10, or 20 years.
Wrapping Up
That's the Portfolio Tracker from top to bottom. Between manual tracking, Plaid syncing, the analytics suite, DRIP, model portfolios, and the bridges to our other tools.. there's a lot here. But the beauty of it is you can start simple with just one manual portfolio and gradually explore the more advanced features as you get comfortable.
This is the second in the Getting Started series. If you missed the first one on the Research Terminal, definitely go check that out too. Next up will likely be the Dividend Forecasting tools or the Analytical Tools suite, but as always, drop a comment below and let me know what you'd like to see covered next.
If you have any questions or run into anything weird, message us on Rocket Chat or leave a comment. We're always here to help.