Connor is getting married next week, and I’ll be gone all week (other than Tuesday).
The Monthly Top Buy List Screening Article + ZEUS Update (including 2 versions, the one my family uses and the GNG ZEUS, which is designed to be prudent for most typical investors).
Since I’ll be gone until Wednesday, January 28th, and the market can do crazy stuff over a week, I wanted to make sure to get this really important update done before my trip.
Just in case the market falls into a correction while I’m gone.
Bottom Line: The Next Time There Is A Correction (If, not when), The Stock Market Will Be March 2009 Level Undervalued (Potential Buying Opportunity of A Lifetime)
That’s a bold claim, I know. It is something that almost no one has the courage to say, but I do, so let me walk you through the math and reasoning. Specifically, let me walk you through the 3 most important facts to keep you calm IF the market freaks out in the next few weeks.
Fact 1: Medium-Term Earning Growth Are Ridonculous! 😉
S&P growth estimates are holding steady at about 20% FCF/share growth for the next year.
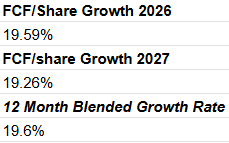
The 12-month blended FCF growth rate is down by 0.4% but still an incredible 19.6%.
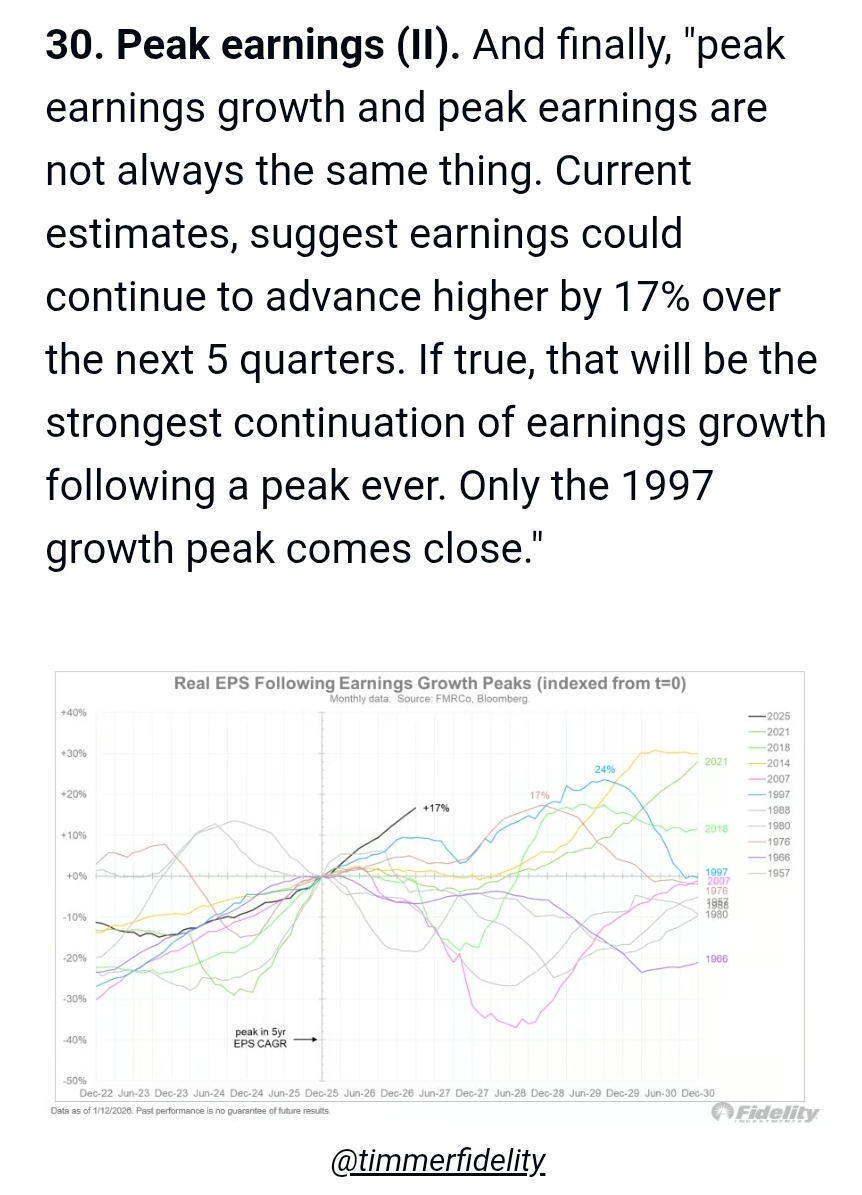
Even if the growth rate in earnings has peaked historically, earnings continue to grow, and that’s what FactSet is expecting for the next 3 years.
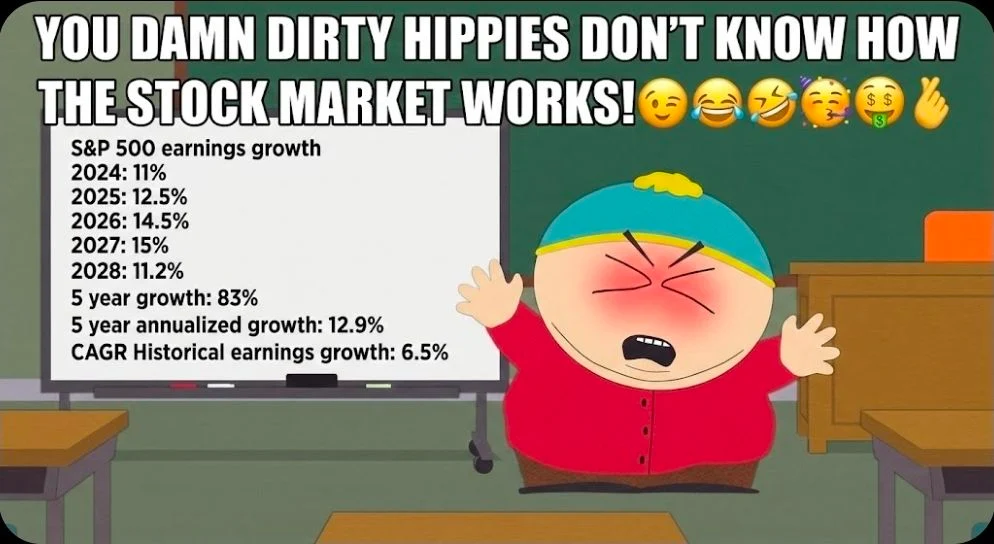
2028 EPS Growth Up From 10.2% At Start Of Year To 11.2% Last Week To 12% This Week
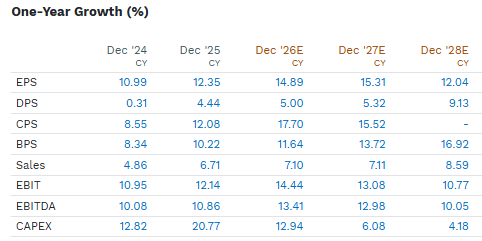
This would be the first 5-year streak in US history of double-digit EPS growth.
CAPEX estimates keep rising each quarter as AI spending estimates keep rising.
Indicating a good chance of rising estimates in the future.
Fact 2: Q4 Earnings Season Update (What The Market Will Be Focusing On Next Week)
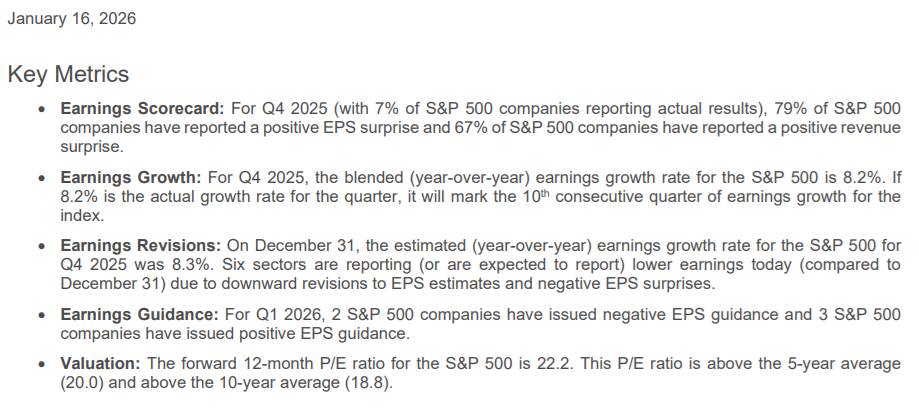
So 33 companies have reported so far, and 79% of them have beaten expectations (76% is the historical beat rate).
76% of companies normally beat because estimates come down ahead of earnings (low bar to clear).
This quarter's estimates were rising into earnings (a higher bar to clear).
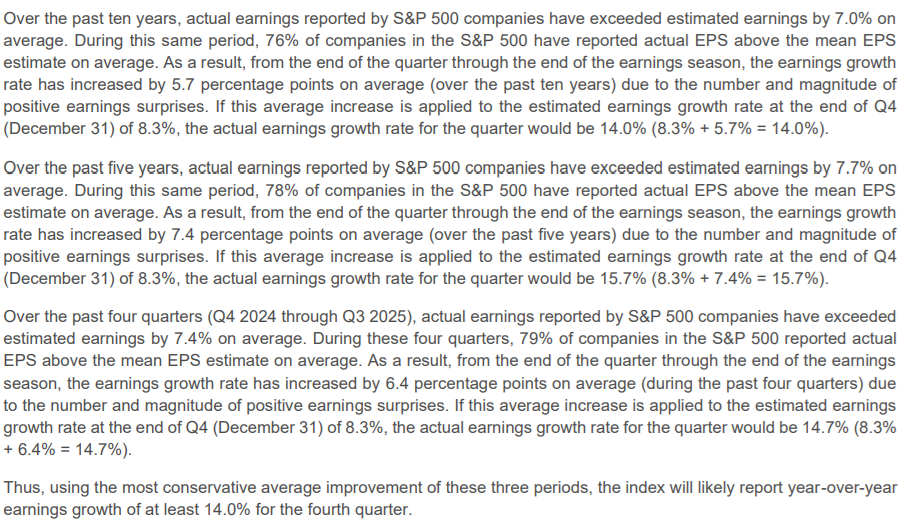
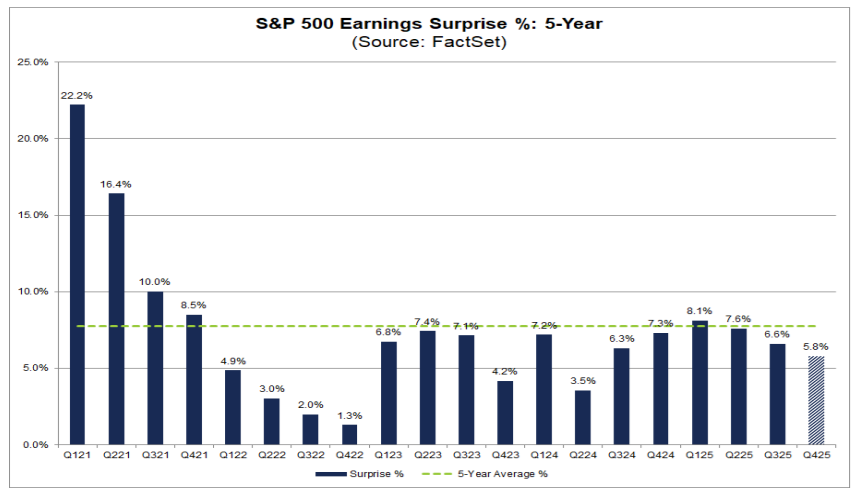
Analysts went into Q4 earnings season expecting 8.4% growth, and as John Butters of FactSet points out, the 10-year average beat is 7%, so a 14% growth quarter seems highly likely.
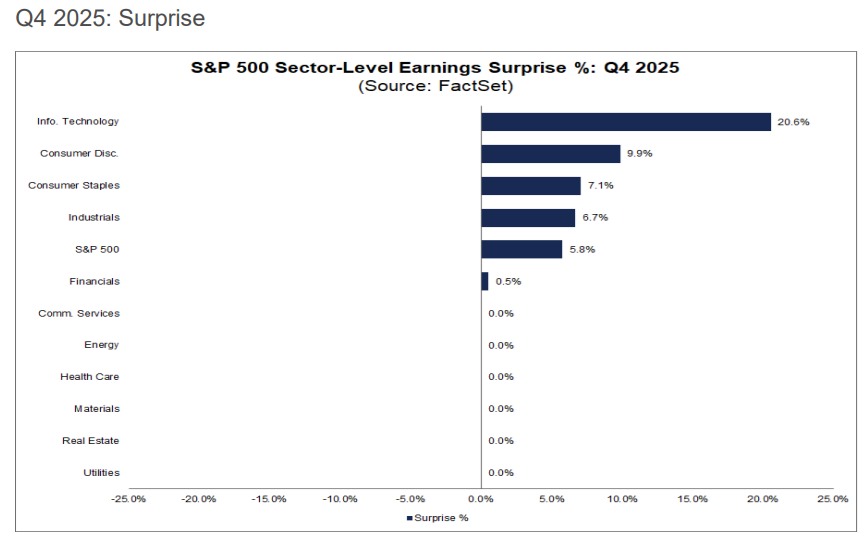
5.8% beats so far, which doesn’t sound impressive, BUT remember tech and communication usually beat the most (and they haven’t reported yet).
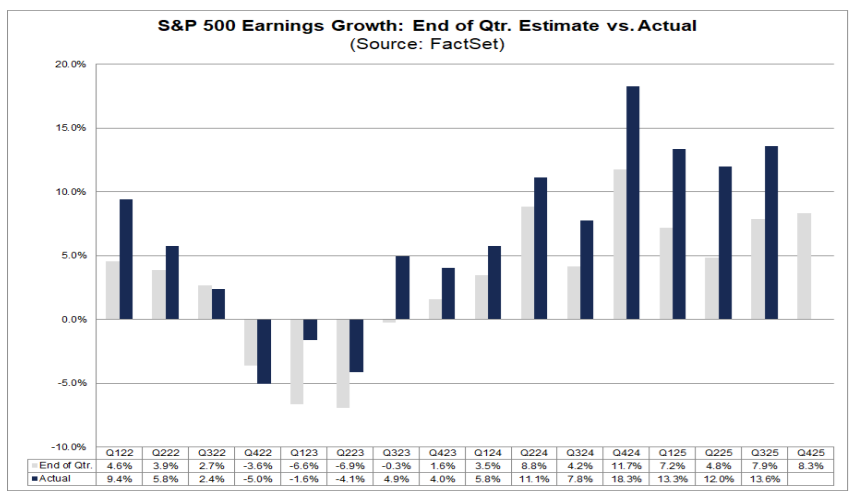
What this shows is the expectations for earnings vs actual earnings over time. You can see that in recent years, the beats have gotten really impressive, such as the Q2 12% growth vs 4.8% expected. Right now, based on 33 actual reports, we’re at 8.3% with John Butters estimating a 14% most likely outcome.
Notice also how Q4 (the Christmas quarter) is usually the top growth quarter (outside of growth scares like 2022, when rates were soaring at the time).
For Index Investors, Earnings Season Is Usually Your Friend
2026 Is Expected to be a VERY Good Year For Earnings
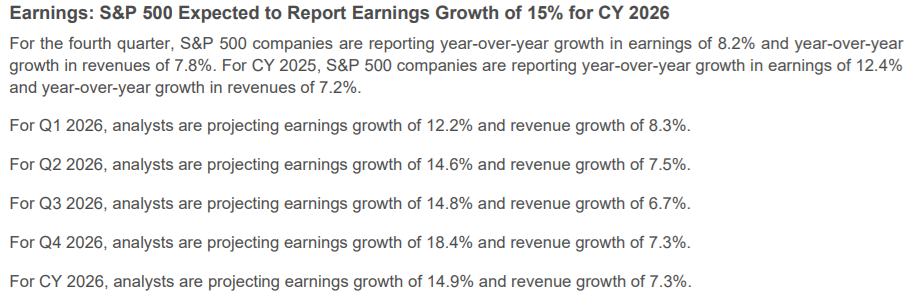
Growth is expected to accelerate all year, rising to 18.4% rate by the end of the year (with some very strong top-line growth and major margin expansion).
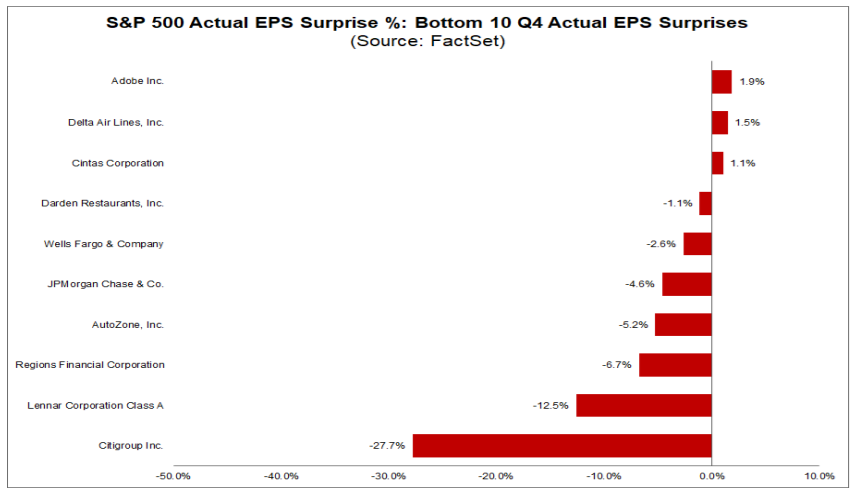
Company Specific Earnings Surprises: Wild Price Swings
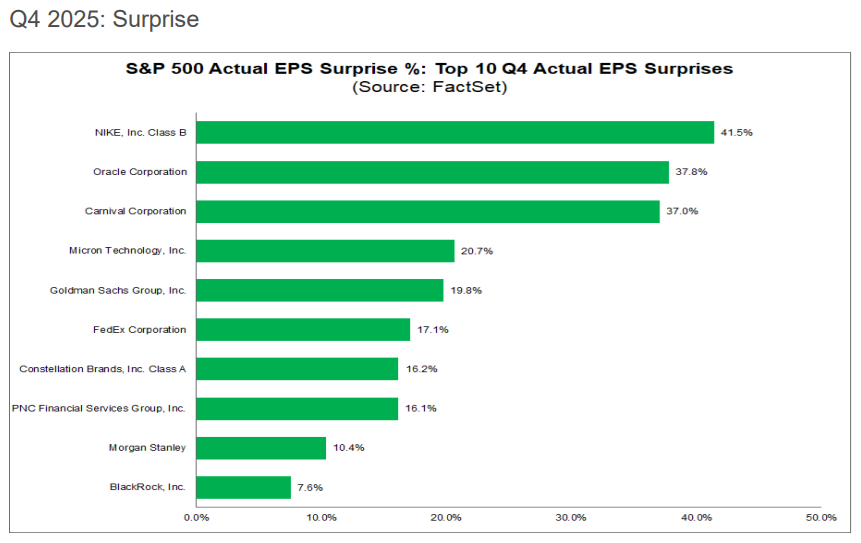
If you own individual stocks, you know that there can be some WILD swings (Oracle went up almost 40% in a single day, making Larry Ellison, very briefly, the richest man in the world).
And of course, a miss can lead to 20% to 30% declines in a day.
And here is the current Q4 earnings consensus.
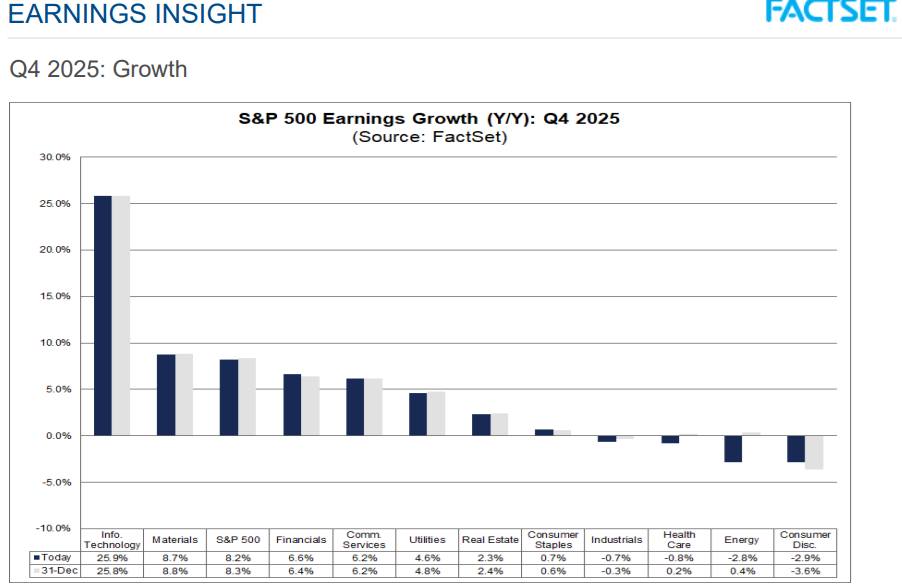
Not a great quarter for many sectors (though they have been rallying in recent days due to the value rotation).
The weakness in tech is a potentially intriguing opportunity where the market ignores absurdly great fundamentals in favor of a narrative (the great value rotation is FINALLY here).
Value stocks deserve their expected multiple expansion, and later this year, when their growth finally kicks in, the combination of strong technicals and strong earnings growth should allow for a very broad market rally.
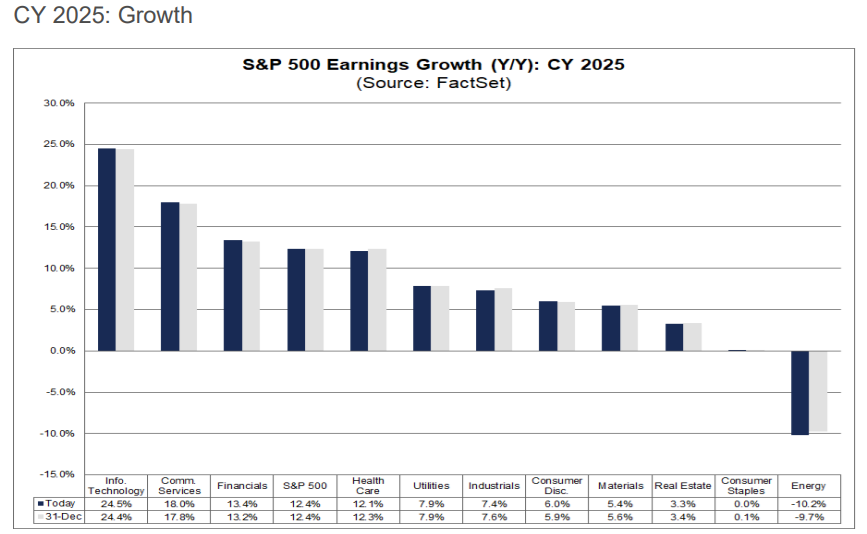
A wonderful 2025 for corporate fundamentals is expected to be followed by an even better 2026 (and 2027 slightly better than 2026).
Since the market is 12 months forward-looking, unless 2027 estimates come way down, the fundamentals momentum should avoid an “Air gap” quarterly decline.
Fact 3: S&P Valuations- Still Excellent When Factoring In Growth
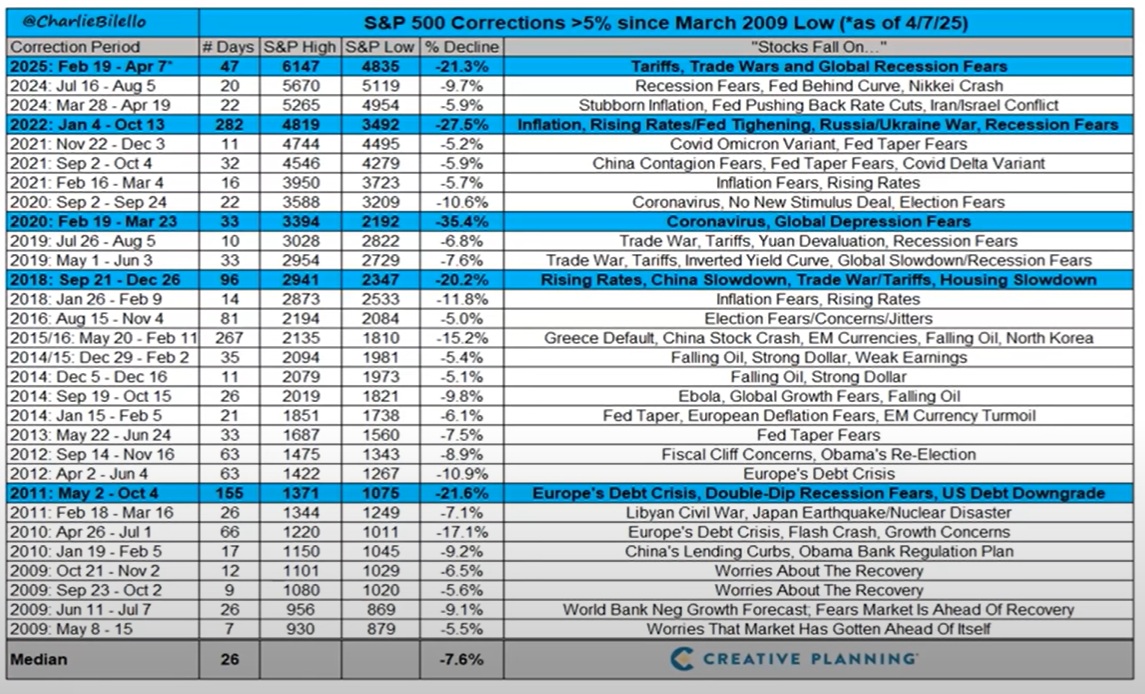
It’s natural to imagine that when the stock market is up, things are about to mean-revert, and that’s normal. After all, on average, we’ve had a 10% to 15% correction every 6 months since 2009 (and 2020).
But guess what? Earnings growth is now 2X its historical levels and as we just saw, that’s not expected to stop anytime soon.
So let’s take a look at the latest S&P PEGY analysis to see how it looks.
Earnings Growth Is So Strong, The S&P Is Historically Speaking, As Undervalued as average Bear Market Lows
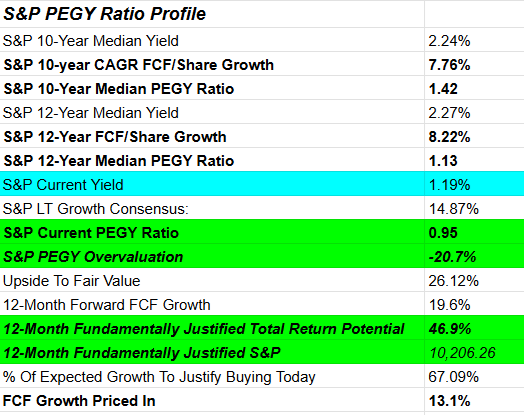
Do I actually expect the stock market to go up 47% in the next 12 months? Heck no. That would surprise even me. BUT what this analysis is saying is that we’re currently priced for 13% FCF growth in the next year vs 20% expected.
That means that even if FCF growth comes in at “just” 13% (vs a historical 5.5%), the stock market isn’t overpriced.
And if the growth estimates in 12 months are the same as today? And FCF/share grows by 20% as expected? Then, if the S&P were 47% higher (10,206), then the PEGY ratio would be 1.13 (the 12-year median).
In other words, a 47% 12 month rally, the kind you get only from bear market lows? (like March 2020, Oct 2022, and April 2025)? That would be justified by fundamentals.
The Most Remarkable Takeaway From This Table
What if we get a normal 10% to 15% correction this year? As is very likely (I’d be surprised if we didn’t, but not confused, since the tailwinds this year are legion).
Remember that the average bear market (a 25% decline) sees the market bottom at a 20% historical discount.
March 2020 (Pandemic)
October 2022 (Great Inflation)
April 2025 (Tariff Crisis)
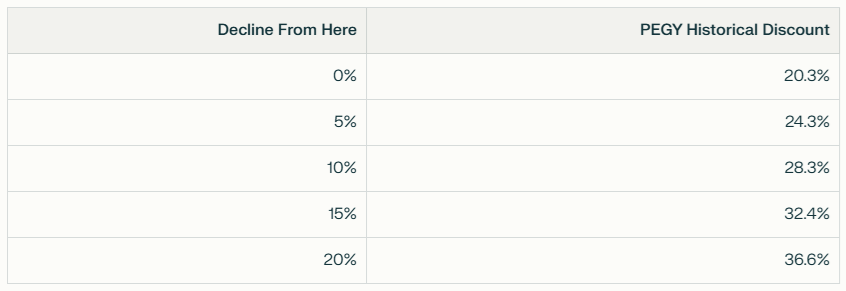
We're at a 20% historical discount right now, thanks to growth that’s 2X to 4X better than historical norms.
And no slowing in growth expected through at least 2028
IF AND ONLY IF the growth rates hold up (they are driven by AI spending, so unless that breaks, growth rates are likely to be resilient), then even a 5% pullback results in stocks becoming very undervalued.
In fact, in 2009, the market was 33% historically undervalued.
That’s a 58% stock market crash, and stocks being 33% undervalued were the buying opportunity of a lifetime.
In other words, a 15% correction from here? And stocks are (based on PEGY) the same valuation as March 2009.
What You Need To Be Thinking In The Next Correction
Why do people worry about stocks falling 2.5% in a day? It’s a historically meaningless decline. But of course, if stocks are down 2.5% in a day, then the worry is that the headlines are so frightening that maybe stocks will fall 5% in a week, and 10% in a month, and 20% this quarter, and maybe this is the start of the next great 40+% crash!
If I could assure you that the next correction was a 10% correction? You wouldn’t worry about it at all.
Well, no one can promise that the next correction will be a normal 10% to 15% correction. BUT what I can show you is that the fundamentals currently are so strong, that WHEN we get a 10% to 15% correction, unless the fundamentals have significantly weakened, a 10% to 15% correction isn’t going to be a “reasonable time to buy” it will be a table-pounding, Buffett-style “Fat pitch” for investors.
And that’s why I wanted to make sure that I got this report out before I left for Connor’s wedding, just in case the market fell 10% in the week I’m gone, I wanted to have as many GNG members know, that it wasn’t just a good time to buy, it would likely be a fantastic time to buy.
What If You Don’t Believe In The PEGY Ratio?
If we get a recession, then growth rates go negative, and then multiples compress, and bad things happen to stocks. Fortunately, as long as the AI boom remains intact, likely future growth rates will be faster than historical, and that means that even a regular recession doesn’t result in the kind of “lost decade” for stocks that some investors worry about.
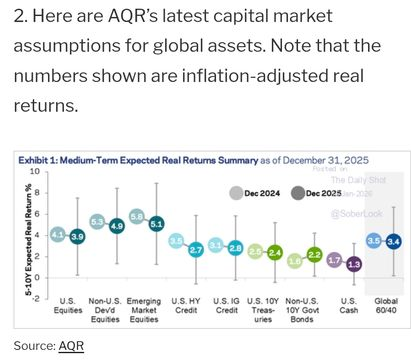
Vanguard and AQR both expect modest gains from stocks in the next decade (I think the current fundamentals justify much more), but even 4% to 5% CAGR return for stocks isn’t a “lost decade”.
Morningstar Bottom-Up Discounted Cash Flow Fair Value
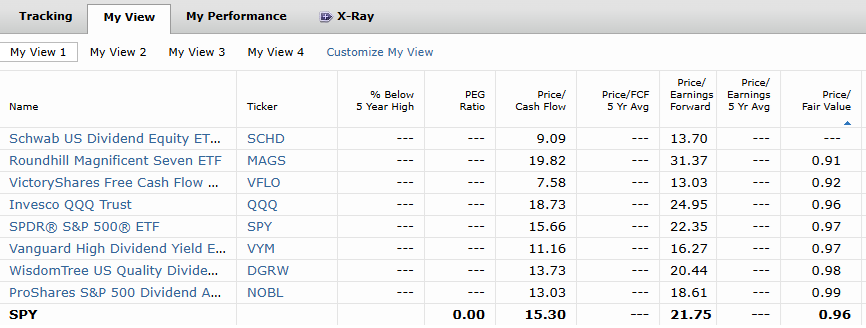
Bottom-up means you start with the individual stocks in an index fund, and then estimate the growth-adjusted fair value (using a discounted cash flow analysis), and then weight them like the index. And that’s how Morningstar estimates the S&P is 3% undervalued, based on the individual fair value estimate for every stock in the S&P (based on individual expert models).
The same way of estimating bottom-up fair value shows the Mag 7 at 9% undervalued 9at a 31.4 forward PE) and modest discounts for the Nasdaq, aristocrats, high-yield stocks, and even deep value stocks like VFLO.
On April 7th, 2025, at the bottom of the bear market, PEGY said stocks were 20% undervalued, and Morningstar estimated a 17% discount.
Even if you don’t believe any single model (and you should always remember every model is wrong to some extent) the point is that models that incorporate growth are showing the market at fair value (S&P PEG vs historical PEG also shows fair value).
Only if you completely ignore the objective truth of 2X (and 3X for FCF), better growth, and assume that has no bearing on future valuations, would you be worried about market valuations.
Where Is The Growth Coming From? $6 Trillion In Growth Spending
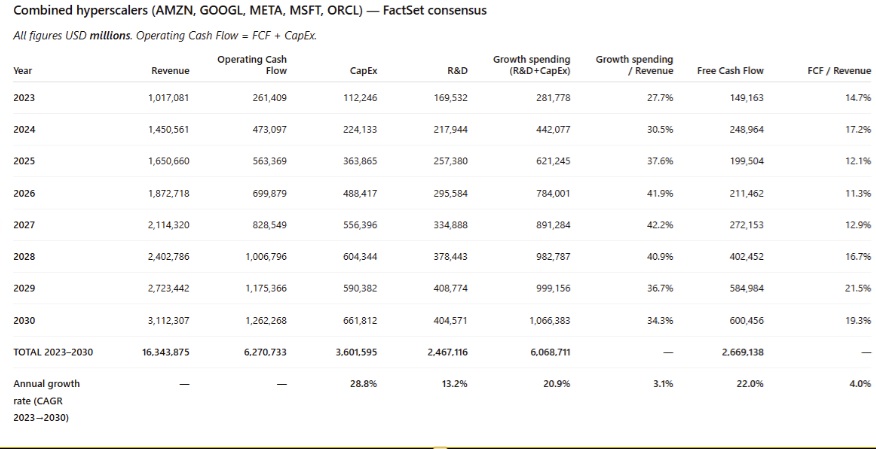
Every quarter, the growth spending estimates keep climbing, and the free cash flow growth rate is up from 18% CAGR last quarter to 22% after Q3, and that’s likely due to the $500 billion in extra growth spending (capex + R&D) expected for the 5 hyper-scalers through 2030.
Factor in buybacks and its 23% to 24% CAGR FCF/share growth.
33% to 36% CAGR for AMZN, GOOGL, and MSFT in Q3.
If big tech is growing at 27% (29% in Q3 and 26% in Q4) with FCF growth from the largest companies in the world of 23%, then shouldn’t those companies become a larger part of the index? If profits outside of tech are growing 12% and big tech grows 24% shouldn’t big tech become a larger part of the market? And wouldn’t that mean that market -cap weighted growth rates for the S&P should rise, converging over time with the largest and fastest part of the market?
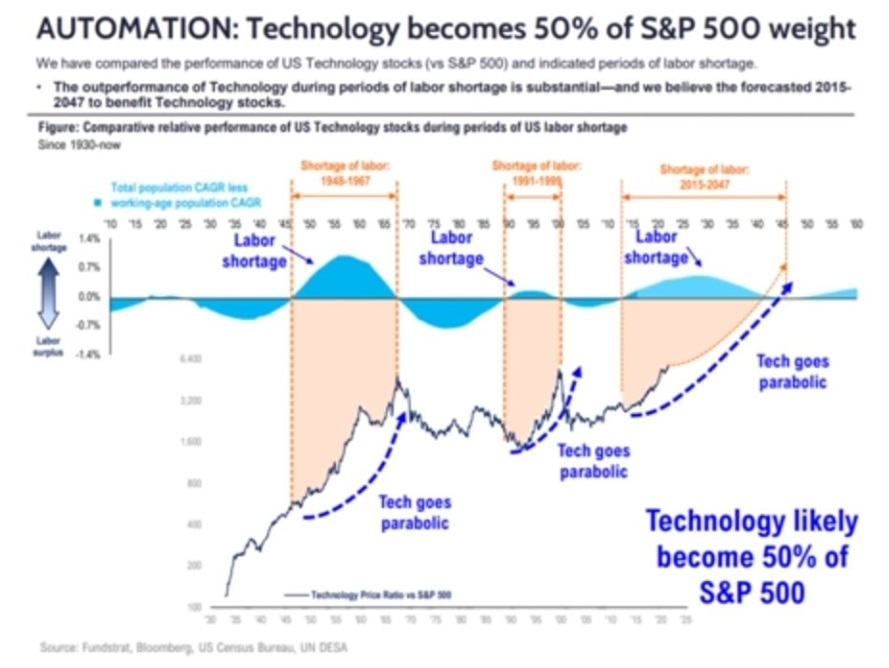
If 50% of the market is big tech and they are growing at 23% then the tech weighted contribution to the S&P is about 12%. And the rest of the index, by growing faster than zero, creates a medium-term (up to 2047 according to Fundstrat) elevated S&P EPS growth rate.
50% of S&P at 6.5% historical growth = 3.25% weighted growth.
50% tech at 23% growth = 11.5% weighted growth.
total weighted EPS growth: 15.25% CAGR
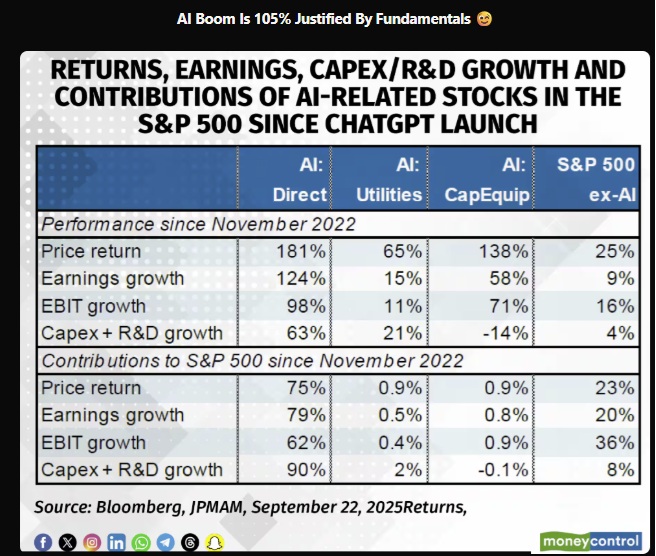
92% of growth capex spending is coming from AI stocks, driving 80% of EPS growth and 75% of stock returns.
If one part of the economy drives 92% of growth spending for long enough, eventually around 92% of EPS growth should come from that part of the economy and 92% of the stock returns and if that goes on for long enough, then eventually 92% of the stock market is AI stocks.
Automation is likely to eventually generate 90% of the economy.
Because robots and AI will generate more and more output.
And the growth rate of robots X productivity of robots will drive GDP growth.
Human businesses will still exist, but this isn’t some kind of extreme or crazy statement that 90% of growth spending leads to superior growth (as we’re seeing quarter after quarter).
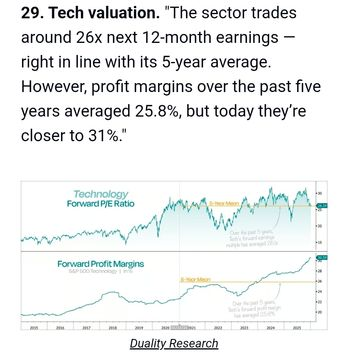
Margins keep rising, and that’s why P/S ratios do too. Historically higher margins = faster growth = higher PE. That’s not a bubble, that’s just math. That’s PEG (and now PEGY) in action.
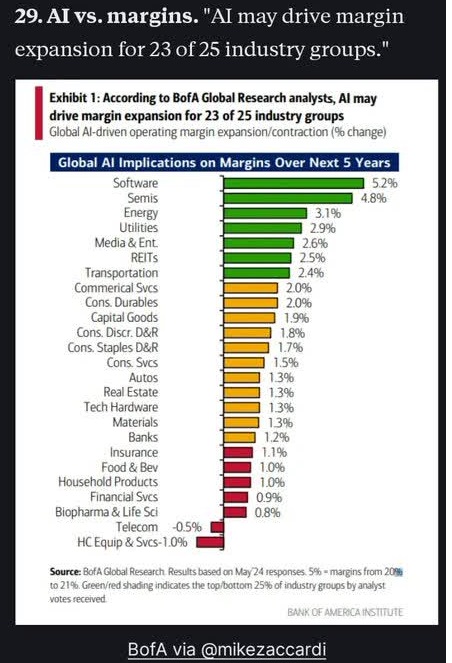
And margins are likely to keep rising, and the most for the sectors that use AI the most. The AI tech sector sees the most benefit from AI. That’s not magic, it’s intuitive.
Big Tech Gains Are Sanctified By The Righteousness Of Fundamentals 😉
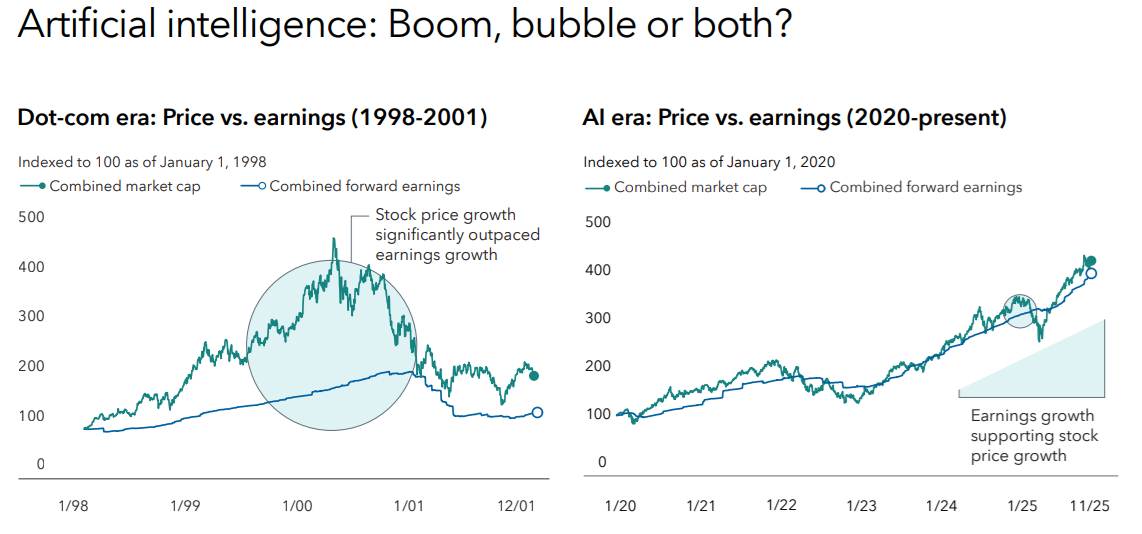
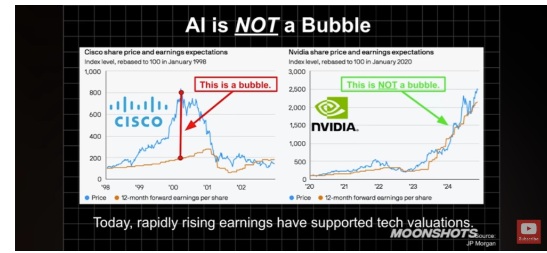
As hard as it might be to believe that big technology stocks tripling since the 2022 lows isn’t a bubble, that’s what the fundamentals clearly show.
And unless the AI growth spending completely dries up, stronger growth appears to be the “new normal” at least through 2028.
GDP Growth: So Much Stronger Than Blue Chip Economists Will Admit
A very important thing for any investor worried about bubbles and bear markets is this chart.
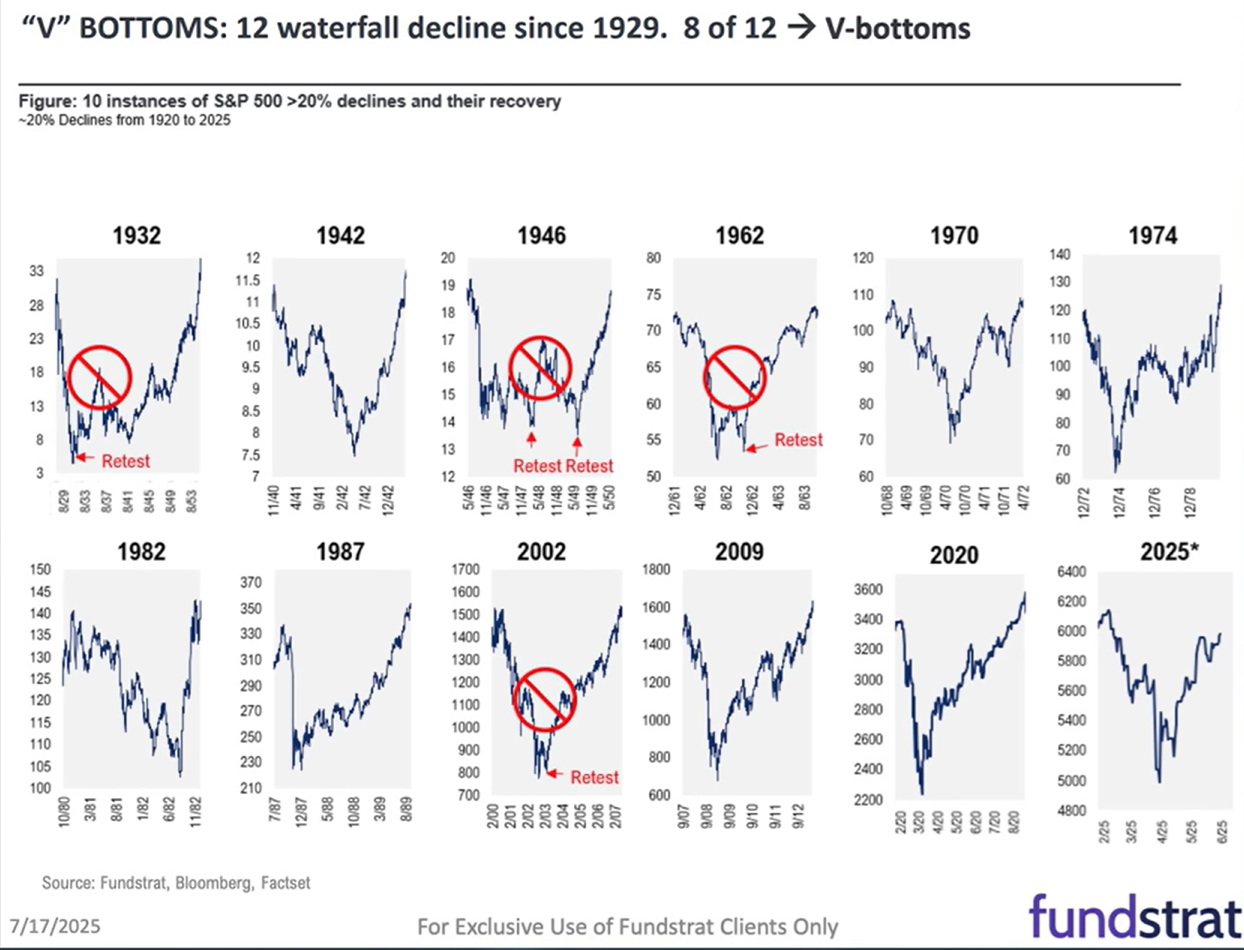
If there is no recession, then, on average, stocks experience a V-shaped recovery that takes 1.4X to 1.7X (1.55X average) time to recover.
For example, A 2-month peak-to-trough decline * 1.55X = 3.1 months from trough to new record high.
The market was back at record highs 3 months after April 7th lows.
A Shock to EVERYONE! Except Those Who Saw Tom Lee’s Chart 😉
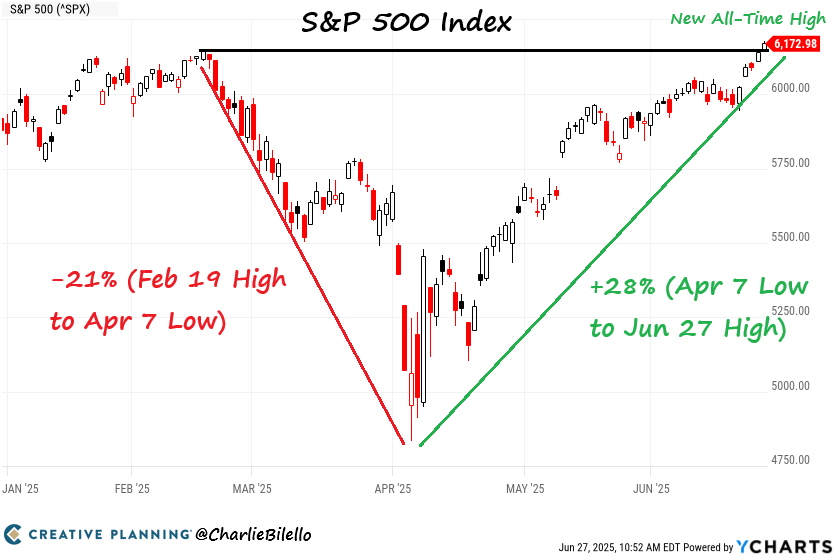
It shocked everyone! Except Tom Lee and anyone who had seen this chart.
So, if you want to know whether a correction is the start of a new bear market? There is only one question to answer.
Recession: Yes Or No
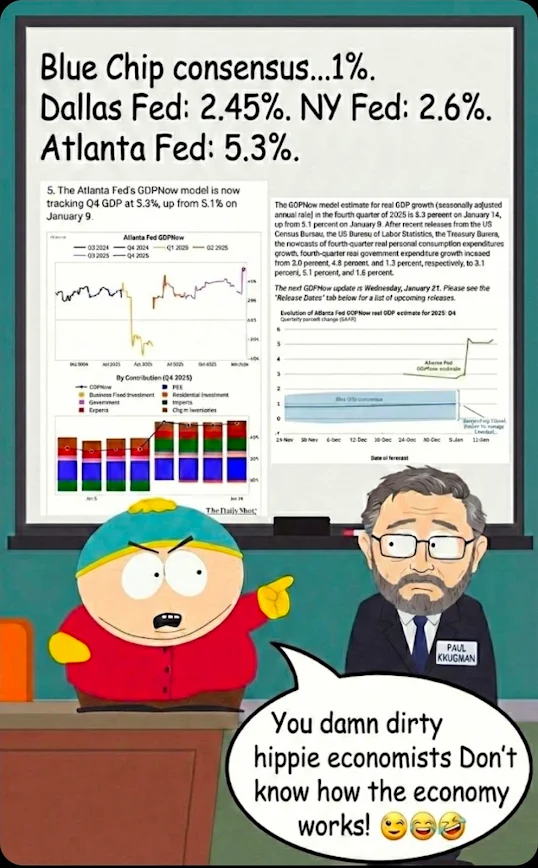
I’m surprised that economists are still so pessimistic, expecting 1% GDP growth in Q4.
Economic Reports Have Been Strongly Beating Expectations
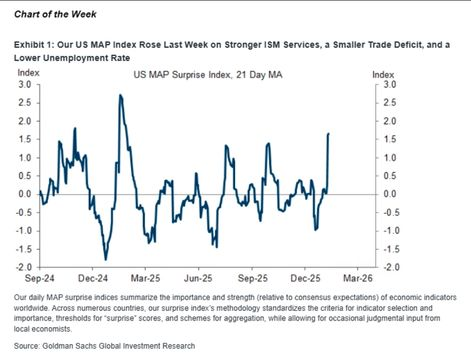
My theory is that if the consensus says 1%, it takes courage for an economist to say 2+% EVEN if their model is showing it. After all, if growth slows later, you SEEM wrong, and might lose your job if you don’t catch a future recession. But if growth is above expectations? Then no one minds. No one loses their job.
Goldman Sachs: One Of The Few Courageous Economist Teams
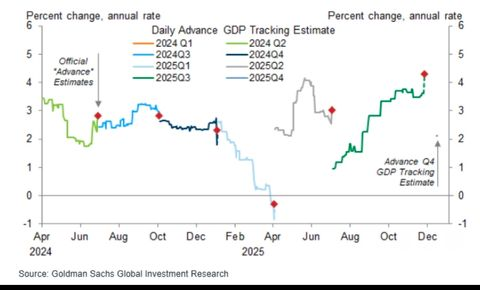
Most major economic teams have real-time trackers that are updated weekly (in-house).
You can see how Goldman’s model is tracking pretty closely with the Atlanta Fed model.
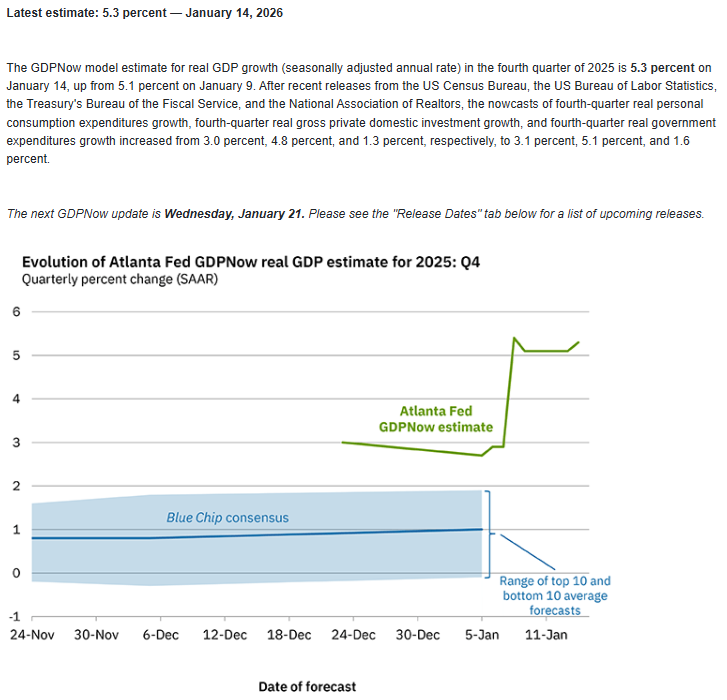
I give credit to the Atlanta Fed for fearlessly putting out their model and not caring how “crazy” it seems (last quarter, they estimated 3.5% growth, and growth came in 4.3%).
This is Why Economists Tend To Cluster Around 2% Most Years: No One Seems Crazy Predicting 2% Growth
OK, so what about the top real-time models?
Dallas Fed Weekly Economic Index: The Gold Standard Of Daily/Weekly Input Models
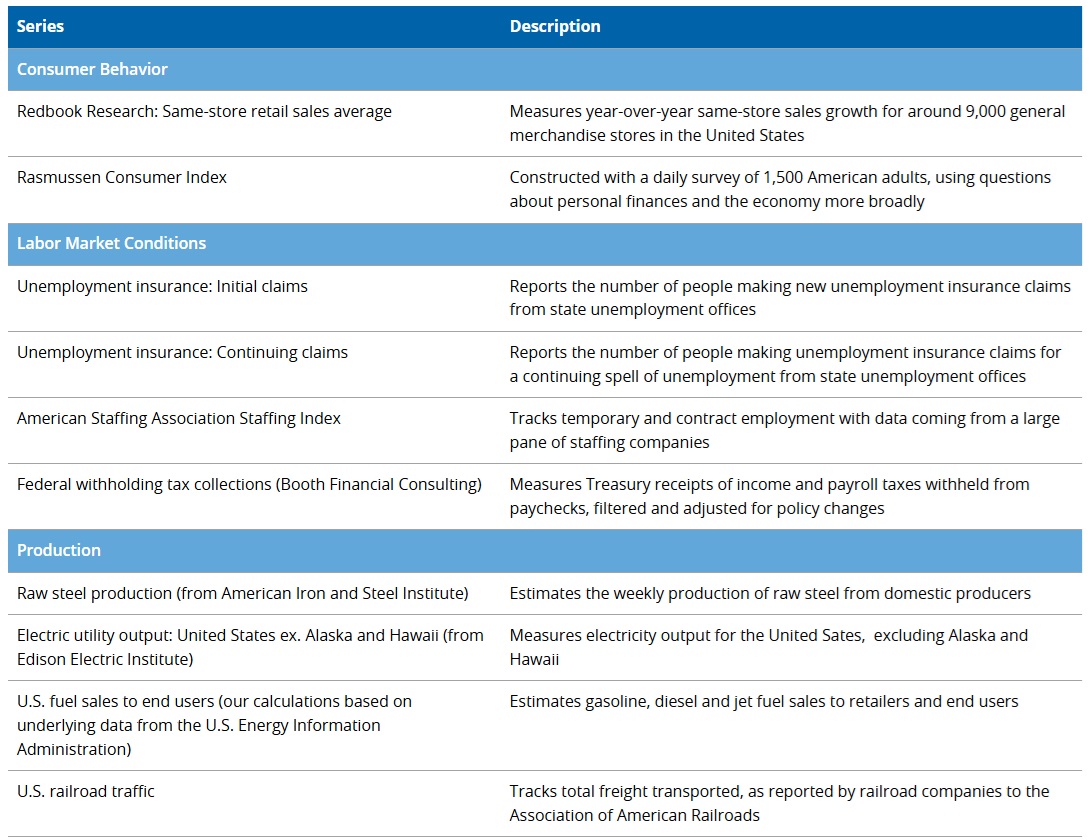
I like the WEI because it’s a model that uses hard data, and the survey data it uses is VERY accurate because it surveys the same cohorts (the Rasmussen Consumer Index surveys the same 1500 people daily) AND these consumers and businesses aren’t being asked about confidence or lack thereof, but what they are spending, buying, and shipping.
When we have reliable data on daily and weekly gasoline and electricity consumption, we don’t need surveys about how consumers feel; we can see what they are buying.
Sentiment surveys were created before we could track daily or weekly data like this. It was a proxy for “scared consumers spend less, so if sentiment surveys go south, it means the economy will LIKELY weaken.”
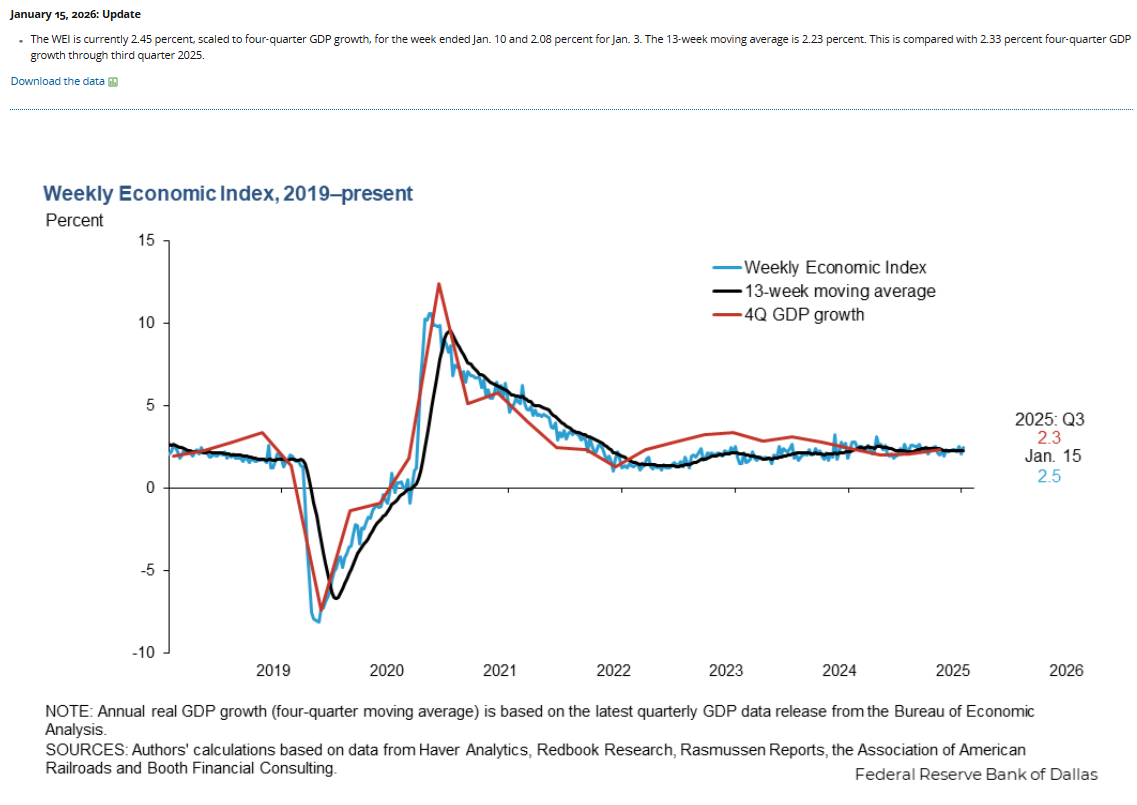
The economy appears to have accelerated by about 0.35% in the last week.
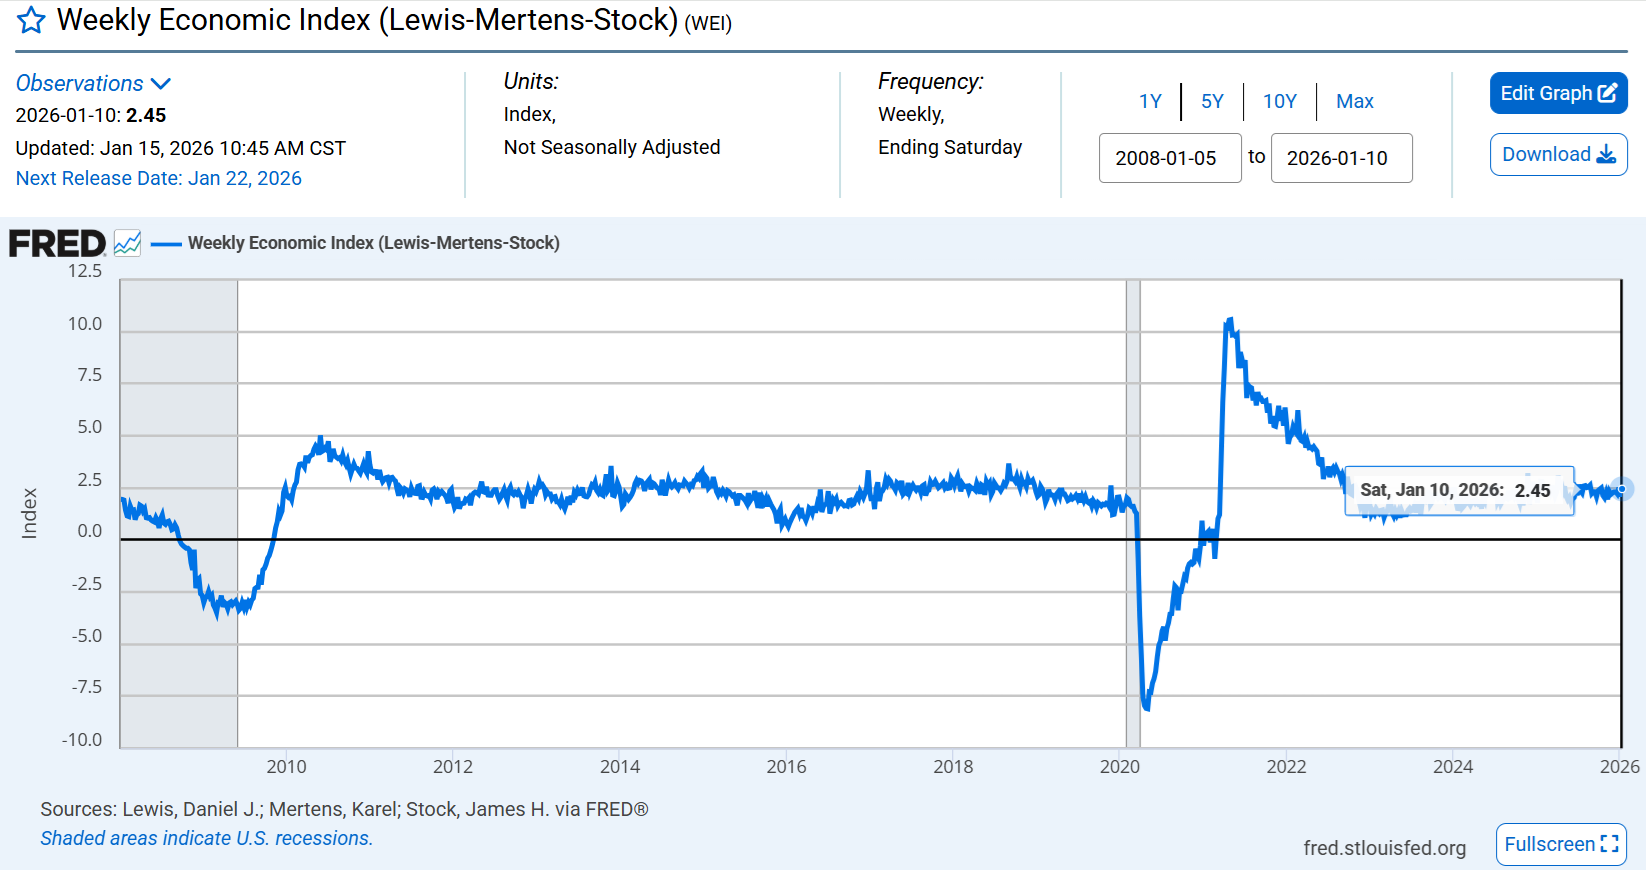
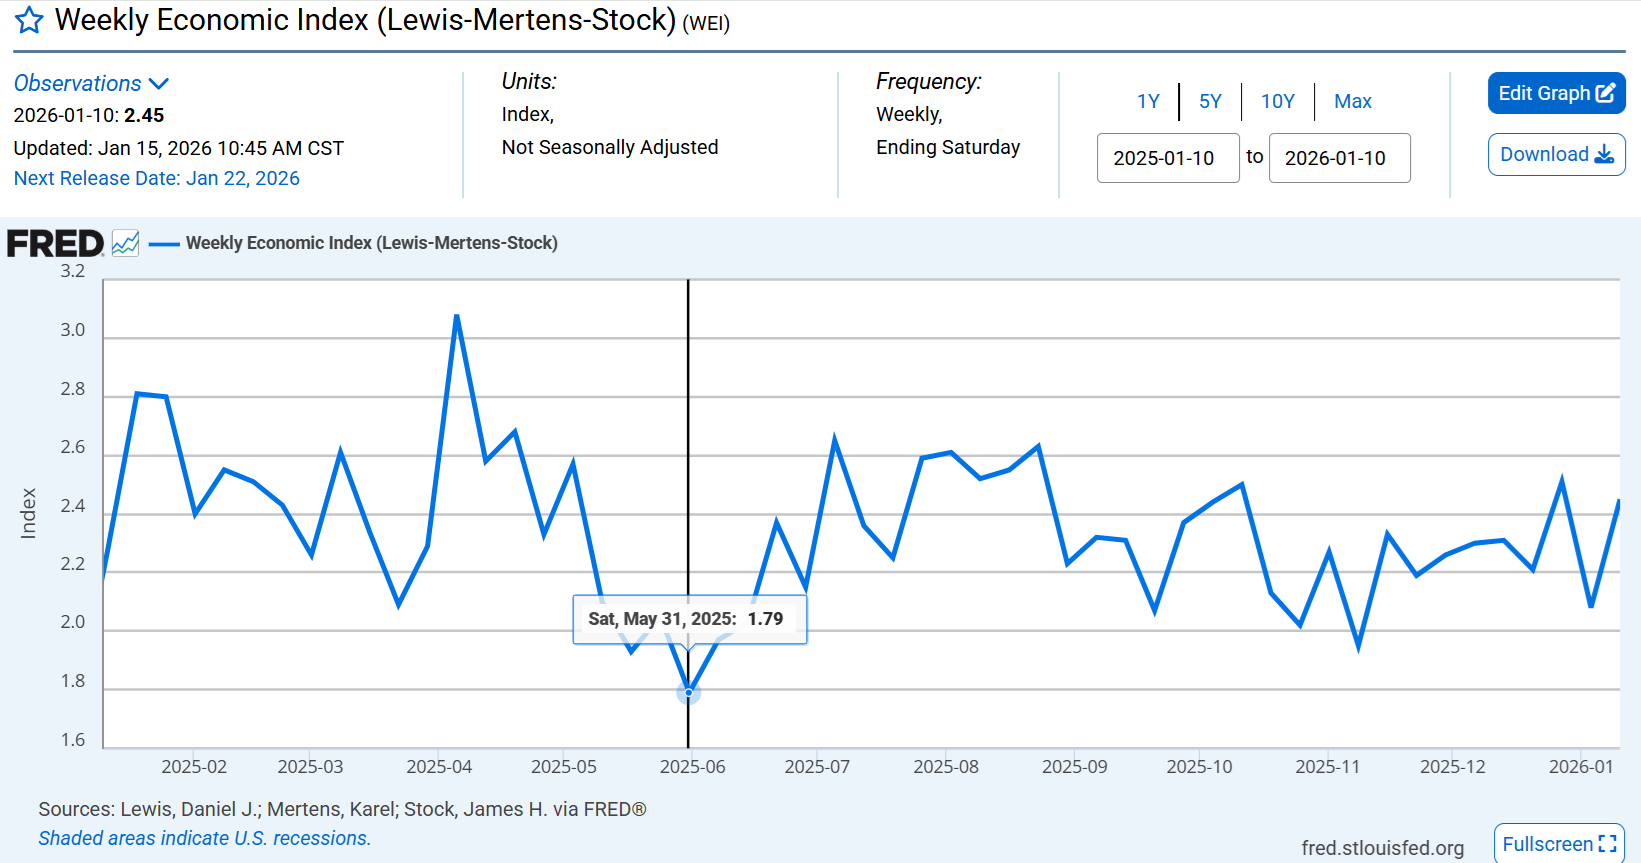
In the last year, growth has ranged from 1.8% to 3.1%, and while the Tariff crisis did cause a significant growth slowdown, that was coming off a big spike in import-driven growth. In other words, if you ignore the initial volatility, you can see that the trade war didn’t significantly impact growth at all.
How on earth is that possible?
Big Tech Spending Is Massive And Paid For Out of Free Cash Flow, Not Debt
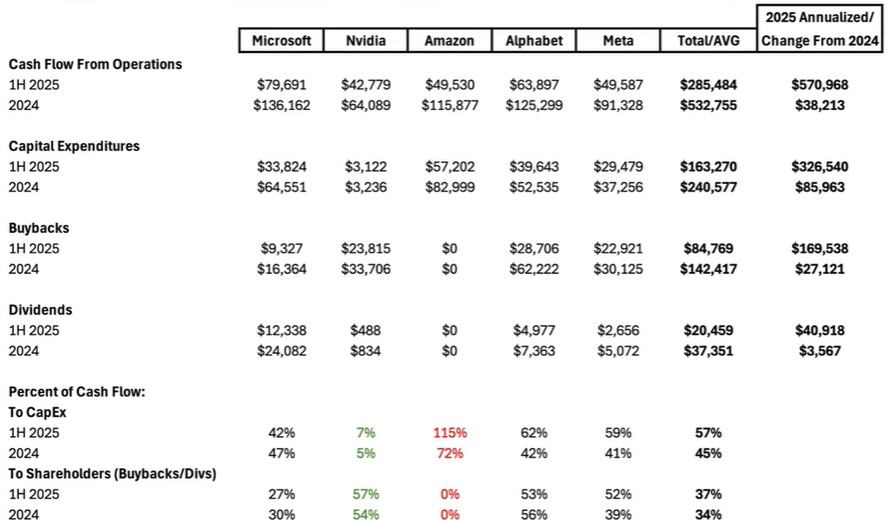
Profitable companies are investing some of their profits into future profit growth, and as a result, profit growth is faster. More growth spending = more growth = a good thing.
It also means that even if we get a growth scare, unless AI demand dries up, growth spending is likely to be resilient. Big tech has more money than God and isn’t going to stop building data centers (Robots and autonomous cars require 25X more data center capacity than exists today).
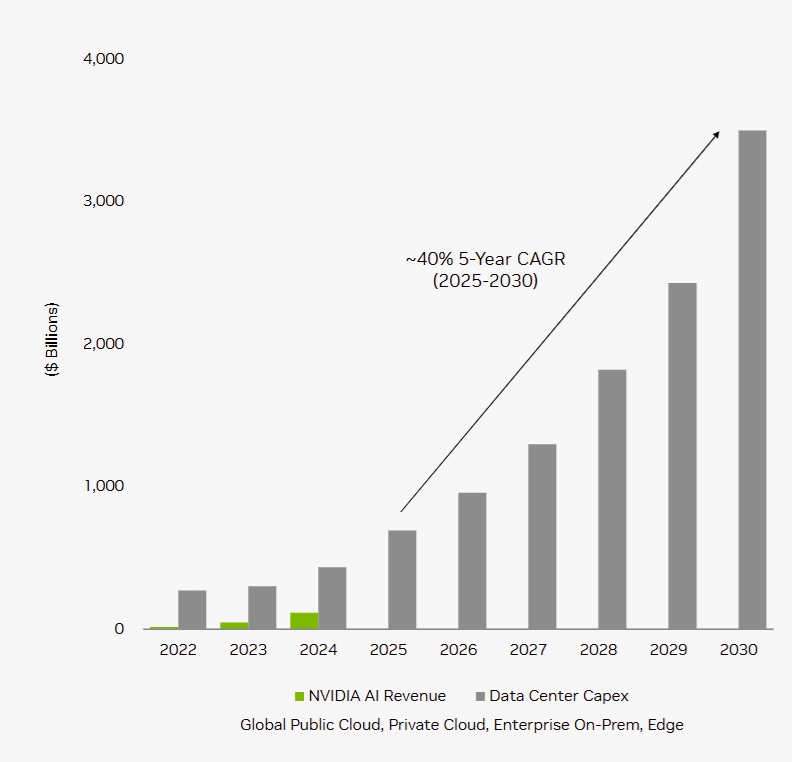
That’s $4 trillion in GLOBAL AI spending (60% of that in the US), which is $2.4 trillion in expected AI spending in 2030.
The $1.2 trillion infrastructure bill passed in 2021 was a 10-year spending program.
AI in 2030 is on track to be 2X as large; in 1 year, it would deliver 20X more economic stimulus than the infrastructure bill.
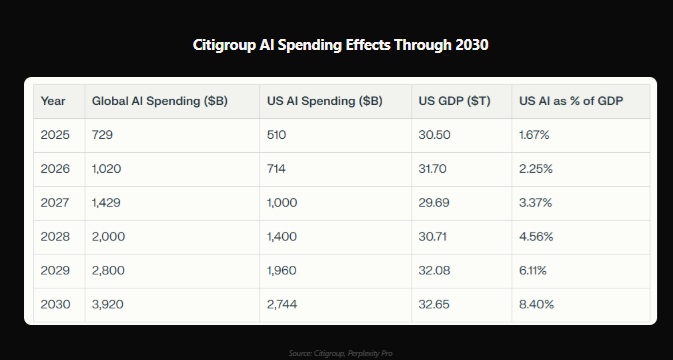
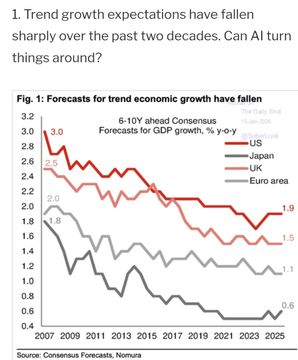
And we’re worried about whether growth is going to trend below 1.9%?
Bringing It Back To Today’s Economy
My favorite real-time economic model is from the NY Fed, since they track not just this quarter but also the next quarter’s expected growth.
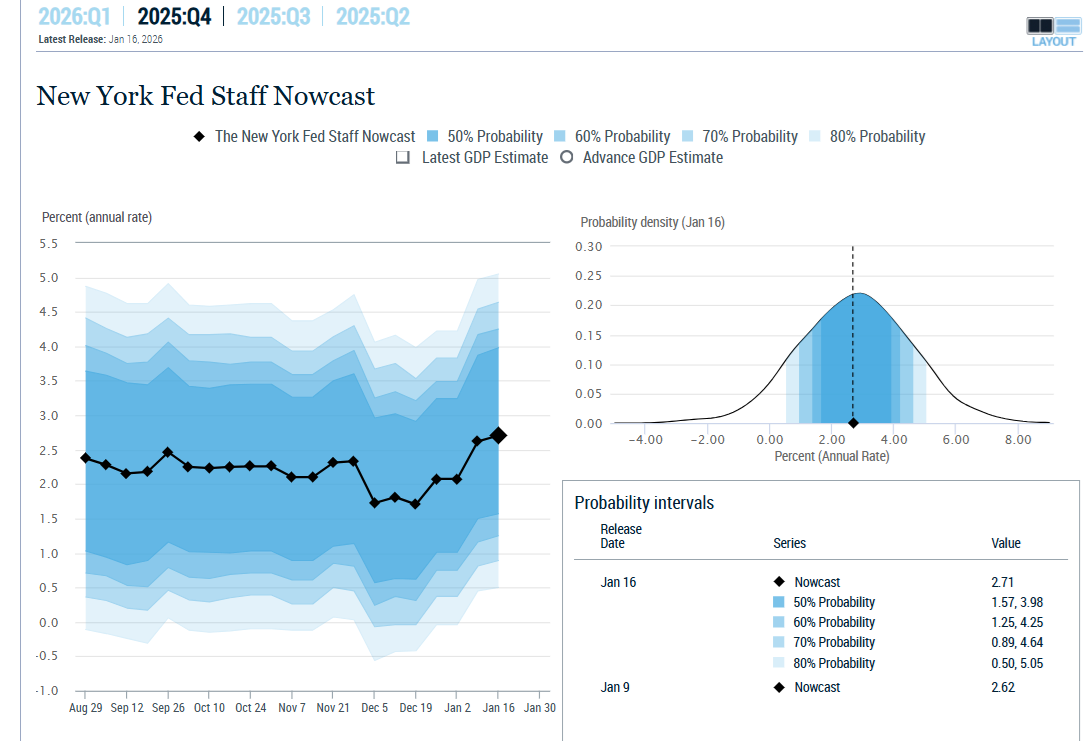
I also appreciate the full probability curve being offered, showing us that it’s a probabilistic estimate, and not an actual single hard number.
Even after final revisions, we are never truly knowing the exact size of the economy. We just have a final number.
2.7% GDP growth, for Q4 (the one that the blue-chip consensus still shows 1%).
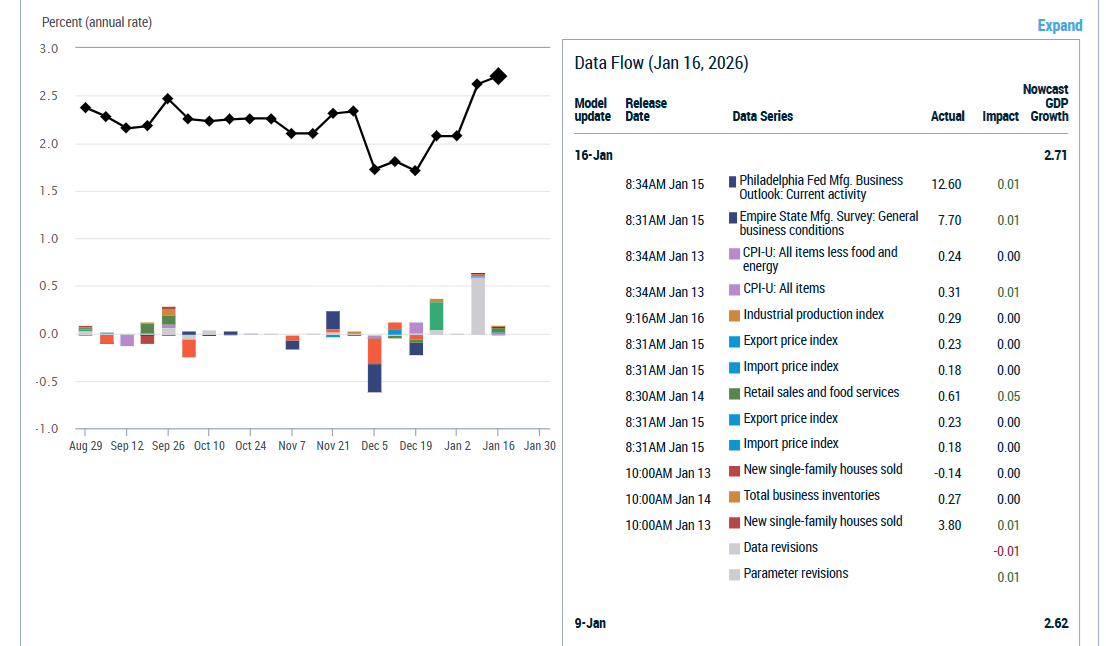
Most economic news doesn’t even move the stock market much, and it shouldn’t because no single report is that important.
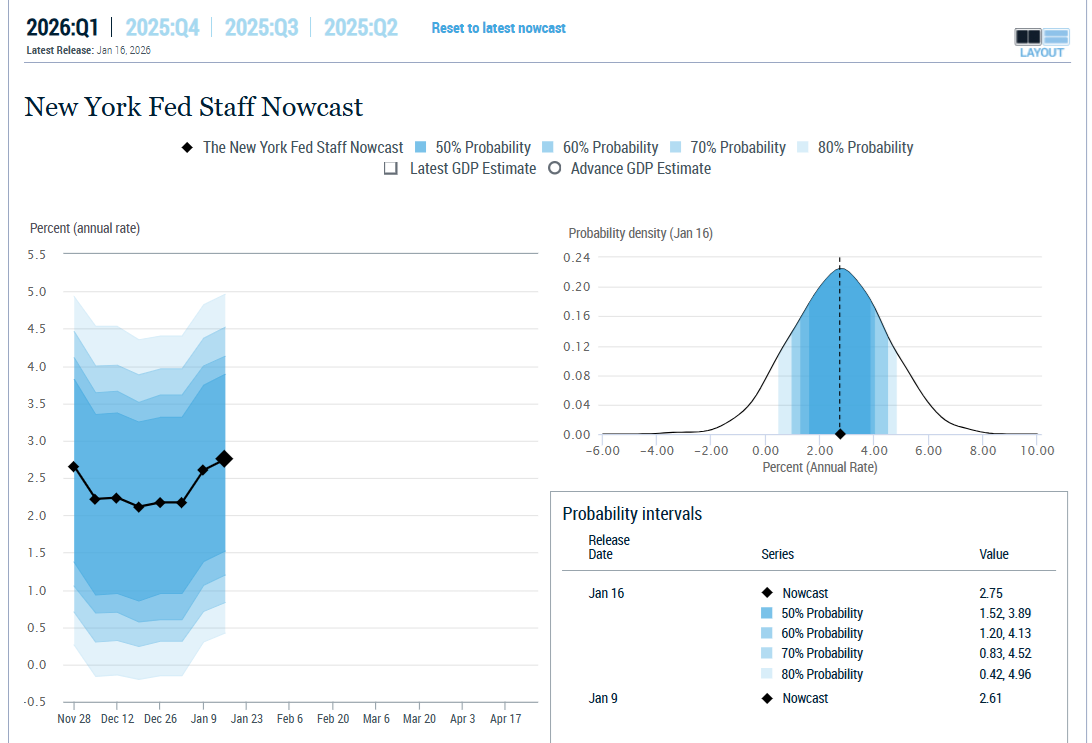
And for real time right now, the NY Fed has raised its estimate to 2.75%. About 1% above trend.
2.45% to 5.3% GDP growth.
More Good News: Tailwinds Aplenty For 2026
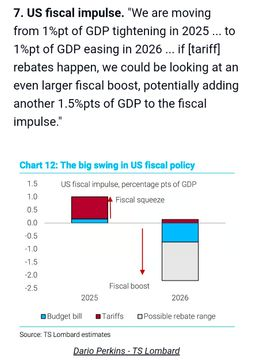
2026 is a year when the government goes from a major impediment to growth to a potential major booster (up to a 2% boost, on top of the normal 1.9% trend growth).
In other words, a good to great economy that seems to be getting stronger (risk is still to the upside).
My Very Simplistic GDP Model Looks Less And Less “Crazy” By The Week😉😂🤣
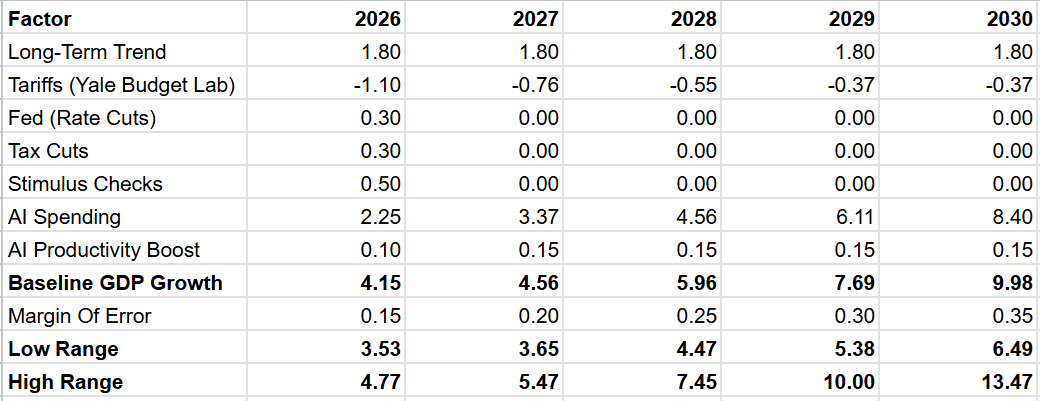
Bottom Line: 2026 Is Setting Up To Be A Fantastic Year For Economic & Market Fundamentals, So Don’t Let The Correction Scare You
I still expect 2 corrections this year, based on our Monte Carlo simulations, but if we do get a 2017 style low-volatility meltup?
All the ingredients are in for such a year (including almost 20% FCF/share growth). It’s OK to be aware of risks to fundamentals. Prudent and disciplined financial scientists must always be aware of the risks. BUT it’s even more foolish to ignore objectively fantastic fundamentals because of fears of what might potentially go wrong with fundamentals in the future.
“Who cares about this year’s great results! At SOME POINT, there will be a recession, and then earnings will fall, and the stock market will tank!”
This is no way to live, much less invest, because of the October 2002 Tech crash low? It was higher than in 1996 when Alan Greenspan gave his “irrational exuberance” speech.
In other words, with 83% EPS growth from 2024 through 2028, even if we do get a recessionary bear market at some point, it’s almost certain that the lows of that bear market will be higher than today’s levels. And of course, for individual investors? It’s always and forever a market of stocks, not a stock market.
Happy Weekend, Everyone! Next Economic & Market Fundamentals Update On January 30th
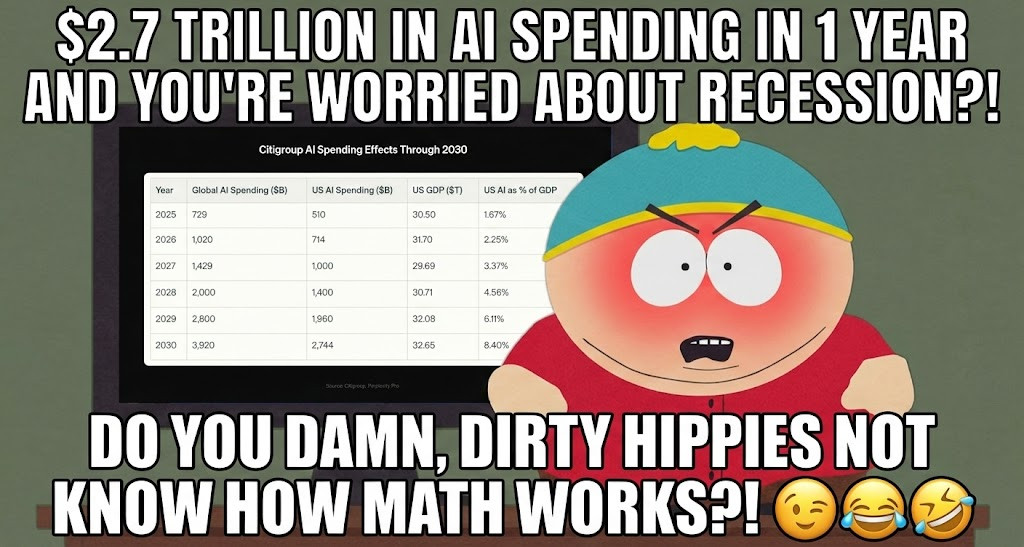
Bonus Meme! Because You Have To Laught To Keep From Crying 😉
GNG is looking into getting an intern to help Connor even more.
We’re running the company with the assumption that it will be the last job any of us ever wants to have.
And possibly can ever get😉😂🤣