The Portfolio Page Just Got a Lot Better.. Here's the Tour
Hey everyone, quick one. We just shipped a wave of upgrades to the Portfolio page and I want to walk you through every tab so you actually know what's in there. A lot of this used to live in three or four different places and now it's all under one roof, on one page, with the same numbers tying out across every view.
I'm going to use Glenn's Vulcan Active Growth IRA as the example portfolio for the screenshots so you can see what a real, fully-loaded portfolio looks like through every lens. Let's get into it.
Also.. The GNG Analyst AI is Live!!!
For those of you who are like me and don't like change, I'm sorry I've changed so much recently. I think we were due for some serious upgrades, and I have been scrambling to try to slowly walk back and fix our existing features. As you know, I was very rushed the first four months to try to get this service up and running. Now I can make it actually look good and enhance data features.
1. Overview
This is the new front door. Editorial layout, no fluff. The top strip gives you the headline number with simple return and annualized side by side, then the page breaks into the five things you actually open the portfolio to check.. Performance, Holdings, Realized, Dividends, Valuation. Each card is a quick read with a click-through to the deeper tab, and the upcoming earnings calendar sits right underneath so you know what's hitting this week.
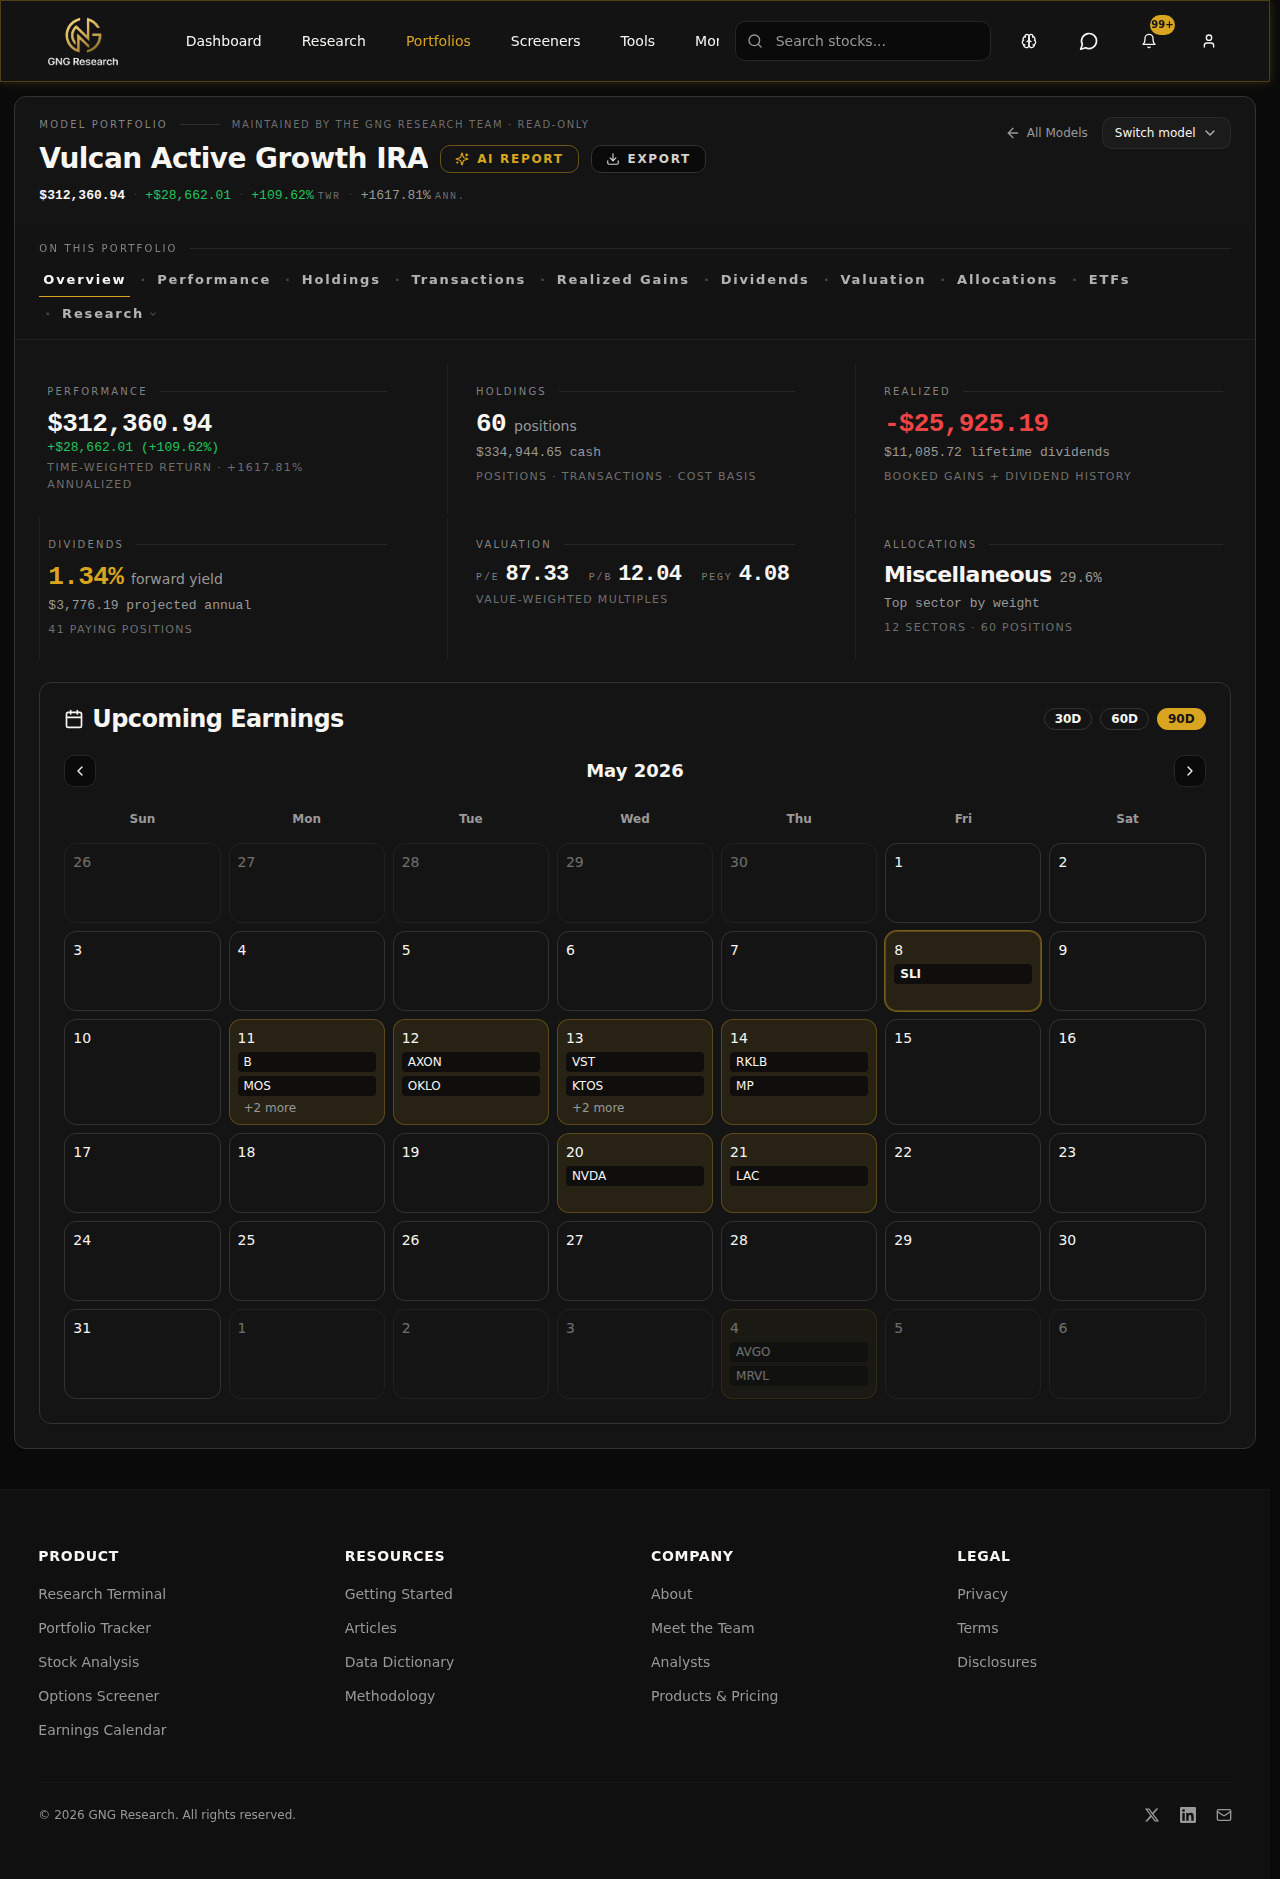
If you only ever look at one tab, this is the one.
2. Performance
Performance is where you go when you want to know how the portfolio is actually doing, not just how much money is in the account. You can Select Edit on your own portfolio. Choose between Time-weighted return, simple return, and cost basis as far as performance goes. All of it is benchmarked against whatever index you want to compare to. You can pull the time window in or out and the chart re-bases itself so the comparison is honest.
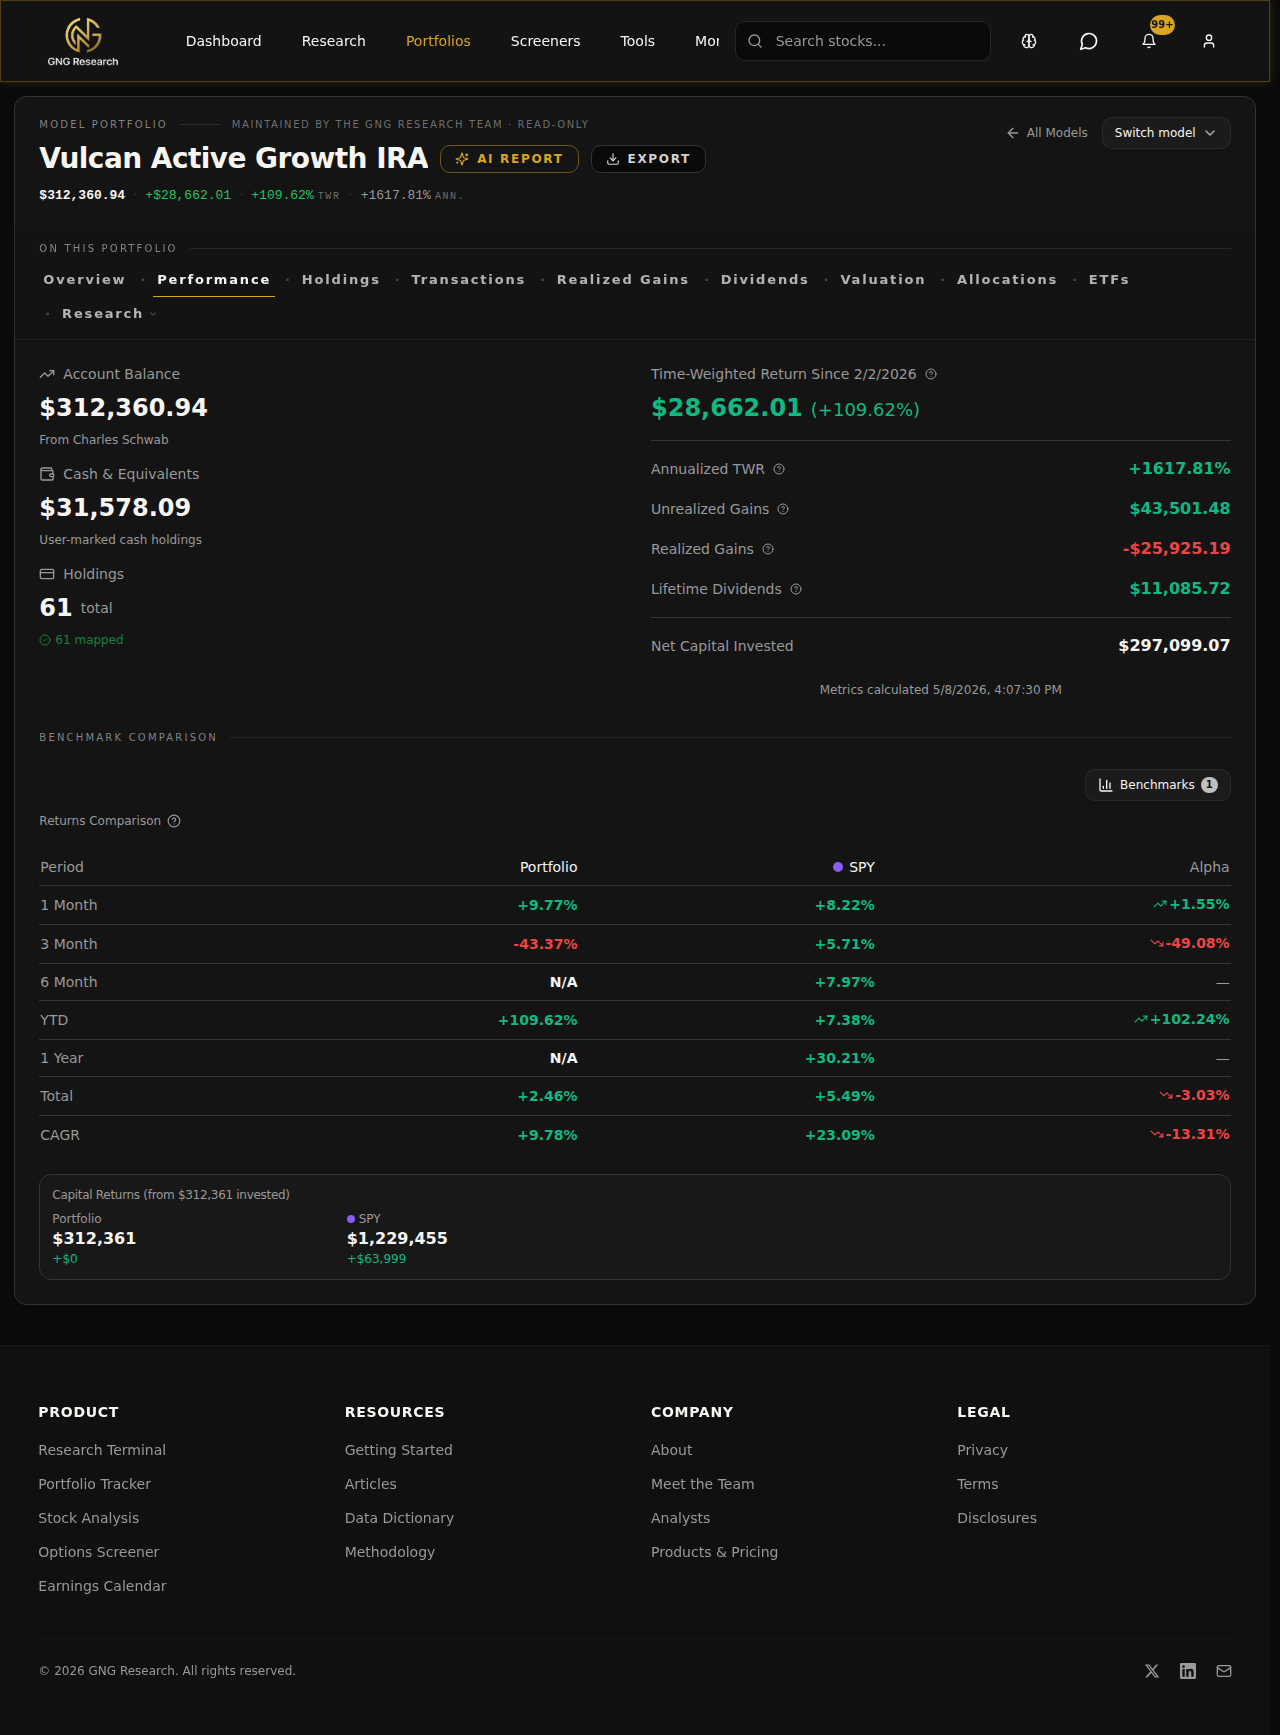
This is the tab that tells you whether you're actually adding value or whether you would have been better off in an index fund. Honestly, that question alone is worth the page.
3. Holdings
Every position you own, with the metrics that matter for each one. Price, cost basis, weight, gain/loss in dollars and percent.
The columns are configurable. Pick what you care about, hide what you don't, and the layout sticks.
4. Transactions
Every buy, sell, dividend, deposit, withdrawal, and corporate action, in chronological order, with full cost basis tracking under the hood. If you're Plaid-linked the rows come from your broker. If you're manual you add them yourself. Either way the math downstream uses these rows as the source of truth.
Filter by type, by ticker, by date range. Export the whole thing to CSV if you need it for your accountant.
5. Realized Gains
Tax-lot detail for every closed position. FIFO matched, short-term and long-term broken out, with the dividend history sitting alongside so you can see total realized cash come back. This is the tab you live on in December and January.
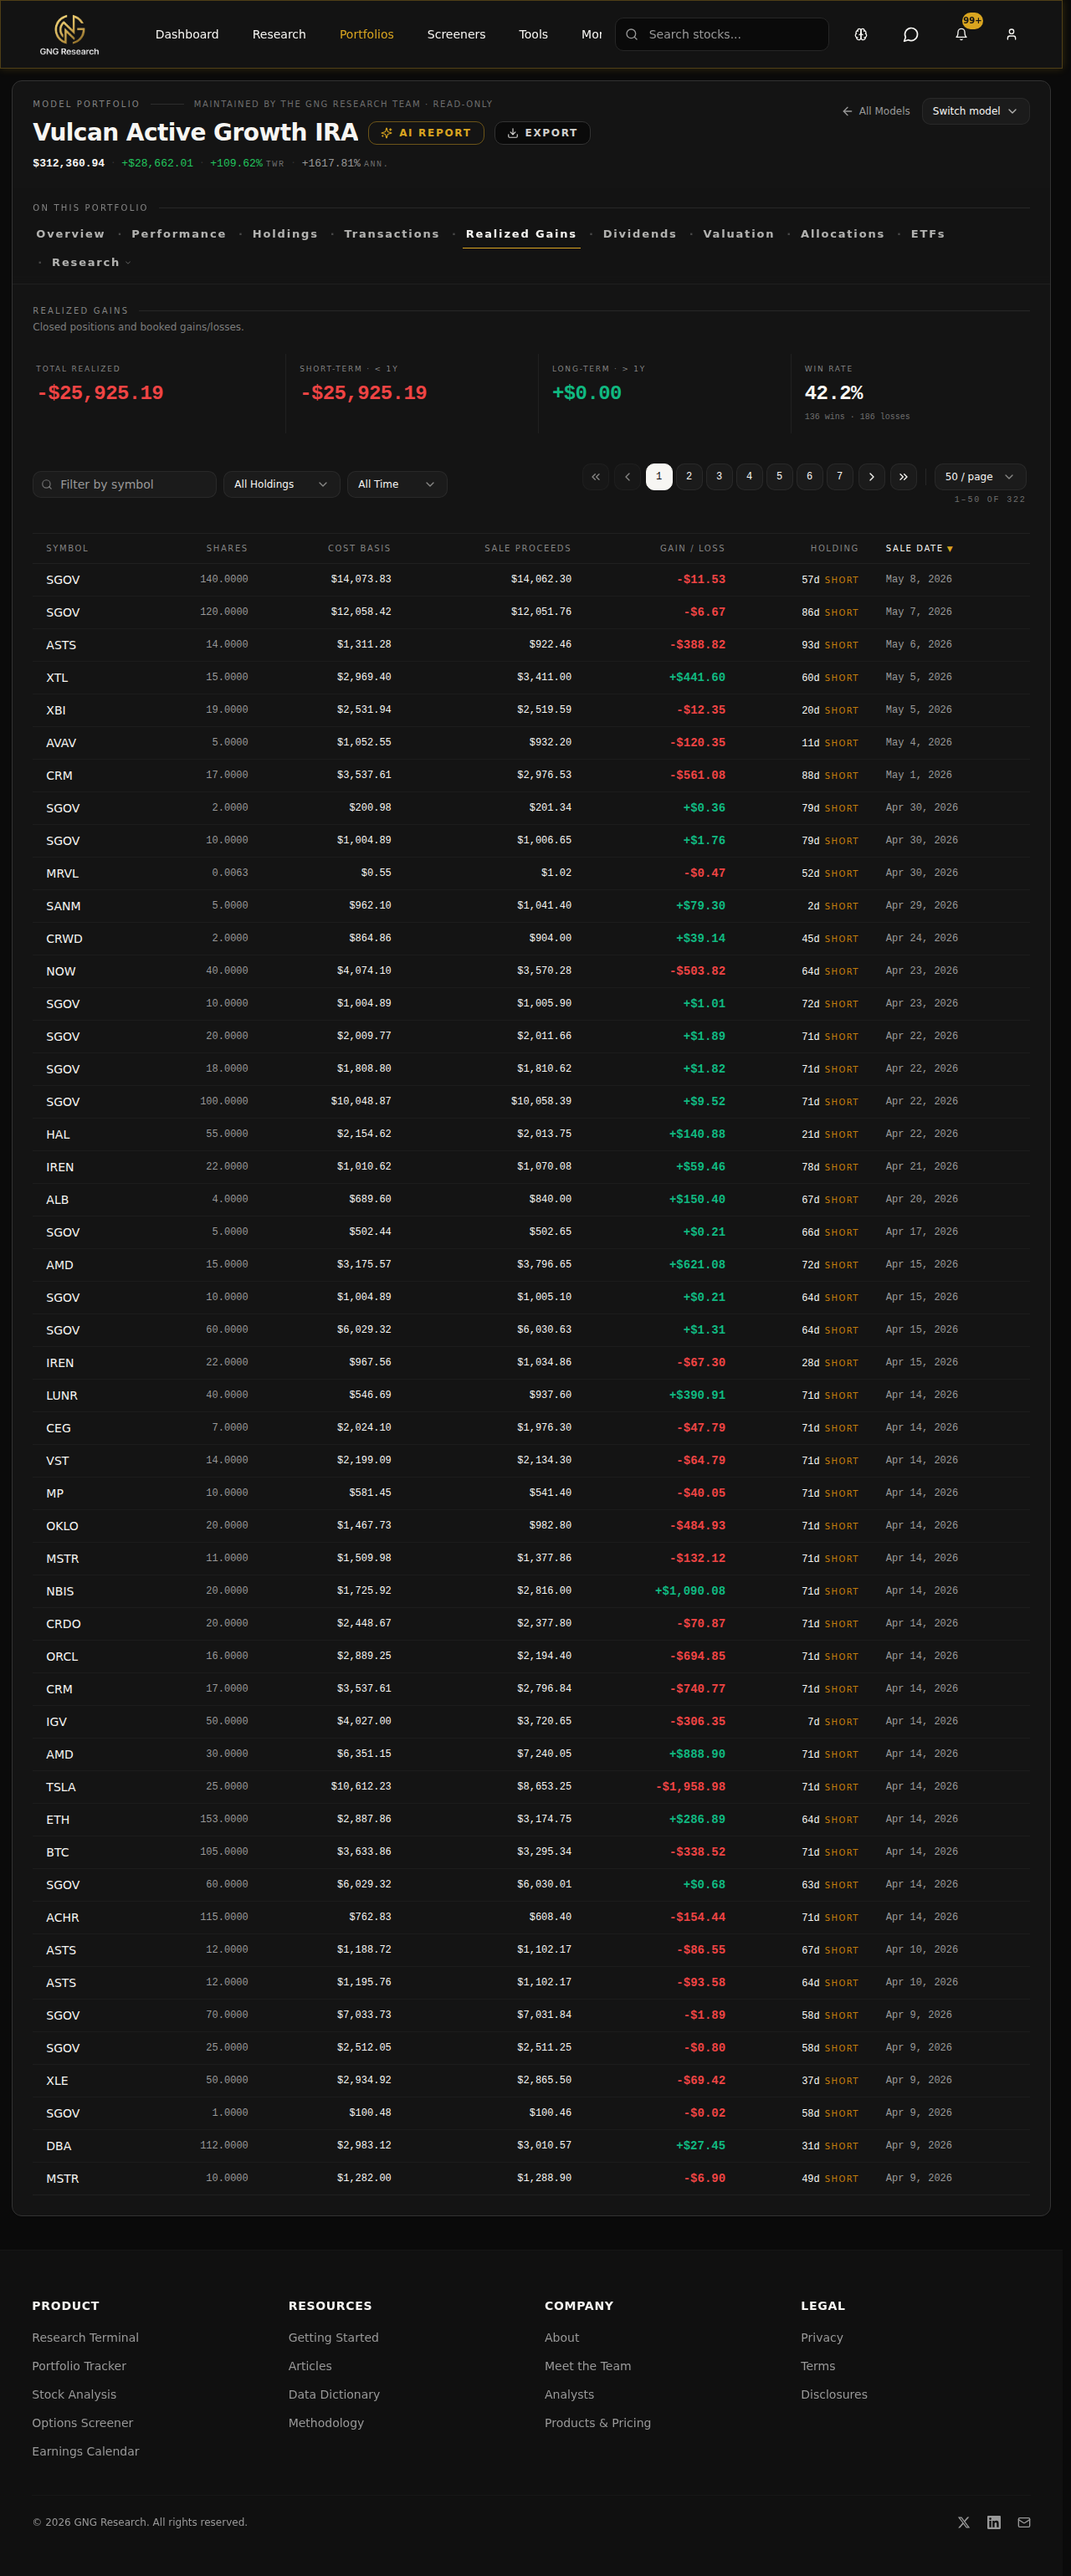
If you've ever tried to reconstruct a year of trading from a brokerage statement, this tab is going to save you a lot of pain.
6. Dividends
Forward yield, projected annual income, paying-position count up top. Below that, the income calendar showing what's coming and when, the concentration view so you know if your income is leaning too hard on one or two names, and the safety read on each payer based on payout ratio, growth, and cash coverage.
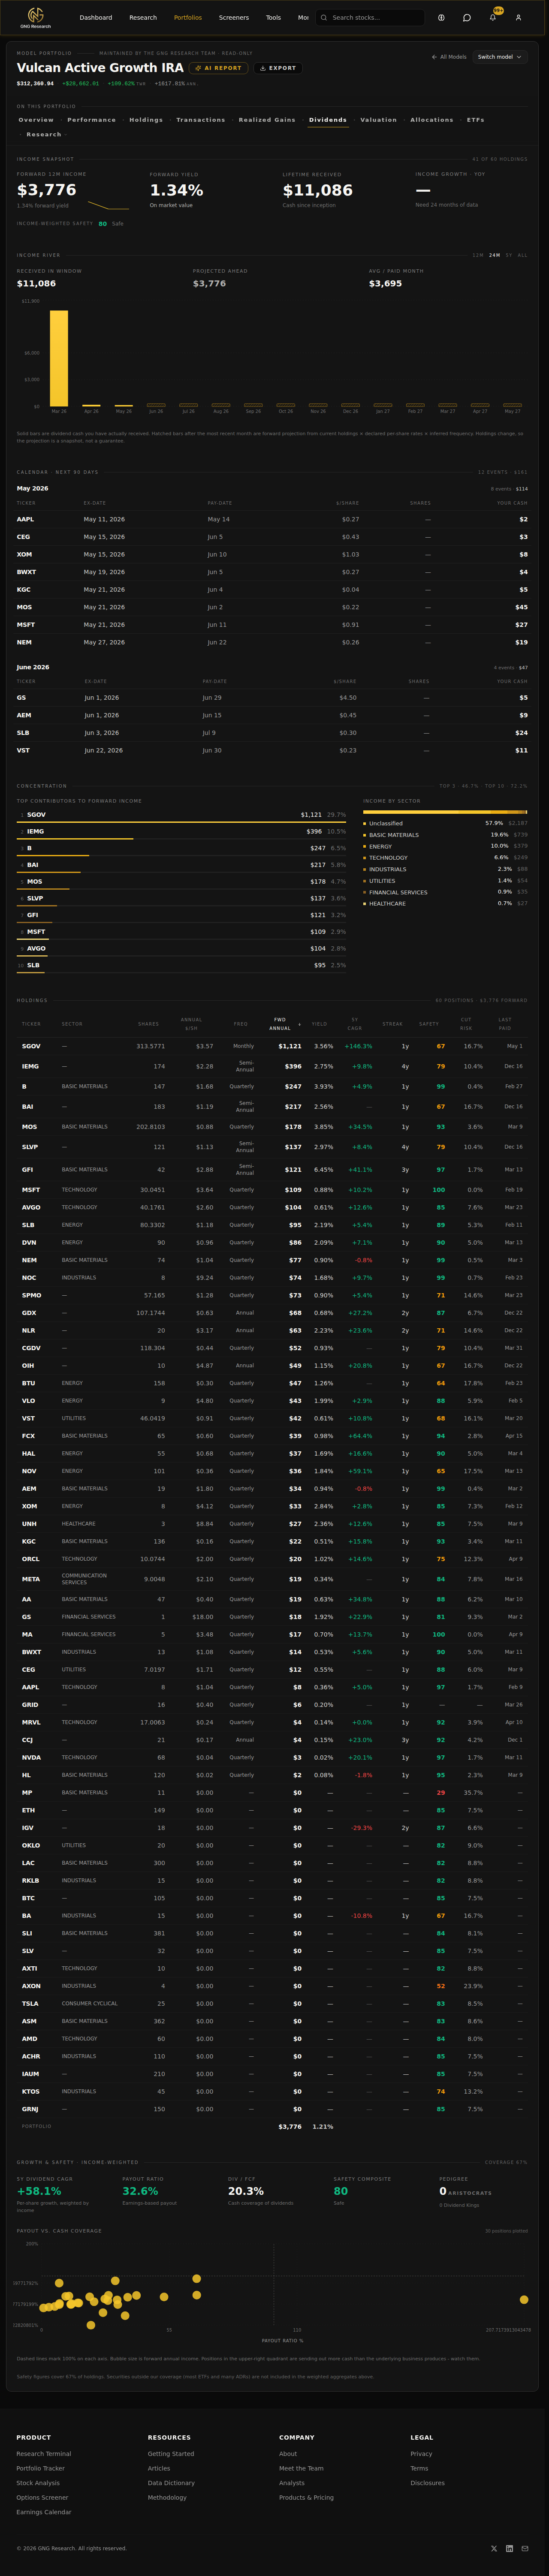
If you're income-oriented this is your home base. If you're growth-oriented you should still check it once a quarter to make sure you don't have a yield trap hiding in the book. (Note dividend streaks are being worked on.. might be buggy let me know if you see anything that looks off.
7. Valuation
This is the one that I've been waiting on. Quality, safety, growth, and fair value pulled across the whole book so you can see at the portfolio level what you actually own. Where is the book trading versus its own fair value. How does the rating distribution look. Where on the quality/growth plane do your dollars sit. I want to reiterate this again: this is based on our quantitative modeling and is not in any way, shape, or form investment advice. Before you review your portfolio yet again, you will have to sign a disclosure agreeing that you fully understand. We have to do it to protect ourselves.
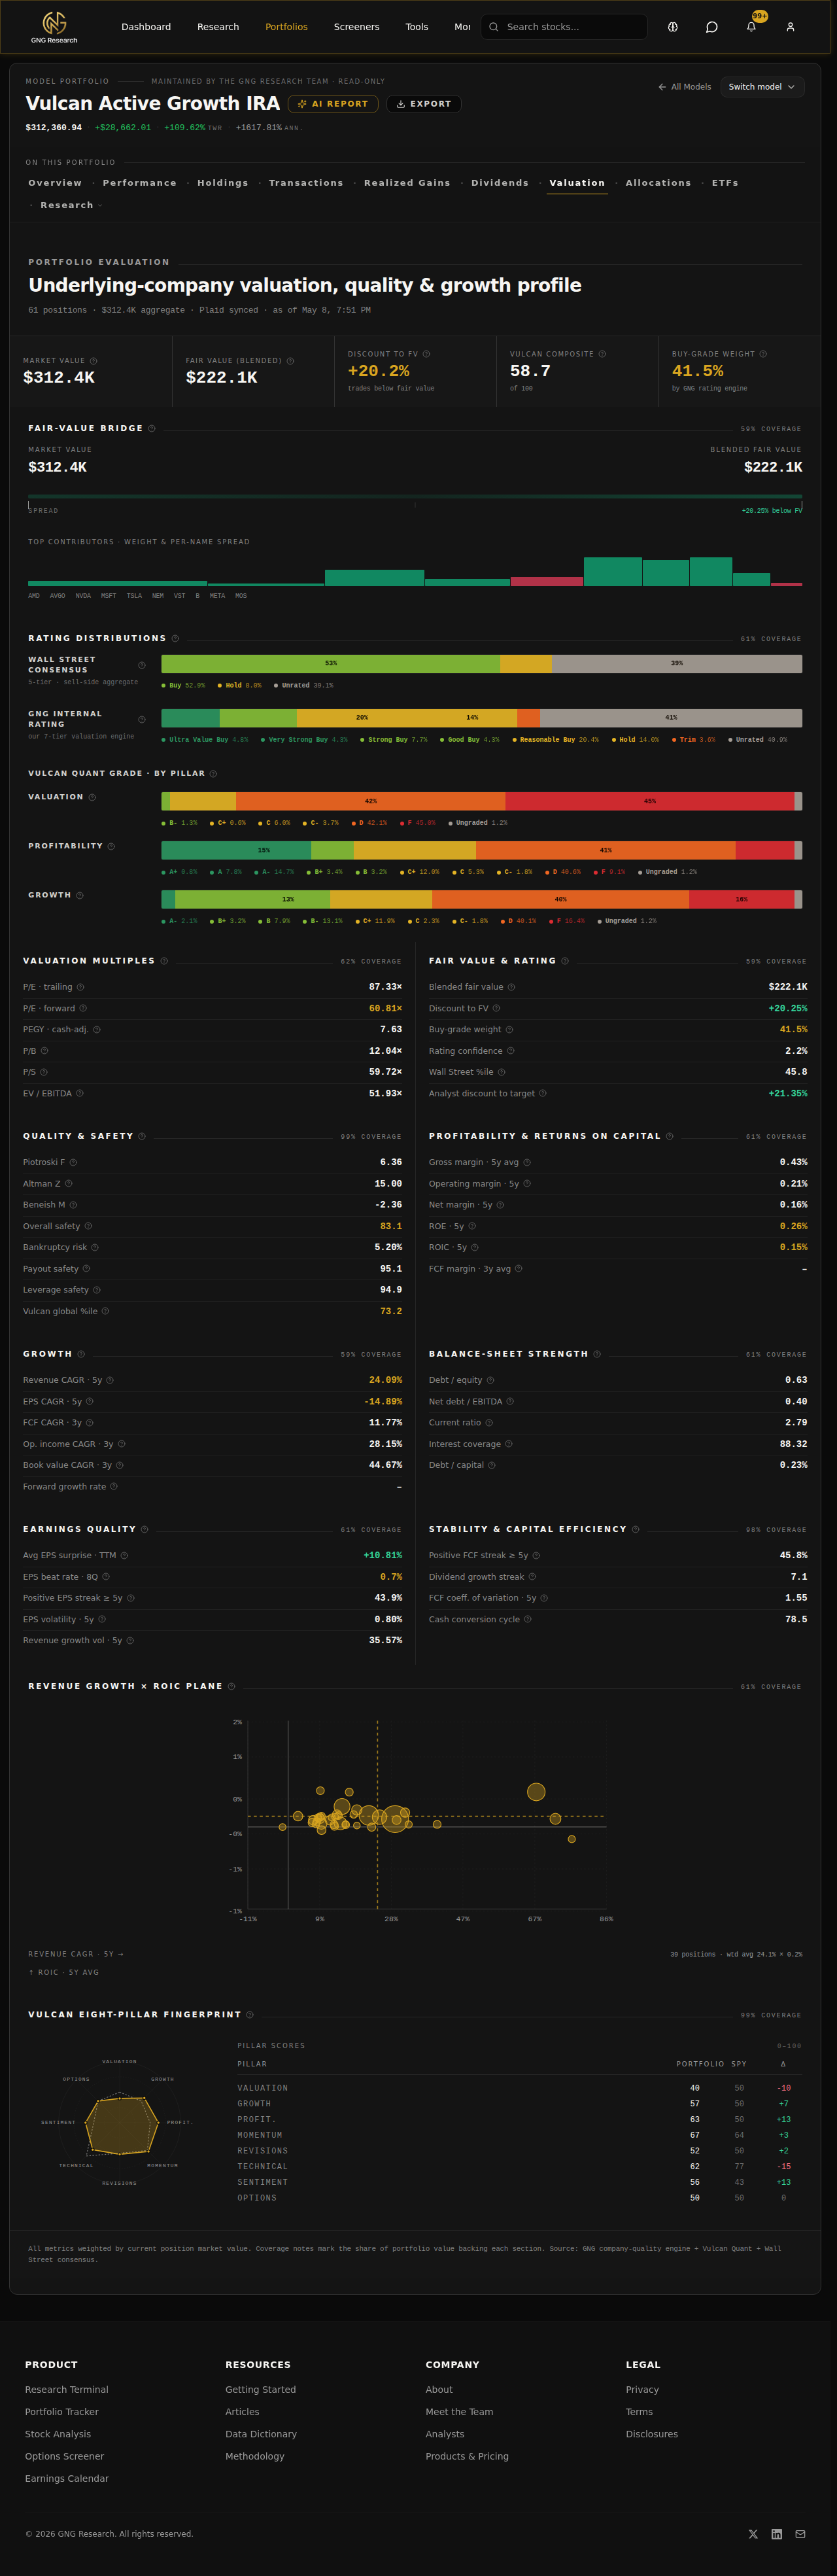
Quick reminder: every number you see here is rolled up from per-method fair values (forward PE, P/B, P/S, P/OCF, P/FCF, dividend yield, DCF, true DCF). The blend is sector-aware. So a REIT is judged on cash flow, not earnings. We do that work upstream so you don't have to second-guess it.
8. Allocations
Sector weights, asset-class weights, geography. The view you reach for when you want to know "am I actually diversified or do I just own a lot of names that all do the same thing." Cash is broken out separately so you can see your dry powder against everything else.
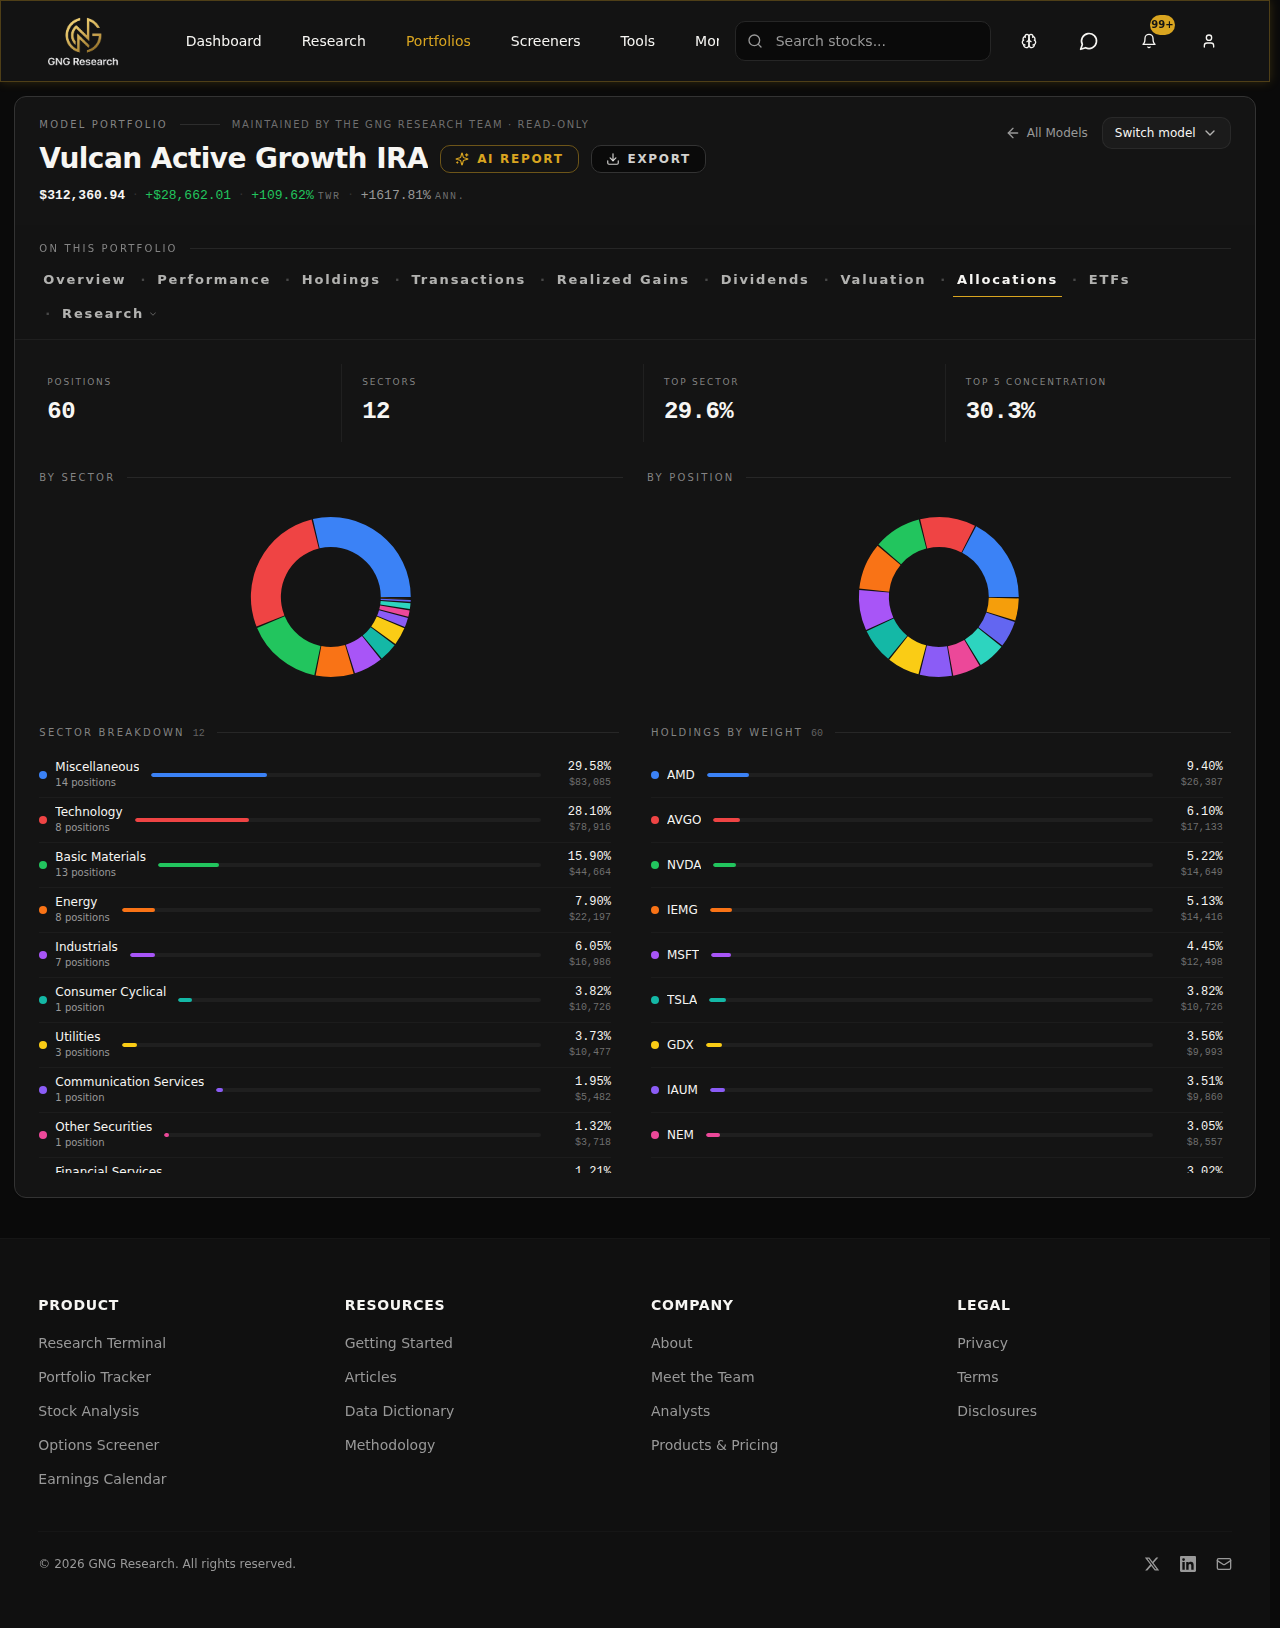
Pair this with the Valuation tab and you get the full picture.. what you own, in what proportion, and what it's worth.
9. ETFs
If you hold ETFs, this tab does look-through. It cracks every ETF open, pulls the underlying holdings, and re-rolls your real exposure as if you owned the underlying names directly. So if you've got VOO and QQQ and SCHD, this tab will tell you that you're actually 8% AAPL, 6% MSFT, etc., across the book, not "33% in three ETFs."
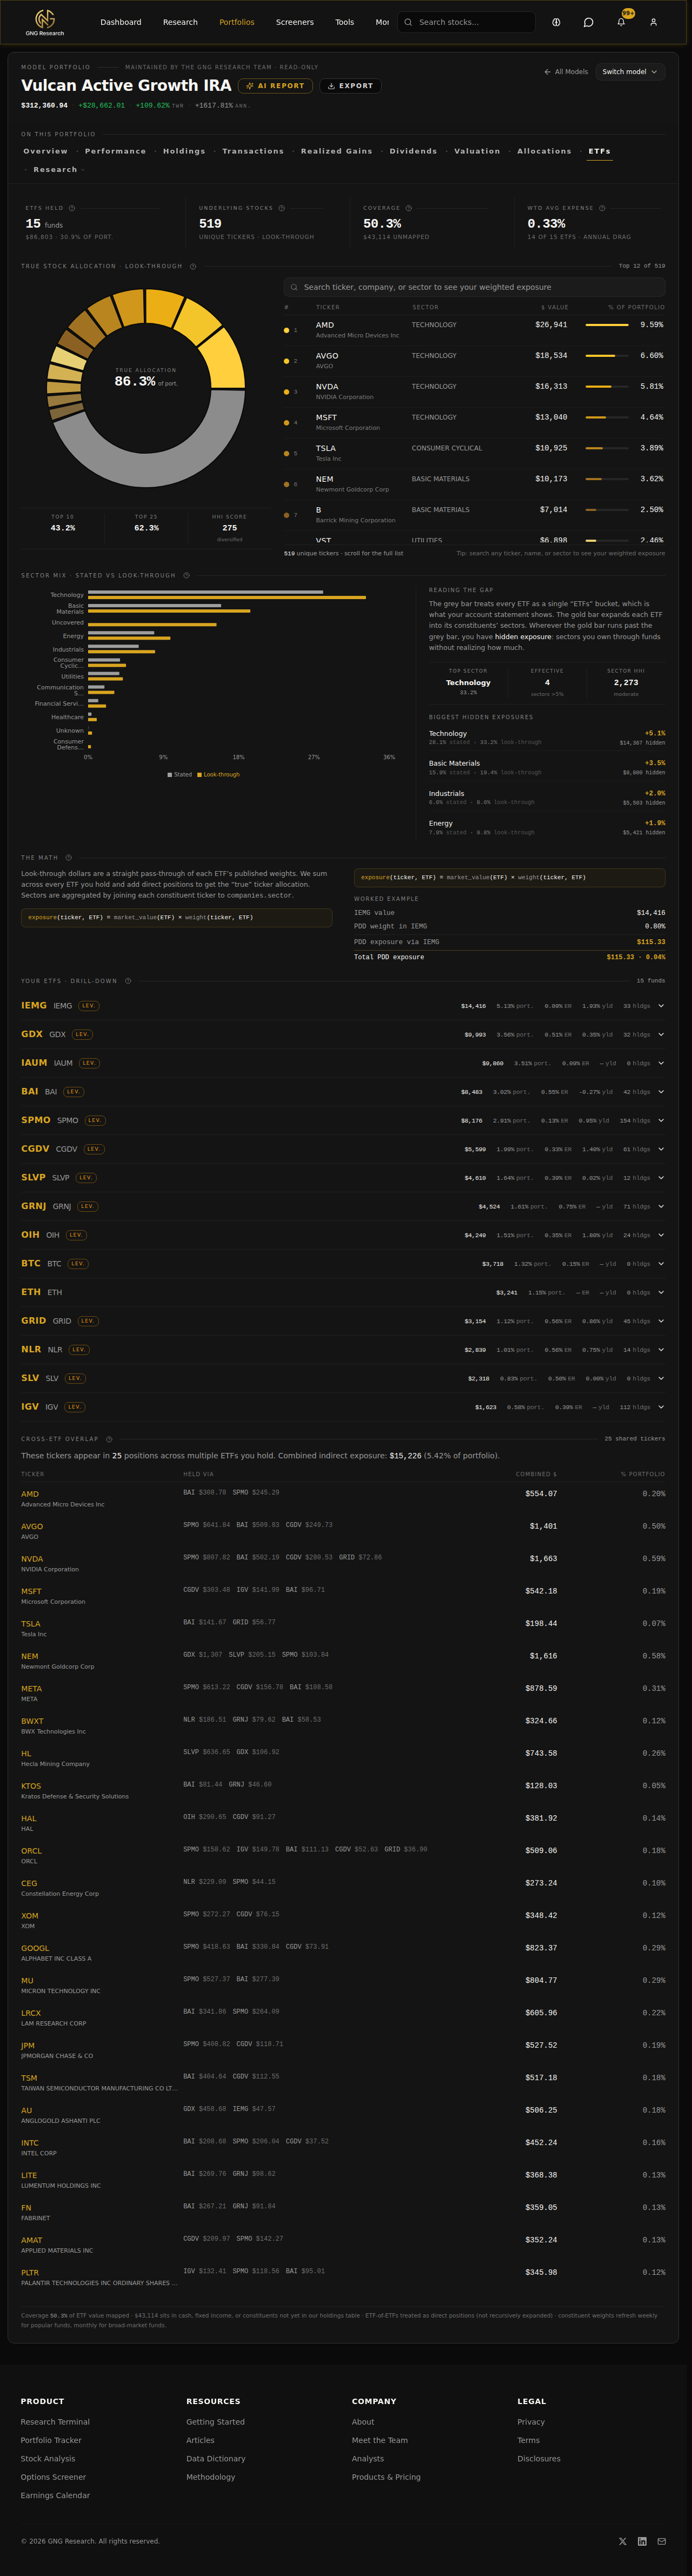
Overlap detection sits right next to it. If you own two ETFs that are 60% the same names, you'll see it.
The AI part, and why this matters now
A couple weeks ago I wrote about the GNG Analyst. Quick recap if you missed it: it's the in-app research partner that knows your portfolio and can pull live company data, run backtests, run Monte Carlos, dig through dividends, and delegate to specialist subagents. If you haven't read that piece, go read it first. The portfolio upgrades and the analyst are now wired together.
What that means in practice: the analyst can read every one of these tabs. Ask it "what's the safety profile of my dividend stream?" and it pulls from the Dividends tab. Ask it "where am I overweight versus my benchmark?" and it pulls from Allocations and ETFs. Ask it "is this book expensive?" and it goes through the per-method fair values from the Valuation tab and explains what's stretched and what isn't.
It's not a chat box pretending to be smart about your money. It's the same data you're looking at on these tabs, with a research partner sitting next to it.
Walkthrough tour
If you've never opened the AI Console, there's a guided tour that fires the first time you go in. Here's what it looks like.
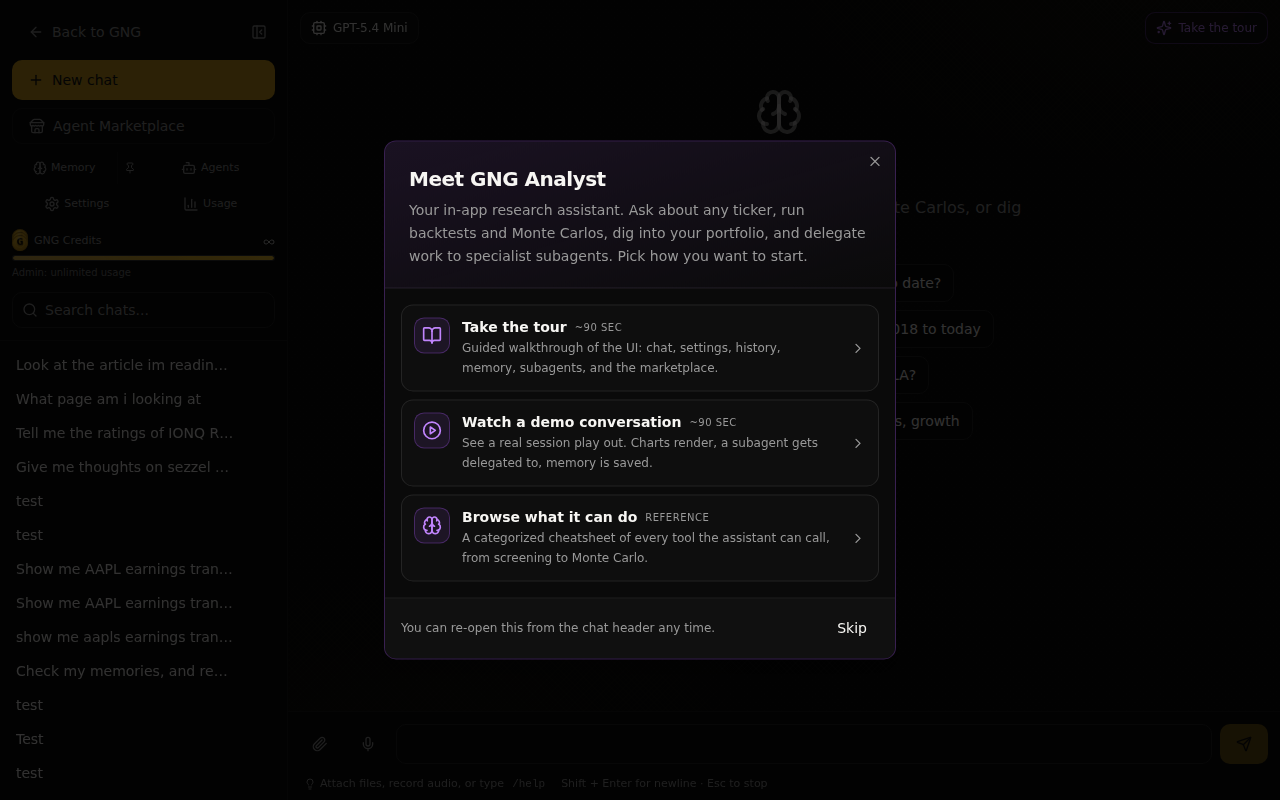
Three options.. take the 90-second guided walkthrough, watch a demo conversation play out, or browse the full tool catalog. Pick whichever fits how you learn. You can re-open the tour any time from the chat header. BTW.. this is LIVE! GNG Analyst
About the disclosures.. read these, please
Before you can use the Portfolio page, we ask you to sign three acknowledgements. I want to be straight about why each one is there, because they aren't legalese for the sake of legalese.
One. GNG content is information, not investment advice. We're not a broker. We're not your fiduciary. The data can be wrong, the data can be delayed, and we are not the people you call to place a trade. You're the one making the decisions on your money. Always.
Two. AI features process your portfolio data. When you ask the GNG Analyst about your book, your prompts and your holdings and your transactions get sent to the model providers we use (OpenAI and Anthropic) under their terms of service. We never ask for your broker credentials and we never will. Plaid handles the connection on its own rails. But you should know your data is in motion when you use the AI features, and we want you to opt in eyes-open.
Three. Model portfolios are illustrative, not recommendations. The Model portfolios you see, the optimizer outputs (coming soon btw), the backtests, the Monte Carlo forecasts.. all of it is hypothetical. None of it is personalized advice for your situation. Your tax bracket, your time horizon, your risk tolerance, your other holdings, your goals.. we don't know those things. You do.
You sign all three with your first and last name and you're set. We version the disclosure so if anything material changes you'll see it again.
Where to give us feedback
If something on these tabs is wrong, slow, ugly, confusing, or missing, tell us. You can submit customer support tickets on the site or in Rocket Chat
Thank you!
We appreciate your support along the way. I hope a few of you guys will inevitably purchase some tokens (haha) but seriously, I think this would be a great marketing tool for us, getting our name out there and so on. We appreciate you guys joining us on our journey as we continue. As always, I'll be answering comments and questions as needed below. If you have any questions regarding the AI analysts, please refer to my previous article before submitting any tickets or questions. I look forward to hearing how you guys are using this! I'm also all ears for any feature enhancements needed.
In just a little update on the future roadmap, I will be implementing some rating system updates. If you see anything change in the near future, that's why. Next on the roadmap is the portfolio optimizer. I think after that's released, I'm going to disappear for about a month on a sabbatical because of how stressful this journey has been. Keep in mind that I think we are now on month nine.
In the near future, we're going to be releasing an affiliate link program. Users will be able to share our system software with friends and family and get a heavy discount, while also getting a discount on their own subscription fee. I think this will help us spread the word that we even exist, because our base is the people who have followed us here from our previous ventures. Once we release this feature, if you guys wouldn't mind helping us out by spreading the word, we would really appreciate it. If you don't want to, please don't. Anyway, that's enough rambling. Looking forward to hearing the feedback. I'll try to check in some this weekend. I know I pushed it to 4 p.m. on Friday yet again, but oh well.
See you around!