Weekly Market Brief | June 6, 2026 (Week Ahead)
What Happened Friday: The Semi Unwind
Friday June 5 was the largest one-day Nasdaq decline since April 2025. The Composite lost 4.18%, S&P dropped 2.64%, and the nine-week winning streak snapped. Damage concentrated brutally in semiconductors: Marvell -16%, Micron -13%, Intel -11%, AMD -12.6%, Broadcom -7%, ASML -3.8%.
Catalyst stack: Broadcom failed to raise its AI chip outlook Wednesday night, kicking off the chip slide Thursday. Friday's May jobs report came in at 172K versus ~80K expected, with unemployment at 4.3%. Strong enough to kill near-term rate cut hopes. Fed futures now price a 42.7% probability of a rate HIKE at the December meeting. Treasury yields spiked. As the Wells Fargo strategist put it, this was driven more by positioning than fundamentals. Semis were overbought and the unwind ran hard.
Yes, This Was a Rotation
The sector breakdown confirms it. Five of eleven sectors finished Friday green: Consumer Staples (XLP) +1.72%, Utilities (XLU) +0.93%, Real Estate (XLRE) +0.72%, Healthcare (XLV) +0.61%, Financials (XLF) +0.19%. The losers were Technology -6.69%, Consumer Discretionary -2.04%, Materials -1.90%, Energy -1.82%, Communication Services -1.27%, Industrials -1.10%.
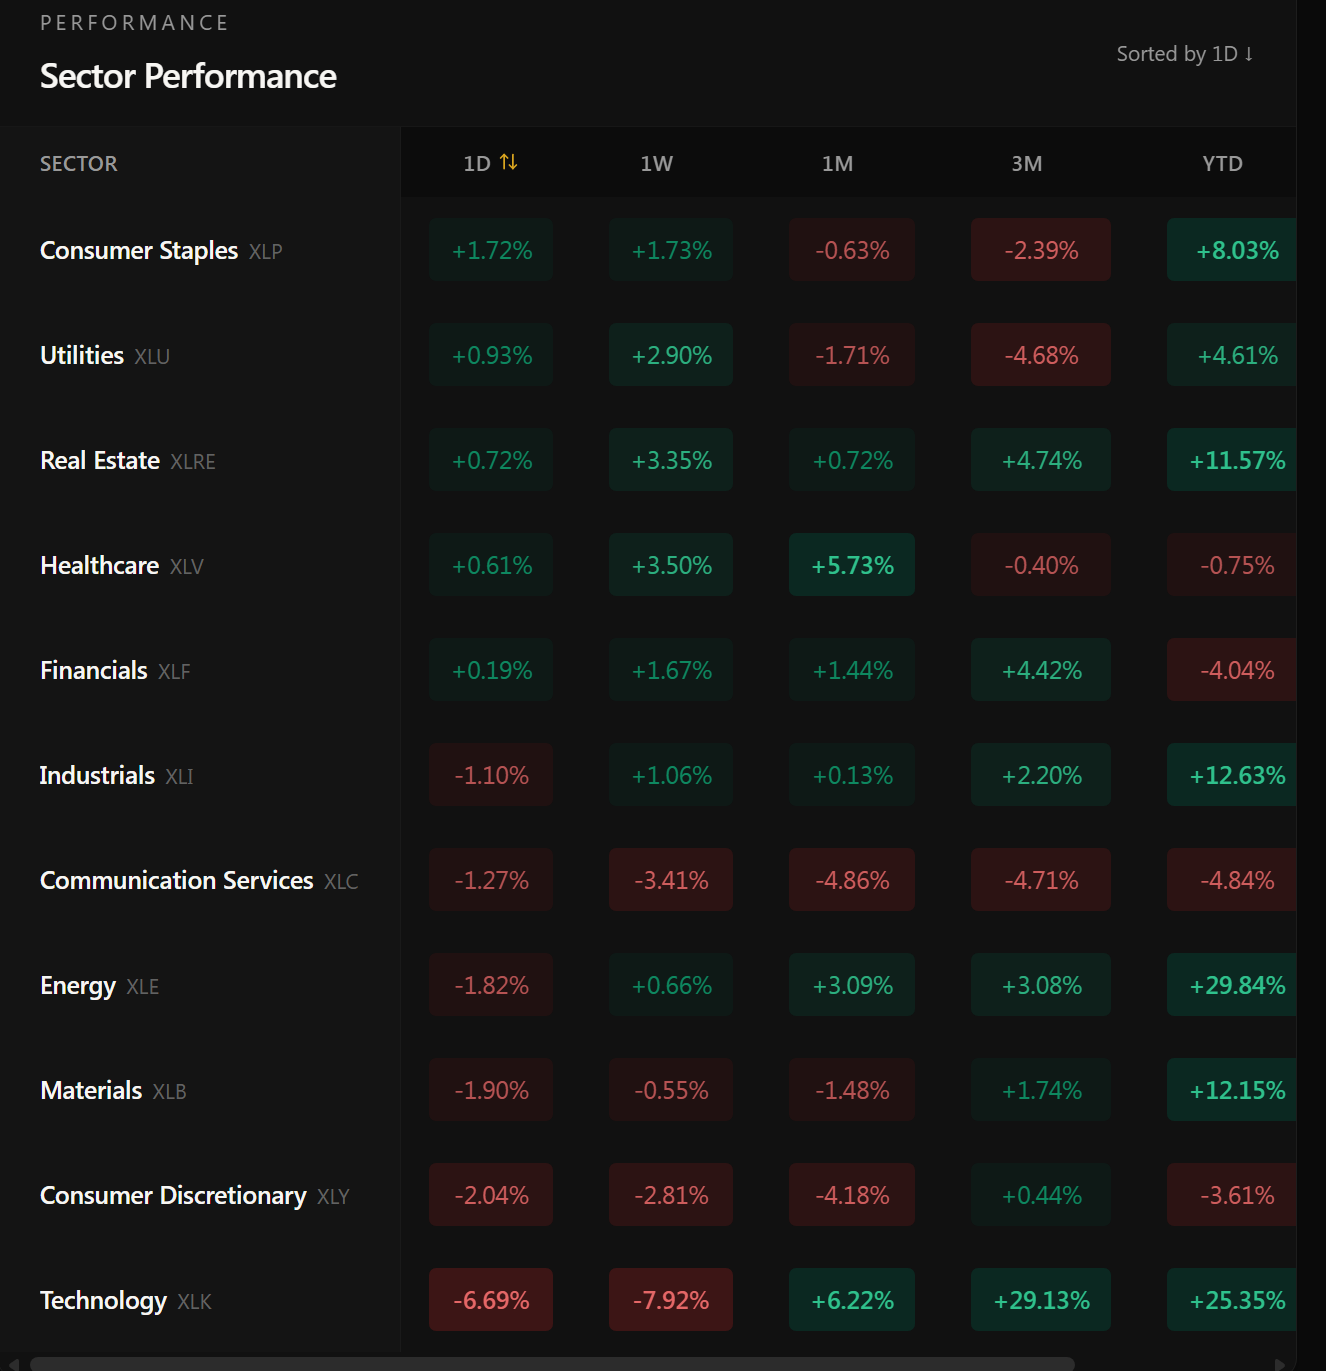
The one-week view is even cleaner. Defensives have been bid up all week: Healthcare +3.50%, Real Estate +3.35%, Utilities +2.90%, Staples +1.73%, Financials +1.67%, Industrials +1.06%. Tech is down 7.92% for the week. The rotation built before Friday and Friday completed it.
What confused the earlier read was broad-asset weakness: bitcoin -5%, gold -3.5%, Russell 2000 also red. Those moves looked risk-off, but combined with the sector breakdown the cleaner read is rotation from concentrated tech and crypto positioning into defensives and rate-sensitive value. The rate-sensitive sectors held up despite the yield spike because investors were buying defensive cash flow ahead of a rate scare.
SPY and QQQ Chart Read (live as of Saturday morning)
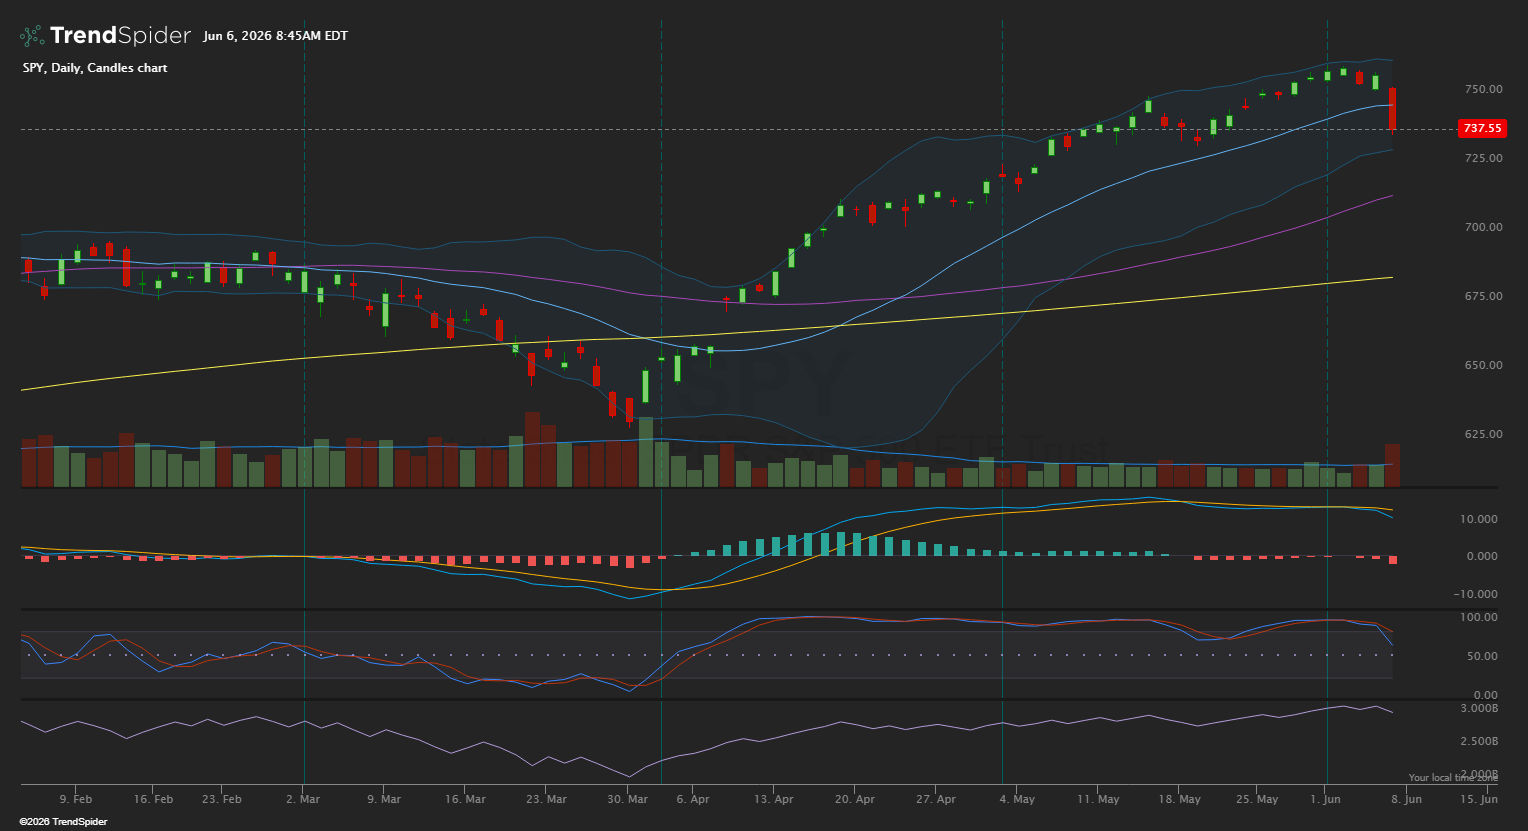
SPY is at $737.55 on the chart, sitting at the lower Bollinger band after Friday's drop. The 20-day moving average sits just below price near $738, the immediate test for Monday. The 50-day at $720 is the deeper line. MACD histogram has flipped negative for the first time since the April recovery began. RSI cooled from 70+ down to the 50-line zone.
QQQ is at $705.06 and the damage is more visible. The chart shows a massive red engulfing candle that ate roughly two weeks of price action in a single session. Price is now right at 20-day support near $700. MACD histogram clearly negative. The bearish RSI divergence flagged last week resolved exactly the way divergences usually do: a sharp selloff that resets momentum. RSI near 50.
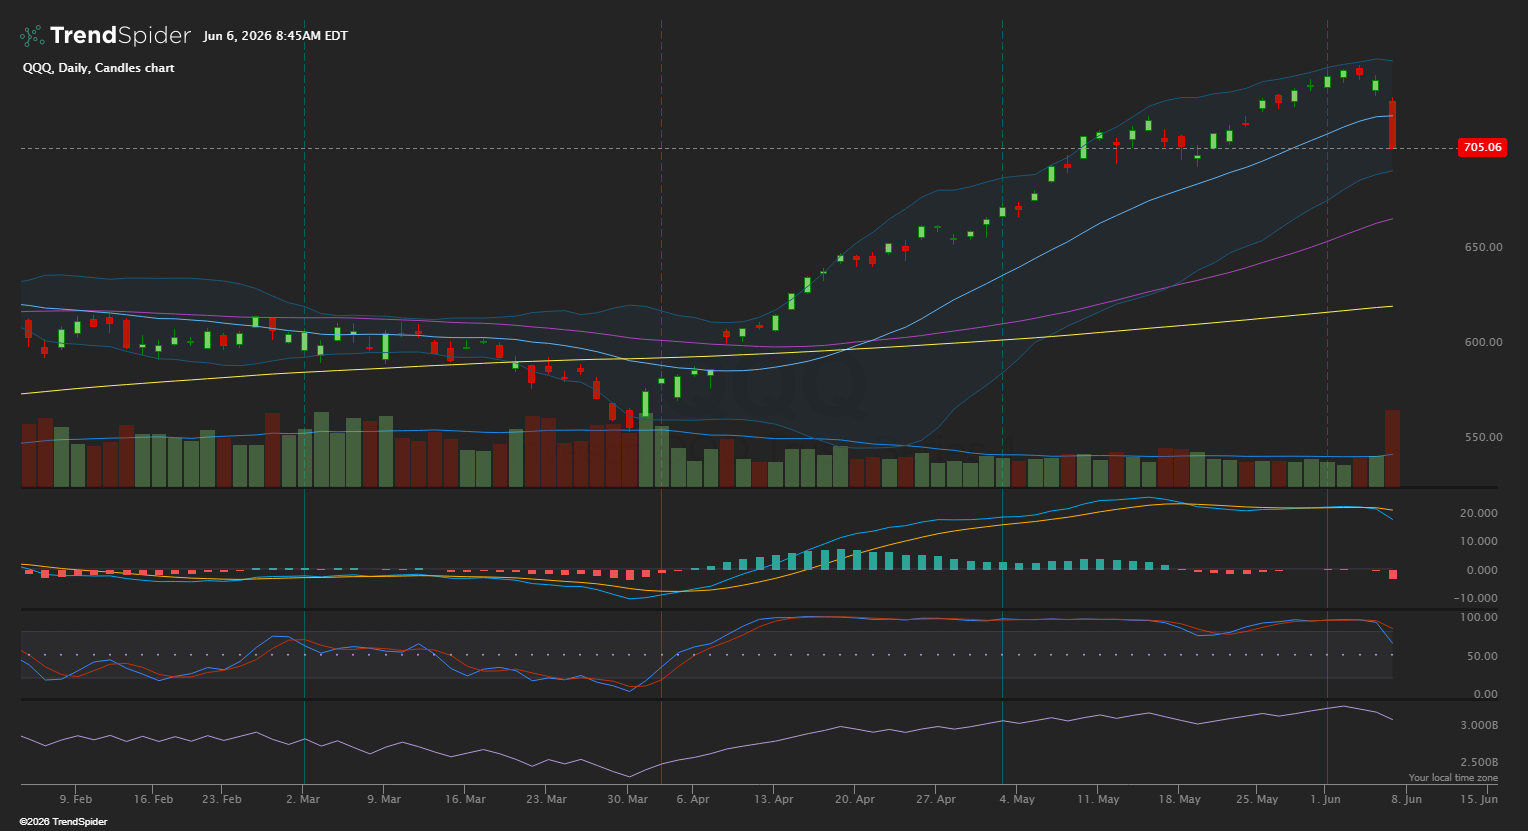
Structure is still bullish on both charts. The 50-day and 200-day sit well below price. But the parabolic move is over, and multi-week sideways or downward consolidation is the higher-probability path from here.
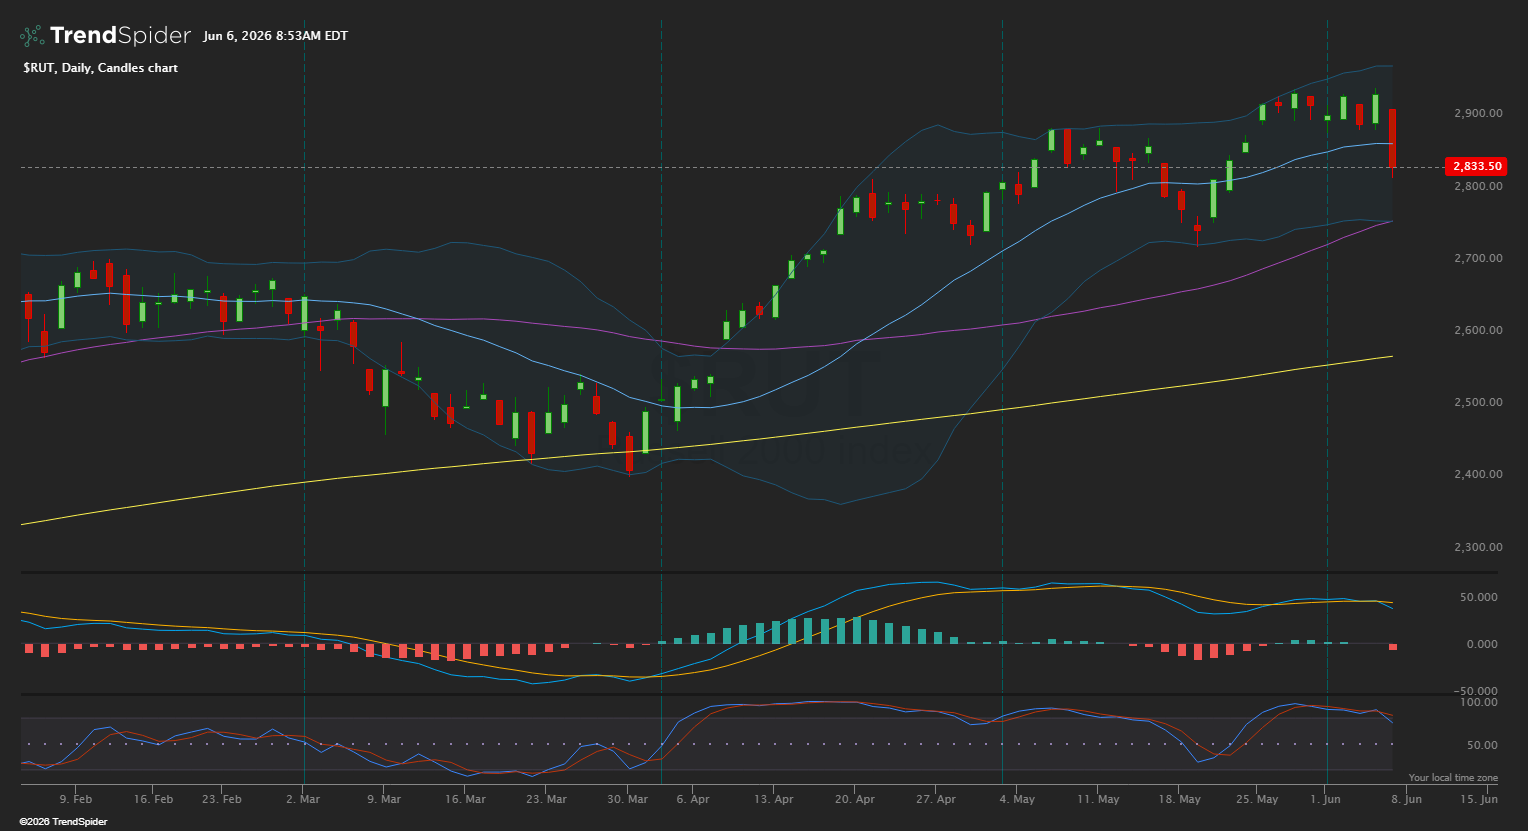
RUT is at $2,833.50 after a sharp red candle that broke the 20-day moving average around $2,840. Small caps showed intraday strength early Friday before reversing into the close. MACD histogram flipped negative for the first time since April. Stochastic rolled from above 80 toward the 50 line. The 50-day MA near $2,775 is the next support, with the 200-day well below at $2,500. The longer-term structure is still bullish, but the small-cap rally that began in early April has lost its 20-day, the same level SPY and QQQ are testing. Small caps had every chance to lead Friday and they did not. The rotation out of tech is going into defensive large-cap sectors instead of into small caps.
ETF Screen Snapshot (78 sector/thematic ETFs, as of 6/5)
Broad damage: 58 FAIL, 15 WATCH_PULLBACK, 3 WATCH_EARLY, only 2 PASS_LEADER. That is 74% of the universe failing on long-term trend criteria. Important caveat: the screen weights multi-week relative strength, so the defensive sectors that bounced Friday still show as FAIL because they had been losing to tech for weeks. One week does not reset those scores.
The two PASS_LEADERS:
IHF (US Healthcare Providers): $51.93, +2.4% above 20d, RSI 67.
IYT (Transportation): $84.61, +3.1% above 20d, RSI 63.
Last week's leaders, this week: MAGS, GGME, SLX, PBD, BLOK all dropped from PASS_LEADER to WATCH_PULLBACK. IEMG went straight to FAIL. SKYY held best at WATCH_EARLY.
Worst FAILs by relative strength: ETH (-24% below 20d, RSI 16), BTC (-19%, RSI 19), GDXJ/GDX/SIL (-11 to -14%, RSI 34-36), URA/NLR down 8-11%.
Read This Week
This was a rotation event combined with an overbought-semi unwind. Strong jobs data spiked yields, the chip crowd got squeezed, and money rotated into defensives. The SPY and QQQ uptrends are wounded but still alive. SPY at the 20-day and QQQ right at the 20-day are the levels that matter Monday.
The leadership shift is the actionable read. Defensives caught the rotation bid: XLP, XLU, XLRE, XLV all green for the week. Healthcare providers (IHF) and Transports (IYT) are the only PASS_LEADERS in my screen. If this rotation continues another week, expect those defensive sector ETFs to start showing up as new leaders as their relative strength scores catch up to the price action.
What to watch: do the 20-day MAs hold on SPY and QQQ, or does the selloff extend toward the 50-day at $720 (SPY) and $660 (QQQ)? Do semis stabilize? CPI on Wednesday matters more than usual given the rate hike repricing.
The Russell 2000 also broke its 20-day, so the rotation runs along style lines rather than size lines. The clean read is large-cap defensives over large-cap growth.