GNG Research
We read the footnotes.
Twenty years of data, the desk's notes on every name we cover, and tools that don't pretend to be anything else.
Free forever. No card. Cancel anytime. Log in Sunday newsletter
Research and News
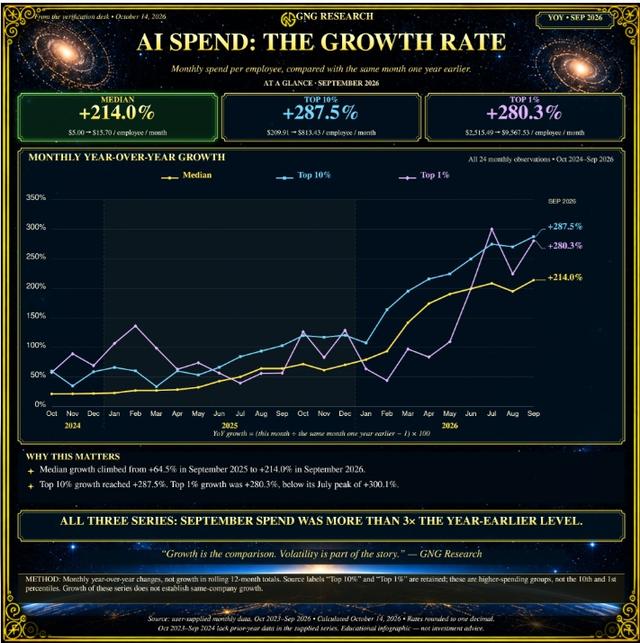
Tokenomics 5: 8% Recession Risk, The Truth About Inflation & Interest Rates, Stocks Up To 50% Undervalued, And AI Spending Up 214% (And the Charts To Prove All Of It! It’s A LOT More Interesting Than It Sounds, I Promise! 🤔😉😂)
Corrections feel short lately? Every 3 months we get FACTS (earnings)... and when the economy is growing, stocks recover in about 1.4X the time they fell. A 2-month drop = 3 months to reach record highs. Recession because Hamburger Helper sales are up? 🤔 The bottom 20% spend every dollar they have, BUT that's just 2% of S&P profits. The Mag 7: 12.5X that last year, ~15X this year. Where's the recession? 😂 After WWII, recessions hit every 4.6 years. Since 1982? Just 4 in 44 years, each with a shock behind it. JPMorgan's David Kelly says "We're post cycle"... and so do I. A 15% baseline recession risk? Too high 🤔 Priced for perfection? On Oct 12, the S&P 500's PEGY was 0.69, 47.8% below normal, and ALL 6 investing styles we track price in less growth than Wall Street expects. It's the everything ANTI-bubble 🤯 Out-of-control inflation? Real-time inflation is 2.91% and CPI is 3.7%... vs a 3.3% average since 1913. Historically NORMAL. And the bond market (the smart money) isn't worried about runaway inflation. Highest 10-year yield in 20 years? A 2.9% real yield is NORMAL after the freakish ZIRP era. Who dumps a Nasdaq expected to grow cash flow 31% a year for 2.9%? Fed hikes don't run my portfolio. Asset allocation does 😂 Is the AI boom cracking? Ramp's data: median AI spend per employee is up 214% in a year (vs 64% a year ago). ACCELERATING. Kimi and DeepSeek eating everyone's lunch? Anthropic and OpenAI get 96.5% of the spend 🤣 The scariest AI-bubble math says AI revenue must hit $3T by 2030 (double it every year). On real spending it's 52% a year... and AI infrastructure revenue just TRIPLED. So CTFD (calm the frack down) 🤣😂
Adam Galas/
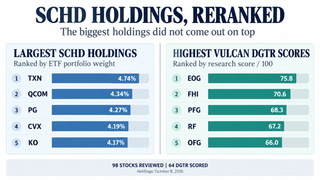 I Ranked SCHD's 98 Holdings for Dividend Growth and Total Return. The Biggest Ones Didn't Come Out on Top.Glenn Ford/
 5 High-Yield Dividend Picks for Q4 2026Connor Graham/
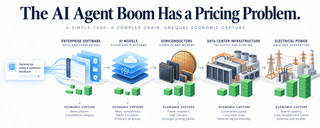 The AI Agent Boom Has a Pricing ProblemGlenn Ford/
 FROM HELL'S HEART I STAB AT THEE: 🤔😉😂🤬CTA Was the Best Hedge on Wall Street for 4 Years... Then Simplify Lost Its Mind. Here's the 40% Hedging Bucket ZEUS Is Moving ToAdam Galas/
Latest research
All researchSnapshot checked
 America’s Industrial Rebound Is Stronger Than Its Factory RecoveryTony Nash/
 Meet The Hidden Panic Indicator - The Fear Gauge The VIX Should Have BeenLeo Nelissen/
 Uber: I'm Starting To Like What The Market Is DumpingLeo Nelissen/
 The Supply Chain Fortress: How Japanese Industrial Consolidation Shapes Global GrowthTony Nash/
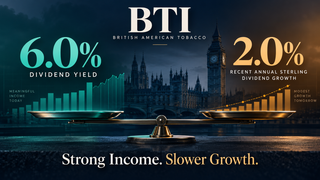 BTI Is My Largest Dividend Payer. I'm Testing Whether It Deserves That Weight.Glenn Ford/
 AI Needs $6.3 Trillion - KKR Just Told Us Where The Money GoesLeo Nelissen/
 The Structural Fracture in Global Semiconductor Supply: Why TSMC and Samsung Face a RecalibrationTony Nash/
 I'd Buy Big Tech's Biggest LaggardLeo Nelissen/
Daily Movers
Change since openSnapshot checked
Top gainers
Top losers
U.S. markets
SectorsIndex ETF share prices, not index levelsSnapshot checked
Upcoming earnings
Full calendarLargest reporters by market cap, next seven daysSnapshot checked
FriOct 16
MonOct 19
TueOct 20
WedOct 21
Dividend corner
Dividend stocksDeclared ex-dividend dates, next seven daysSnapshot checked
Discover
Snapshot checked
Learn about investing
- BetaA measure of how strongly a portfolio moves with the broader market, where 1 means in line, above 1 means more volatile, below 1 means more defensive.
- Binding ConstraintA constraint that limited your portfolio: it would have been different without this rule.
- Black-Litterman ModelA method that blends market-implied returns with your own opinions about which assets will do better
- Calmar RatioAnnual return divided by maximum drawdown, useful when peak-to-trough loss matters more than volatility.
- Conditional Drawdown-at-Risk (CDaR)The average of the worst drawdowns in a backtest, used to optimize against deep peak-to-trough losses.
- Conditional VaR (CVaR)The average loss in the worst tail beyond VaR. Captures how bad the bad days really are.
Getting started
- How to Backtest a Portfolio: Analytical ToolsHow to backtest a portfolio, run a Monte Carlo simulation, screen options and forecast dividend income with GNG's four analysis tools, explained step by step.
- How to Track a Stock Portfolio and DividendsHow to track a stock portfolio on GNG for free: enter trades by hand or import a file, follow dividends and performance, and see what Pro Lite and GNG Pro add.
- Research Articles and Investing CommunityHow to find GNG research articles by author, tag or ticker, join the discussion in the comments, and talk with other members of our investing community.
About GNG Research
Institutional-quality research and tools, built for individual investors by people who do the work themselves.