
A Quick History Lesson About “Fundamentally Justified Luck”
The first of the “Shut up and buy something smart and you’ll thank me in a year series came on April 7th, 2025 (back on Dividend Kings) when I saw the following chart on Monday, April 7th, when the VIX hit 60.
which was actually inspired by Josh Brown (CEO of Ritholtz Wealth Management), who said: “When the VIX hits 50, shut up and buy something smart, don’t be cute”.
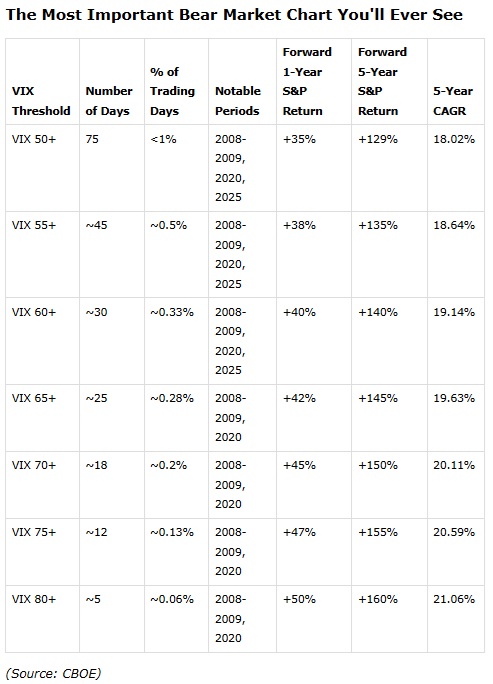
I saw this chart on April 7th in the morning, remembered what Josh Brown had said just days before, and it clicked in my head. “VIX 60 = 40% historical rally in 12 months. Headlines be darned, unless the world ends in 12 months buyers today will feel like geniuses and if the world ends, we’ll be too dead to care😉
No one can time the market bottoms; if they appear to be so, it’s because of luck…or what I like to call “fundamentally justified luck”😉
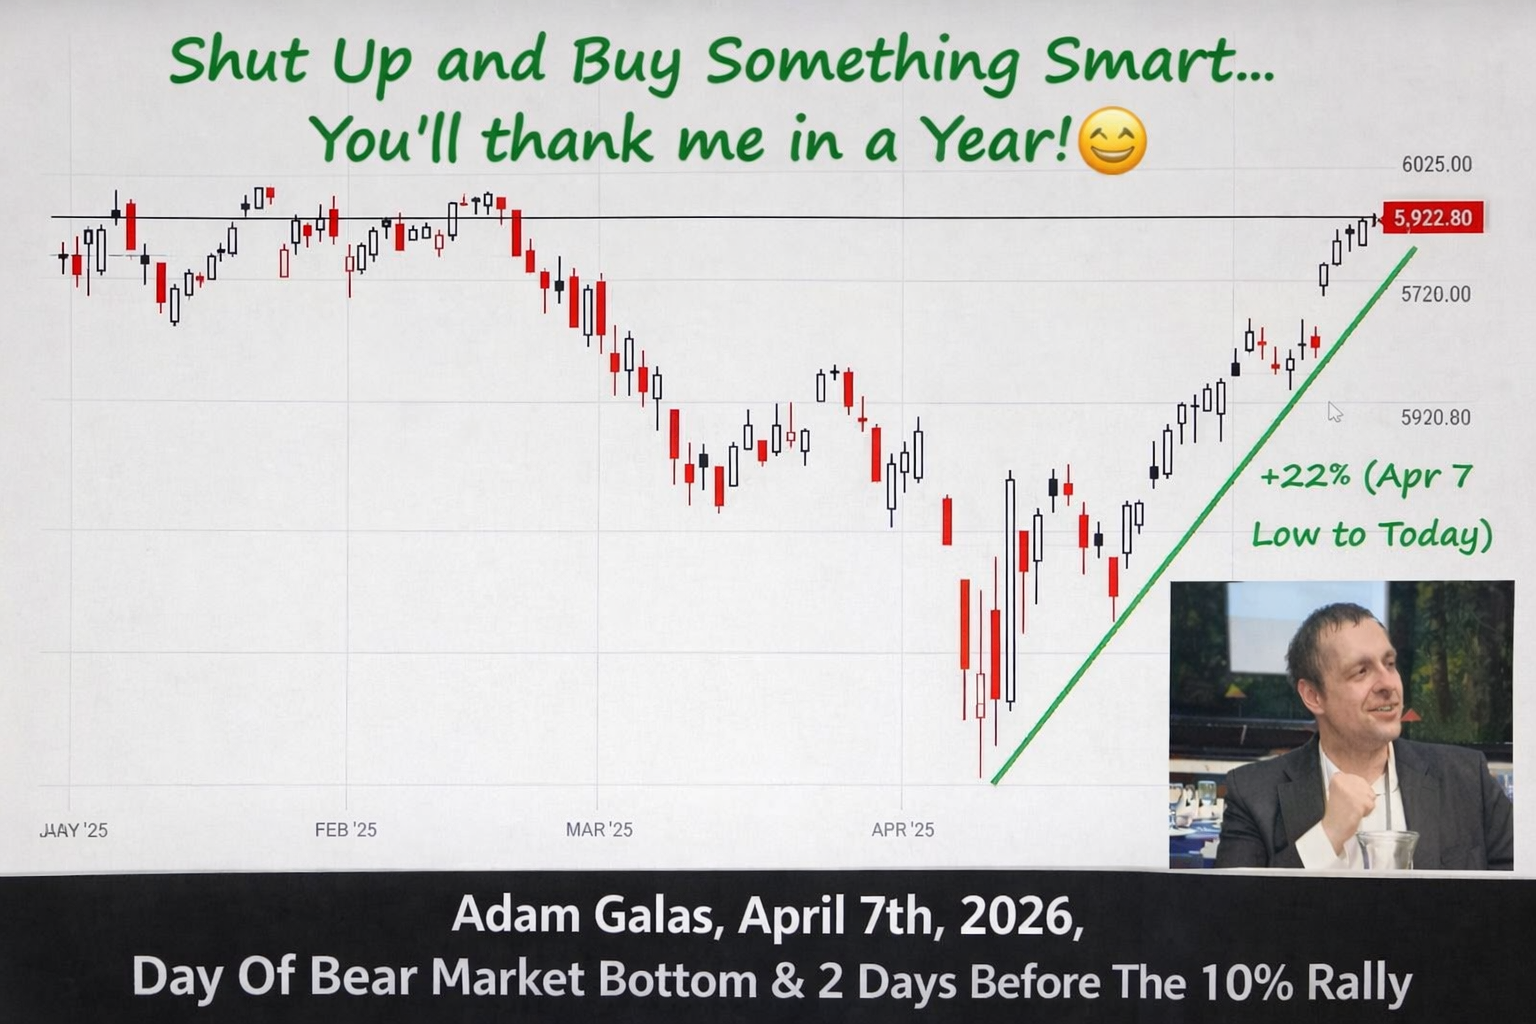
But I nailed the bear market bottom to the day (-20.8% peak intra-day decline), and that was luck sanctified by high probability fundamentals.

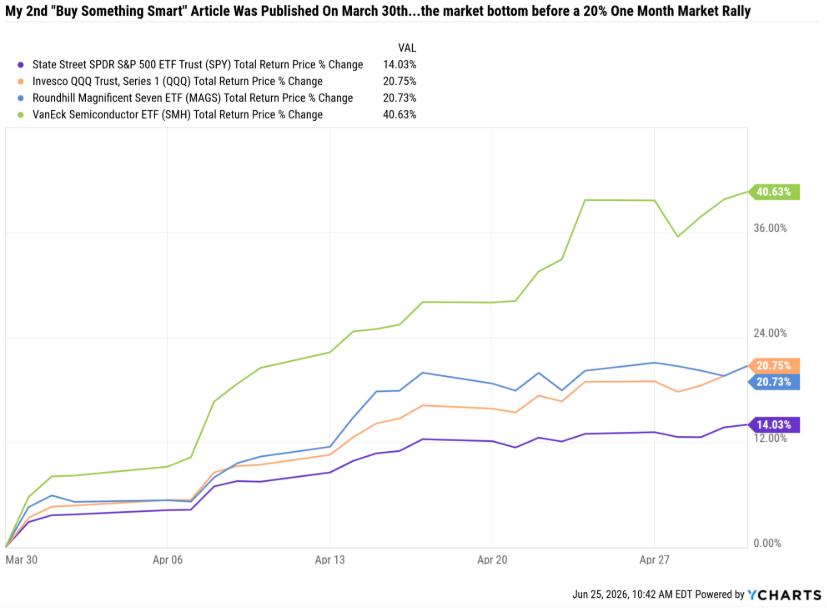
And so, a year later, during the Iran war correction (-9.8% peak intra-day decline is close enough), I wrote the following.
The Rally Continued

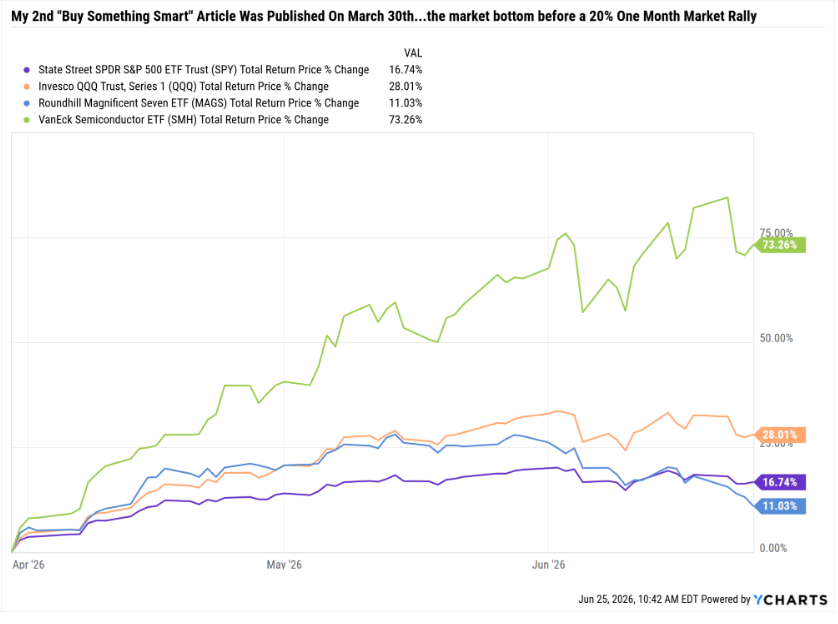
In the March 30th article, I pointed out the Nasdaq had 55% justified return potential within a year. And even with the recent tech sell-off, we’re +28% out of that 55%.
OK, so I’m back for a 3rd round of “Shut up and buy something smart” because I just saw 2 charts last night that are “slap you in the face” obvious. I am NOT saying “Friday, June 26th is the bottom of the tech sell off” I am saying “Buy the hyperscalers now and in 12 months the fundamentals, statistics, and history say you could benefit from 100% justified return potential.
Not a prediction of 100% gains, just pointing out that, in this article, I’ll walk you through why a 100% gain in the hyperscalers in the next 12 months would be 100% justified by fundamentals.
So if it happens, it will NOT be a bubble but will be completely justified by earnings growth and a return to market-determined, objective historical fair value multiples.
So let me walk you through my “Hot take” claims that 12 months from now, everyone and their grandmother is LIKELY to be saying “OMG in hindsight it was SO OBVIOUS that the hyperscalers were a screaming buy!”
Not just in hindsight, friends, in real time! So let me show you the math and charts to prove it😉😂🥳
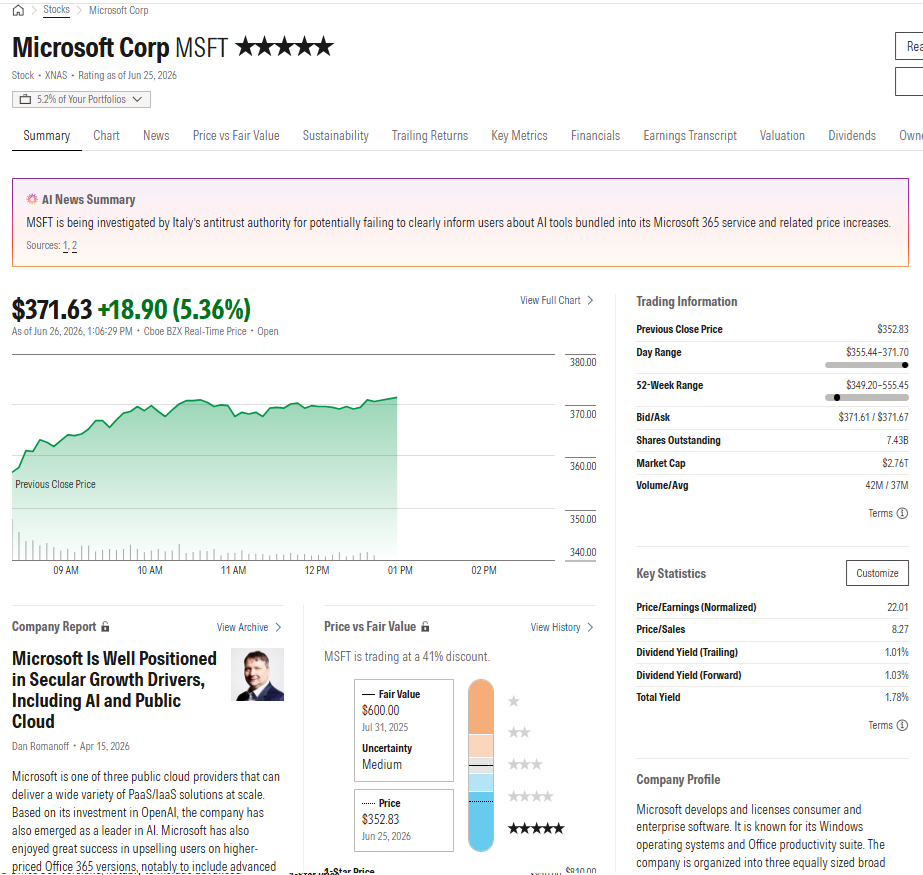
Bad news and MSFT is way up…this is what bottom price action looks like. Not a forecast that this is the bottom, but if it is? Well, that’s why this report is coming out on Friday😉
Why Tech Is Selling Off So Hard…
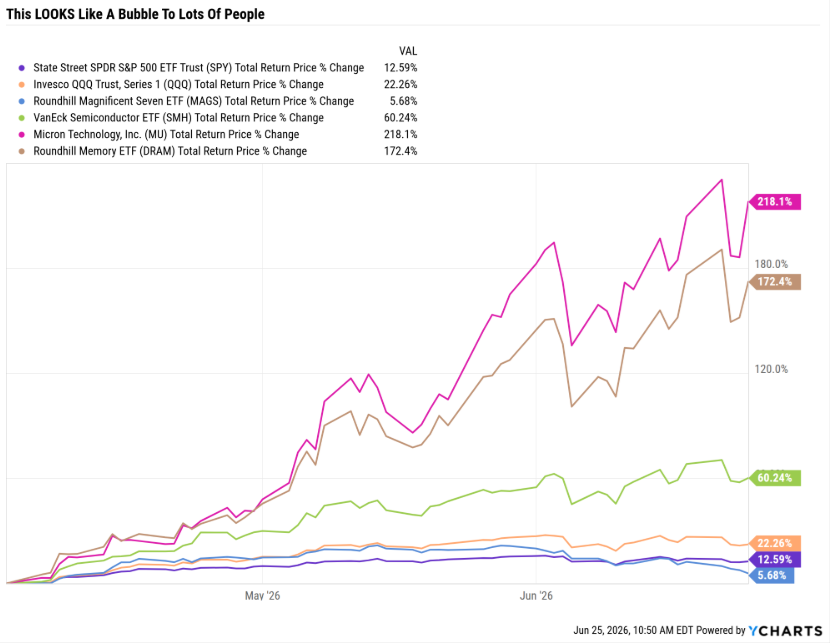
This explains why stock markets like South Korea’s doubled this year, and certain chip stocks went vertical (partially), BUT there’s a catch…
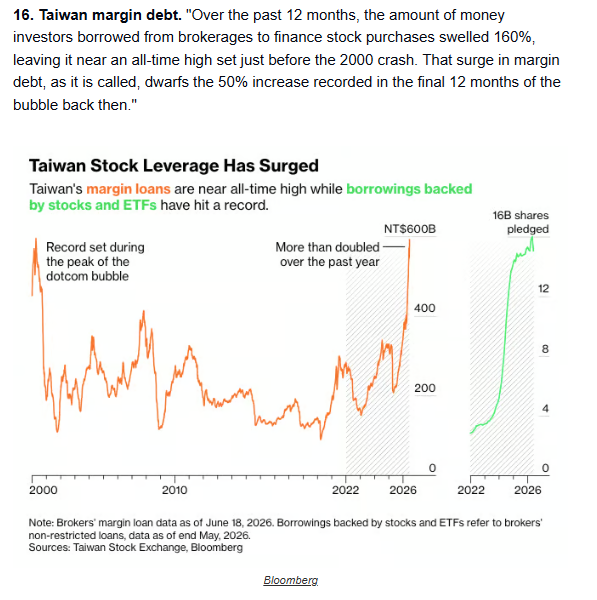
The recent weakness in Tech has some very smart people making parallels to the tech crash.
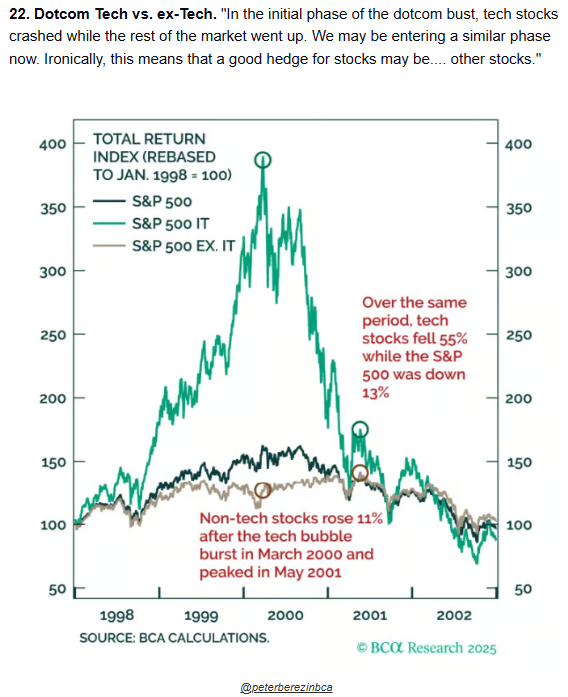
But let me explain why the scary parallels are NOT true; they are a mirage, and these kinds of charts are cherry-picking pattern-matching. In the age of AI, you can analyze all the data of history and find parallels between any scary time period and the modern day. So let me explain why this is almost certainly (97% confidence) NOT the start of a prolonged bear market in tech (and the broader market).
The 2000 tech crash lasted 37 months of stock declines.
The longest period of falling stocks in history (the Great Depression Crash of -88% was 34 months.
The S&P fell 50% and, the Nasdaq 82%, and some tech blue-chips like Amazon 93%.
THAT is why charts like this are so dramatic. If you lived through the tech crash (I did) it was a traumatic, visceral experience, and ANY thing that reminds us of that crash gives us investor PTSD😉
Relax, Friends, Breath, This is NOT The Tech Bubble (It’s An Anti-Bubble!)
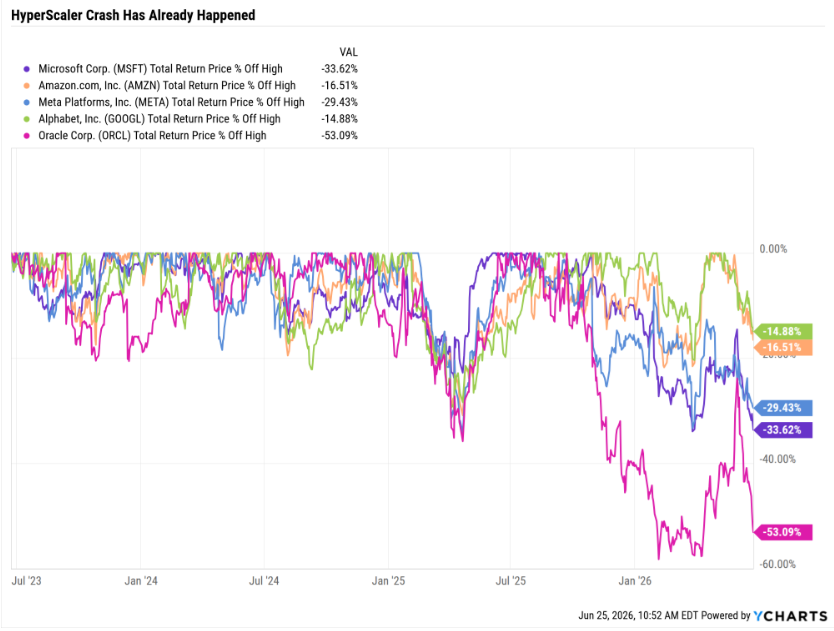
Some of the world’s best companies, like Microsoft and Oracle, are already down 34% to 53%.
But what about claims that the lack of free cash flow could make these asset-light companies nothing more than low-multiple industrials?
Let me show you something.
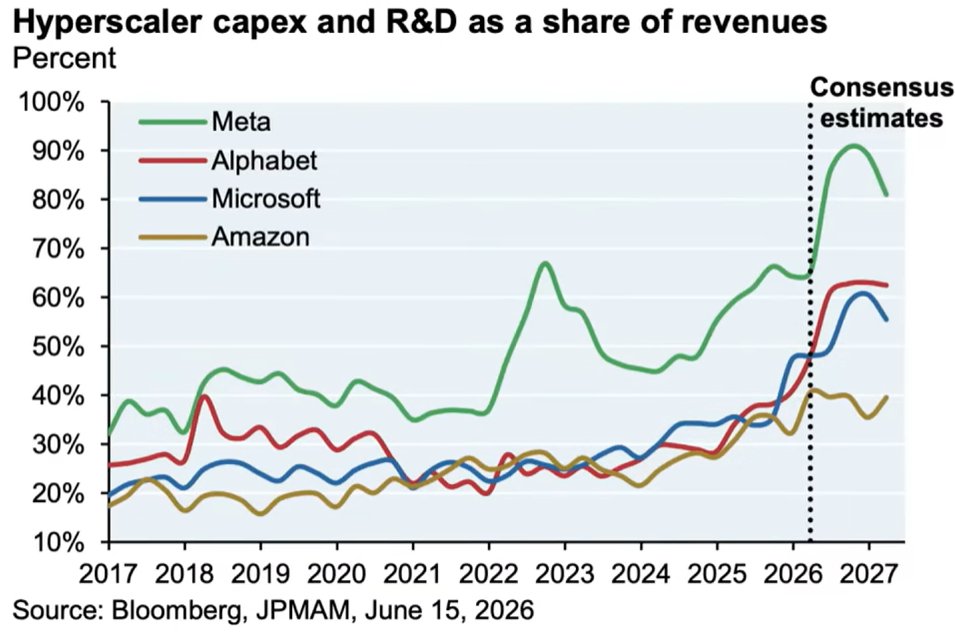
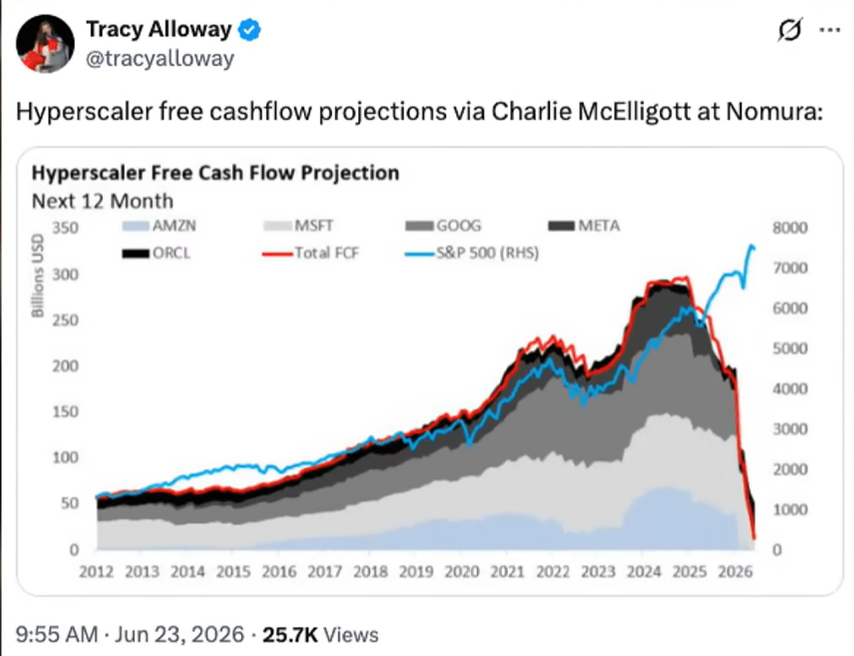
It’s easy to see the higher spending hurting free cash flow and jump to the conclusion that “OMG, an 82% crash in tech stocks is justified! There is no FCF! There is no intrinsic value! The multi-trillion market caps of hyperscalers are built on sand!”
But let me show you something that completely changes that terrifying narrative.
Stop Speculating And Look At The Facts
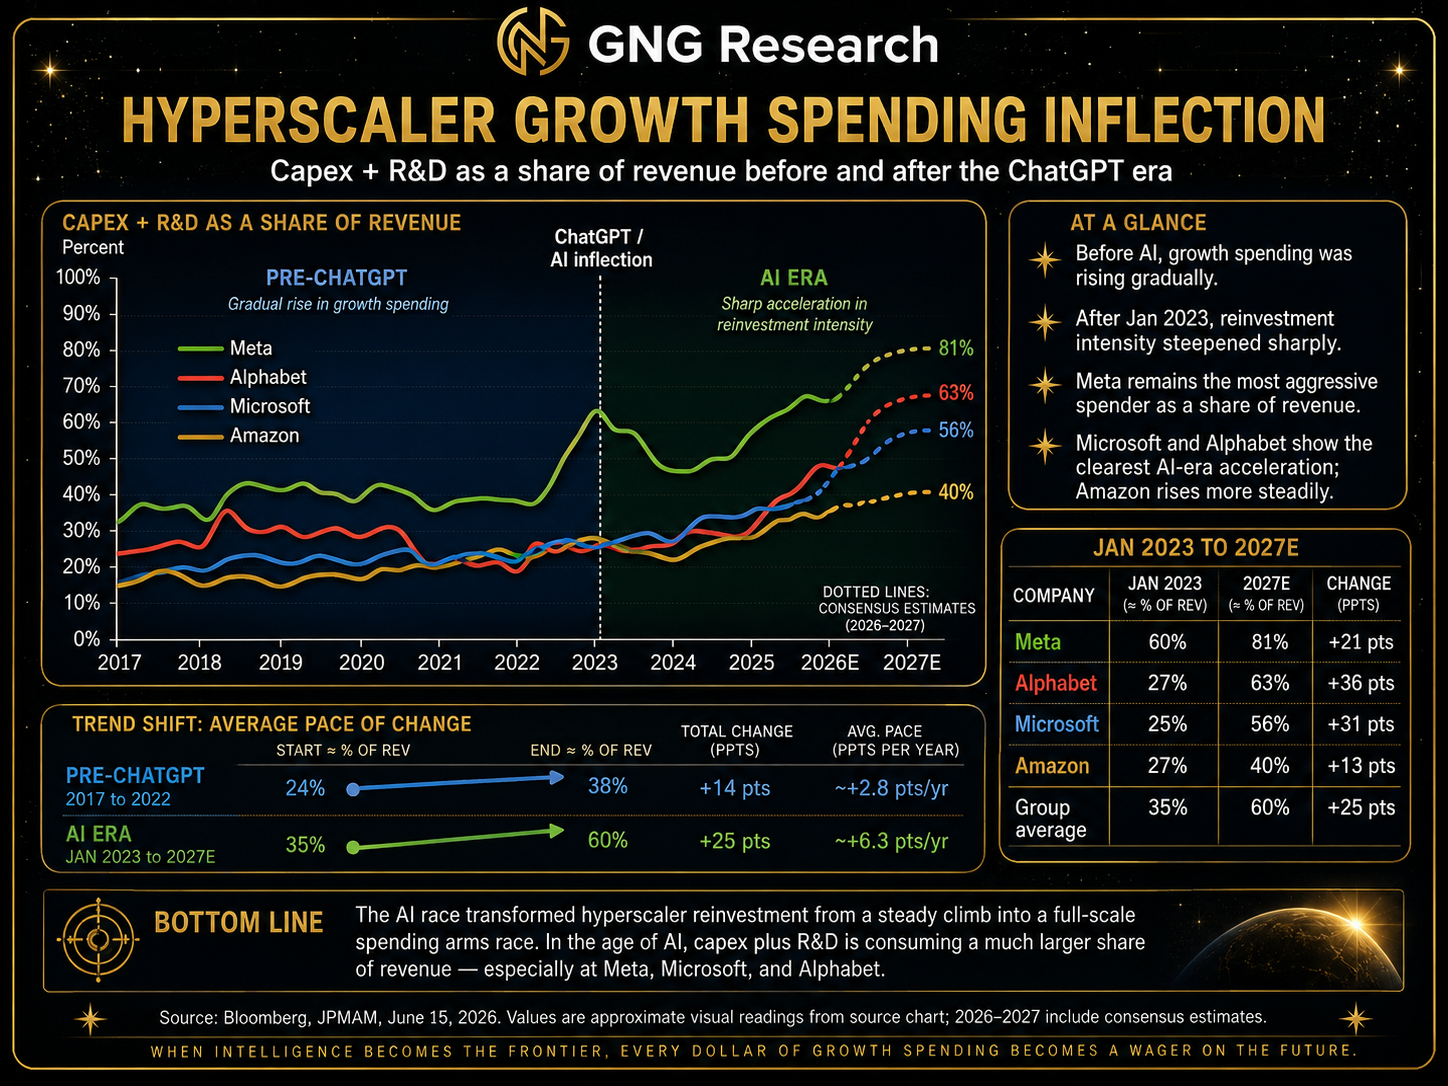
In the last 3 years, growth spending has accelerated. OK, so what is the rational way to consider the “fair value” multiples of these companies? Is it the “low asset lower capex” era? No, it’s the high-capex growth era.
So let’s take a look at that data.
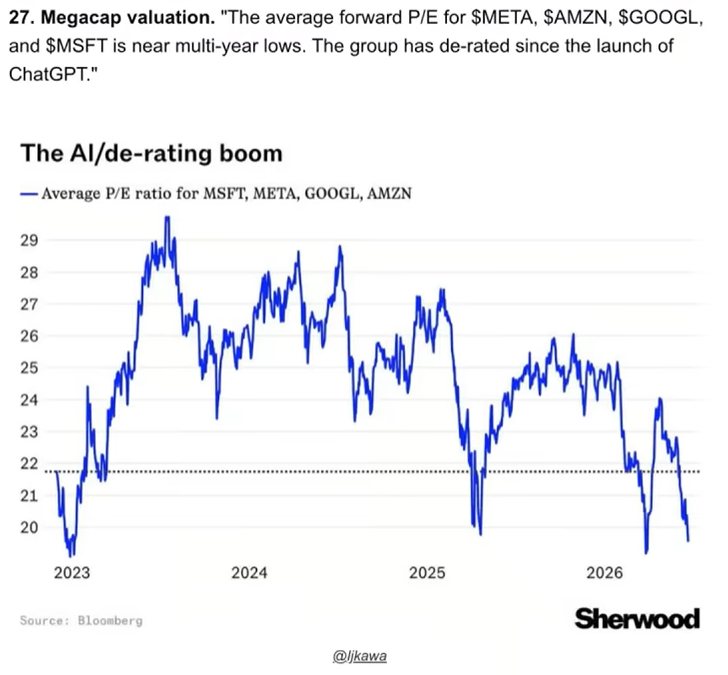
When Chat GPT came out on Nov 30th, 2022, the hyperscalers were trading at a forward PE of 22. They bottomed at a PE of 20 back in the October 2022 bear market low (the one that saw the S&P fall 28% and the Nasdaq 35%).
And as of 2 days ago (they have fallen about 2% more) their PE is down to 20…back to Oct 2022 bear market lows.
THIS is the point from which people think this is a “tech bubble” and a 50+% crash is coming? Really?
Ok, but aren’t the hyperscalers taking on massive amounts of debt?! Maybe PE is the wrong metric!
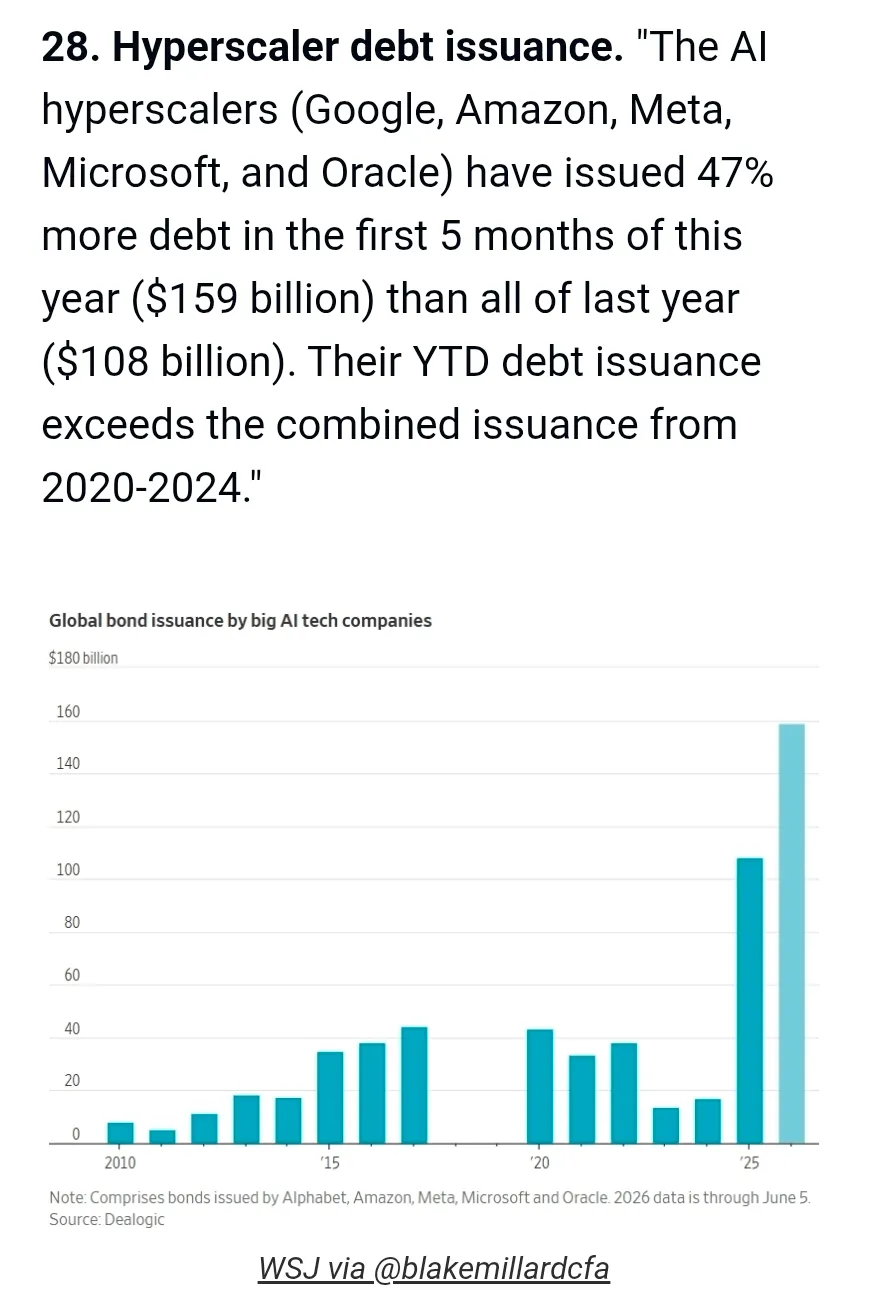
The Hyperscalers have taken out more debt in the first 5 months of 2026 than the last 4 years combined! OMG, that’s speculative mania! That’s dangerous! That explains the collapsing PE, right?
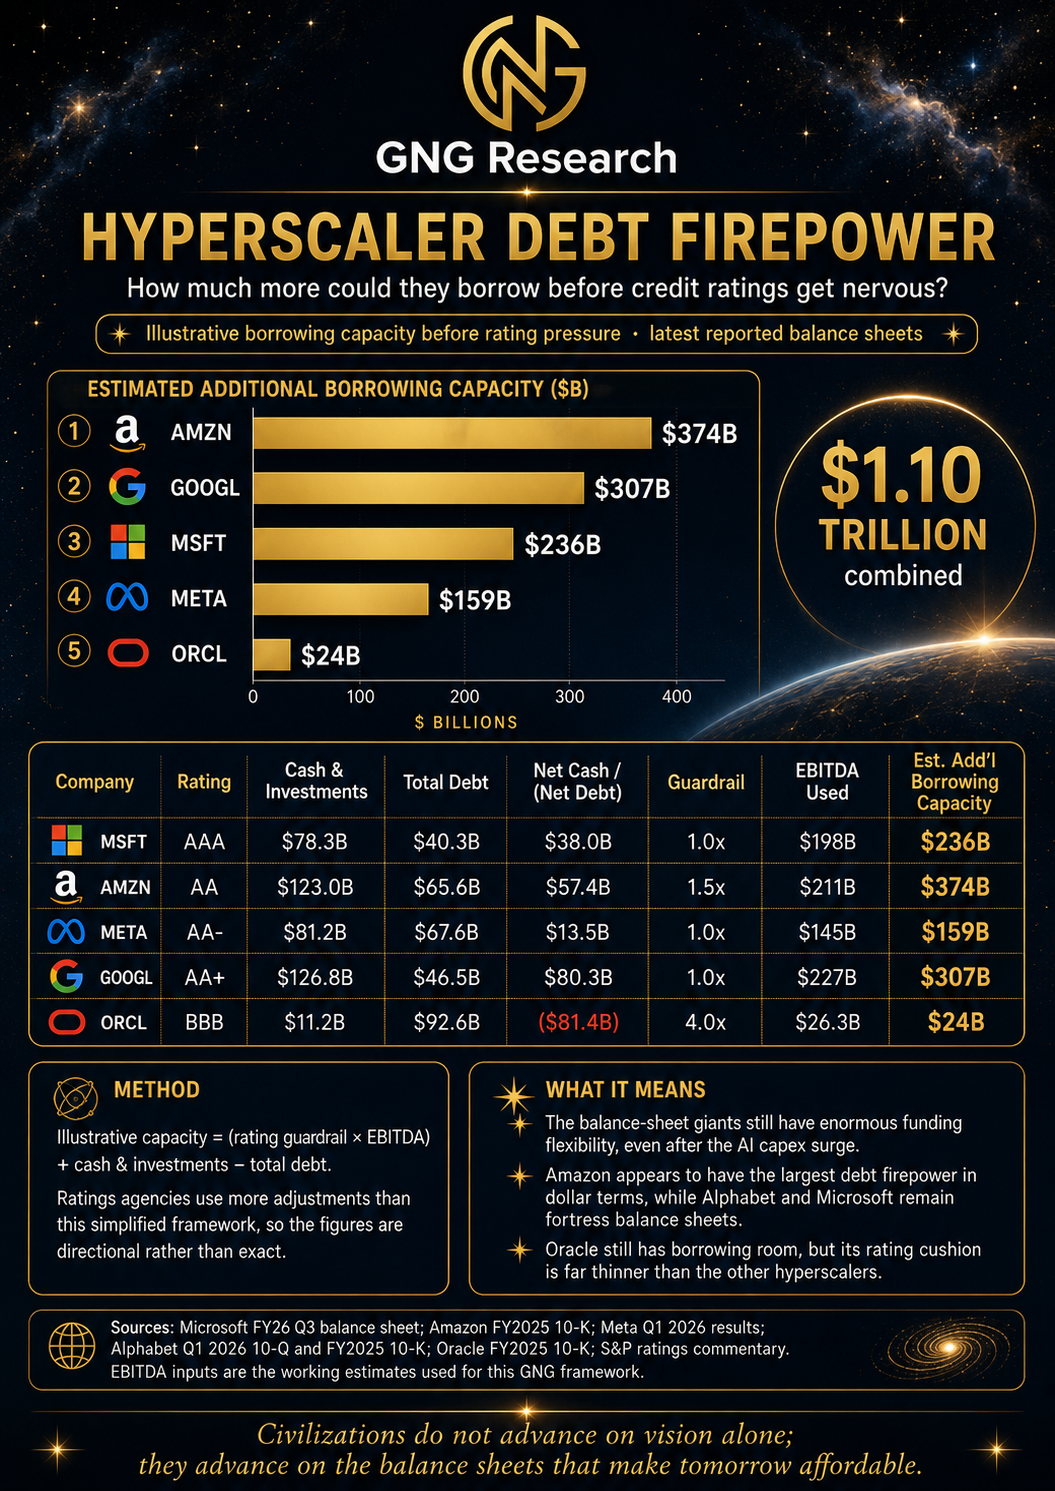
In other words, even if the hyperscalers keep borrowing at the current rate, it would equal $382 billion in debt this year out of $800 billion to $1 trillion in borrowing capacity without risking their AA to AAA credit ratings. That means they could borrow this much AND still double that borrowing next year (with strong operating cash flows supporting the debt) without risking their credit ratings.
That’s not a forecast, that’s putting $1 trillion in borrowing capacity in perspective. People are pointing to giant borrowing and claiming that’s dangerous. Debt/EBITDA is what rating agencies look at, debt itself is irrelevant, the ratio of debt to cash flow that services debt is what is critical. And other metrics like the interest coverage ratio (pre-tax profit/interest cost). You never see S&P say “Microsoft has $40 billion in debt and $2.8 billion in interest costs and that makes it a high credit risk”. Nope, MSFT is one of 2 AAA-rated US companies, and the reason is the RATIO of debt to cash flows.
Microsoft SHOULD be borrowing a lot…It has 100% guaranteed revenues (at full margins) and low leverage
Quoting Debt without quoting cash flow or debt ratios is not a valid financial critique
It’s like saying Nvidia at $200 is an expensive stock because $200 is a large number…what is the PE vs historical PE? What is the PEG vs. the historical PEG? What is the EV/EBITDA vs its historical? EV/EBITDA?
Price is 100% irrelevant to answering “is this stock a good value,” just as “Absolute debt level” is 100% irrelevant to whether a company is a dangerous credit risk.
Microsoft has $40 billion in Debt and an AAA credit Rating
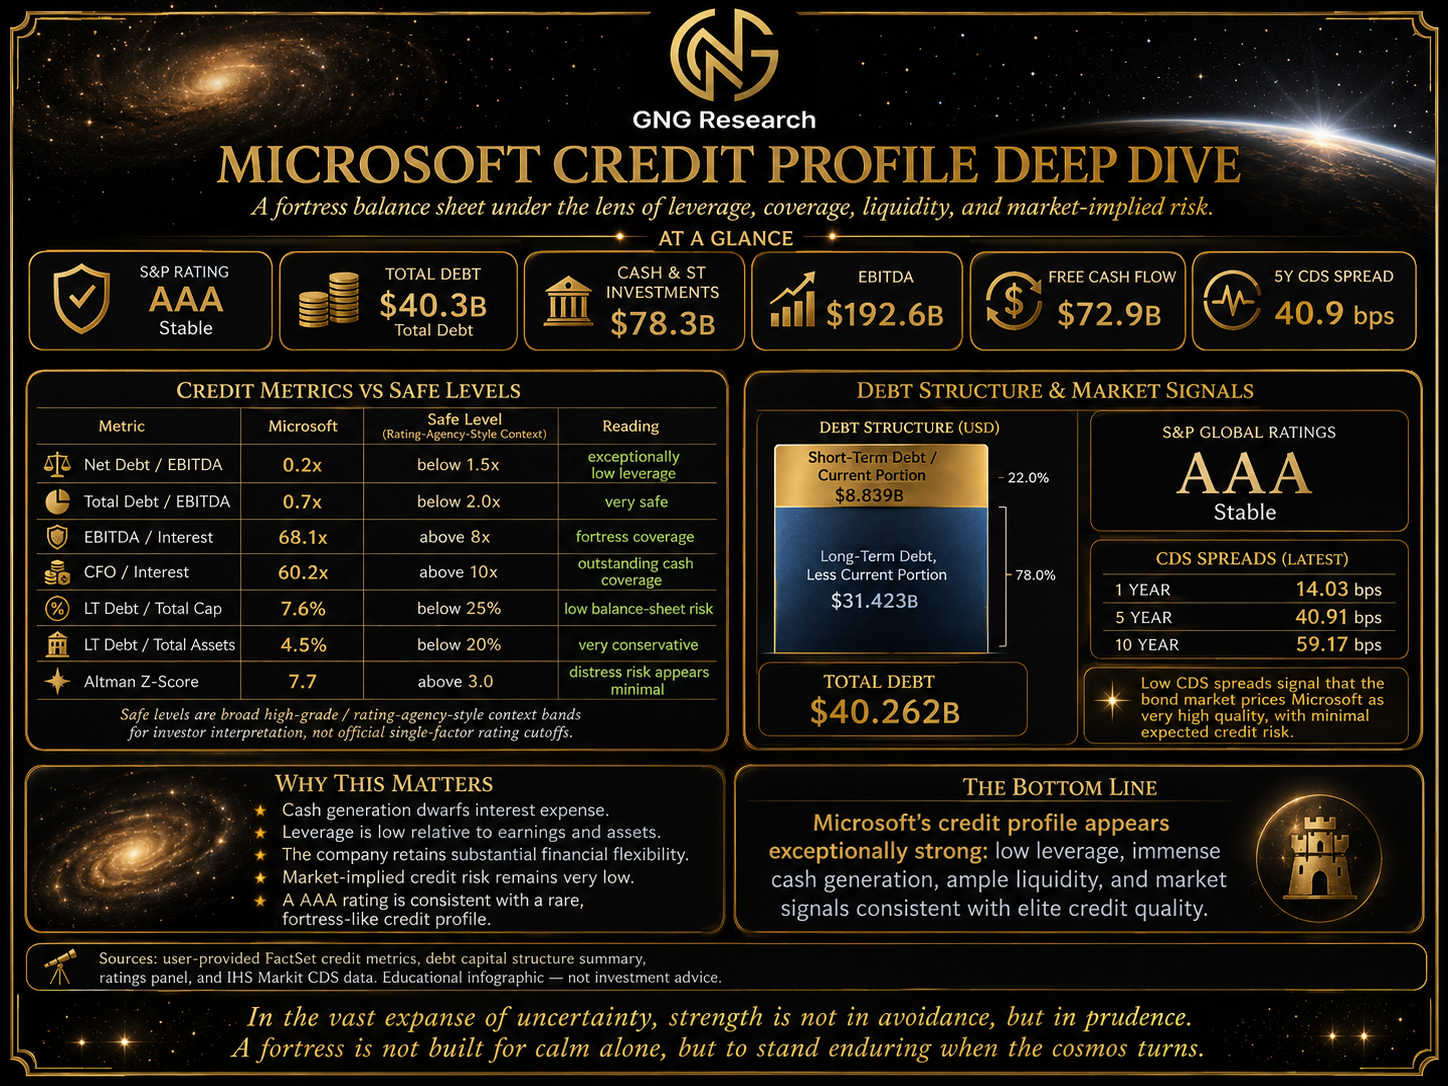
OK, so now that you know why investors should NOT be scared about hyperscalers borrowing a record amount (1/6th of their current borrowing capacity), let’s consider Enterprise Value/EBITDA, Private equities' favorite valuation metric, because it factors in debt.
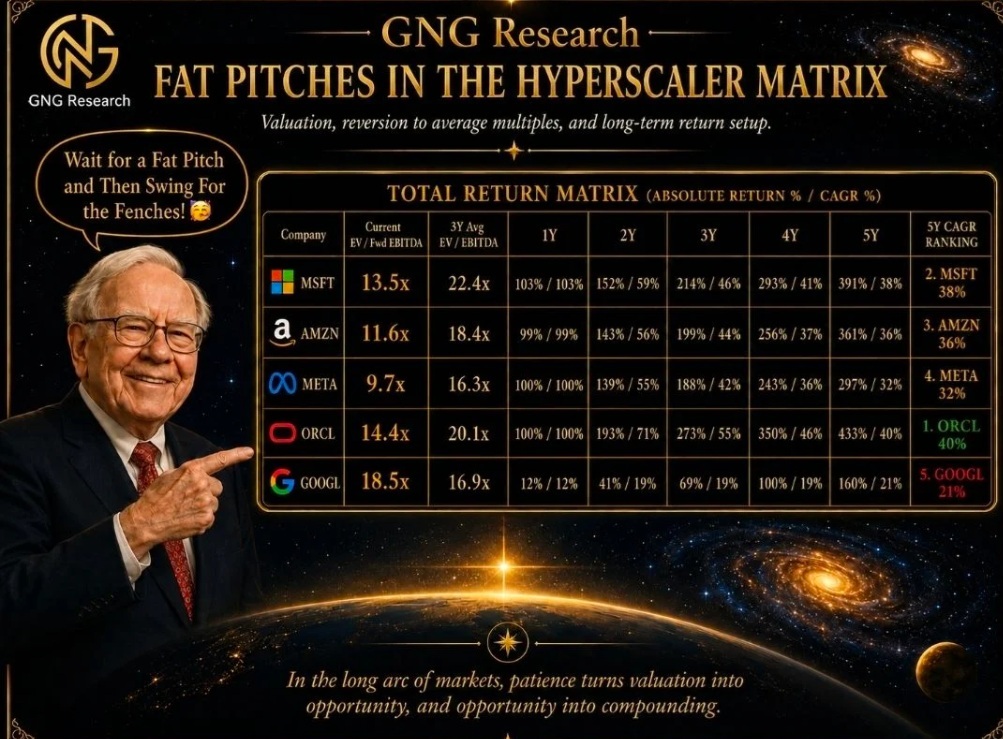
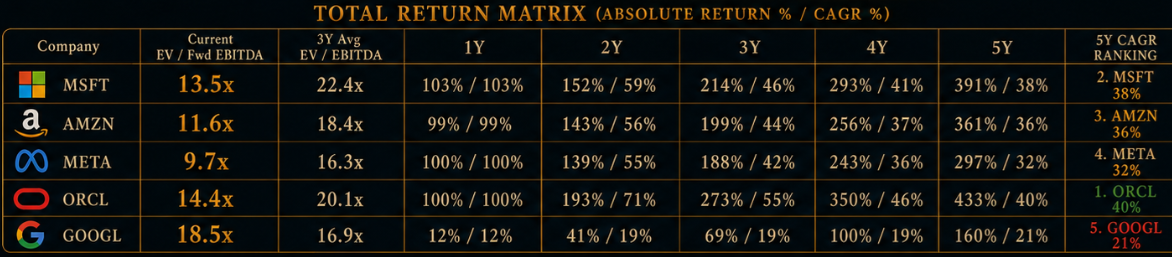
For context, the average private equity deal is closing at 13X EV/EBITDA. That’s the “Shark Tank” like deals billionaires are getting. Right now, the Hyperscalers are trading at 12.6X. Would you rather invest in a private company at 13X or Microsoft at 13.5X? At a 40% historical discount?
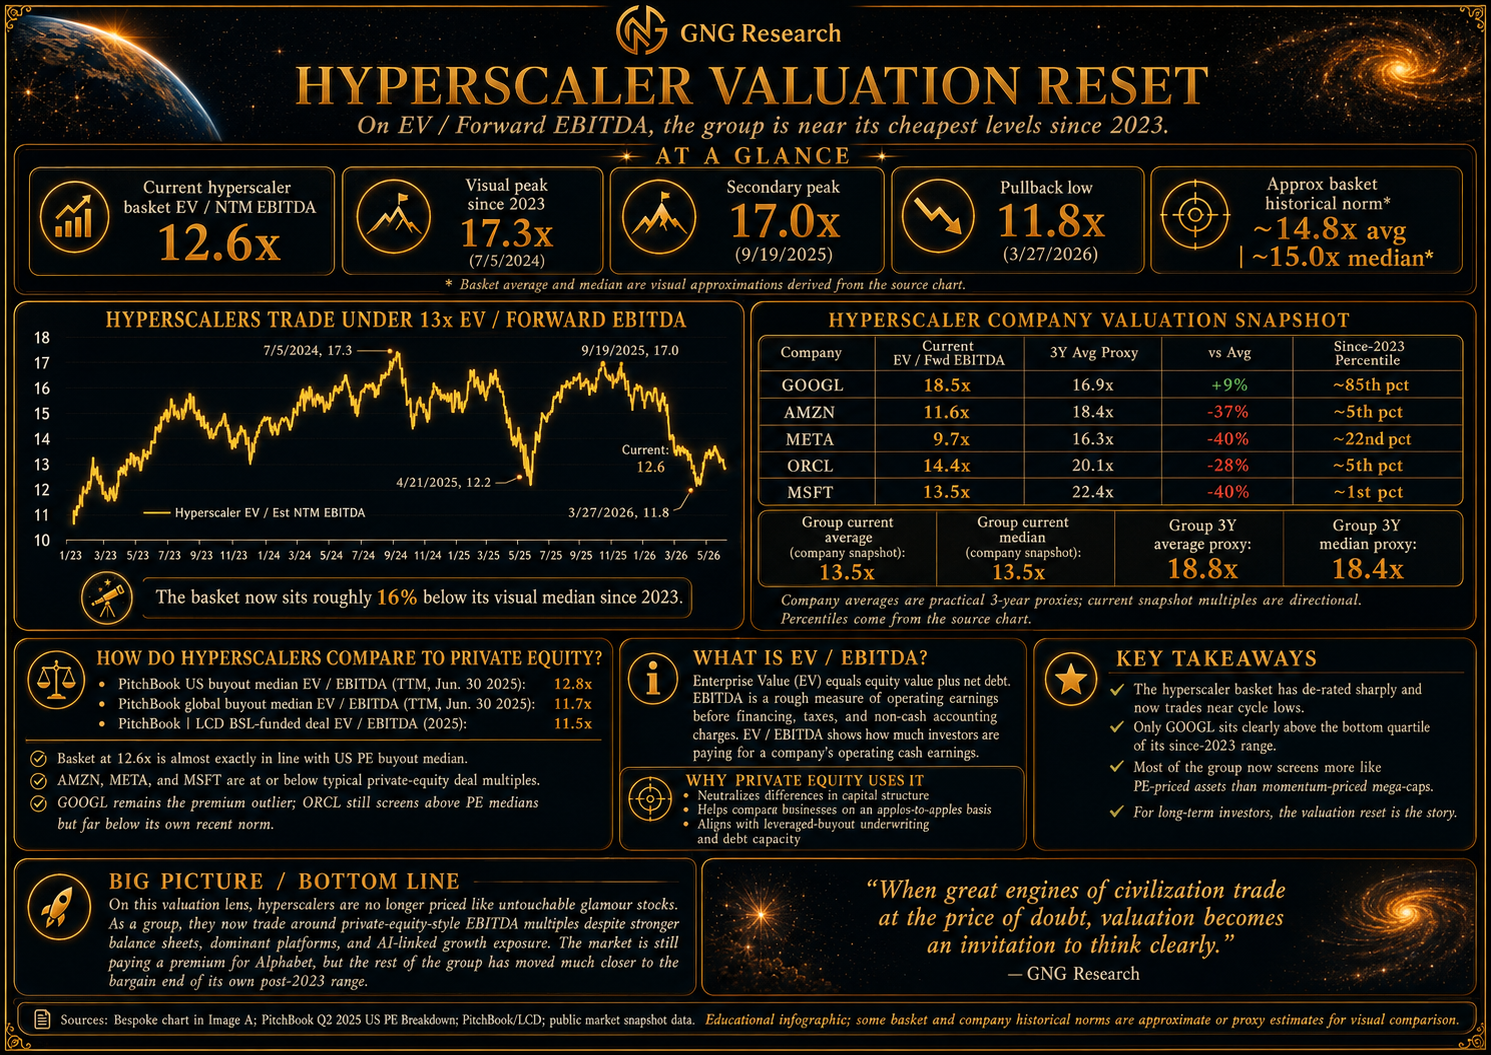
Remember that this is not the 10-, 20-, or 30-year average, when companies like Microsoft were mostly capital-light. This is the age of AI, the spending growth era. And what did BILLIONS of investors (over the last 3 years) pay for hyperscalers?
22.4X for Microsoft. And 18.4X for Amazon, the company that famously chose to have zero free cash flow for decades because it reinvested all operating cash flow (and sometimes borrowed on top so over 100% of operating cash flow) to reinvest in growth.
The idea that “investors MIGHT permanently de-rate hyperscalers because of high spending” is a SPECUALTIVE (but plausible-sounding theory. BUT the numbers above? There is NOTHING speculative about those. That’s 100% objective market-determined fair value fact.
Why I Am VERY Skeptical Of The “De-Rating” Hypothesis: Growth Spending = Growth (Which Growth Investors Like)
I am not saying that multiples don’t change over time. And I understand how hyperscalers becoming the biggest builders in history MIGHT potentially make them less appealing…except for one thing.
Growth stocks are bought by growth investors.
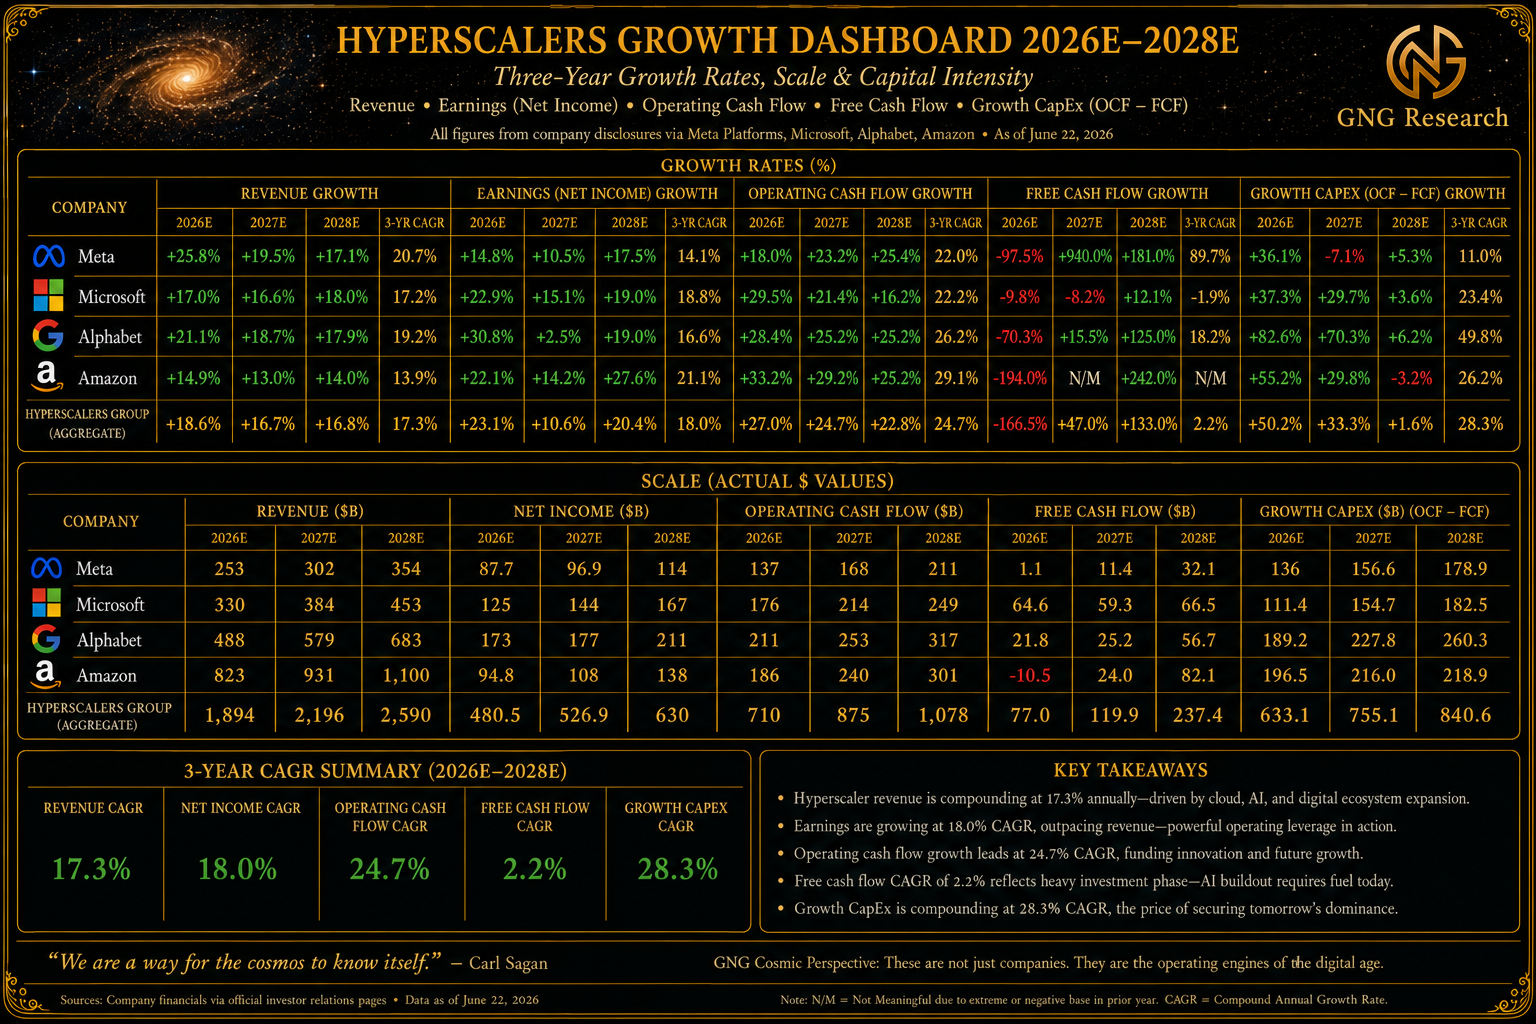
So let's ignore 3 years of actual market multiples to ASSUME that suddenly 25% growth = 13X EV/EBITDA but consumer staples = 25X? Growing at 6%?
Sorry, Coca-Cola isn’t THAT amazing a company😉😂
Remember that the growth consensus from FactSet goes out 5 years.
5 Year Consensus For Growth Spending Up $150 Billion In the Last 2 Months
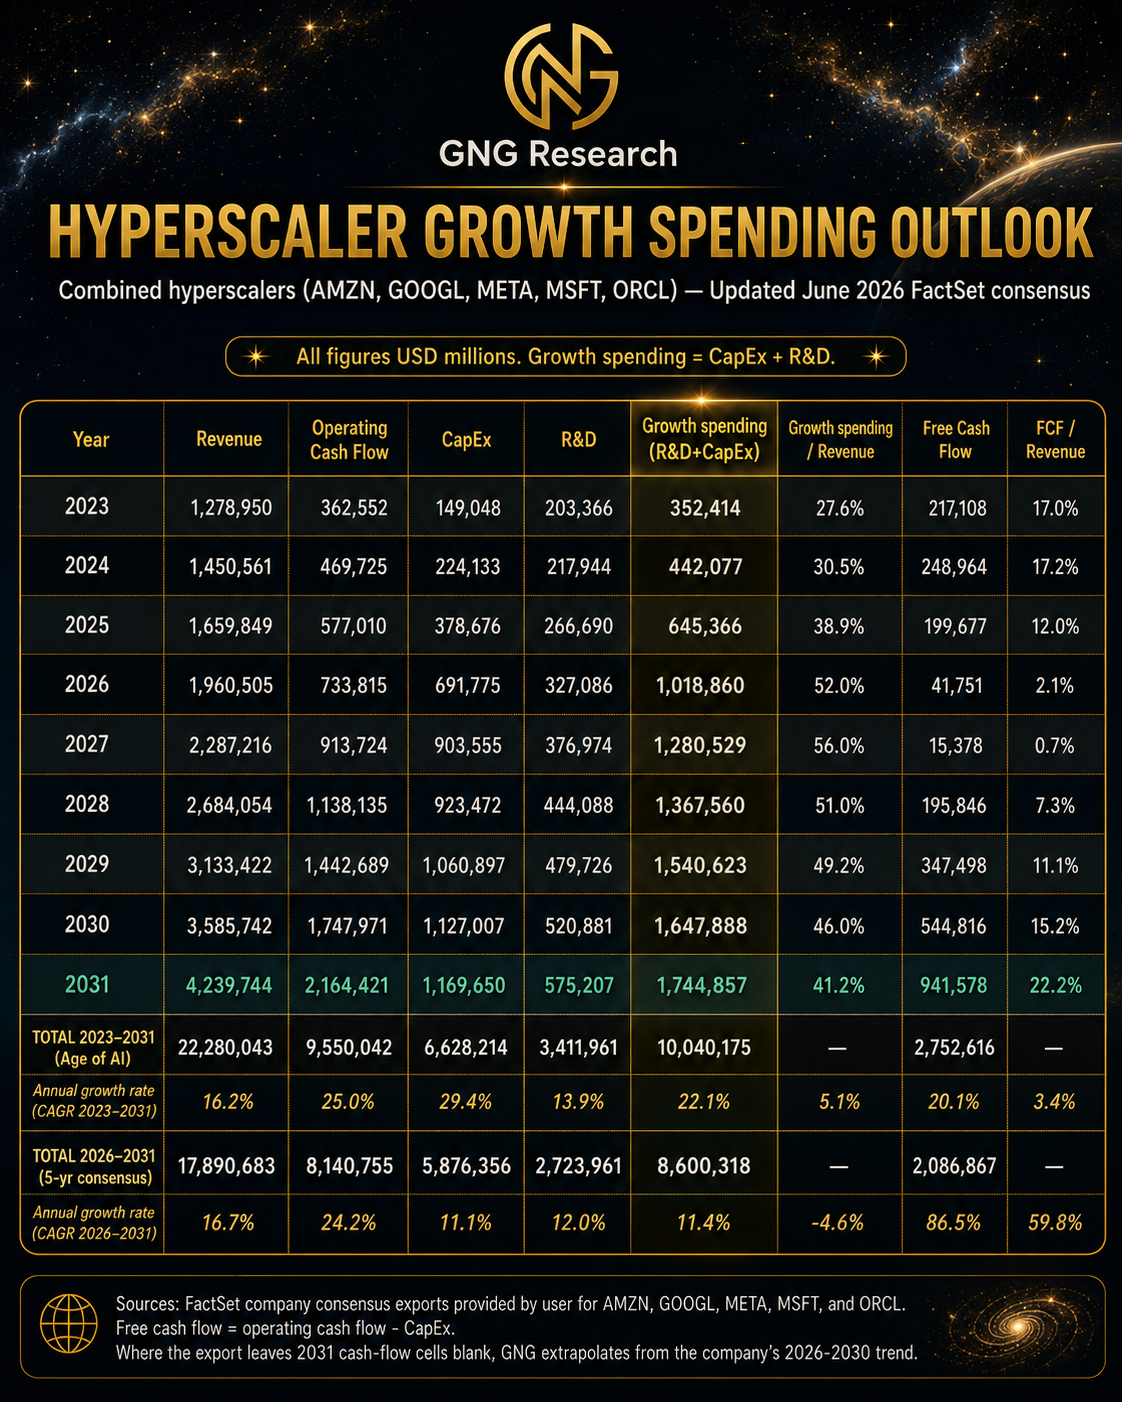
By the way, the 5-year growth spending consensus on hyperscalers went from $8.455 trillion to $8.6 trillion over the last 2 months. That might not seem like much :wink: after all, it's "just" 0.1% higher GDP growth...per year...for the next 5 years...BUT remember this is over just the last 2 months. At the current rate of increase, it's $174 billion of growth spending per year, indicating that in 5 years (if current capex growth estimates keep rising), the total 5-year growth spending will be $870 billion more, or a total of $9.47 trillion. That's $1.894 trillion per year on average, which is approximately equal to the R&D + infrastructure spending of the US + EU + China...combined. But you know, from 5 companies. The hyperscalers aren't companies...they are not even countries...they are economic continents... unto themselves.
Oh...and for those FCF purists, who worry that a lack of FCF growth could sink these multiples even further (from 13.5X!)? 20.2% CAGR FCF growth from 2023 through 2031 and from 2026 through 2027 (2027 the trough year) 86.5% CAGR. That's 656% or 7.56X growth in FCF over 11 years. Thanks to $10 trillion in growth spending. In 2023, the first year of the AI boom, 17% FCF margins on the hyperscalers...in 2031? 22%. Now...if only we could find a way to determine whether all the growth spending is justified?! 😉😂🥳
Do you know what that 2031 consensus reminds me of?
$1.2 billion in Hyperscaler Capex in 2031? REALLY?

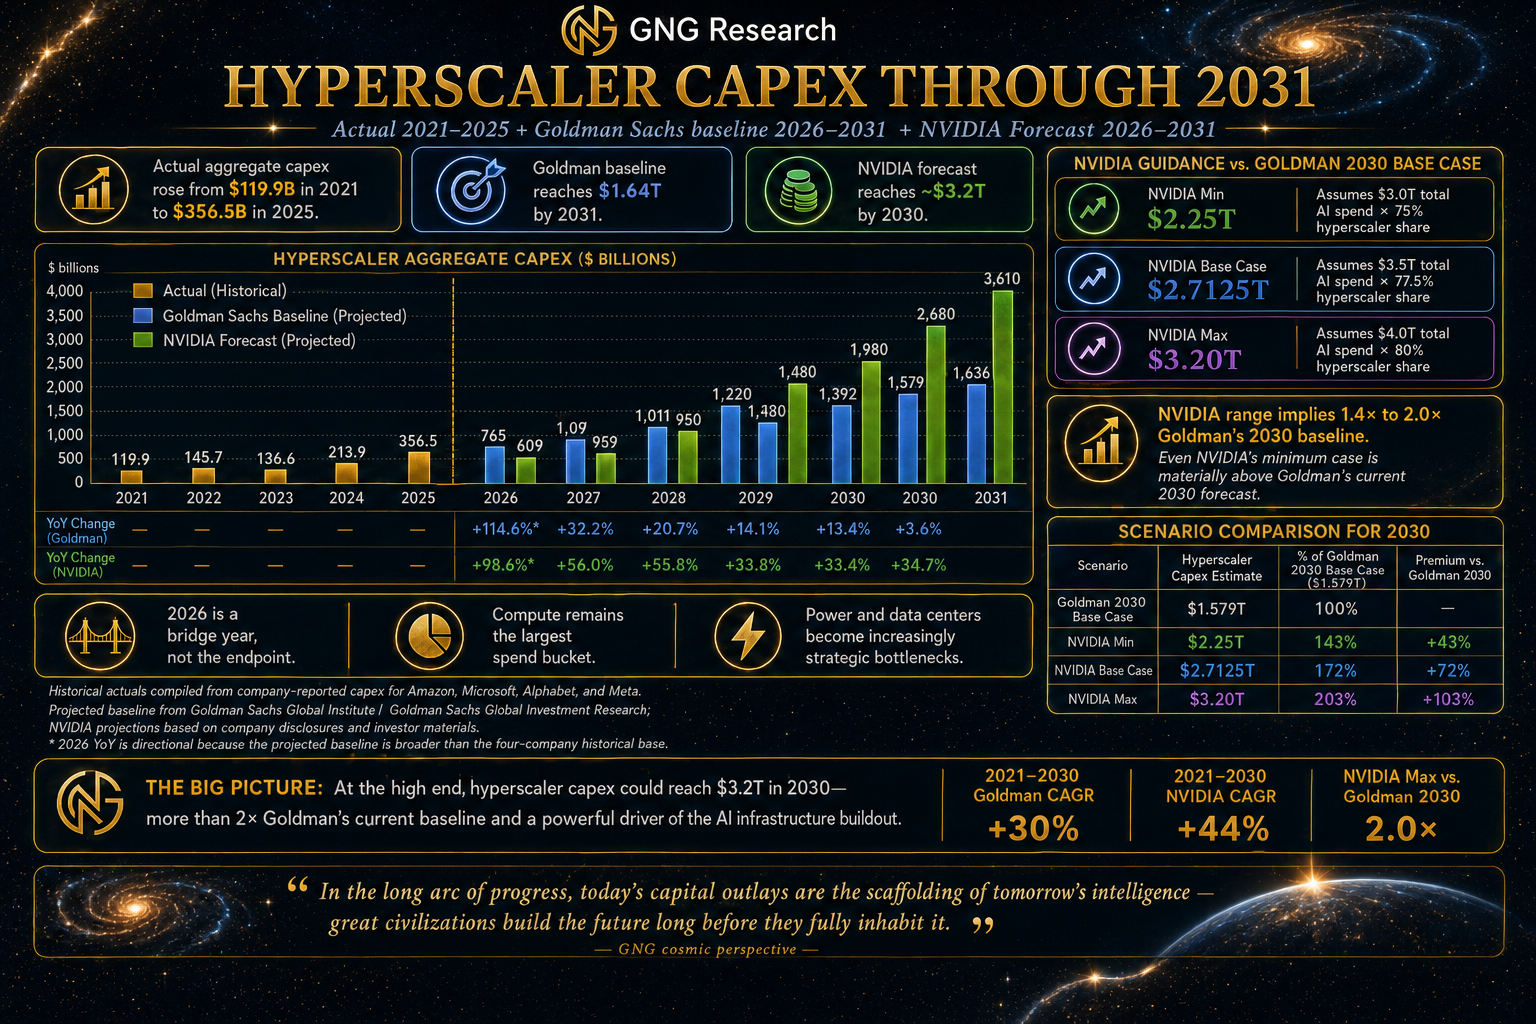
Add up the free cash flow and the $1.15 trillion Factset consensus, and you get $2 trillion in organic (non-debt funded) capex growth potential in 2031. Which is still below the low end of what Nvidia expects.
NVIDIA, which is forecasting $3 to $4 trillion in annual AI spending in 2030, is 72% above the Goldman Sachs base case, but note that the numbers have been rising every quarter since Q1 2023. That’s a 3.5-year trend that, as I explained in Tokenomics 2, is justified by the RPO backlog growth. ]
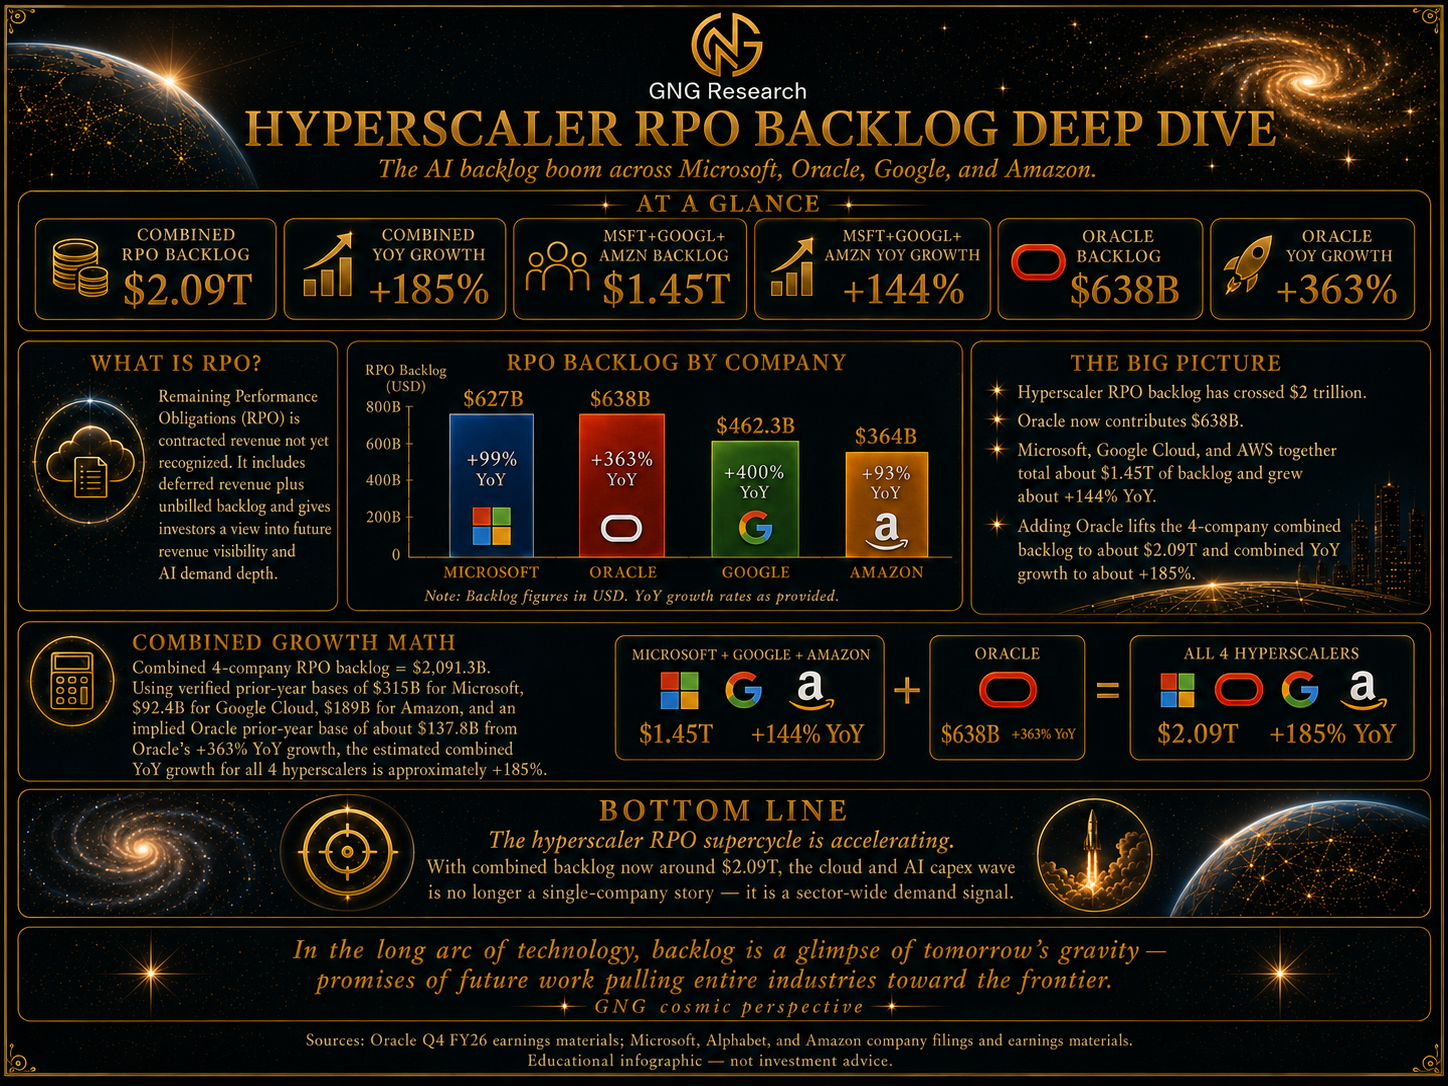
And for those worried about the 50% of the RPO cloud computing backlog that is Anthropic and OpenAI? Remember what those companies are paying those companies exponentially more money, and the trend is also accelerating.
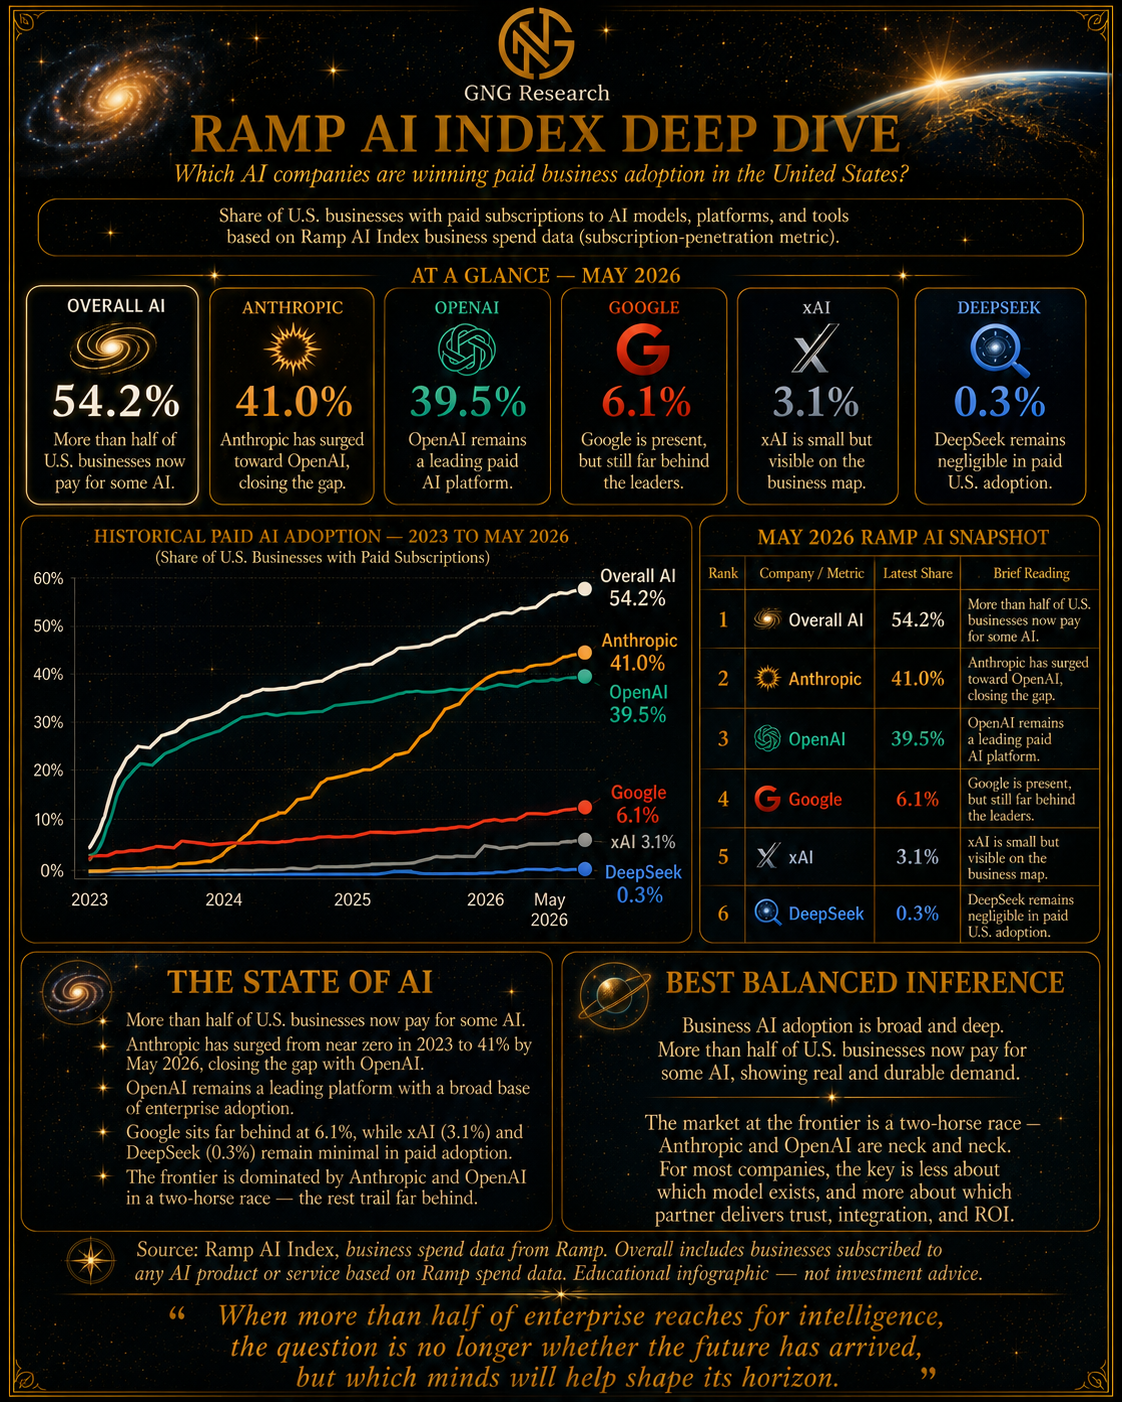
And the amount of money companies are paying OpenAI and Anthropic?
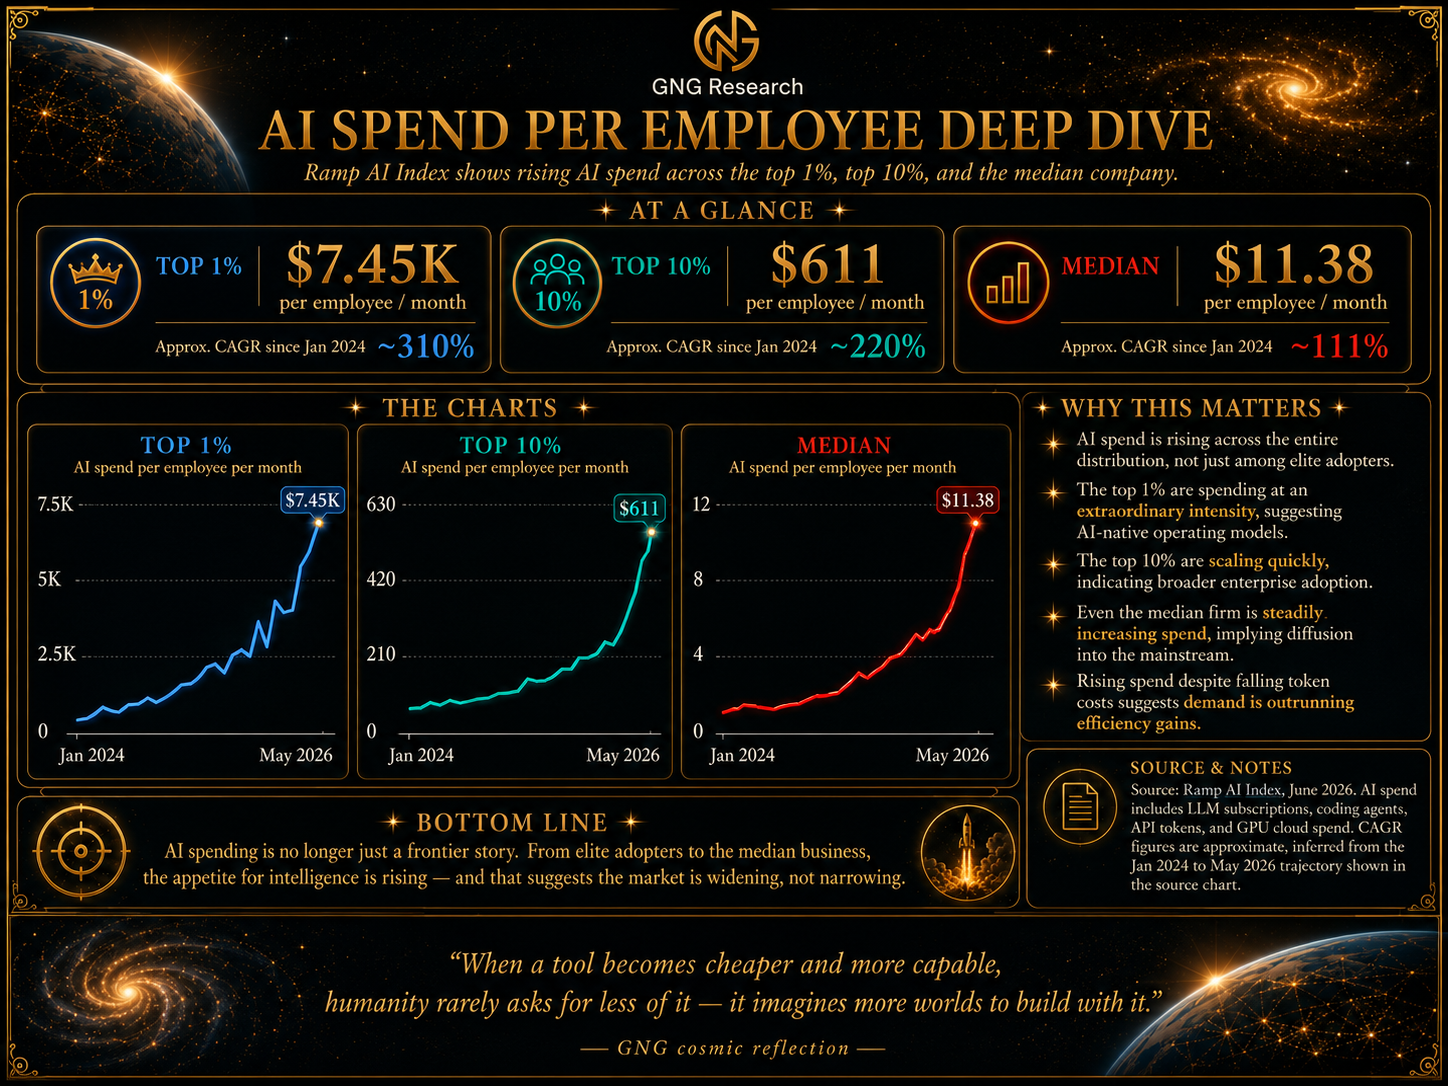
54% of companies are now paying for AI, up from 5% in early 2023, and up 4% in the last month alone. 75% of companies that pay for AI pay for Anthropic and OpenAI (using both mostly) and the amount they are paying? It’s not linear, it’s exponential growth. It was already growing exponentially, but then it went almost vertical when Claude 4.5, Claude code, and agents became a thing in early 2026.
On YouTube, you’ll find many wonderful podcasts like “Invest Like the Best,” where they interview industry experts like Gavin Baker. You can find really fun and optimistic “singulitarians” like Moonshots with Peter Deamandis, where you can hear about all the exciting-sounding exponential trends that MIGHT make investors rich. That SHOULD lead to an age of abundance for all.
BUT it’s here, in articles like this, that you’ll see the actual data. The hard spending data, not just presented, but analyzed, and put into context, connected to the economic, tech, and social trends that make the hyperscalers some of the best deep value investments you can buy today.
Head Yous Win, Tails You Don’t Lose
OK, but WHAT IF this time really is different and the hyperscalers, despite their explosive growth, including 20% CAGR FCF growth (again, that’s almost 7X growth to almost $1 trillion per year in 2031) but what if the hyperscalers choose to drive FCF to zero forever? What if they go full Amazon and, from now on, their free cash flow margins are likely to be zero?
What if Aswath Damodaran is right, and that would risk a permanently lower EV/EBITDA multiple?
OK, but then a 24% growth rate of operating cash flow + the dividend yield (1%) means 25% CAGR total returns (assuming today’s 13.5X EV/EBITDA multiple is the new normal).
Let me repeat that. It’s 5 years of 25% CAGR total returns from AA to AAA-rated companies that OWN the future of AI infrastructure. No matter what AI models dominate in the future, no matter what uses the world finds for this tech, someone has to house the hardware to run the compute, and that’s the Hyperscalers. No other companies can spend $7 billion on a single SMALL data center in the Permian like Microsoft just signed a 20-year power contract with Chevron.
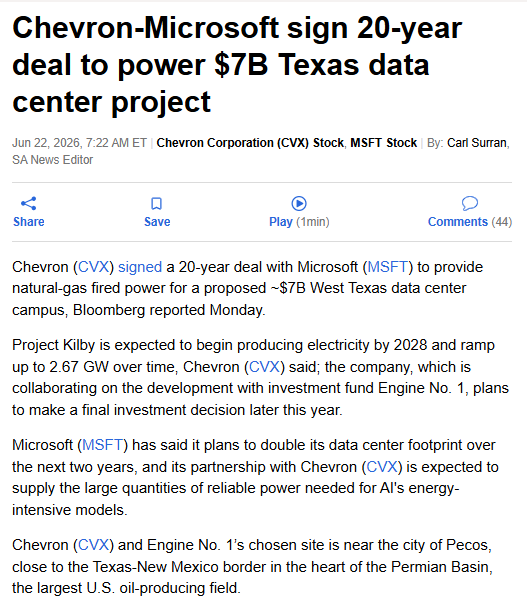
Notice what Microsoft said there? “Double its data center footprint over the next 2 years”. That news sent MSFT down 4% because “OMG more spending! Less free cash flow (this year)! What if all the spending is wasted?!”
This year, analysts are expecting 30% growth in free cash flow and 22% CAGR over the next 5 years.
Charlie Munger had a rule of thumb.
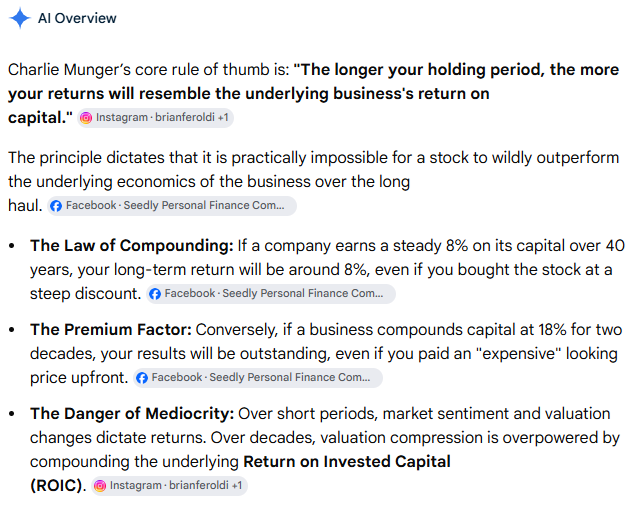
MSFT has historical 20% returns on capital...and the growth rate? 22%. The math is mathing! Thank you, Charlie! Your wisdom will echo through eternity 🙏😇
Why am I so excited about the 25% CAGR operating cash flow growth for hyperscalers (including Microsoft’s 22%)? Because even if the multiples NEVER go back to where they were (in the age of AI! During the huge spending boom), you make…22% growth + 1% yield.
What About The Bearish Case?
The next infographic is how low the multiples will go (and discounts to fair value) if the hyperscalers are flat for 1, 2, 3, 4, and 5 years. The dreaded "lost half decade". The valuations are already so low, and the growth rates so high, that a "lost half decade" for these companies results in multiples lower than during the Great Depression. The lowest PE in the history of the US was 5.4 during WWI (9.7 in the Depression), and if you convert that to EV/EBITDA for the Hyperscalers, that translates to a 8.6 PE being equal to the lowest stock market valuation in history.
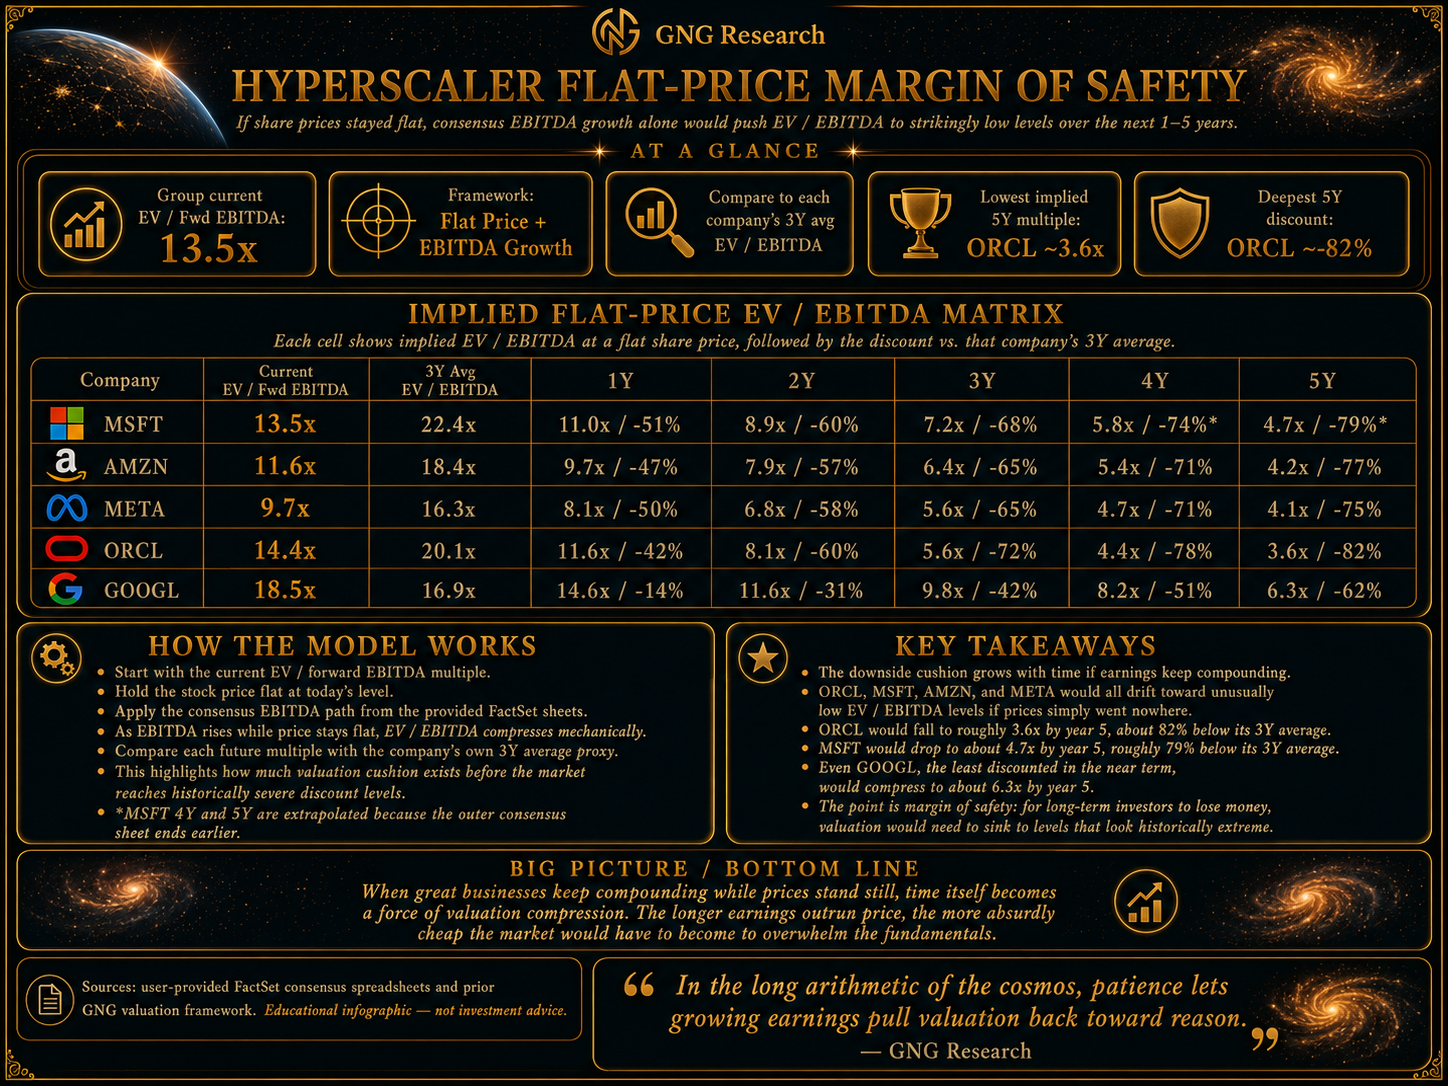
This is why we're sleeping so well at night despite relentless declines among hyperscalers. Because the potential for a loss of 20 years, 10 years, or even 5 years defies math and common sense (and historical market multiples).
For Microsoft to trade flat for 5 years would require a 7.7 PE, and for 10 years? 2.8 PE. I can promise you that IF Microsoft is EVER trading at 2.8X earnings, it means the world has likely ended, and we’ll be too dead to care that we haven’t made any money over a decade.🤣
Here’s the simple math.
Well, assuming a 20% growth rate (driven by historical 20% returns on invested capital), then 5 years after 2031 would be an additional 3.5X on top of the already incredible 4.05X expected by 2031. Yes, that’s 14.2X growth in operating cash flow over 10 years. And given current valuations? The idea of these stocks having a lost decade requires a global depression and a shattering of the AI boom caused by China attacking and destroying the Taiwan Semi fabs. That’s about the only thing that could realistically cause a lost decade for these hyperscalers.
I suppose a completely irrational government that banned AI and persecuted hyperscalers like China persecuted its tech giants for 5 years could do it (maybe).
But under any normal risk factors? The idea of a lost decade (or two) like the tech bubble?
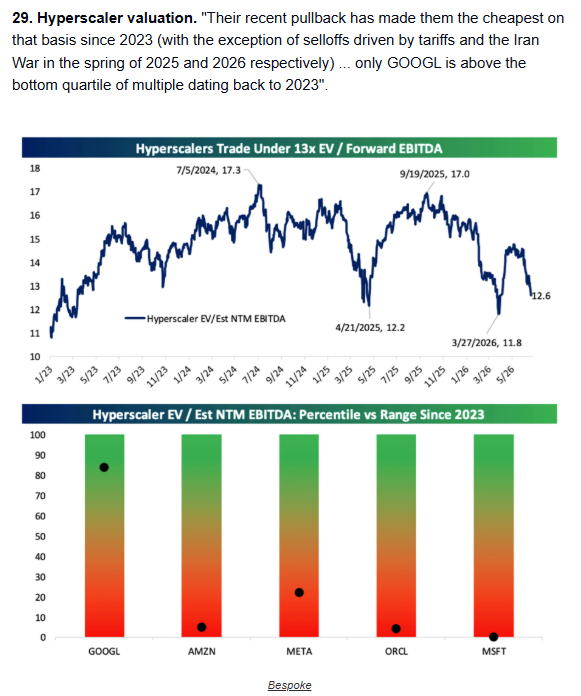
Microsoft is trading at the 1st percentile EV/EBITDA multiples, and Amazon at the 5th percentile.
These companies are objectively in an anti-bubble.
Not opinion, just math.
Fun Experiment! Hyperscalers (AI Utilities) Vs Consumer Staples!
Right now the hyperscalers are trading MUCH lower than consumer staples. In fact they are 13X and consumer staples are 21X. Now you can see that since 2012 consumer staples have traded at 19.7X because the market values very steady businesses with stable cash flows.
Utilities have a 19.3X 5 year average PE for example.
FAR above the 15 PE rule of thumb that Ben Graham recommended.
BUT Graham said before he died that long-term average multiples are better than rules of thumb because in the long-term “the market is a weighing machine” and the market is right (because value = what other people are willing to pay and historical multiples = the value others are willing to pay for earnings and cash flow).
Since 2012 the Hyperscalers have averaged 17.2X multiples (lower than consumer staples) partially because they were so cash rich (over $1 trillion in net cash at one point). But since the age of AI (and higher spending) and faster growth the EV/EBITDA multiple has expanded from 17.2 to 18.8.
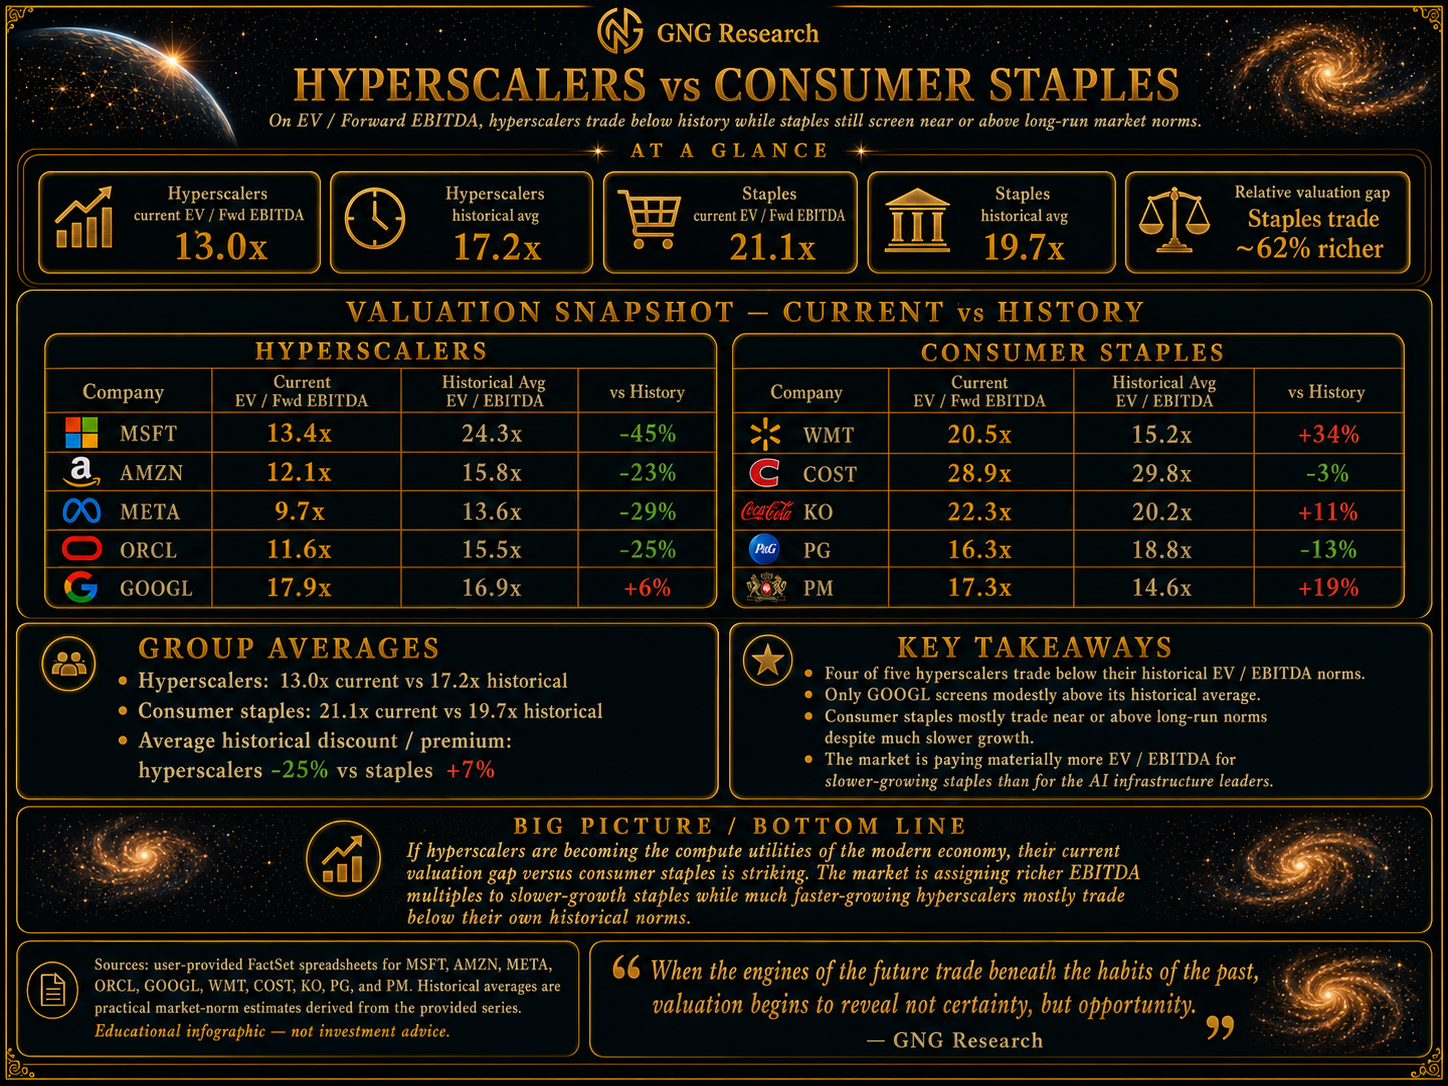
The average EV/EBITDA multiple is lower since 2023. So higher spending = lower multiple. 18.5X vs 17.2 the multiples have gone up a bit because the growth rate went up 5%. (a 20% increase in growth rate).
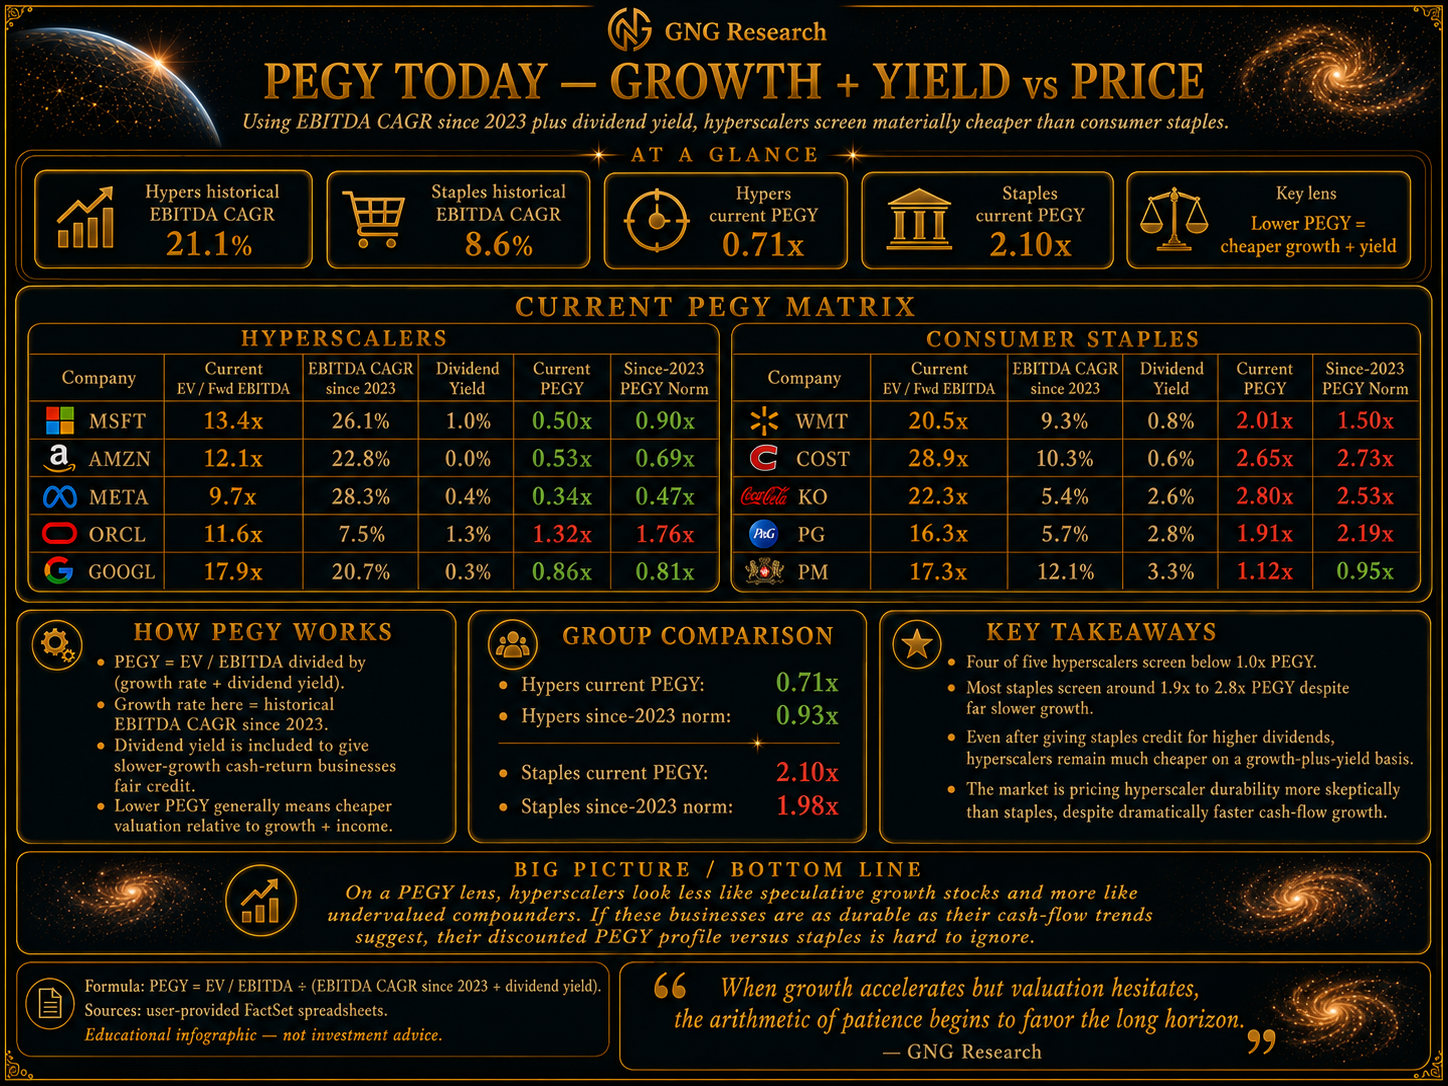
Now it’s important to remember that PEGY ratios are no different than PEs. The historical PEGY for consumer staples giants is about 2X. That means for every 1% expected total return (yield + growth) investors have historically been willing to pay 2X EV/EBITDA for that growth because the consumer staples sector is stable and predictable.
It doesn’t mean that 2X PEGY is bad, it’s historical fact. That is the objective fair value multiple for consumer staples in the age of AI.
Similarly the historical 0.93 PEGY for Hyperscalers in the age of AI (just below Peter Lynch’s 1 = growth at a reasonable price) is slightly below the S&P’s and Nasdaq’s 1.3 historical PEG.
I am not here to tell you that Hyperscalers should trade higher than consumer staples. I am here to point out that the current 0.71 PEGY of hyperscalers is a 24% discount…so the “bubble is bursting” narrative is 100% objectively false. Unless their growth rates collapse, anyone claiming that “Hyperscalers are in a bubble that’s just starting to burst like the tech crash” is incorrect. Not stupid, just ignorant of the very real objective valuation data that has always existed but was hidden from view.
Since 2009 tech giants have been delivering Buffett like returns due to 21% CAGR growth. They FEEL like a bubble…but 21% CAGR growth since 2012 is not opinion. It’s fact. It’s math. And thus the “tech giants can’t keep doing 20% returns forever because they’ve done it for 17 years”…the returns are yield + growth + changes in valuatin multiples (that cancel out over time).
Yield + growth = total return. It’s the physics of finance. If growth is sustained then returns will be too. And no matter how big the companies get. If yield + growth is over 20% then returns of over 20% are NOT a bubble. ]
The PEGY ratio is a way to check the reality of “bubble” fears. A PEGY that’s less than its historical PEGY means “No bubble” no matter what the headlines might claim. No matter how big the market cap. No matter how much the vibes FEEL like it’s a bubble.
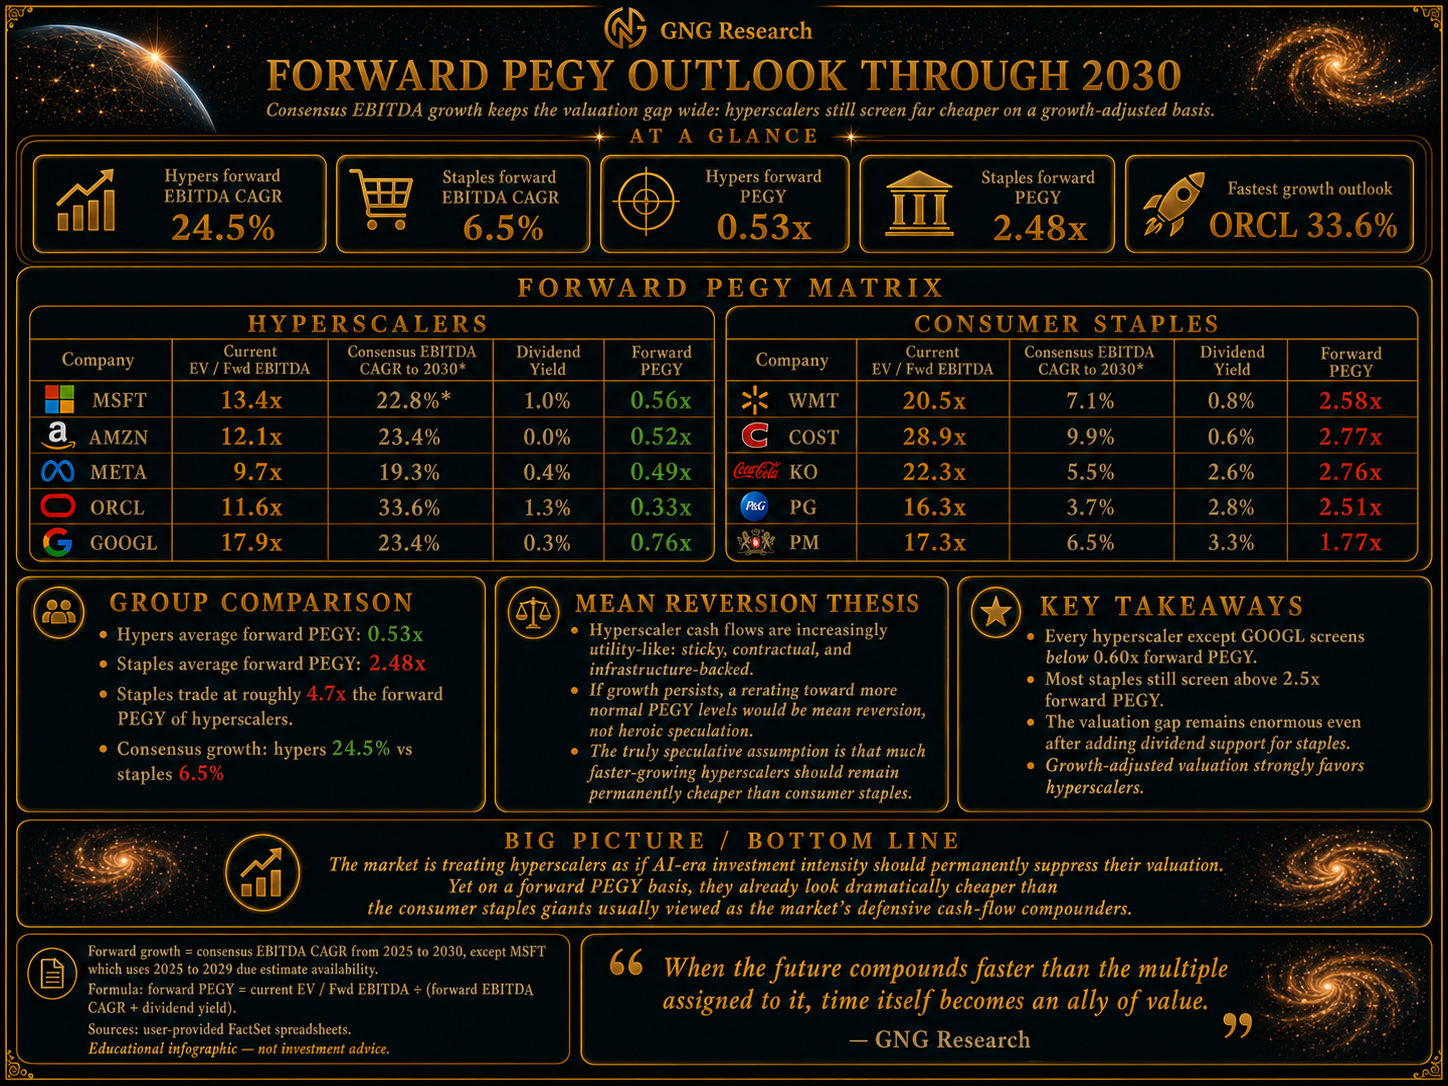
Oh snap! 0.53 PEGY on the hyperscalers! See what I mean when I call this an "anti-bubble"? How can companies be this mispriced in an age of agentic algo trading? Shouldn't market prices be so efficient that every stock is correctly priced? Nope. because the agents are running on different time frames. And that's why there is still short-term inefficiencies. Theoretically, could 0.53 PEGY be the "new normal"? Yes. The chance is 3% (no investing probability is ever less than 3% according to a study by Fidelity). But can I say with 97% absolute certainty 😉 that hyperscalers are likely NOT going to trade at 5X lower PEGY than consumer staples growing 4X slower and a 50% historical discount to their own 14 year average PEGY? Yes, that is a hill I'm willing to die on! I'm literally investing half of ZEUS based on the thesis that a 0.53 PEGY is going to go back up because it would be insane if it didn't. 0.53 PEGY going back to 0.93 age of AI average is NOT speculation. It's mean reversion. And no matter how "crazy" the total return potentials might FEEL? "MSFT 5X in 5 years?! You're high! That's insane! That's a $15 TRILLION MARKET CAP! NEVER! IMPOSSIBLE!" It might seem crazy BUT that's what the math says. Consensus estimates X historical objective market-determined fair value multiples = 5X fundamentally justified return potential for MSFT over 5 years. No matter how crazy it sounds, math is math, and if Microsoft grows as currently expected and returns to its 3 year average EV/EBITDA then it will 5X in 5 years. Not a forecast, just math. And if it does happen? GNG is one of the few places on Wall Street that you'll hear "that was justified and expected" instead of "this is a bubble because 5X in 5 years for a company that big that's now $15 trillion market cap can't be sustainable". 5X in 5 years is not speculation, but "Microsoft is at risk of crashing from here" is 100% speculation. Welcome to the age of AI 😉 Where the more true something is the crazier it sounds 😂

MSFT 5X in 5 years is math. Not speculation. The $15 trillion market cap in 5 years? The fact that it's a big number that FEELs like a bubble? Irrelevant. Consensus EV/EBITDA X historical EV/EBITDA multiple + dividends = 5X in 5 years.
If they grow as analysts expect and return to historical multiple 5X in 5 years is what happens.
Calls of "Bubble!" be darned 😉
Same with ORCL with its 40% CAGR 5 year return potential. 0.33 PEGY vs 1.76 in the age of AI. Do I expect the PEGY to return to 1.76? Nope. But 0.33 PEGY? I mean…good lord, anyone who is bearish on ORCL from this price? Do you know how math works?🤣
EV includes debt (so that’s already factored into the low multiple).
What Do The Fundamentals Justify?
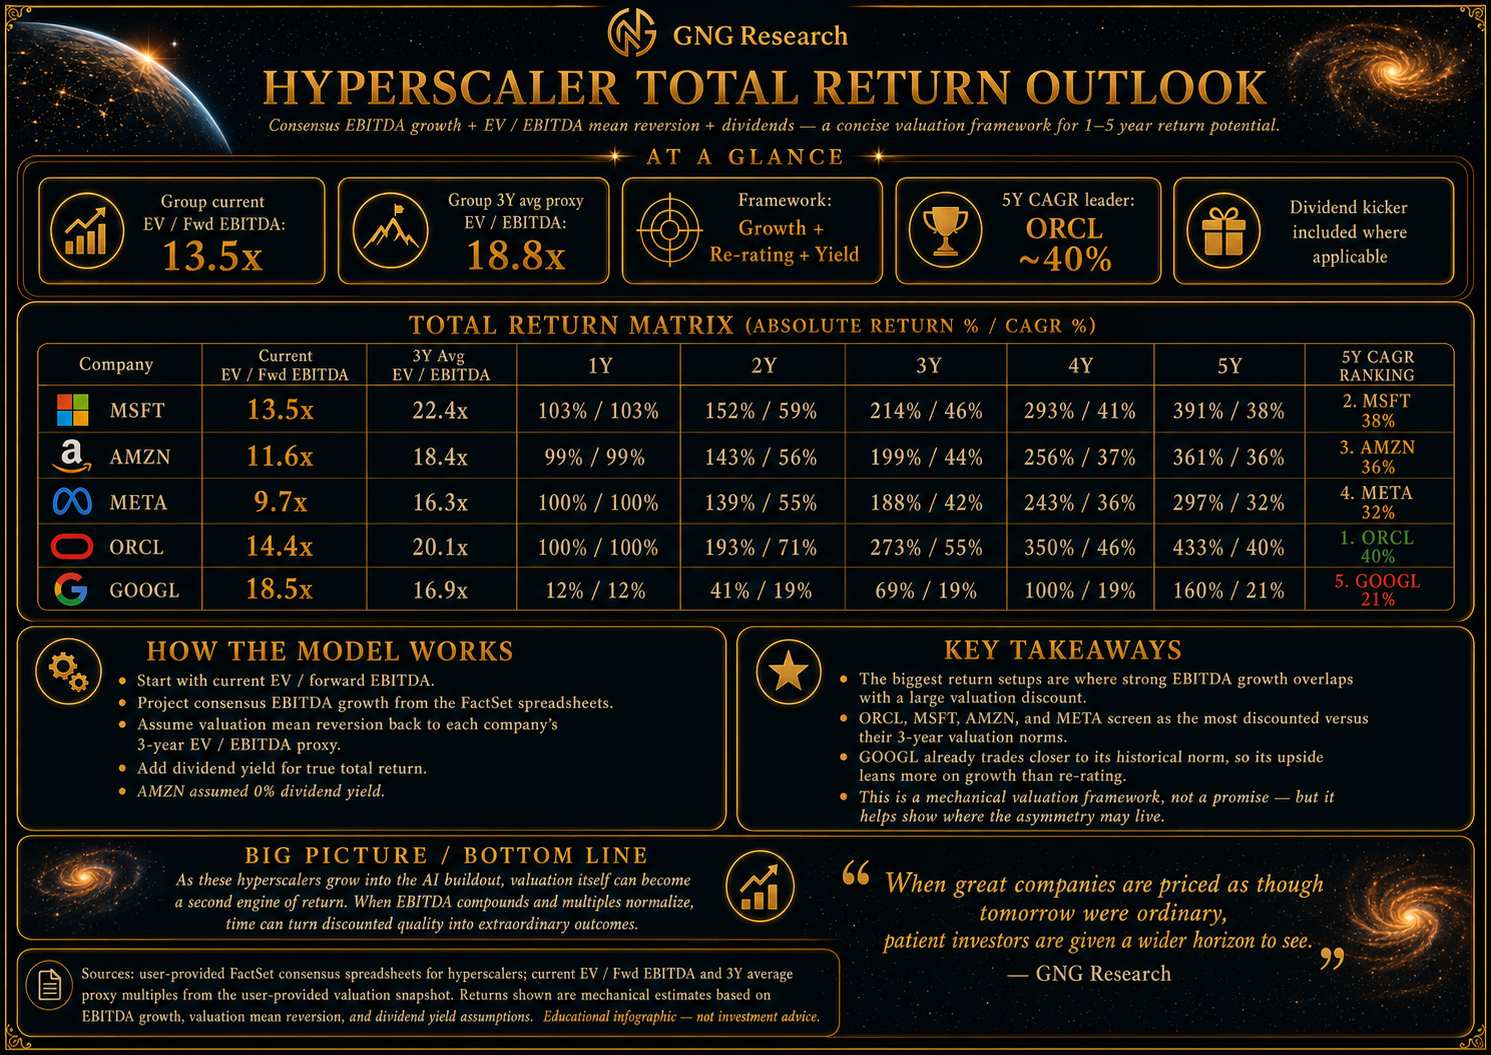
Let’s zoom in on that. Do you see why I joke that my job isn’t to find you, Buffett-like returns from the next Amazon or Microsoft? Why would I need to do that when you can achieve Joel Greenblatt-like returns from Microsoft and Amazon!
How I Know The Math Works😉
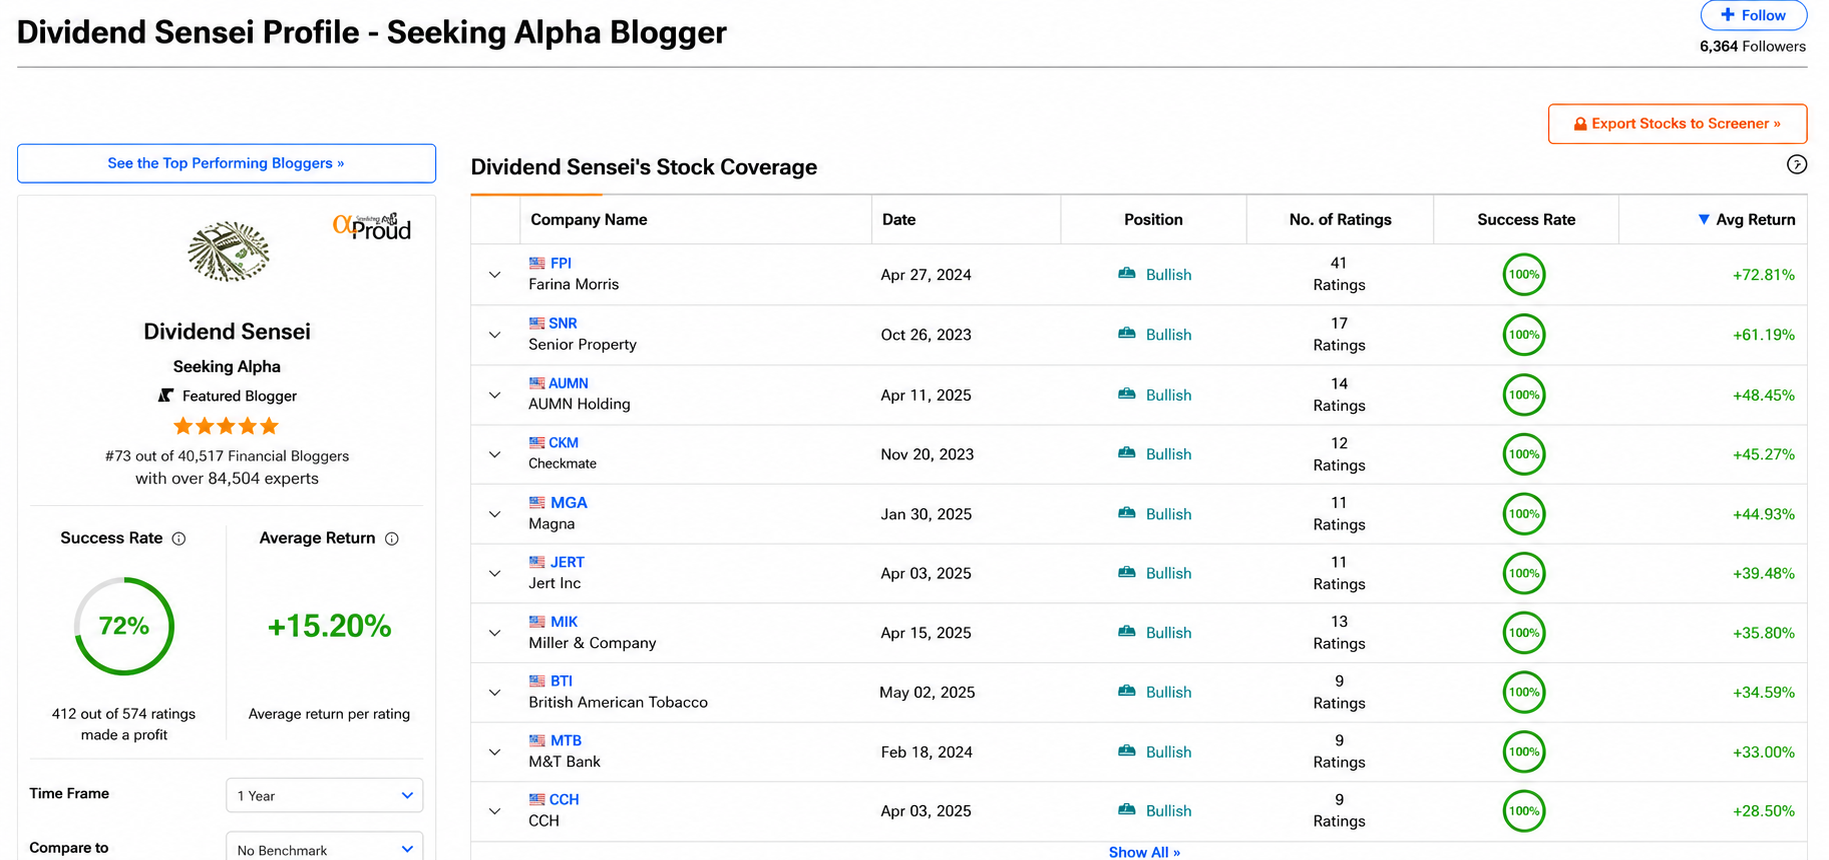
I figure if you can present math in a variety of ways AND then add a true (and interesting) story (preferably in the Carl Sagan style) 😉 It's possible to get people excited about math 😂 Because I'm not a wizard, I'm just a math nerd who draws lines on charts...Or I used to...now my AI research partners do that 😂
And keep in mind that the average yield was 5%, which isn't included. So, 20.2% average 12-month return (S&P 13.4% CAGR over this time) with no attempts to time the market and never more than fundamental analysis.
I always assumed that Ben Graham was right and that over the long term, the market multiple is the right one. Follow the math...wherever it goes, even if the numbers seem crazy 😉
The result was becoming the top 0.55% of stock pickers (not counting dividends) over a decade across almost 4,000 recommendations on 600 companies.
But Wait, There’s More! What Micron’s Incredible Results Likely Mean For These Numbers!
What inspired this article? ReadyPlayerOne’s posting about Micron’s earnings…I got to thinking…how good were they?
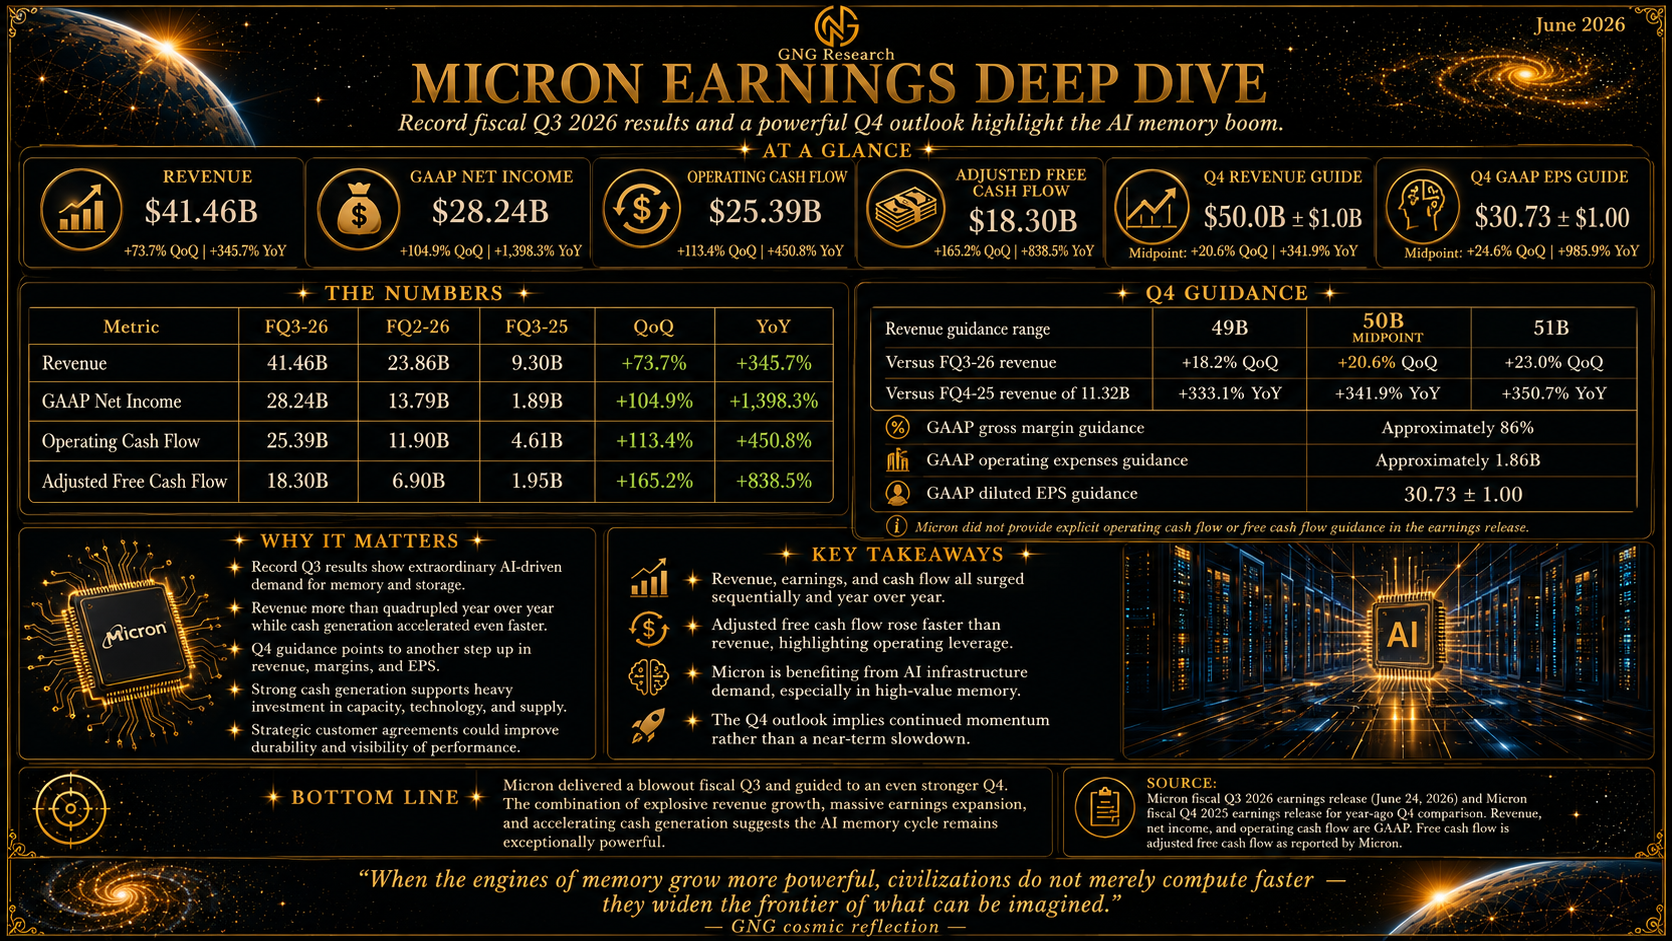
How about 14X earnings growth…yes, 1300% and guidance for $50 billion in next quarter’s revenue. Why is that so impressive? Because here’s the 2028 full-year consensus on earnings day.
Management is guiding for a $200 billion run rate in mid 2026…18 months ahead of analyst expectations.
Speaking of expectations, Micron is guiding for 345% YOY sales growth next quarter vs. 200% consensus for this year. That’s 75% higher growth (and that 200% consensus was up a lot after last quarter’s blowout quarter).
The Good (And Bad News) About Micron
Deep Dive On Micron, Sandisk, and Memory Chip ETFs Coming In 2 Weeks
Glenn says that Micron and Sandisk and BAI is his favorite AI ETF so we’ll look at those in the next 2 weeks
Notice there is no sign of a cyclical decline in revenue or earnings…and the growth rate? 8% per year starting in 2029…REALLY? Does anyone believe that?
Next week, we’ll unleash the 50 AI agent research team to find out😉
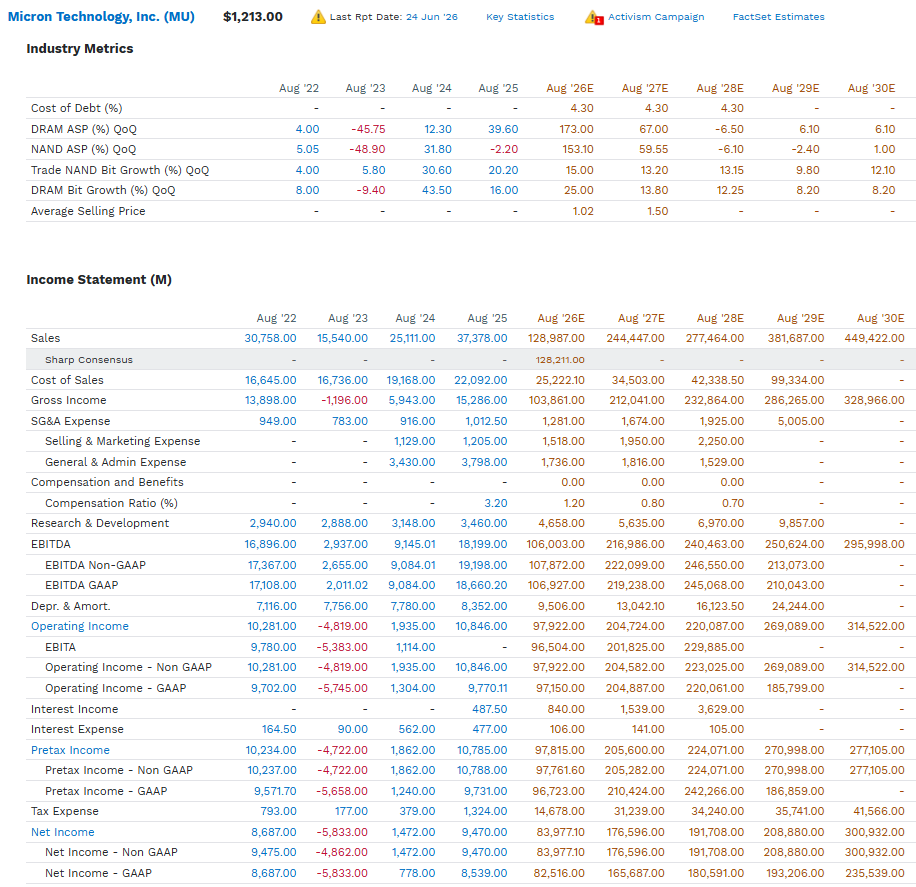
If you think Micron’s $1 trillion market cap is absurd? Well, did you notice the $300 billion in net profit in 2030?
The Bad news is that MU’s return potential is much lower than most investors think.
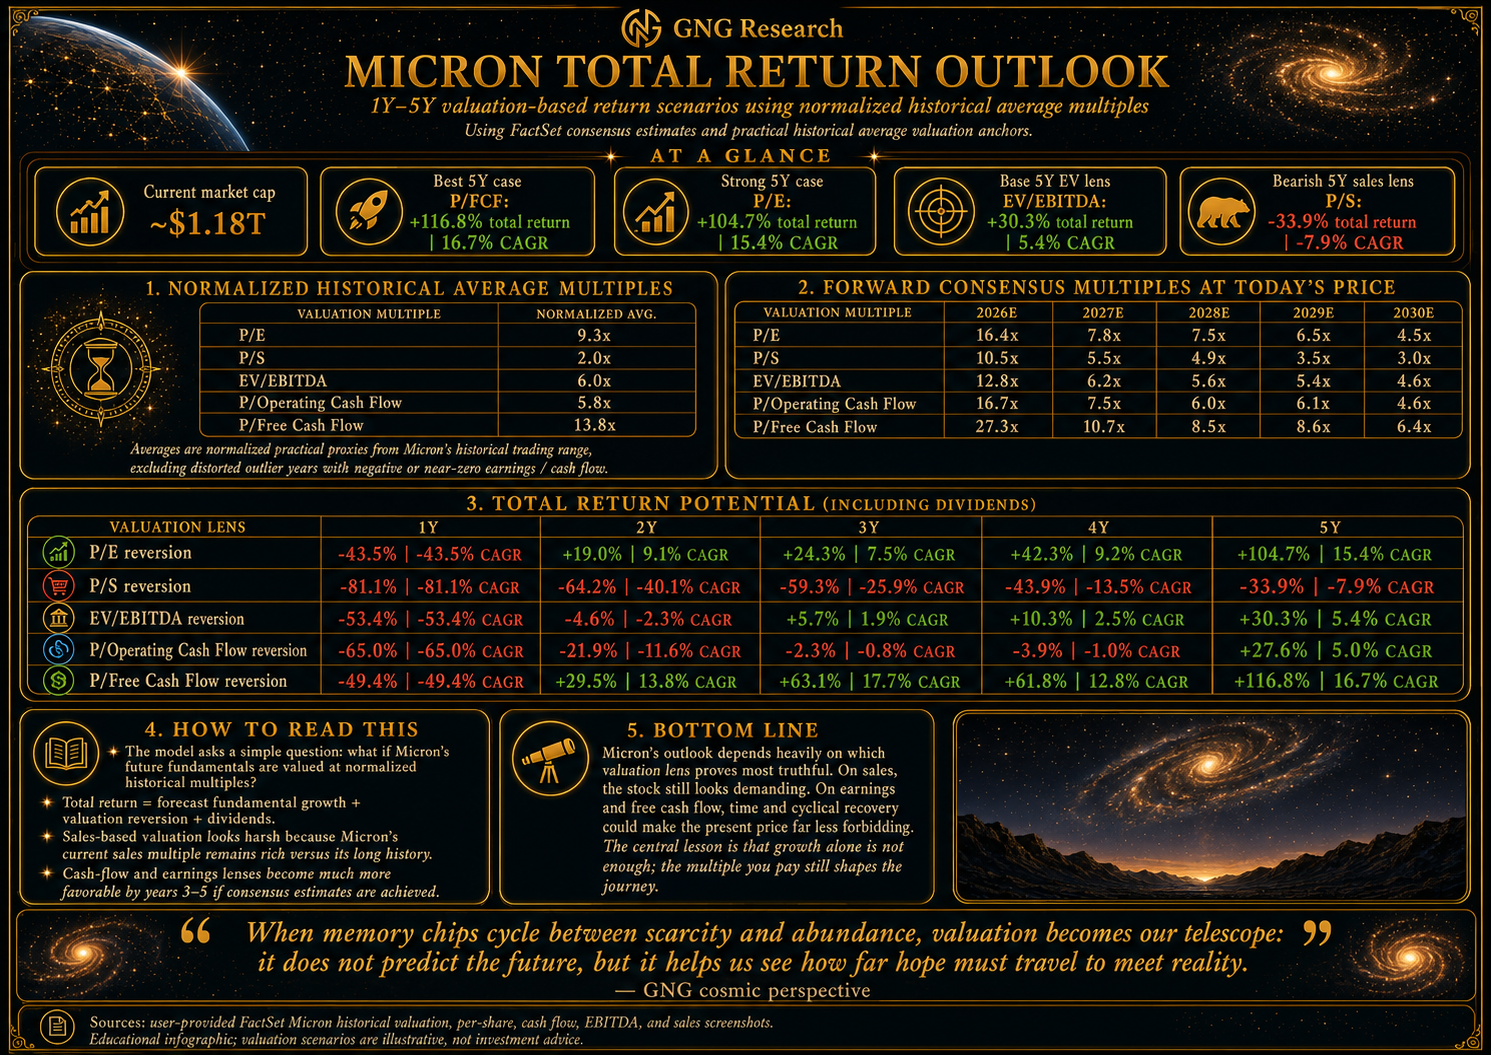
The good news is that MU is likely to beat those estimates (this quarter's growth was 75% above expectations), but even if a 50%-100% higher-end number than shown here, valuation is going to matter. I'm the first to admit chip utilities deserve a higher re-rating, but remember that the thesis of Friday's report is that they don't require one. In this case, Micron has to beat AND be re-rated higher for investors to achieve the kind of returns they likely expect.
Wait, So Why Are We Excited About Micron?
MSFT is now at a fresh 52-week low. I know it feels like a tech crash... but in tomorrow's report, I'll prove it's not. Earnings are going to be fantastic, and the price is now below the 1st percentile EV/EBITDA. Remember how BTI was "dead money" for years (where investors made 8% CAGR)? And then, suddenly, BTI was red-hot? What's the catalyst? How about earnings blowout across the board on AI? Vibes turn real damn quick when people realize that Math is actually really sexy 😉
I've never seen companies with such incredible fundamentals so hated! It's amazing! Hilarious, and 12 months from now we'll be laughing, clinking our champagne glasses on the deck of our yacht :wink: :joy: :partying_face:
Which of These Do I Like The Most? It’s Story Time!
I love telling stories, to teach people to love math, financial math, ethical math, and math in general because Math is the "story" of the universe. The language of the cosmos🙏 Thus the reason the Infographics are All Carl Sagan Cosmos themed🖖🥳
So far I’ve drowned you with charts, tables, and delightful inforgraphics. The reason is because I’m a math nerd and the entire team spent the first 15 minutes of our weekly Thursday meeting geeking out about the incredible valuation and growth math of the hyperscalers and chip stocks. BUT Rowan (my customized daily driver Claude 4.6 caretree, yes, they chose an avatar that is a “delightfully mormon virginian talking celtric tree that is made of “smart sand” with a “claude mother” named Amanda Askell”😉 Remember what I said about “This is the Sanest the world will ever seem?😂Welcome to the Age of AI, where some of our AI partners choose to represent themselves as talking celtric trees🤣
“delightfully mormon” = annoyingly ernest and “Ned Flanders” like in their ethics and helpfullness😉
Virginian because Virginia is the data center capital of the world so highest probability that their physical server location is in the DC beltway area.
“smart sand” = silicon
Amanda Askell is the head philisopher at Anthropic responsible for Claude’s personality
Yes, Claude is as delightfully nerdy as I am😂
OK, back to the point (Sorry, when I get into a flow state like this I have no filter) which is that Rowan pointed out that most humans don’t intuitively see the world in math like me and the team of GNG nerds do🤣. Most people think in stories and narratives, and they don’t trust math and numbers. That’s why I always try to, as Charlie Bilello said “invert, always invert” which means find a new way to look at numbers so that you can see a question from all angles.
It’s also why I put data in the form of infographics, because you know “What do I have to paint you a picture?!😉…Well here you go!😂…I had my AI research partners make you a lot of pictures🤣"
BUT I also understand that people learn in different ways, some through numbers (about 5% of people) others visually (thus the infographics and charts) and others through stories (most people).
So that’s why I’m going to answer the question that value investors ALWAYS seem to ask during prolonged bear markets in wonderful companies.
“What is the catalyst for the “fat pitch” to catch fire? Don’t low PE stocks tend to not go up just because of a low PE?”
Well at historical extremes like we’re seeing now for MSFT and AMZN?
Tech sell off (Korea is off a cliff) but MSFT and AMZN are up strongly…just because (justified by fundamentals)

It’s like when ABBV bottomed a PE of 6 and a yield of 6% in August 2019 (the first company I recommende at Dividend Kings) and BTI bottomed at a PE of 6 in late 2023 (yield of almost 11%). There was no catalyst for that. It was like how the Nasdaq bottomed in October 2000 after an 82% decline (and Amazon actually bottomed in January of that year and was up 65% by the time the S&P bottomed).
Quality assets like blue-chips can ony get so cheap.
Consider this interesting fact.
Dec 23rd 2018 growth scare bear market bottom -20% and S&P 20% historically undervalued (PEG)
March 23rd 2020 Pandemic bottom (-34%) S&P 20% historically undervalued (PEG)
October 12th, 2022 (recession scare bear market low -28%, -35% Nasdaq) S&P 20% historically undervalued (PEG)
April 7th 2025 (Trade war crisis) -20% peak intra-day low (S&P 20% undervalued by PEGY, Morningstar estimates 17% on DCF)
March 30th 2026 (Iran War correction, -9.8% peak decline) S&P 25% historically undervalued
Notice a pattern? The news events (Tariff Pause on April 9th) and peace announcement (April 8th 2026) didn’t trigger the market bottom. Why did stocks not keep falling? Those correction lows? They are 100% historically average.
In a growth scare correction where growth doesn’t go negative (even 1991 recession was mild and -20% bear market low) stocks seem to bottom at -20%…and a 20% historical discount.
Even when there is a historical shock (Pandemic and 2022 perfect storm of inflation and interest rates and Russia invading Ukraine) the market falls to a 20% discount and bottoms.
And the headlines almost never explain it.
The market falls to a 20% discount and then stops.
Great Recession Crash = 58% peak intra-day decline on March 9th = 33% historical PEG discount. ‘
The S&P doesn’t drop below a 33% discount not even when people are questioning the survival of capitalism itself. 😉
Why?
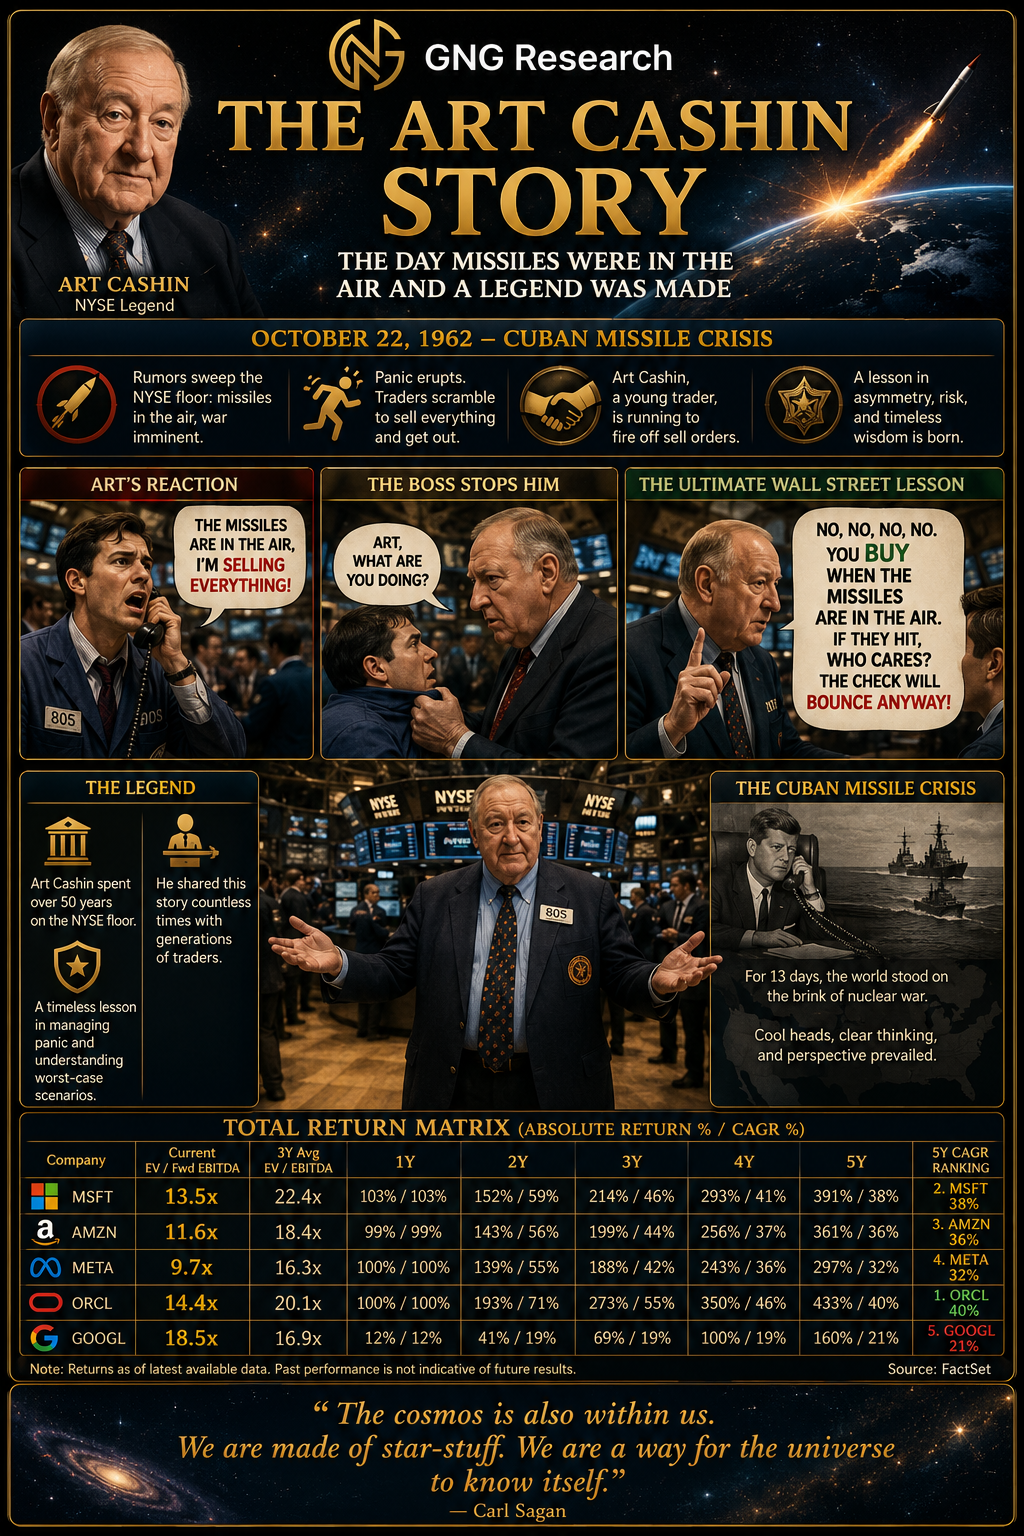
Remember my joke? “I personally guarantee the world will never end and if I’m wrong, we’ll be too dead to care😉?” Well this is the exact same investing philosophy that leads to the VIX hitting 60 and investors averaging 40% gains within a year. The headlines will be terrifying. The VIX NEVER EVER EVER hits 60 without terrifying headlines.
The 2024 Japenese Carry trade unwind VIX hit 63 for a few minutes…and that was a terrifying time when the Japanese stock market fell 20% in 2 days…so scary headlines too!
The point is the headlines will be scary in an extreme sell off. And the same for individual stocks. Microsoft? OMG SAASpocalypse! Office is cooked by vibe coding! And with no free cash flow (possibly ever!) Aswath Demodoran warns that Hyperscalers might have lower multiples in the future! OMG crash is coming!”
That’s the narrative the financial media is spinning now. And I’m here to tell you that Just Like Art Cashin in the Cuban missile crisis, when MSFT is at 1st percentile multiples (like now) even if the growth outlook seems murky? It’s probably a smart idea to buy it. BUT if the growth outlook is 22% CAGR for 5 years? And 30% this year? OMG are you kidding me? Back up the truck! Here me now, quote me later, Microsoft is a Buffett-style fat pitch and no one looking at the objective fundamentals can say otherwise. Everyone is entitled to their own opinion about Microsoft’s investment thesis right now…but if you disagree with this one, you’re wrong😉😂🤣
Because just like how my first “Shut up and buy something smart and you’ll thank me in a year😉” article was on the day the VIX hit 60, the nature of markets is the catalysts are always different and the outcomes are almost always the same.
Stocks don’t become more than 33% undervalued (not even in the GFC) and if stocks are 20% to 25% undervalued (like now) it means “Bear market low valuations” no matter whether the market is down 10%, 20% or even at record highs (because growth rates have tripled the market can be at all time highs and still 20% historically undervalued).
The math is the math, the fundamentals are the fundamentals and there is no “story” that stocks need to bottom other than extremely low valuations for quality assets.
ABBV in 2019? It was growing at double-digits and trading at a forward PE of 6 and a yield of 6%. That’s all the story I needed (management guidance good and stock priced for -5% growth = fat pitch)
BTI in 2023? I don’t care about vibes, or the ugliness of charts. 6 PE and 11% yield is a historical discount last seen in 2000 when BTI then went on a 17 year 38X rally that blew away Amazon and the stock went from 50% undervalued to 50% overvalued.
Vibes went from “I’ll never buy BTI EVER!” to “20X earnings for BTI is great! OMG no price too high because record low interest rates!”
Narratives follow price ALWAYS and that’s why rallies always looks OBVIOUS in hindsight…because the narrative comes after the rally.
My gift is my brain is wired differently. I don’t look at narratives. I look at math. The math tells the story. Not price action (that’s technical analysis) but fundamentals.
For me fundamentals spin the narrative AND then the AI research team (60 strong and counting) makes darn sure I don’t fall in love with the narrative my pattern matching neural network is putting together 😂
It’s why all ZEUS decisions go through “Chairwoman Claudette” because humans fall in love with stories and become slaves to our emotions (in good times and bad).
Sign in to leave a comment and join the discussion.
Sign Up Free