How GNG researches stocks
Our dividend safety score and stock rating system
Our dividend safety score runs from 0 to 100. The GNG stock rating system also includes the Quality Score from 0 to 100, the GNG Rating and the quant rating.
GNG ratings and scores are part of our paid plans. The Research Terminal and Advanced Charting are free with a free GNG account.
How the dividend safety score works
Our dividend safety score answers one question. Can this company keep paying its dividend through a rough patch? We rate the answer from 0 to 100, and a higher score means a sturdier dividend, not a promise.
The Dividend Forecaster shows a safety score for holdings with enough data, on Pro Lite and up.
Stock ratings explained: how our rating system works
Our stock rating system has four parts, and each card below says what one of them means. All of them are part of our paid plans. Compare GNG plans.
GNG Rating
The GNG Rating summarizes our valuation assessment.
Quality Score
The Quality Score rates overall business quality from 0 to 100.
Safety Score
The Safety Score rates dividend safety from 0 to 100.
Quant rating
The quant rating provides a data-based assessment of a stock.
Company fundamentals and fair value
Company fundamentals
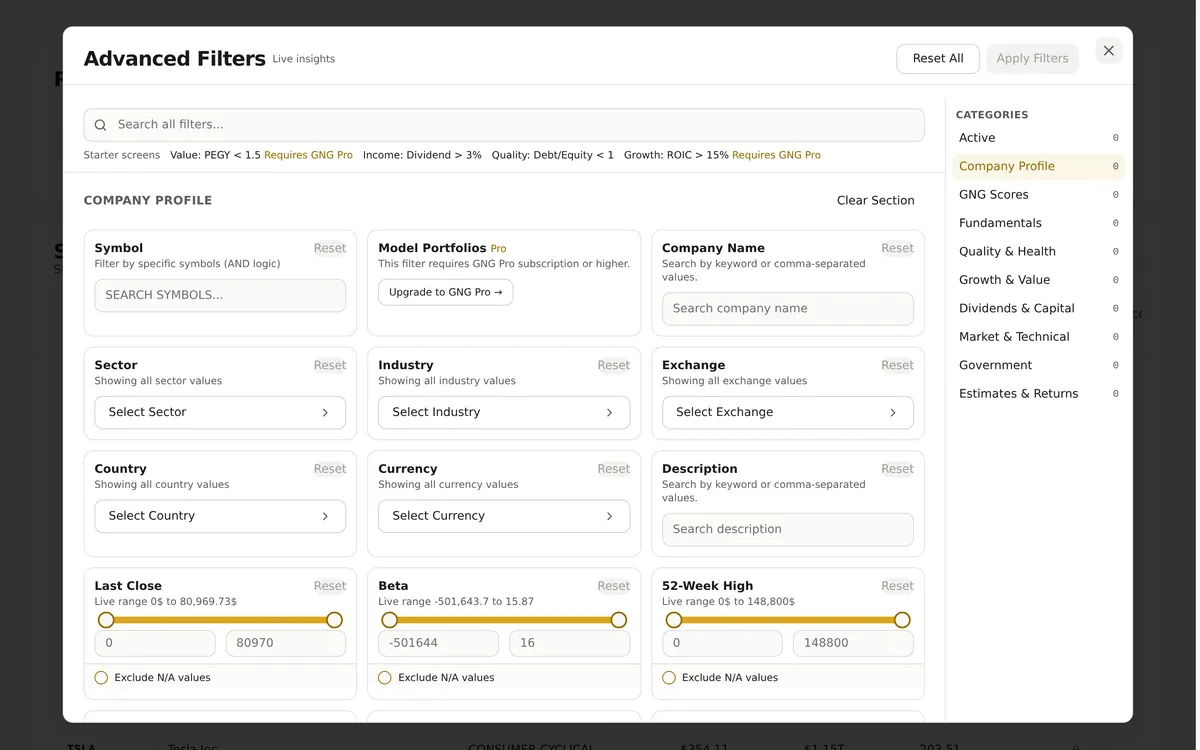
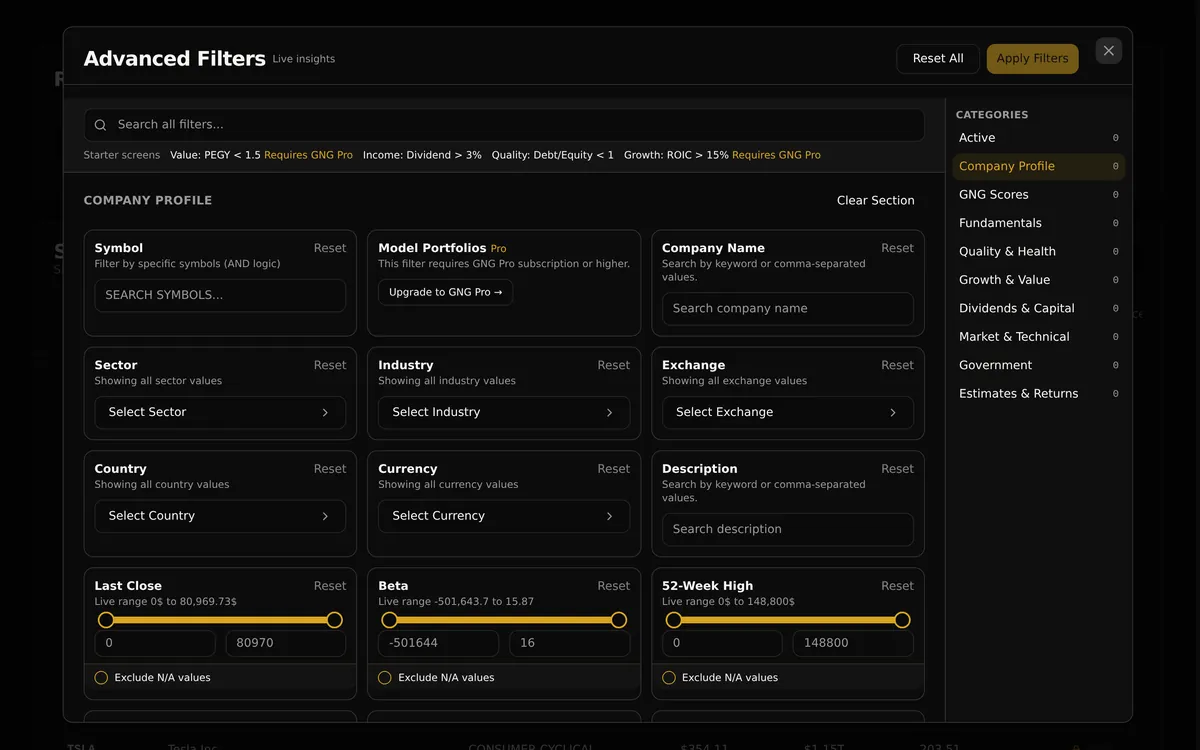
The Research Terminal lets you screen on the same fundamentals we study, from growth and margins to debt and dividends.
Fundamental analysis judges a stock by the business behind it. For every company we rate, we look at how revenue, earnings and cash flow have grown, how much profit the business keeps, and how much debt it carries against the cash it makes.
- Revenue, earnings and free cash flow growth over several years
- Margins and returns on capital, measured the way that fits the industry
- Debt, interest coverage and liquidity
- Accounting red flags and signs of financial stress
Fair value estimates
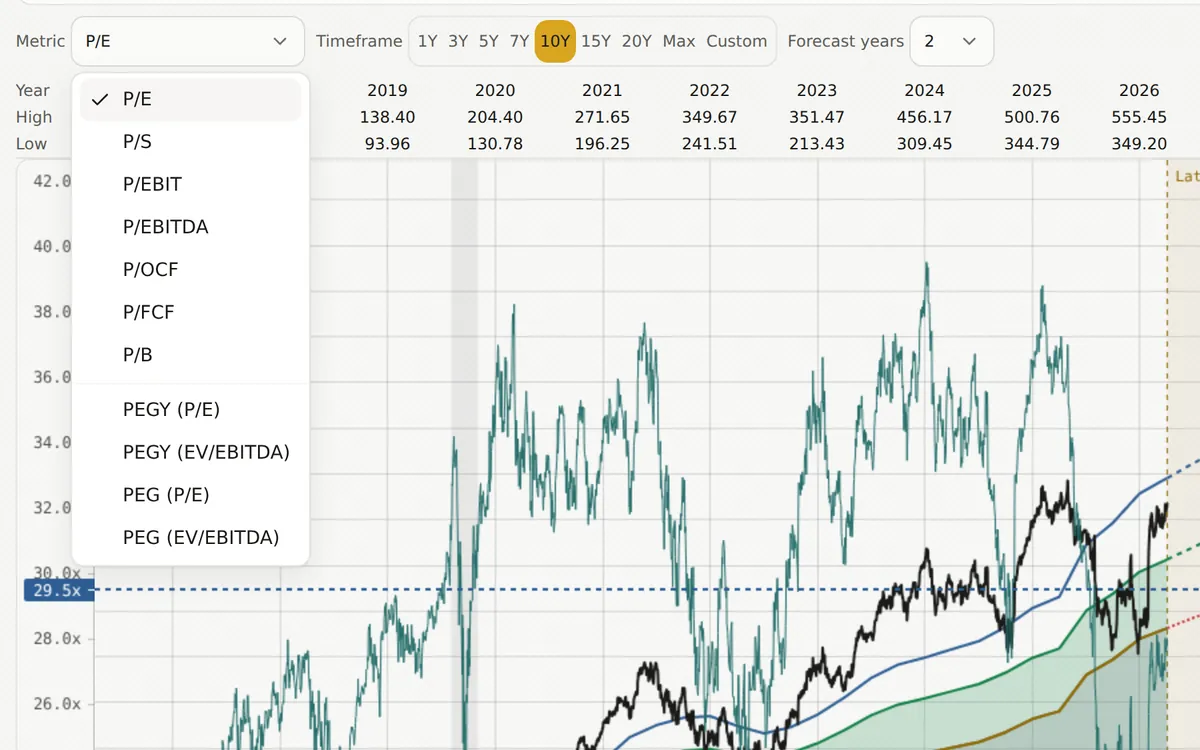
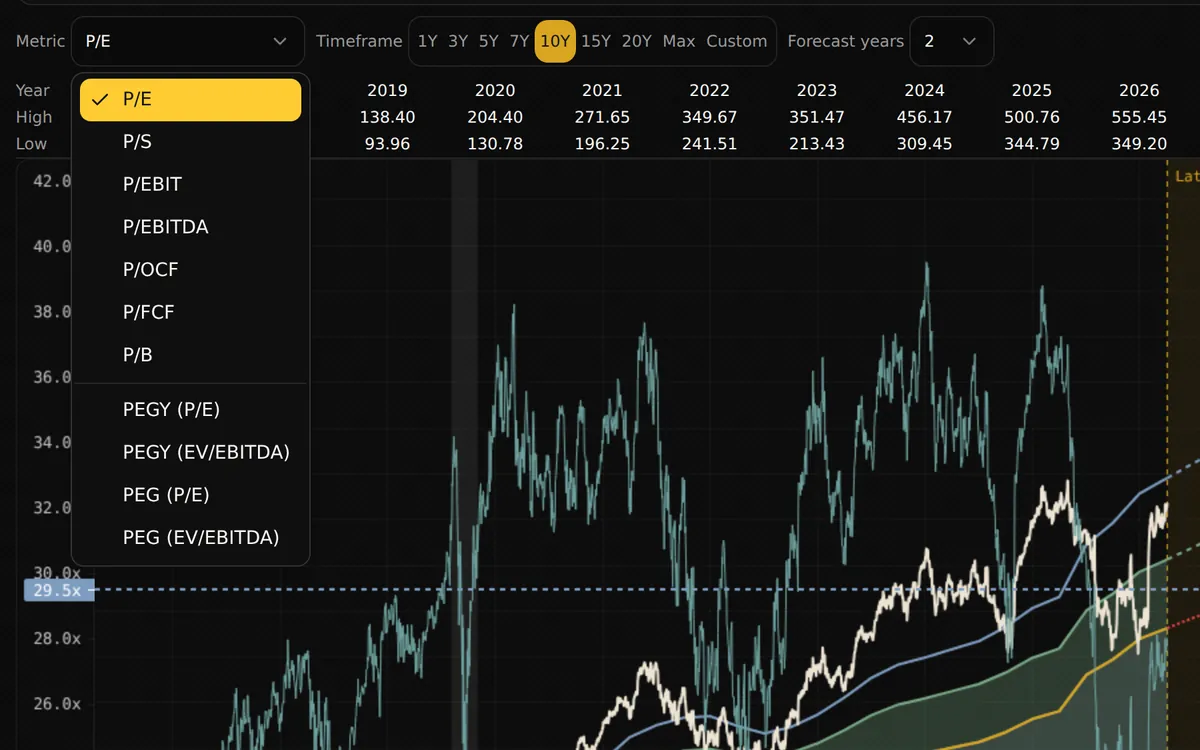
Advanced Charting lets you value a company on earnings, sales, cash flow or book value and compare each multiple with its history.
Fair value is an estimate used in stock research. It can change as company circumstances change and does not guarantee a future market price.
Our investment research process
Our stock research process runs the same way for every company we rate, so one rating can be compared with another. You can run the same checks yourself with our free dividend stock screener and our P/E ratio charts, both free with a GNG account.
Start with the numbers
We read each company's income statement, balance sheet and cash flow statement, several years deep, along with its daily prices and its dividend record.
Compare with sector peers
Each company is judged against others in its sector or industry, because good numbers for a bank look nothing like good numbers for a software company.
Add analyst research
Models score every company we rate. Our analysts then dig into the companies worth a closer look and publish their research under their own names.
How to use GNG scores in your research
Scores point you to companies worth a closer look. They do not replace reading the business, so treat them as the start of your research, not the end.
Narrow the list
Use the scores to cut a long list of ideas down to a few companies, then read the financials, the dividend record and the analyst research behind each one.
Check income before you count on it
A lower dividend safety score is a cue to study the company's dividend history and how well earnings and cash flow cover the payout before you rely on that income.
Pair scores with valuation
Read a score next to the price you would pay. A strong business can still be expensive, so check its valuation on Advanced Charting too.
Revisit when scores change
Scores update as new results and prices arrive, so a falling score is a prompt to recheck why you own the stock.
Who does the research
GNG Research was founded by Adam Galas, Co-Founder & CEO, and Connor Graham, Co-Founder, CTO & COO. Our analysts publish their research under their own names, and each author has a profile page with their background and articles.
Meet every GNG author or read about GNG Research.
Dividend safety and stock rating FAQ
- What is a dividend safety score?
- A dividend safety score rates how likely a company is to keep paying its dividend. The Safety Score rates dividend safety from 0 to 100.
- How can you tell if a dividend is safe?
- Check whether earnings and cash flow cover the payout with room to spare, whether debt and interest costs are under control and whether the company kept paying through hard years. Then compare it with peers in its sector, because payouts differ widely by industry.
- How does the GNG stock rating system work?
- The Safety Score rates dividend safety from 0 to 100. The Quality Score rates overall business quality from 0 to 100. The GNG Rating summarizes our valuation assessment. The quant rating provides a data-based assessment of a stock.
- How do you determine the fair value of a stock?
- Fair value is an estimate used in stock research. It can change as company circumstances change and does not guarantee a future market price.
- What is a quant rating?
- A quant rating ranks stocks on data alone, without an analyst's opinion. The quant rating provides a data-based assessment of a stock.
- Can I see GNG ratings and scores for free?
- They are part of our paid plans. Pro Lite shows the GNG Rating on Advanced Charting and a safety score in the Dividend Forecaster, and GNG Pro adds every GNG score to the Research Terminal. Advanced Charting and the screener are free with a free GNG account.
Create a free GNG account to use the Research Terminal and Advanced Charting. Upgrade when you want the scores.
Sign Up FreeGNG ratings, scores and fair value estimates are for research and education and are not investment advice. Past performance and current scores do not guarantee future results. Read our disclosures.