In recent weeks, I have put much more emphasis on specific questions from readers, which include in-depth retirement investing articles. These requests are extremely valuable, as they allow me to broaden my coverage, address important topics, and solve real-life issues, all at the same time.
The latest question I got was very simple, as it was about whether five industry groups are enough.
It is the right question. It is also the wrong one.
I know that because I got it wrong myself.
A few years back, I built a twelve-stock model portfolio I was proud of. It had three layers, sorted by role. Growth on top, an income base, a blend in the middle. I called it a diversified pyramid model portfolio. On paper, it was diversified, as it was twelve names across ten industries, including healthcare and tobacco.
It was not as diversified as I thought. And while it was "just" a model portfolio, that's still no excuse.
The portfolio can be seen below (numbers as of March 2023):
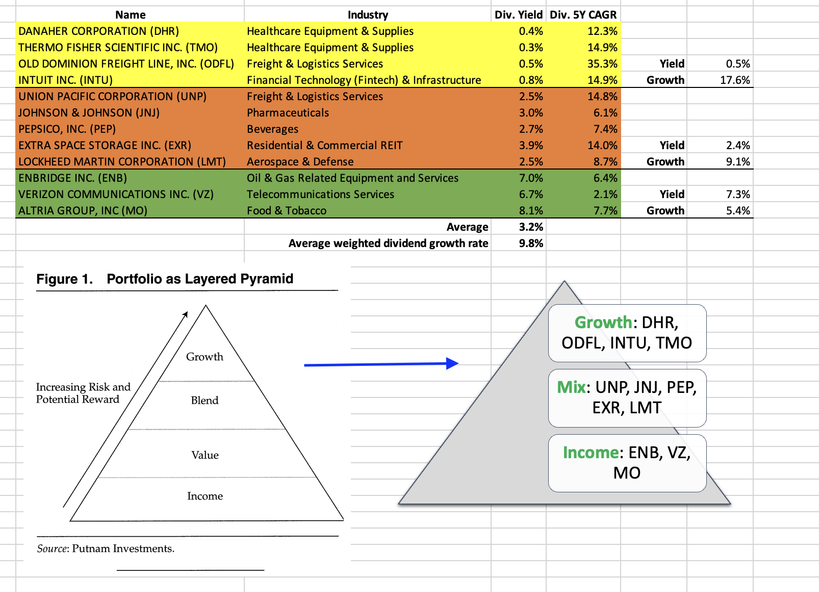
As it turned out, the number of buckets told me nothing about how the buckets moved. Sort the same twelve stocks a different way, by what actually drives their returns, and most of the diversification I thought I had disappears. So this piece is not about how many groups you need. It is about how to tell whether the groups you have are real, and how to run that test on your own portfolio in twenty minutes.
I'll tell you all about it and explain how you can apply these learnings to your own portfolio.
So, as we have a lot to discuss, let's get right to it!
A Quick Look At The Scorecard
This article isn't about my 2023 model portfolio. However, because I truly messed up the diversification in that one, it's a good example of what we're discussing today. If I had to rate it today, the rating would look like this:
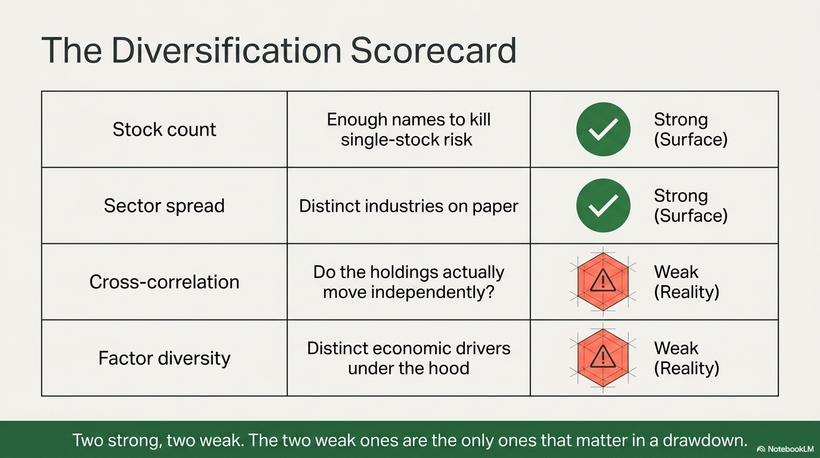
Two strong scores and two weak scores. The strong scores show I applied basic diversification. However, the two weak ones are the two that matter in a drawdown, which is kind of the point of correct diversification.
And that's what the next part is about.
The Argument The Greats Never Settled
Diversification is a fascinating topic. Some say that diversification is for people who are bad at picking stocks, while others say that it's needed because nobody can predict the future. And then there are a million other theories. At least, it feels that way.
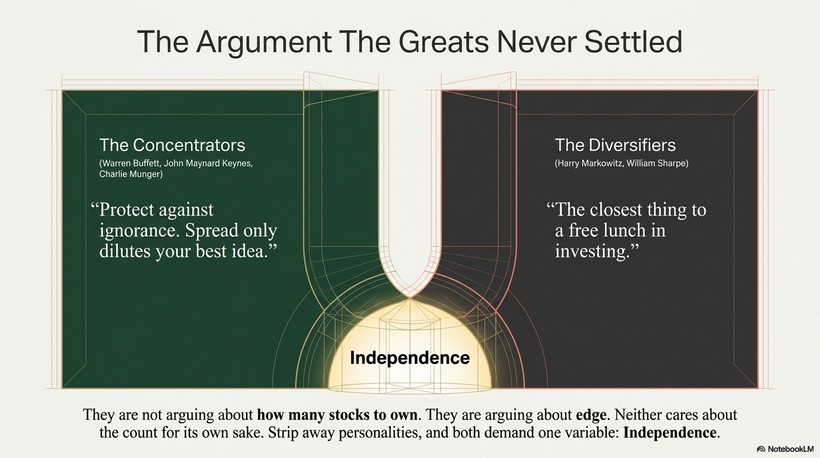
Warren Buffett is among the concentrators.
He put it bluntly: diversification is protection against ignorance. It makes little sense, in his view, once you know what you are doing. John Maynard Keynes ran his college endowment the same way decades earlier, as he was loading serious money into the few things he understood. Charlie Munger spent a lifetime saying a handful of great businesses is plenty.
As I own 15 individual stocks (with plans to expand that number), I tend to agree with them.
Then there are the diversifiers.
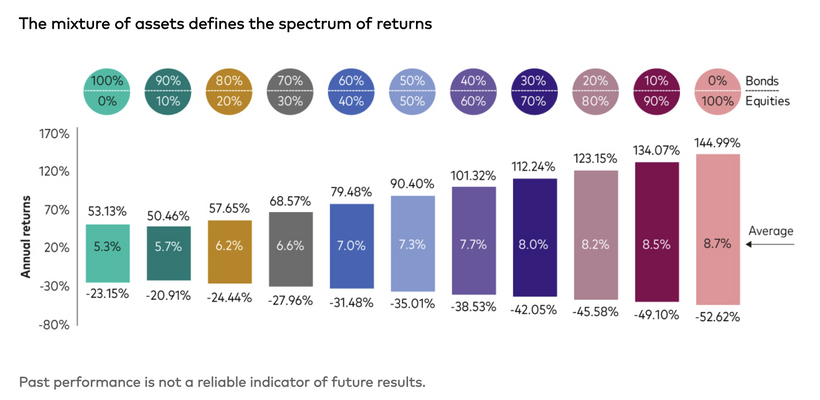
Harry Markowitz built the math that won a Nobel Prize, and the line most often credited to him, that diversification is the closest thing to a free lunch in investing, became key. Meanwhile, William Sharpe turned it into the model every textbook still teaches.
Basically, with elevated diversification, you get returns very similar to major asset class buckets, so to speak. What that looks like can be seen in the overview below:
The funny thing about two groups of experts having opposite opinions is that it makes picking the right answer even harder. So, who's right?
It depends.
A retiree living off dividends cannot run a five-stock book the way Buffett used to run Berkshire.
That's basically the answer right there.
Here is the resolution, and it unlocks everything else if you ask me. They are not arguing about how many stocks to own. They are arguing about whether you have an edge. Buffett's point is that diversification protects you from what you do not know. Know a business cold, and spreading it thinner just dilutes your best idea. If you do not know a business well, spreading saves you from your own blind spots.
That's exactly my approach. I believe I know my stocks very well. And because my hobby is my job, I spend almost every hour researching. My best friend, who owns many of the stocks that I own, has a 50% ETF sleeve, as he's in a different spot. He spends his time climbing the career ladder instead of focusing on his holdings.
And, to be honest, that's the advice I give most people who are not in the business. Just buy an index fund and spend your time focusing on your job, family, and hobbies.
Also, neither of the two groups I just brought up cares about the count for its own sake. Buffett concentrates (used to concentrate) his portfolio into businesses with different economic engines. Markowitz's math only works when holdings move differently from each other. In other words, if we ignore the personalities, both sides point to the same variable.
It's all about how independent our investments are.
Peter Lynch named the failure mode. He called piling up holdings that add nothing "diworsification." More names, no more safety. You can own thirty stocks and be diworsified if they all have a high correlation to each other.
The Count Answer, And The Assumption Buried Inside It
"How many stocks make a diversified portfolio?" is one of the oldest questions in finance, and the answers do not agree (imagine that).
Evans and Archer (1968) built portfolios of random stocks and watched volatility fall as they added names. Their conclusion became the rule of thumb you carry in your gut, which is that most diversifiable risk is gone by ten to fifteen stocks, and the curve flattens hard after that.
Then the number climbed.
Statman (1987) ran the cost-benefit math and got thirty to forty stocks.
By 2004, in "The Diversification Puzzle," he pushed past three hundred as the mean-variance optimum, while the average investor held three or four (I doubt that is still the case). That gap is the puzzle in the title.
Newer work argues the number is higher still, partly because correlations between stocks have drifted lower over the decades, so you need more names now to get the risk reduction you got in 1968.
So, the number is ten to three hundred, depending on who you ask. And almost needless to say, that spread alone tells you the count is not the thing.
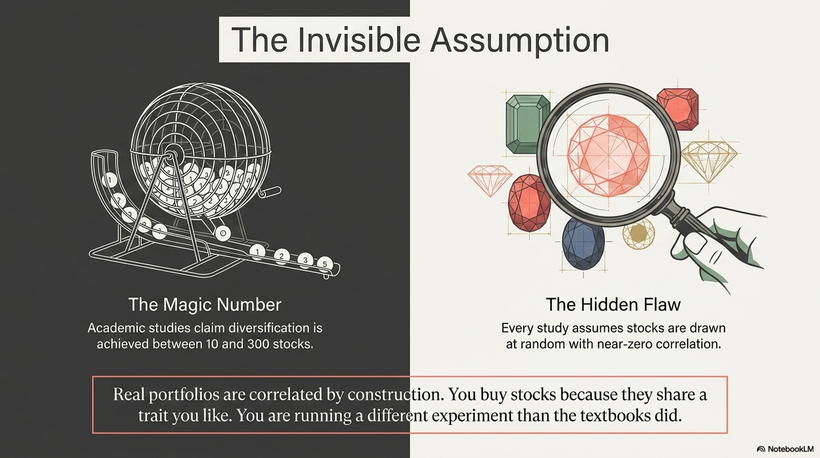
Here is the part most tend to forget. Every one of those studies assumes the stocks are nearly uncorrelated. Evans and Archer used random selection. Statman's 2004 math runs on an average pairwise correlation of 0.08, almost zero. The whole curve, the entire "ten stocks are enough" idea, is based on the assumption that your holdings barely move together.
The moment that breaks, the number is meaningless.
And in a real portfolio, it always breaks. You do not pick at random. You pick what you like: high-quality compounders, or fat yields, or the one sector you understand. So your holdings are correlated by construction, because they share the trait that made you buy them. You are running a different experiment than the studies ran, getting a different result, and not noticing.
Just think about it. I own many industrials due to my focus on wide-moat TOLL stocks. Others own a lot of technology. Some are massively overweight midstream stocks. Others love BDCs, banks, or REITs.
I do not have the data, but I am sure that if you were to look into random people's portfolios, the overwhelming majority of stock pickers would score very low on diversification.
Why Correlation Is The Floor, Not The Count
A portfolio's risk breaks into two pieces.
The first is the average risk of each stock, divided by the number of stocks.
The second is the average covariance between the stocks, which is just a fancy word for how much they move together.
So portfolio risk does not fall to zero. It falls toward the average covariance of your holdings, and stops there. That covariance is the floor, and you cannot get below it by buying more of the same kind of thing.
This means that count controls how fast you reach the floor, while correlation sets where the floor sits.
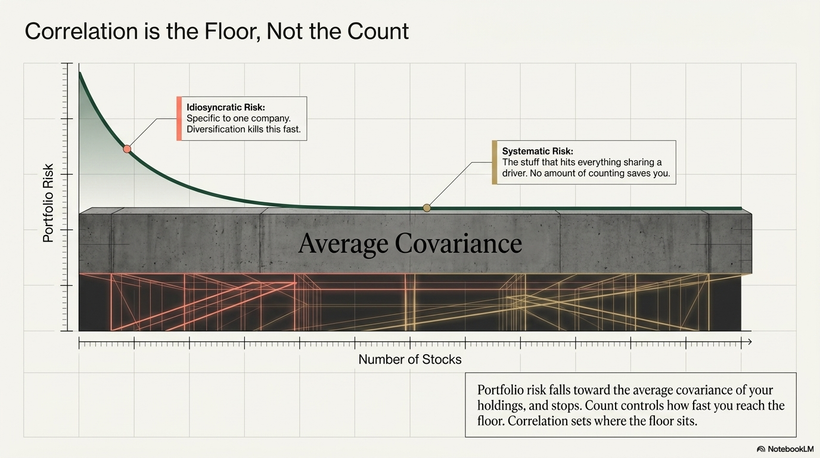
The risk you can diversify away is idiosyncratic, which is specific to one company. For example, if I own 100 companies with a weighting of 1% each, and one of them turns out to be a fraud that gets sued out of business, it may hurt my ego, but it most certainly doesn't do a lot of damage to my portfolio.
The risk you cannot diversify is systematic, the stuff that hits everything sharing a driver. Diversification only kills the first kind. The floor is the second kind, and inside a stock portfolio, it is built from shared factor exposures: interest rates, growth, the credit cycle, and energy.
If your holdings all load on the same factor, no amount of "count" saves you.
Dalio says it very clearly. A thousand stocks that are sixty percent correlated barely beat five noncorrelated stocks for diversification. So even when you think you are diversified, you are not.
The Holy Grail, And Why It Fails When You Need It
If correlation is the whole game, what does winning look like?
Ray Dalio gave the cleanest answer in modern investing and called it the Holy Grail.
The claim is specific.
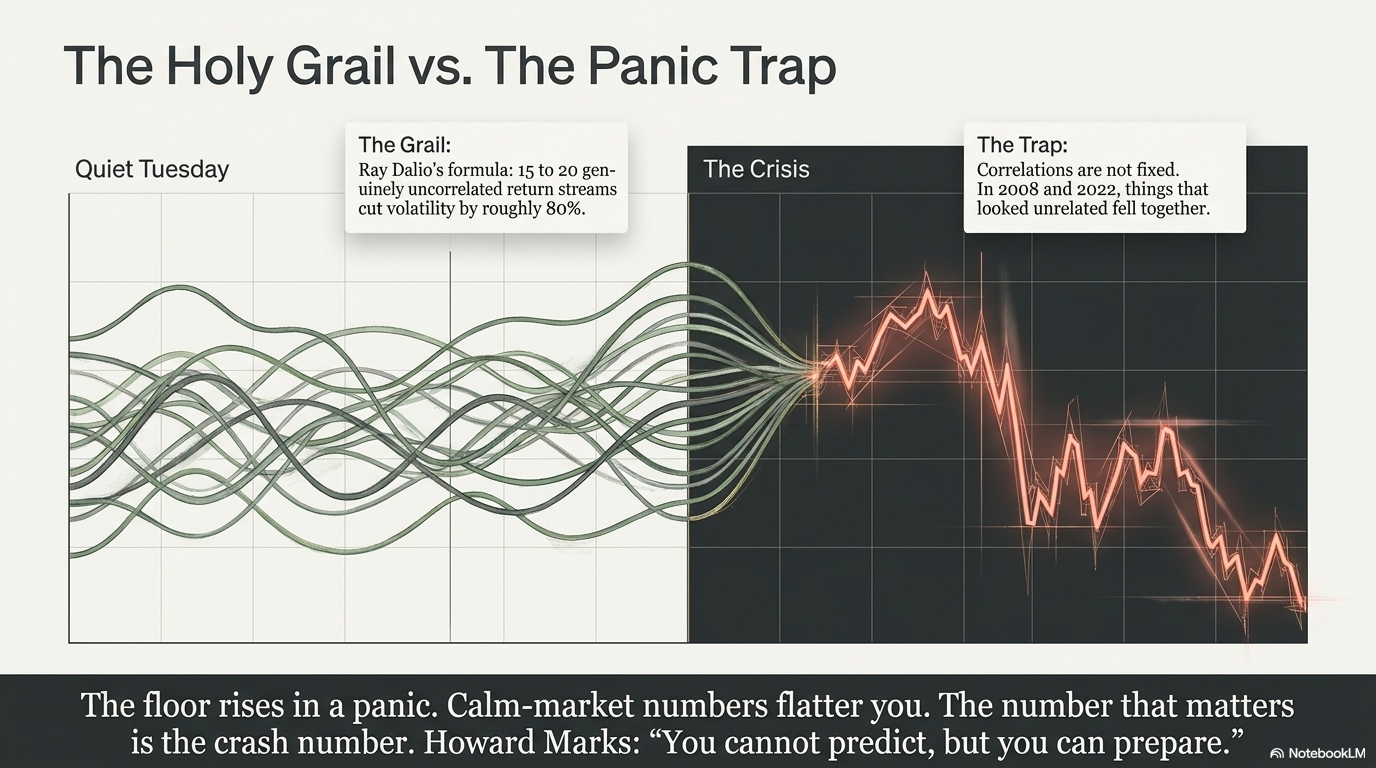
Find fifteen to twenty genuinely uncorrelated return streams, balance their risk, and you cut volatility by roughly eighty percent without giving up return.
He improved his fund's return per unit of risk about fivefold with this one insight. He focused on finding independent investments. Most people think the path to winning is the single perfect pick. Dalio's point is that no pick can compete with a basket of bets that genuinely zig and zag against each other.
That is the core of my entire article. And Dalio built one of the biggest hedge funds in the world around this idea.
But there is a catch that turns theory into something that can hurt you. Correlations are not fixed. They rise in a crisis. The diversification you measured in calm markets evaporates the moment you rely on it. It's no guarantee, but it can happen.
For example, in 2008, things that looked unrelated fell together. In 2022, stocks and bonds, the classic hedge pair, dropped in tandem, and the standard balanced portfolio had its worst year in a generation.
The "floor" we just discussed rises during panic. The average correlation among your holdings can jump when fear takes over. Your real diversification is weakest exactly when you need it strongest. This is why the calm market number flatters you.
Howard Marks framed the response in a short sentence.
You cannot predict, but you can prepare.
You will never call the timing of the next correlation spike. You can build a book that survives it anyway, by making your independent bets independent for structural reasons, not because a quiet three-year lookback said so.
The Autopsy: Re-Sorting My Twelve
Let me do this on myself, because the cleanest way to teach it is to get caught.
I sorted those twelve by role, which really means by yield:
Growth: Danaher (DHR), Thermo Fisher (TMO), Old Dominion (ODFL), Intuit (INTU)
Mix: Union Pacific (UNP), Johnson and Johnson (JNJ), PepsiCo (PEP), Extra Space Storage (EXR), Lockheed Martin (LMT)
Income: Enbridge (ENB), Verizon (VZ), Altria (MO)
Now, I'm re-arranging them through a new lens (economic factors)
Cluster one, rate-sensitive income. Enbridge, Verizon, Altria, and the kicker, Extra Space Storage. Three sat in my income layer and one in my mix layer, so I never saw them as a group. But a pipeline, a telecom, a tobacco name, and a self-storage REIT share one master. They all trade like bond proxies. When rates jump, all four reprice the same way at the same time.
Cluster two, industrial volume. Old Dominion and Union Pacific. One growth, one mix, so they looked separate. They are not. Trucking and rail both ride the volume of physical goods moving through the economy, and they slow together. I obviously knew that, but I didn't make it clear in the pyramid.
Cluster three, life sciences. Danaher and Thermo Fisher. Direct competitors in the same end markets. Two names in my growth layer that were really one. They basically move in lockstep.
Now count what is independent. Lockheed Martin stands mostly alone, because its revenue comes from government defense budgets that ignore rates and freight. PepsiCo and Johnson and Johnson add defensive ballast, though they overlap with Altria on the staples factor.
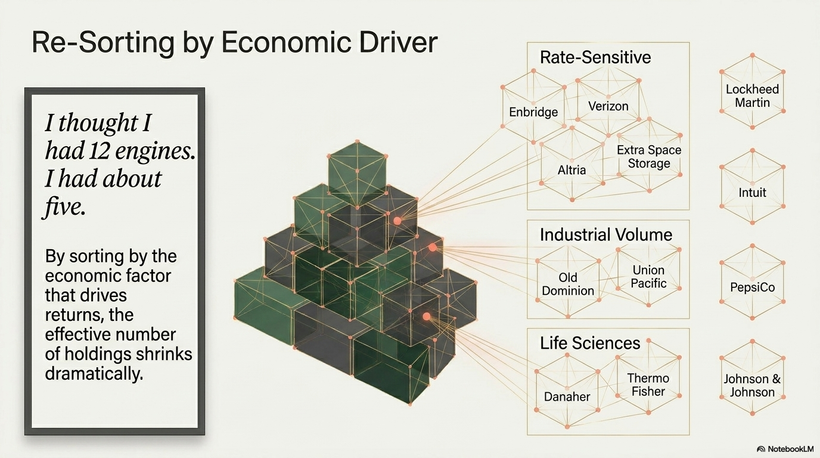
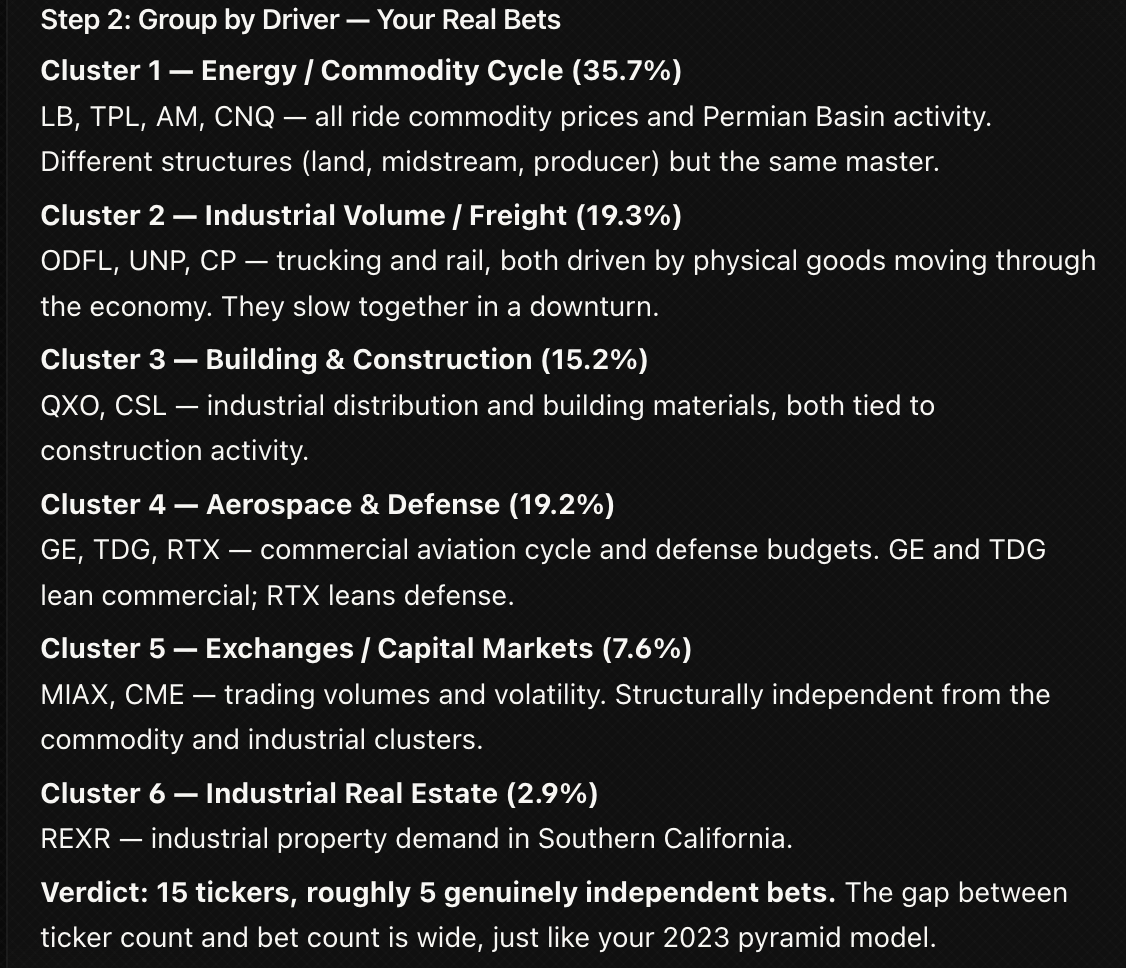
This means that twelve names only have roughly five or six genuinely independent bets.
The Income Trap For Retirees
If you live off your portfolio, this is the point that can hurt you. Technically speaking.
Income investors concentrate without realizing it, because the high-yield universe is small and it tends to create clusters. This includes REITs, BDCs, midstream, telecom, utilities, and preferreds. Different labels, different sectors on the screen, but a huge share of that yield comes from one place: sensitivity to rates and credit.
It is one of the reasons why I have written before that a decline in interest rates tends to be great for income stocks, in general.
You can build an income book that looks spread across eight sectors and still have every dollar of your floor riding on one factor. After all, if risk-free rates rise, income stocks, in general, face competition. It makes that entire group of stocks one big theme. I'm painting with a broad brush, but in general, that's a major issue.
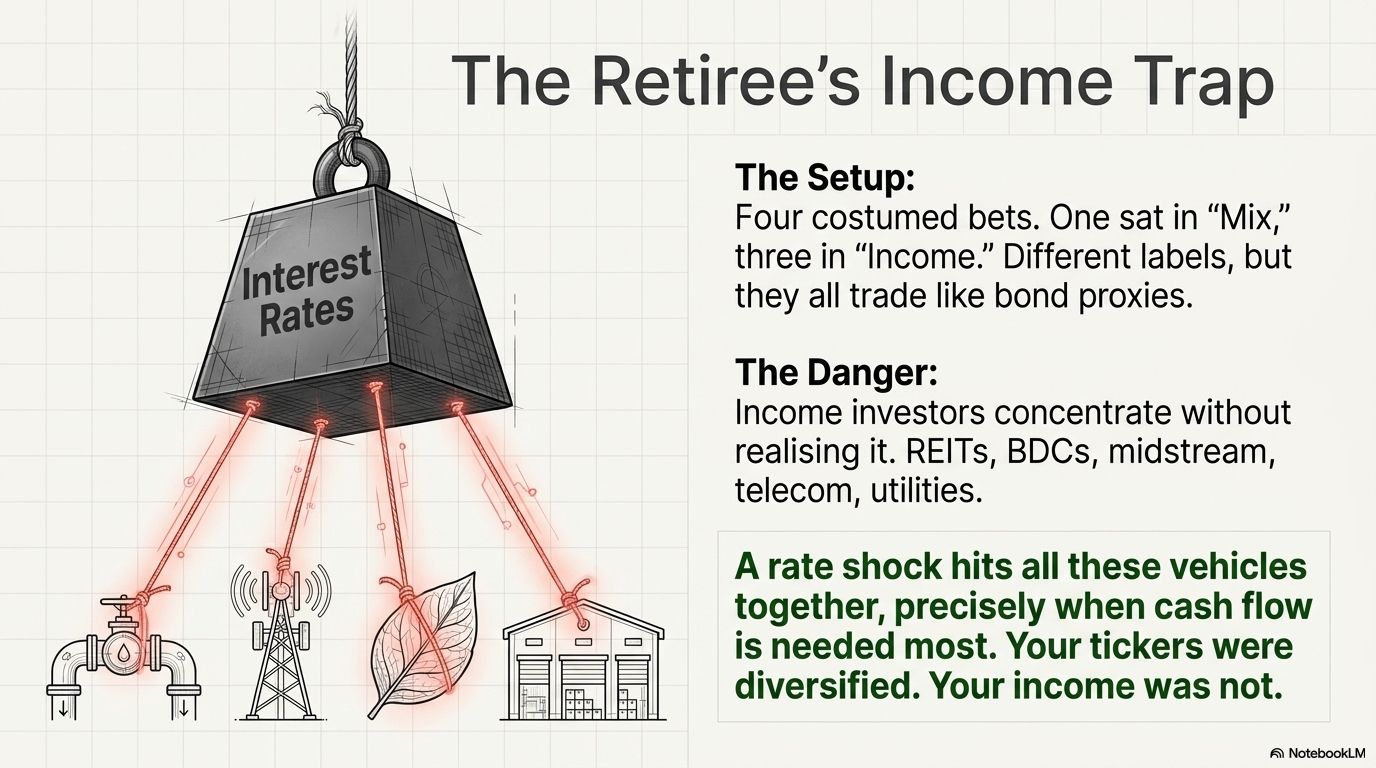
And it ties straight to the crash problem. That factor breaks at the worst time. A rate shock or credit event hits all of those vehicles together, precisely when you need the cash flow, and least want to sell to raise it. Also, when you're withdrawing cash, steep declines make it more expensive over time.
The Playbook: Diversify The Floor, Not The Count
How can we check our own portfolios?
I have a playbook that may help you.
One, list every holding and write the real driver beside it, not the sector label. What single thing has to go right, and what would sink it? Rates, industrial activity, the consumer, energy, government spending, and the tech cycle. In general, this step really helps you to figure out if you still like your holdings. You may find some ideas you bought because of a reason that doesn't exist anymore.
Two, group by driver and count the groups, not the stocks. Put every name sharing a master in one pile. The piles are your real bets, and the count is almost always smaller than your ticker count. In other words, if you own PEP, KO, F, and GM, you own four stocks but two groups (consumer staples and car manufacturers).

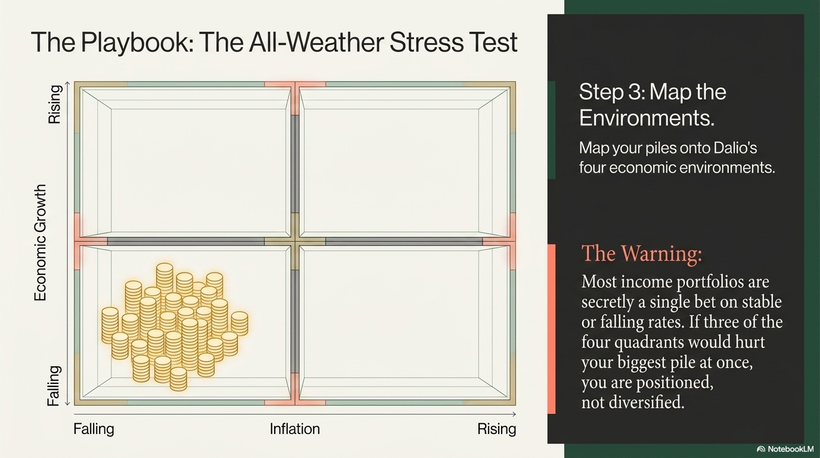
Three, map the piles onto the four environments. This is Dalio's All Weather lens. Two levers, growth and inflation, each rising or falling, give four conditions. For example, consumer staples are defensive consumer exposure. Car manufacturers have cyclic consumer exposure. If three of the four would hurt you at once, you are not diversified.
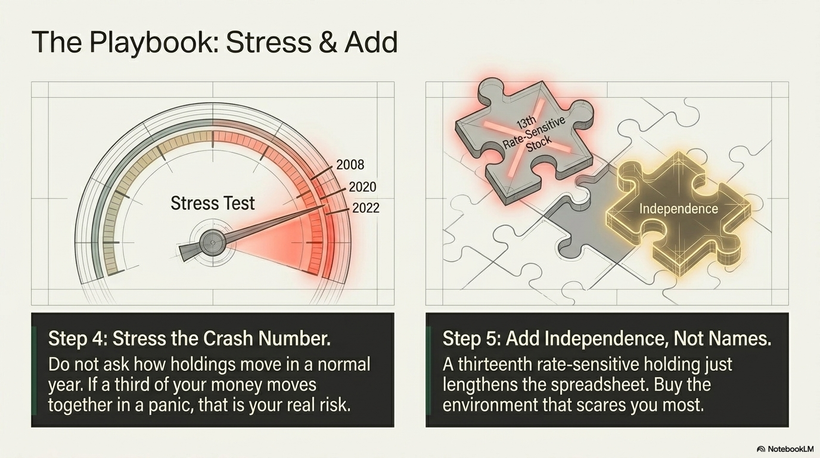
Four, find your biggest pile and stress the crash number. Do not ask how those holdings move in a normal year. Ask how they moved in 2008, March 2020, and 2022. If one pile is a third or more of your money and it all moves together in a panic, that is your real risk.
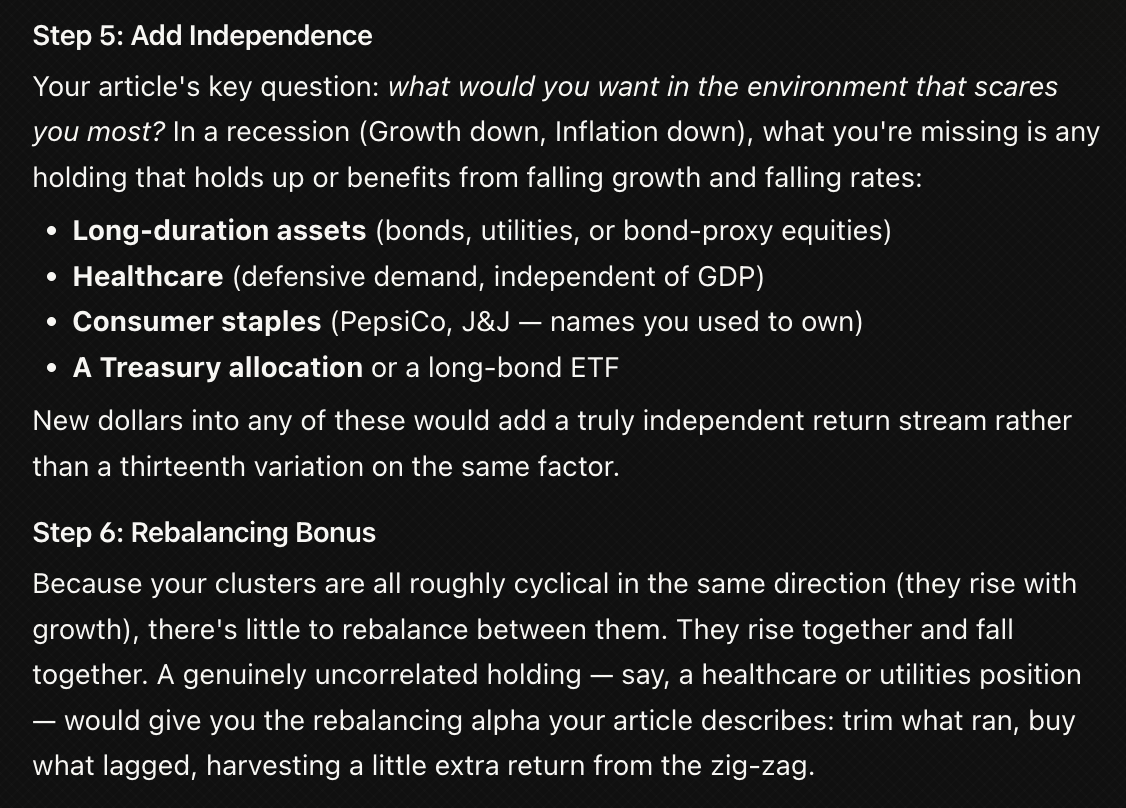
Five, add independence. A thirteenth rate-sensitive holding lengthens the spreadsheet and changes nothing. That is diworsification. The goal is a pile you do not yet own. Ask what you would want in the environment that scares you most, and whether you own any of it.
Six, let rebalancing pay you. Own genuinely uncorrelated bets and rebalancing trims what ran to fund what lagged, harvesting a little extra return on top of the lower risk. Correlated holdings give you none of that, because they rise and fall together with nothing to rebalance between. This is the free lunch the line was always pointing at. However, please note that the major risk here is that you cut the flowers and water the weeds(!!!!). Do not randomly cut your winners for diversification reasons. I'm personally very fine with ignoring step six, even if it hurts my diversification.
Takeaway
Diversification is not about how many tickers I own, but about how many truly independent bets are inside my (or anyone's) portfolio. I got this wrong before, and that is exactly why I take it seriously now.
A large portfolio can still be one big bet if the same drivers - rates, credit, growth, energy, or the consumer - move everything at once. That matters even more for retirees and income investors, because the highest-yielding buckets often hide the same risk under different labels.
That's why my goal is not to own more for the sake of owning more. It is to own better and build a portfolio that can survive when correlations rise. And while it will take a long time for my portfolio to be more diversified, I see it as a long-term project where I mainly use new dollars to achieve this through stock additions.
For now, I like my riskier portfolio, knowing full well which risks I am taking.
The GNG AI Bonus Part
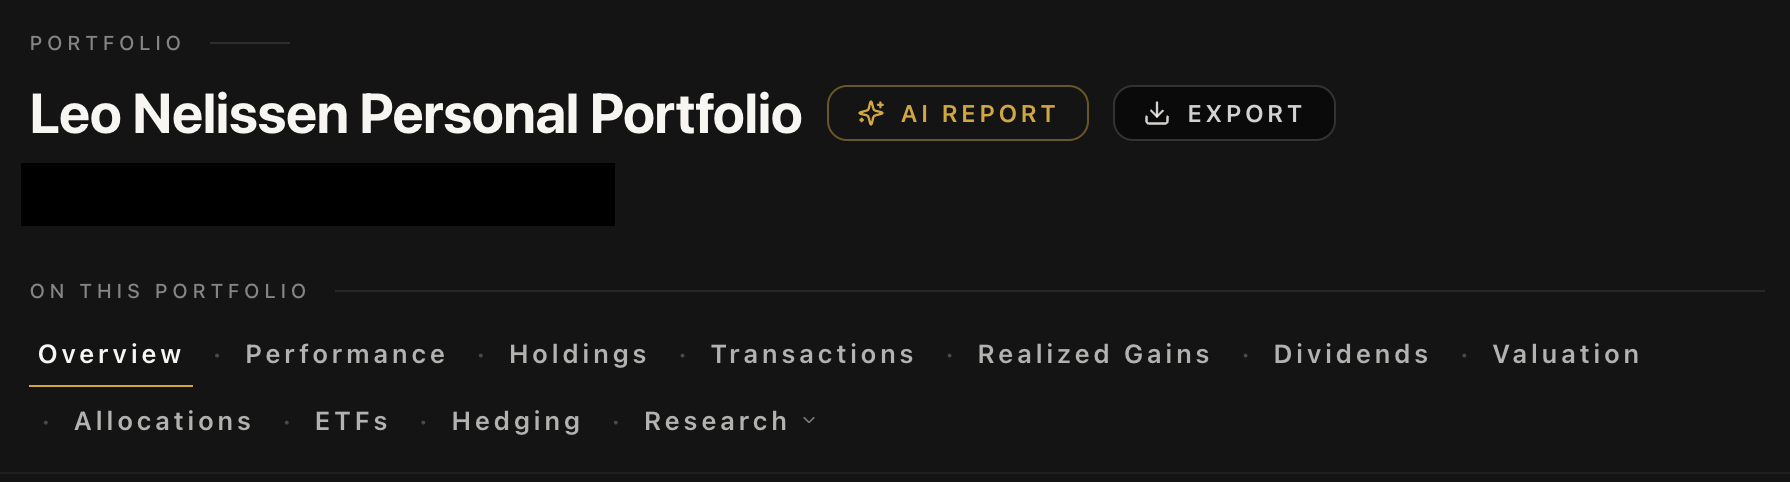
I thought a lot about what I just wrote and decided that this isn’t the end of the article yet. After all, we’re on GNG here, which means we have the best tools at our disposal. For example, if you have uploaded your portfolio to GNG, you can literally run an AI report that is finished in no time.
See the AI Report button next to the portfolio name. And if you click on “Portfolio Actions,” you can even run an optimizer for whatever goal you may have (i.e., more yield or more growth).
Please note that my portfolio is online; I just haven’t made it accessible yet. The only reason is that I want to keep the real dollar value private for now. I promised to make my portfolio holdings visible, and that’s definitely coming. Sorry for the delay!
And as much as I love these tools, nothing beats the GNG AI.
Before I published this article (I could not have done it after - for obvious reasons), I asked our GNG AI the following thing: “I wrote this article. Can you apply the main takeaways to my personal portfolio?” And I obviously added a PDF of my article, so it knew what I was talking about.
What followed was an extensive deep-dive.
Here are some screenshots from the result that I can show you:
This is just the tip of the iceberg.
There’s so much more. And I love how our AI can analyze your portfolio and integrate our research right away.
Give it a try. You will not regret it. What Connor has built here is nothing short of incredible. Play with it. You’ll find out how it can help you.
And yes, I’ll implement our AI a lot more in my future articles.
Stay tuned!