
Over the last 30 days, 21 analysts raised their Vertiv (VRT) EPS estimates and 3 cut them. Management has raised full-year guidance, the balance sheet carries essentially no net debt, and the company just agreed to buy its way upstream into onsite power. The stock still fell to $226.94 intraday on September 14, about 40% below its May high. It closed Tuesday at $253.46, which looks like an oversold bounce.
I think the bounce is the less interesting part.
What changed in ten days
The first piece anchored on the September 11 close of $257.06. The Monday after, the stock gapped down and closed 7.63% lower at $237.39 on almost twice its normal volume. Several things landed at once: the shares went ex-dividend, the Nasdaq was down 1.6% during the session, options flow had turned bearish, and investors were still chewing on the undisclosed economics of the UtilityInnovation Group deal and the second quarter revenue miss.
Here is where the price action gets interesting.
The September 14 intraday low of $226.94 held above the July 29 low of $220.92, set on the day Vertiv reported and the stock fell 17.26%.
That's a higher low after two violent selloffs in eight weeks.
From there the stock has recovered 11.7% in six sessions, and it's up 56% for the year while still sitting 33% under the $379.94 high.
The third quarter is where conversion gets answered
The core problem from the first piece hasn't changed.
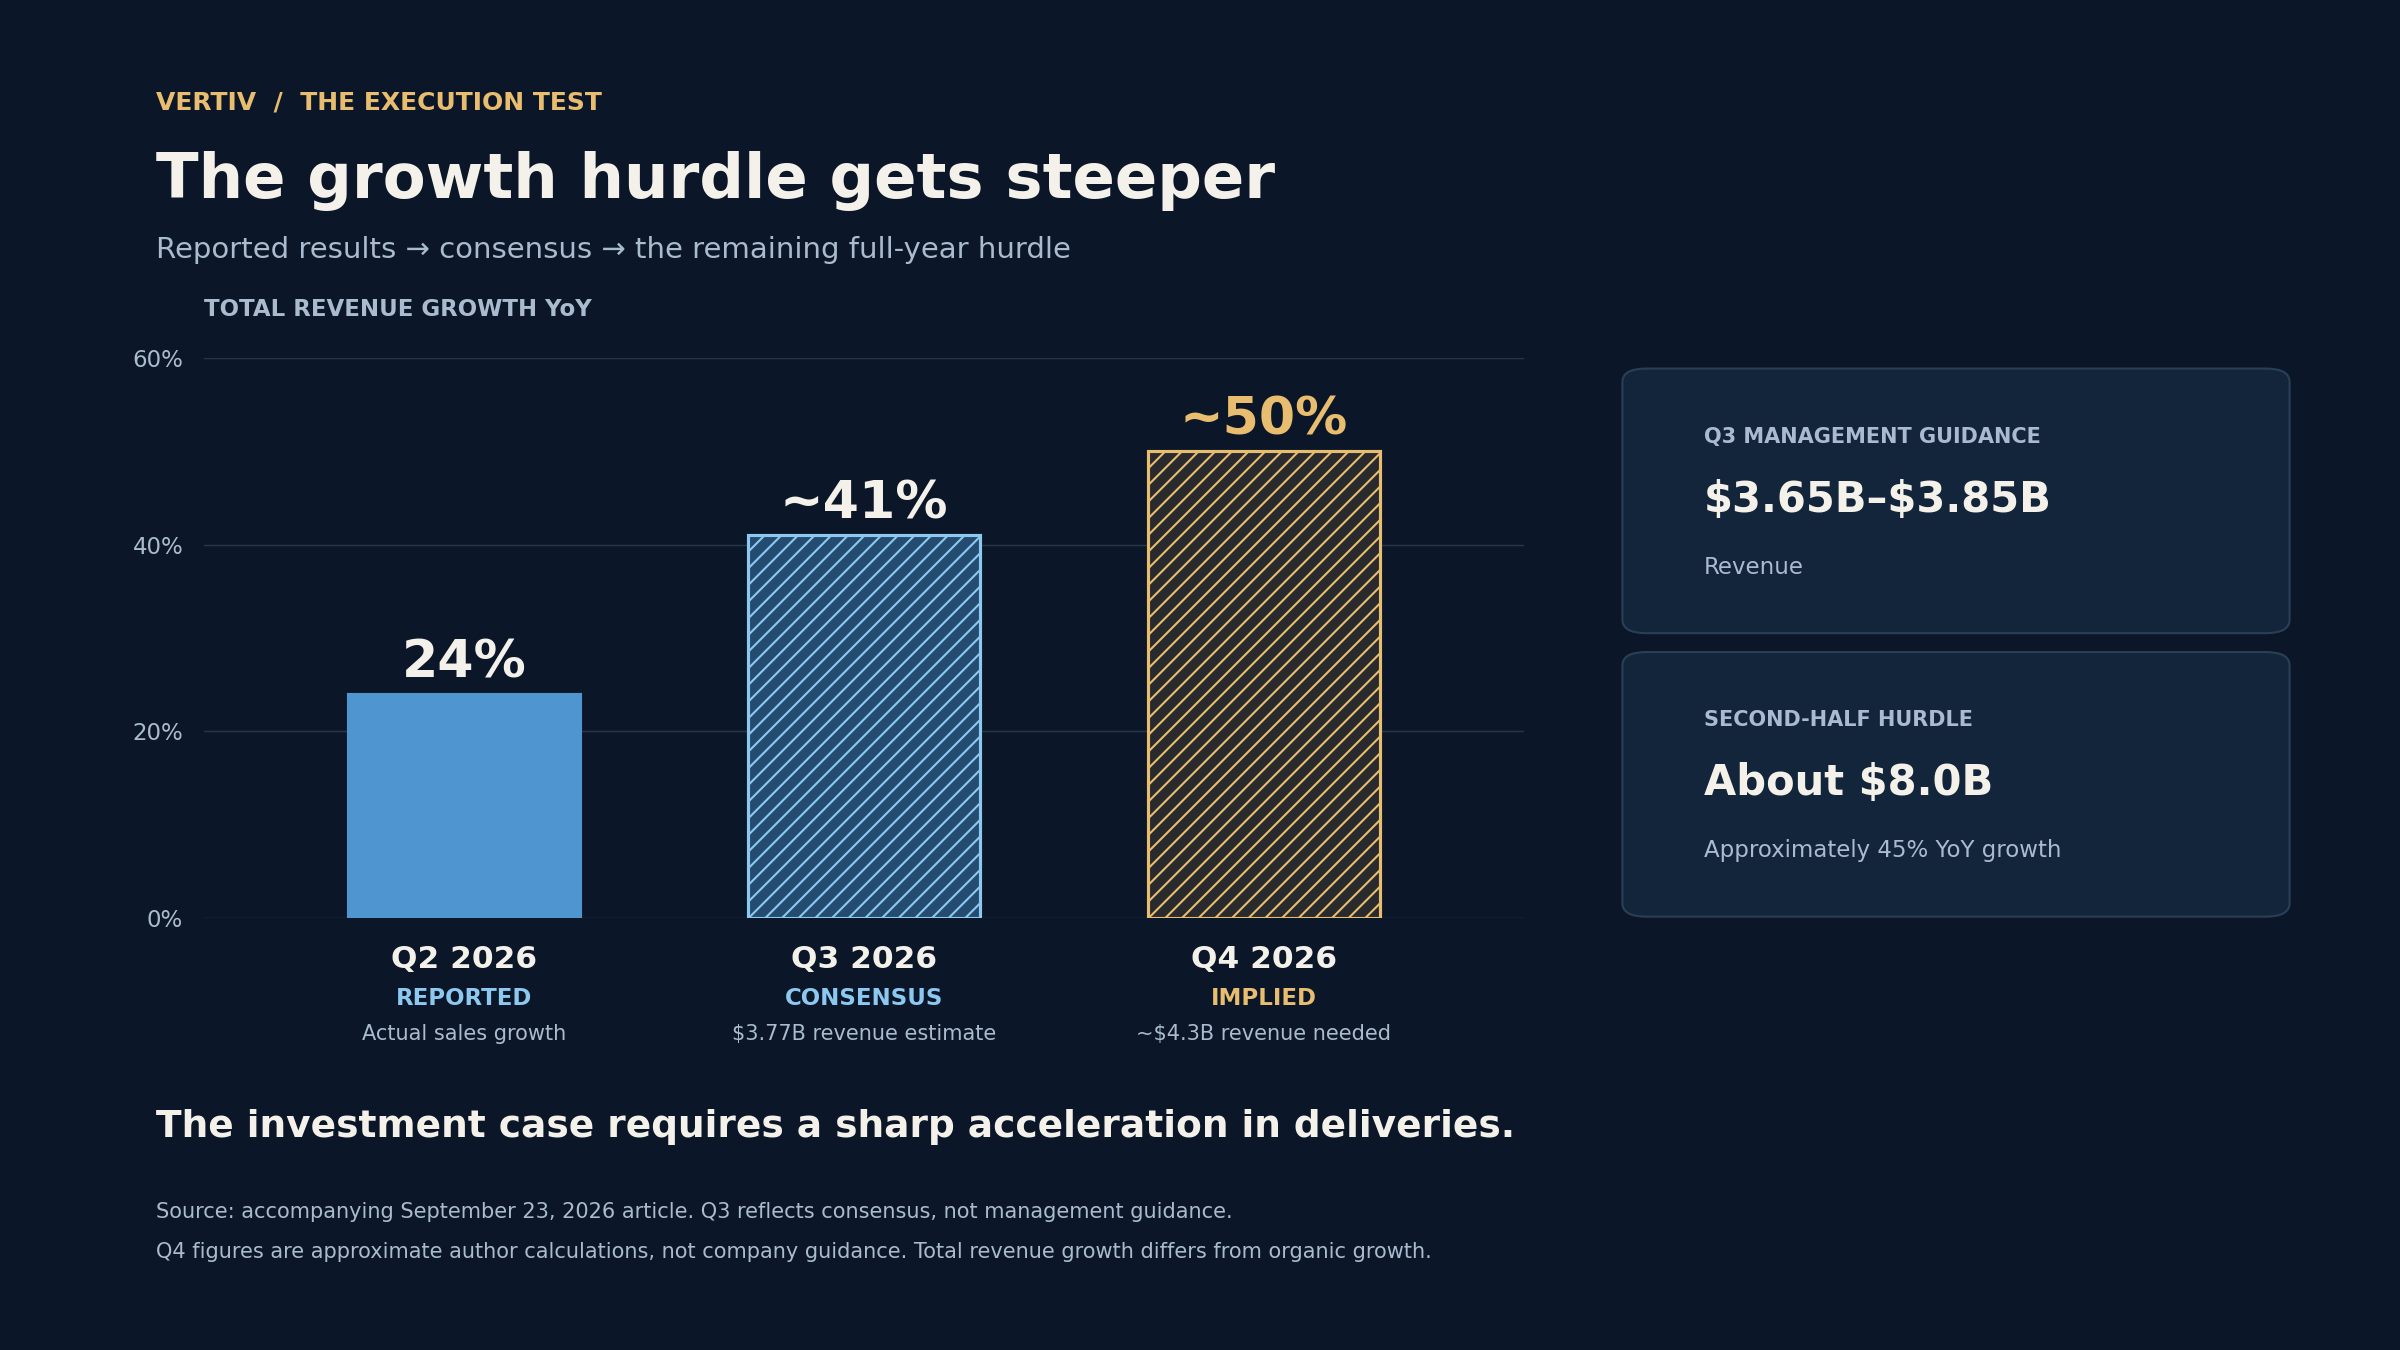
Second quarter sales grew 24%, but only 18 points of that was organic, and the full-year guide calls for 31% organic growth. That puts the second half near $8.0 billion against roughly $5.5 billion a year earlier, about 45% growth by management's own figure.
Now there's a quarterly number attached to it. Management guided third quarter revenue to $3.65 billion to $3.85 billion, and the current consensus estimate looks for $3.77 billion, roughly 41% above the year-ago quarter. Analysts expect EPS around $1.83 to $1.85, up about 48%. Let me put those side by side: the quarter the market just sold grew 24%, the next one is expected to grow 41%, and on my arithmetic the fourth quarter would then need about $4.3 billion, or close to 50% growth.
That's a steep ramp.
I won't soften it, but I also don't think it's reckless. Management raised the full-year guide right after the miss, new capacity in Malaysia, the Americas and EMEA is coming online, and estimate revisions have kept moving up since July. If the third quarter lands inside the guided range, most of the conversion doubt goes with it.
What the daily chart is saying
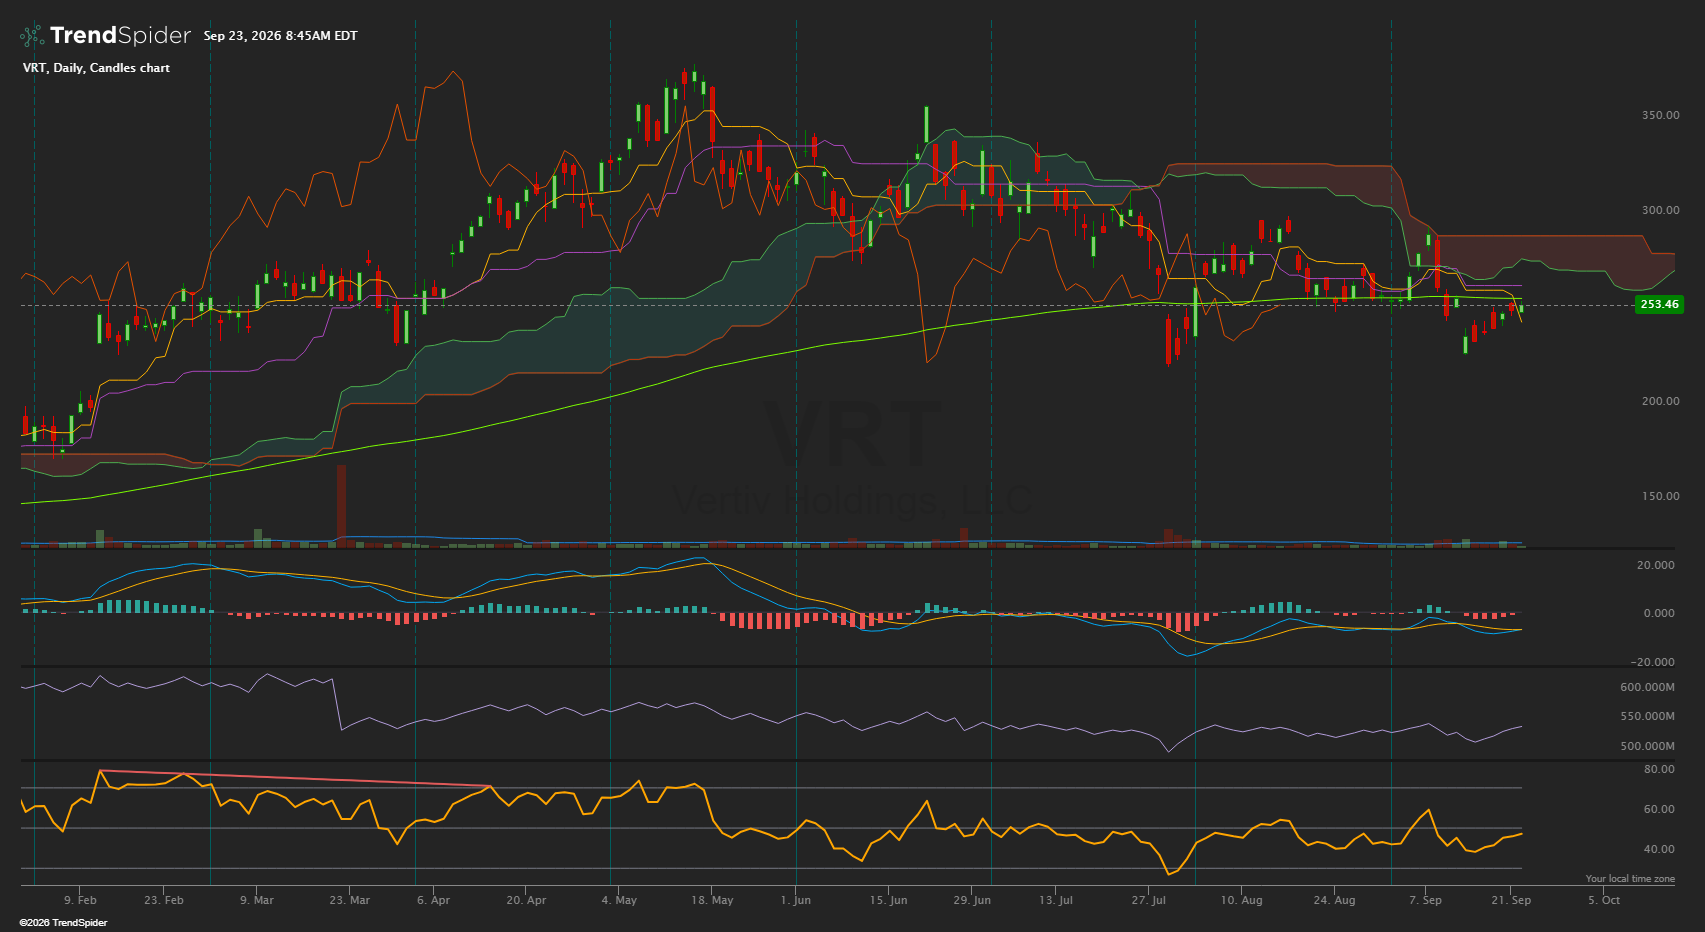
The trend hasn't repaired yet. Price sits below the Ichimoku cloud, and the cloud ahead is red, running roughly from $273 to $290 in GNG's latest data. That band is overhead supply, and the early September rally died right at its top edge.
The 200-day moving average, which GNG had at $260.74 in its data as of last Friday, is now just above the price. MACD is below zero with a small negative histogram, so downside momentum is fading without having turned.
Underneath, the picture is better.
RSI bottomed near 40 this month after dipping toward 30 following the July print, which suggests this selloff carried less forced selling. On-balance volume held its range through the drawdown and has ticked up since mid-month. And the higher low against July is the single most important feature on the chart.
So here's how I'd read the levels. A close back over the 200-day would be step one of the repair, and the cloud base in the low $270s is step two. On the downside, GNG's pivot supports sit at $237.71, $233.94 and $226.62. If price closes under this month's low near $227, the higher-low structure is gone and I'd go back to the drawing board.
What the forward projection shows
The GNG Research forward valuation chart for VRT now runs on a ten-year window with three forecast years, with inputs refreshed this morning.
Sign in to leave a comment and join the discussion.
Sign Up Free