You must be logged in to view this page. Log in or create a free account.
Portfolio Tracker
Every holding, every dividend, every gain in one tracker. Add positions manually or link your brokerage account for automatic monitoring.
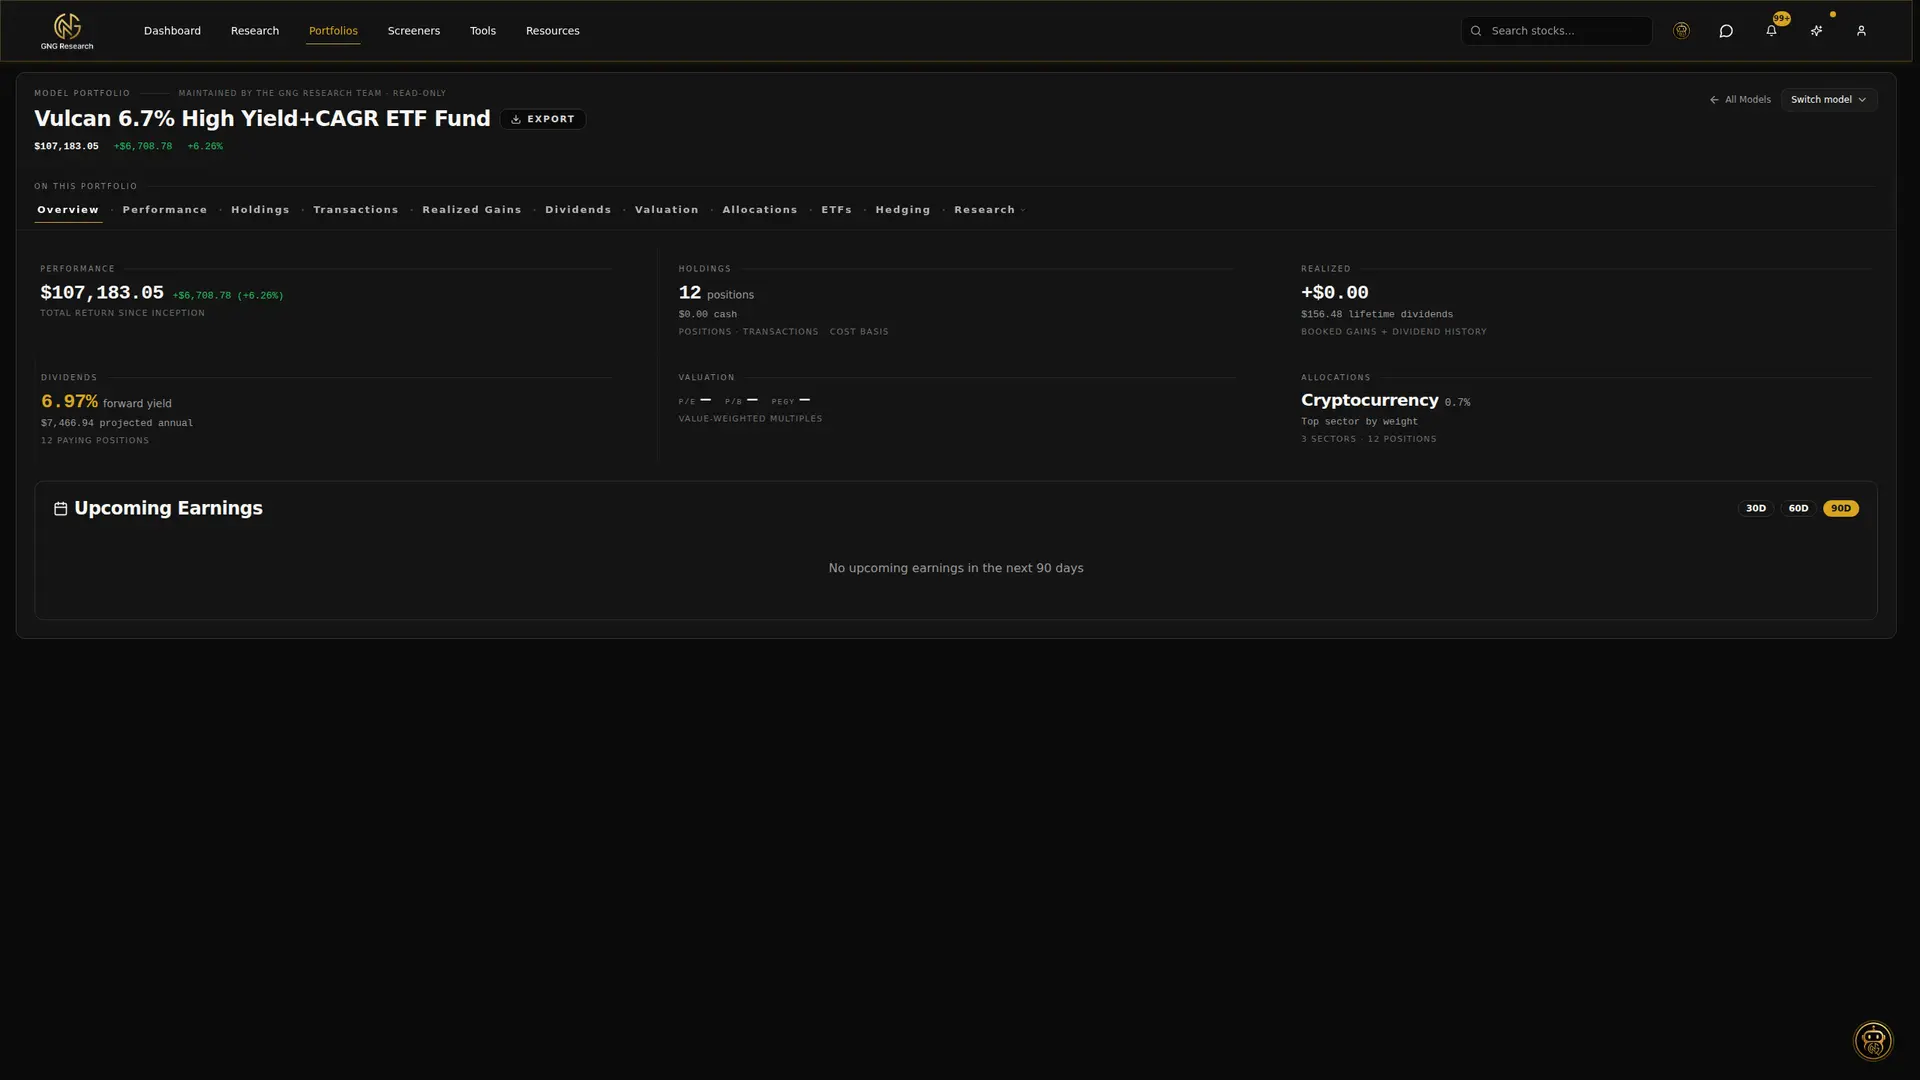
Ten tabs deep
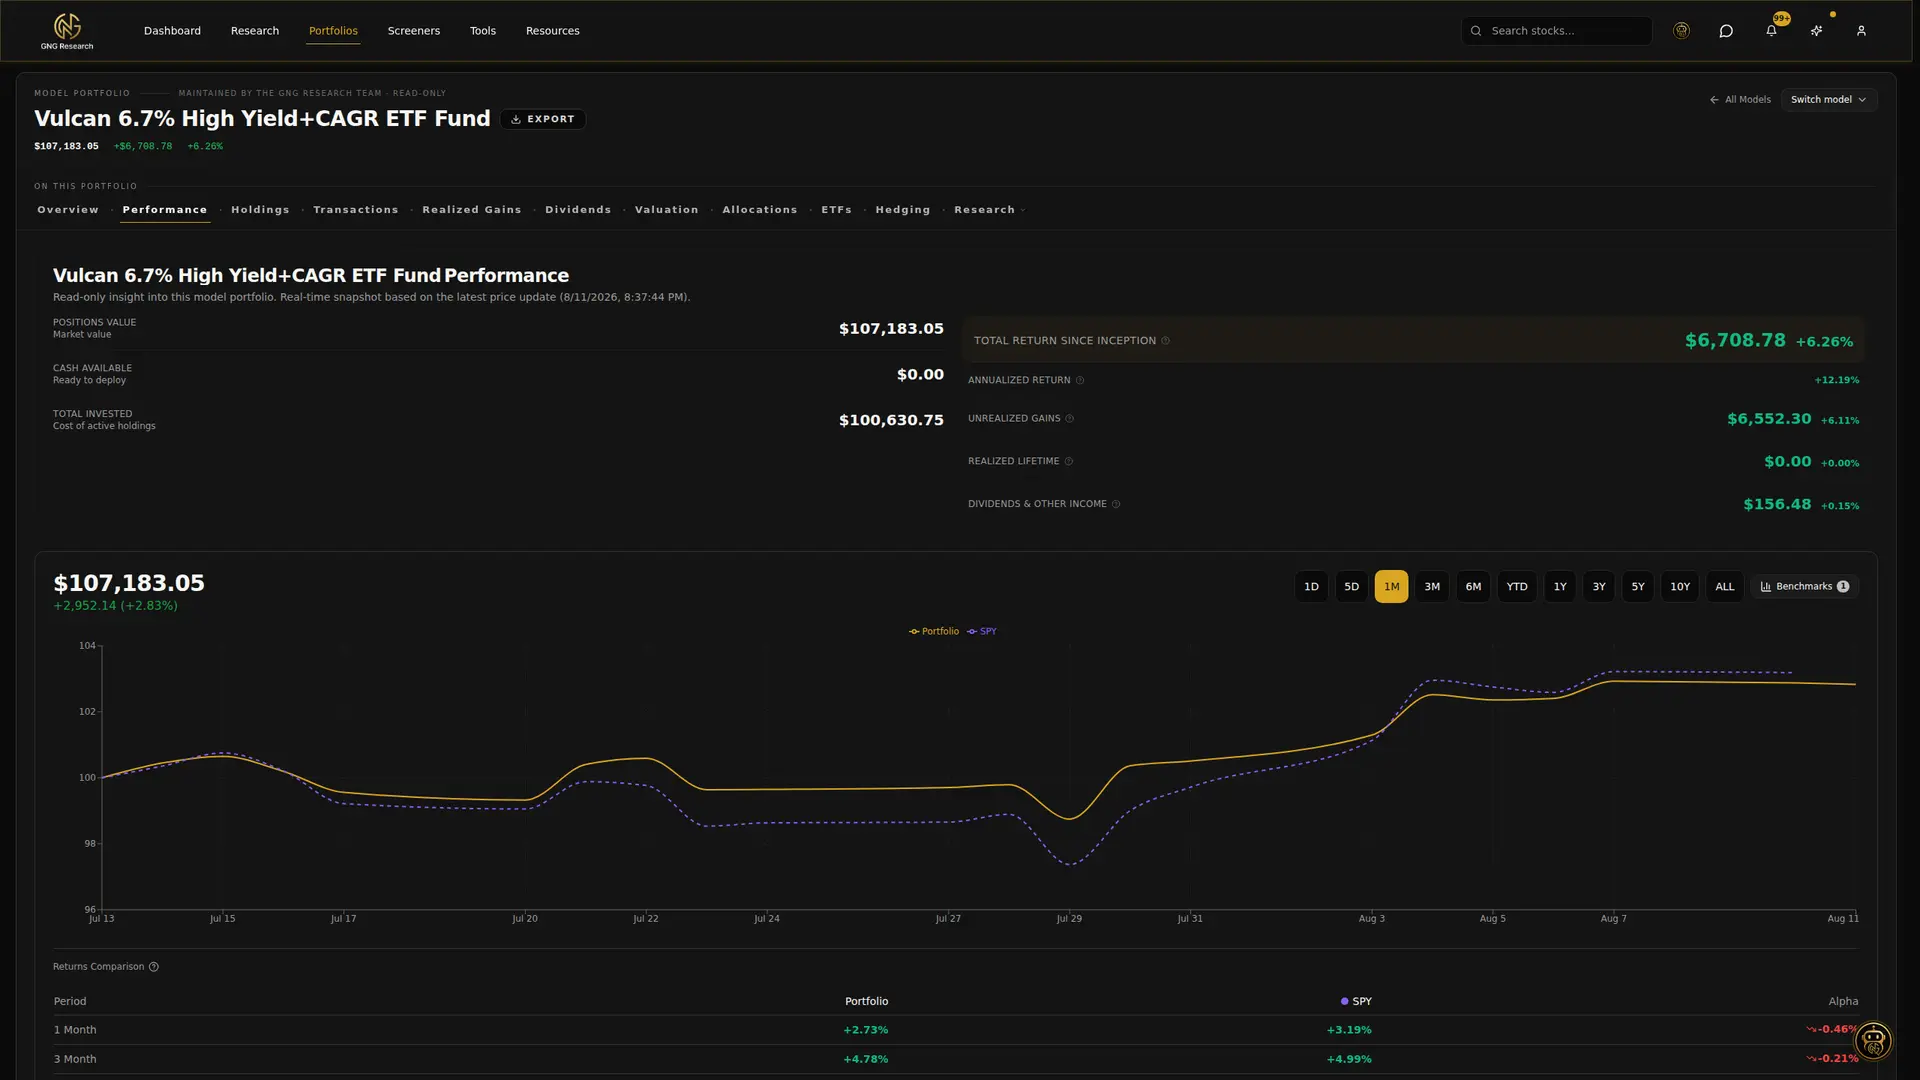
The tracker is a full portfolio workbench: Overview, Performance, Holdings, Transactions, Realized Gains, Dividends, Valuation, Allocations, ETFs, and Hedging, each tab a purpose-built surface on the same live data.
- Performance analytics against a benchmark you choose
- Realized gains tracked per position
- GNG valuation, safety, and quality reads on every holding
- Allocation breakdowns by sector, position, and asset type
- One-click bridge from your holdings into the Research Terminal
A dividend command center
The Dividends tab is a dashboard of its own: projected income, a payment calendar, income concentration, and growth and safety reads on every payer, with per-holding DRIP settings.
Manual or linked, your choice
Build portfolios by hand with full transaction history and CSV import, or link a brokerage account through secure aggregation so positions and balances stay current automatically. A combined view merges every portfolio into one picture.
- Manual portfolios with add, edit, and CSV transaction import
- Brokerage account linking for automatic position monitoring
- Combined view across every portfolio you own
- Curated model portfolios to explore, and collaborator sharing
Monitoring only, never trading
Brokerage linking is read-only account monitoring through secure aggregation. GNG never places trades, never has trading authority, and never takes custody of your assets.
Built for research, not tips
Portfolio analytics connect straight into the rest of the platform: run your holdings through the Research Terminal, the Backtester, or the Dividend Forecaster without re-entering a thing.
Information, not advice
Portfolio analytics are informational tools. Nothing in the tracker is a recommendation to buy or sell any security.
Create a free GNG Research account to get started.
Free to join. No credit card. Takes seconds.