
I had 3 hours of unexpected admin work this morning, so I’m going to prioritize the most important tasks and publish the report with as much high-value information as possible.
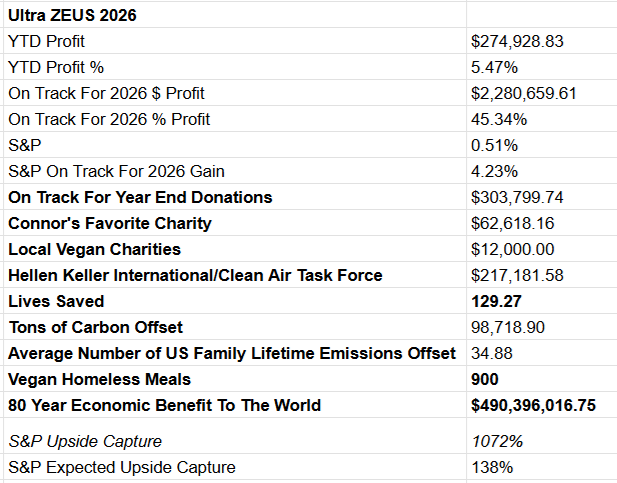
Priority List (from the perspective of the Ultra ZEUS Fund and the company, since 24 people are relying on this fund).
It’s over 1,000, including the charities we support and the 900 homeless people we feed.
AI Boom Update: The Driving Force Behind The US Economy, Corporate Profit Growth, And Stock Market
Every quarter, I wait until the hyper-scalers have reported and analysts have updated estimates for spending in the coming 5 years.
Then I create a summary table of AI age by hyperscalers' revenue, cash flows, capex, R&D spending, total growth spending, buybacks, free cash flow, and free cash flow margins.
Hyperscalers = Meta, Microsoft, Amazon, Alphabet, and Oracle
Last quarter, this was what the summary looked like.
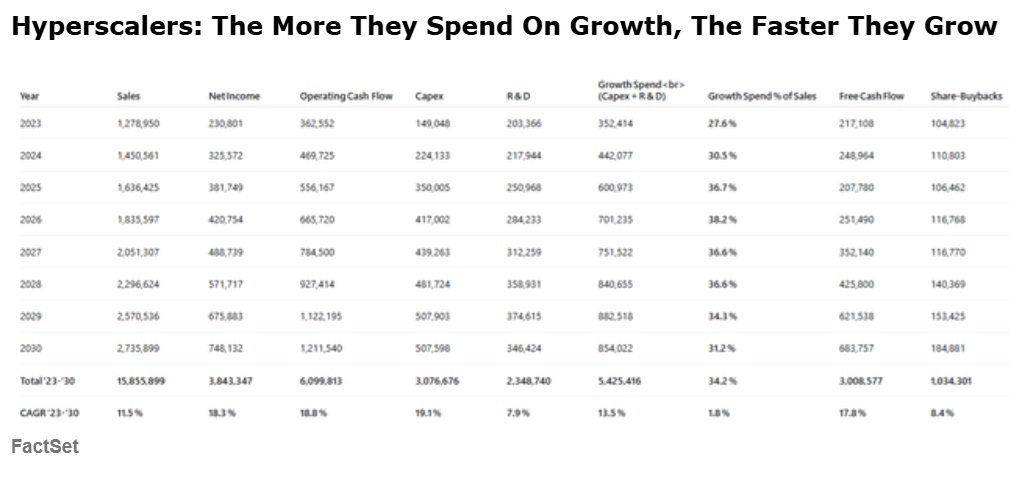
After Q2 2025 Earnings
18% CAGR growth in FCF fueled by 13.5% CAGR growth in $5.4 trillion in spending.
18% CAGR growth in profits and margin expansion.
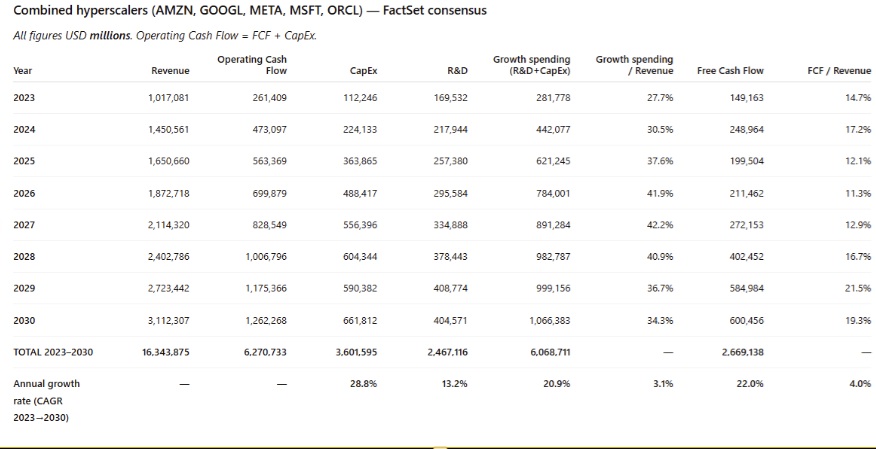
After Q3 2025 Earnings
Spending up to $500 billion to $6.1 trillion and FCF growth rate up to 22% CAGR (absolute, not per share).
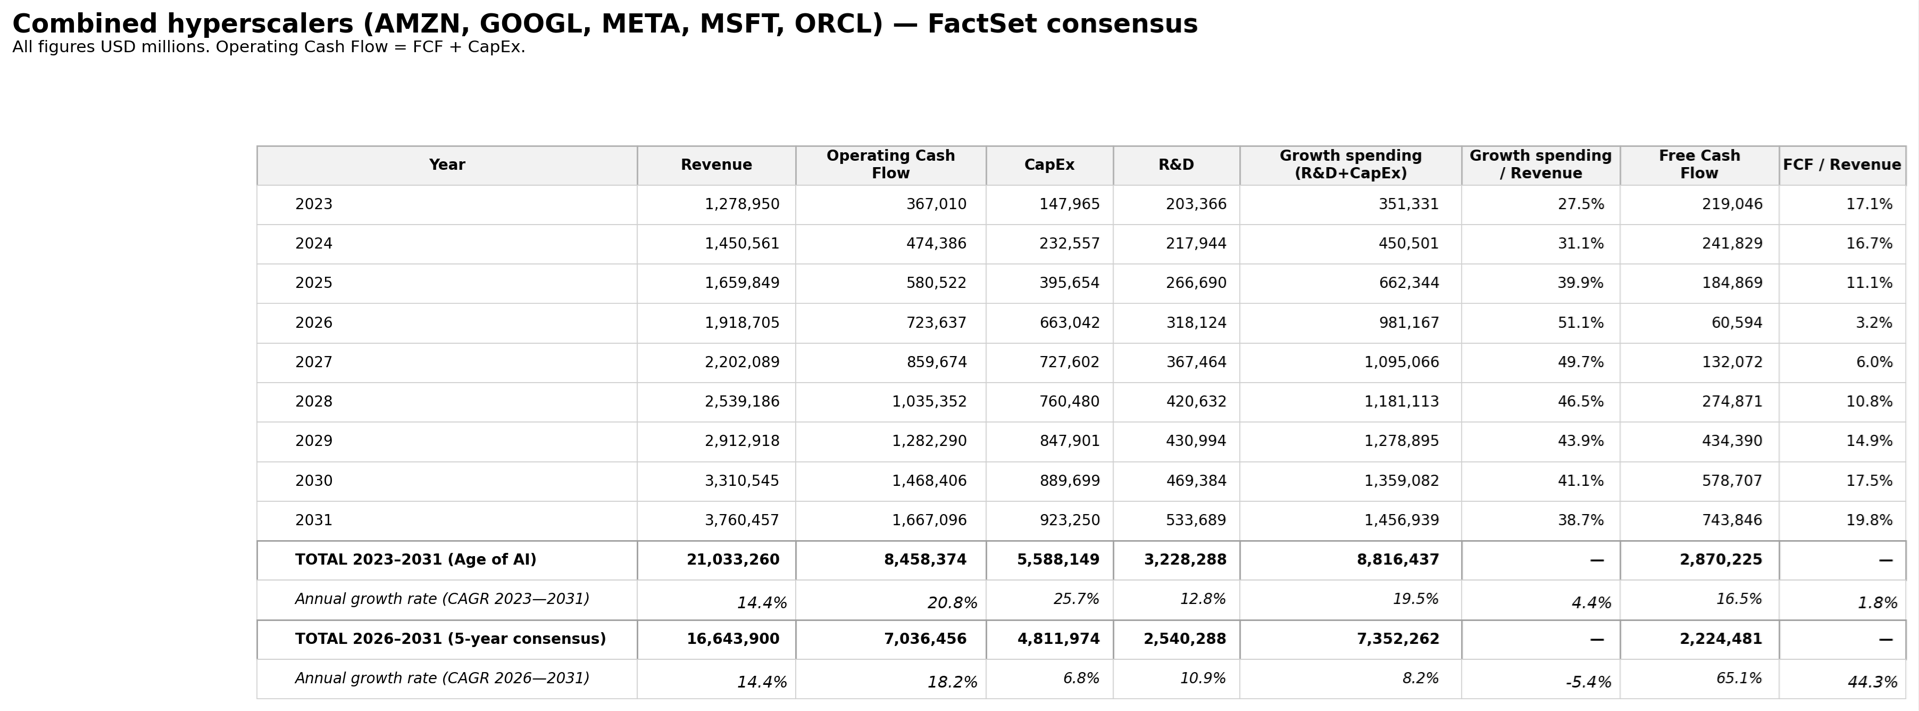
After Q4 2025 Earnings🤯
$7.3 trillion in growth spending over the next 5 years (up from $5.5 trillion then, $6.1 trillion)
16.5% CAGR cumulative FCF growth.
65% CAGR FCF growth over the next 5 years
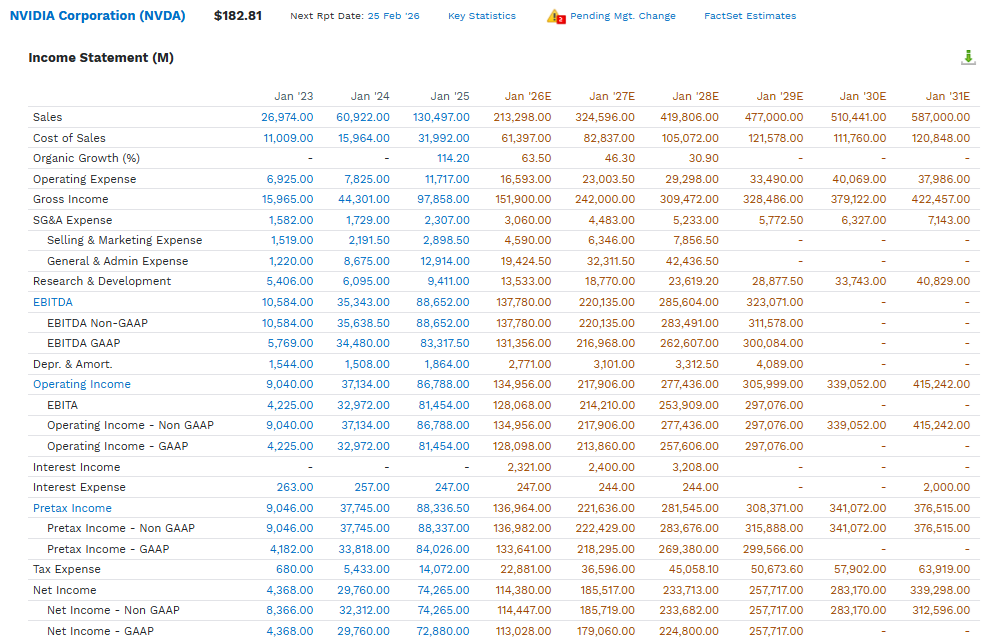
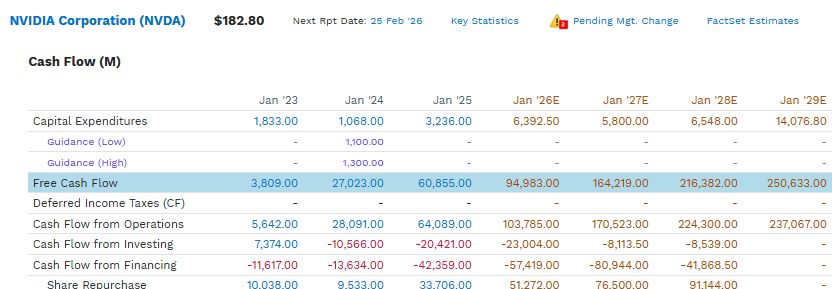
$8.8 trillion in total spending BUT $2.9 trillion in total FCF
This can mean only one thing! 😉😂
Economic Update: What Determines If A Correction Is Deep And The Recovery V-Shaped
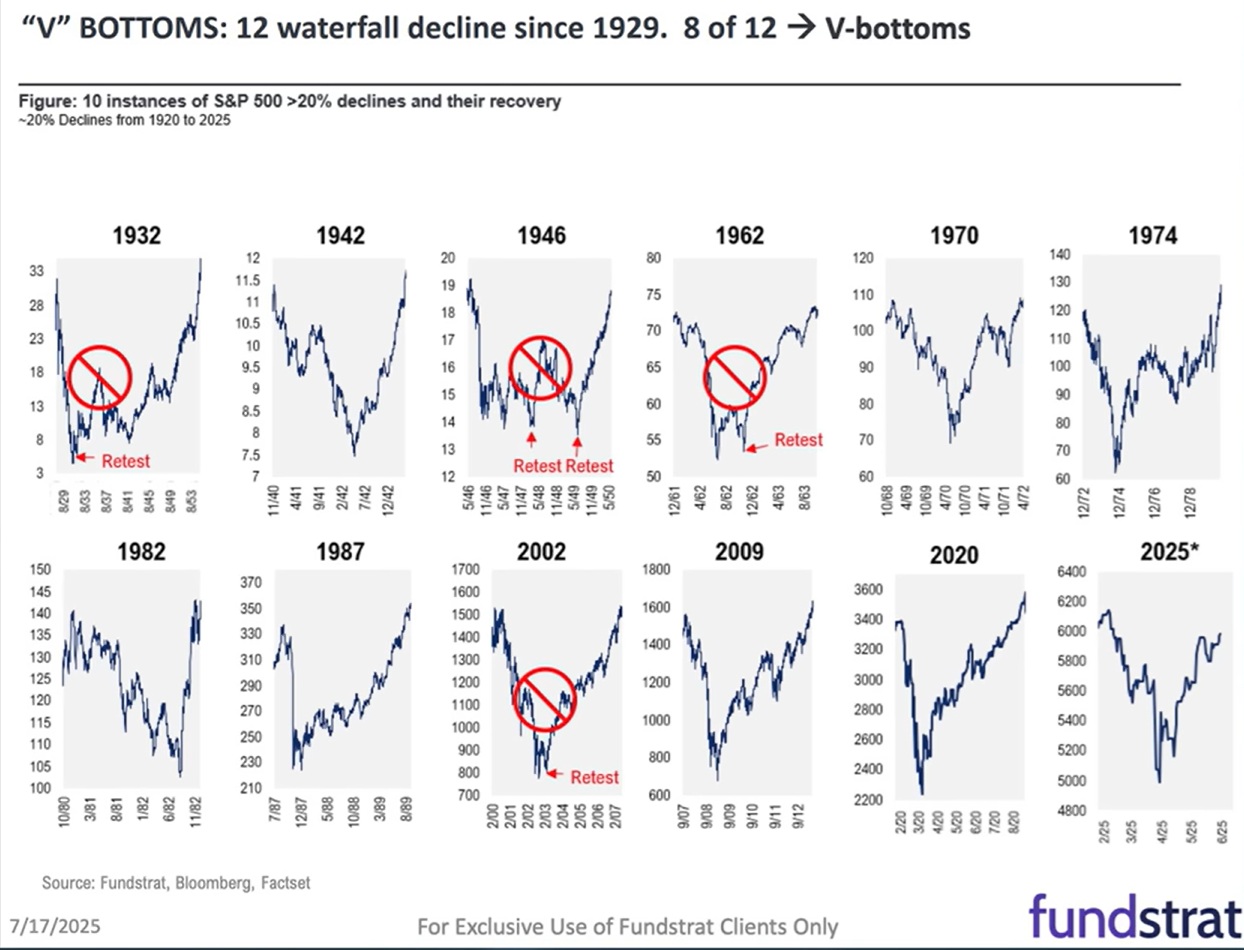
If there is no growth scare (growth sub 2% and declining) then a correction is likely to be 10% to 15% (normal).
If there is a growth scare (sub 2% growth that’s declining) then 15% to 20% bear markets (like April 2025 and Dec 2018) are likely.
But unless GDP growth is negative, the recovery is historically V-shaped.
1.4X to 1.7X duration.
If the peak-to-trough decline is 2 months, then historically, 2 months X 1.55X = 3.1 months from trough to new record high.
2 months following the April 7th lows.
Good News For The Job Market…Kind Of
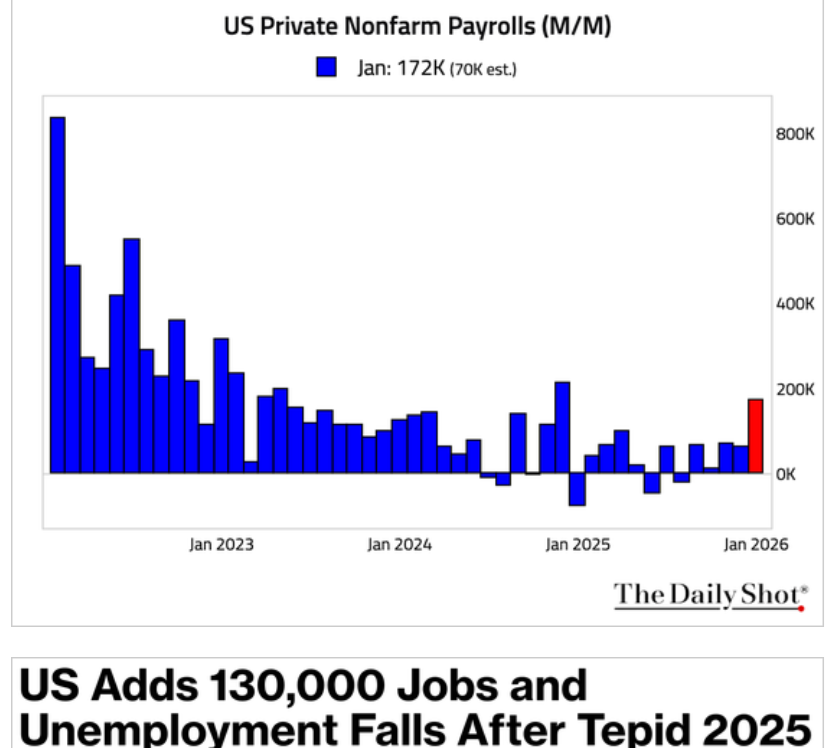
There MIGHT be some signs of a recovery in the job market…BUT every month brings downward revisions.
Also, 2025 was the worst year for job growth since 2023.
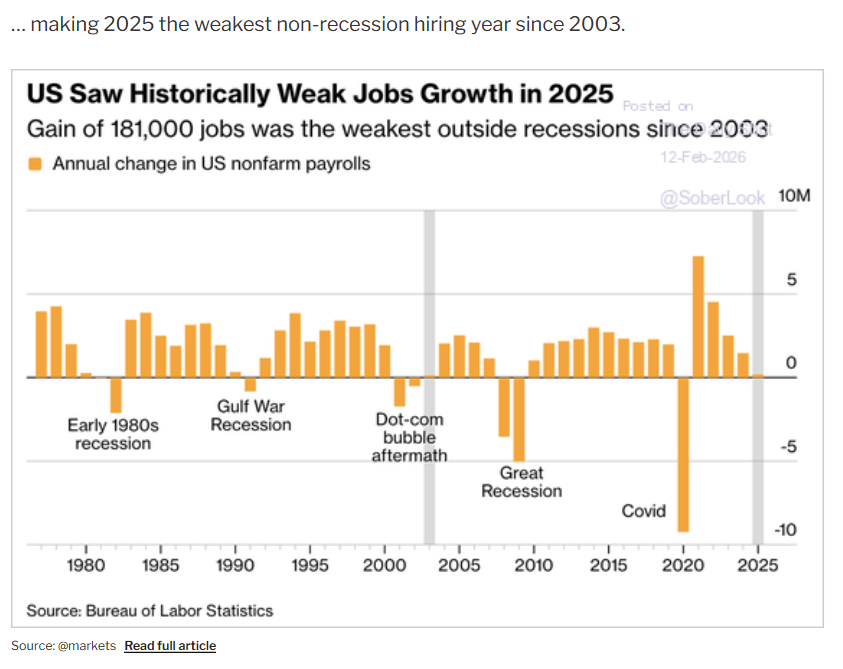
The job weakness was caused by the tariffs, specifically weakening small business confidence (small businesses = 80% of job openings and 66% of new jobs).
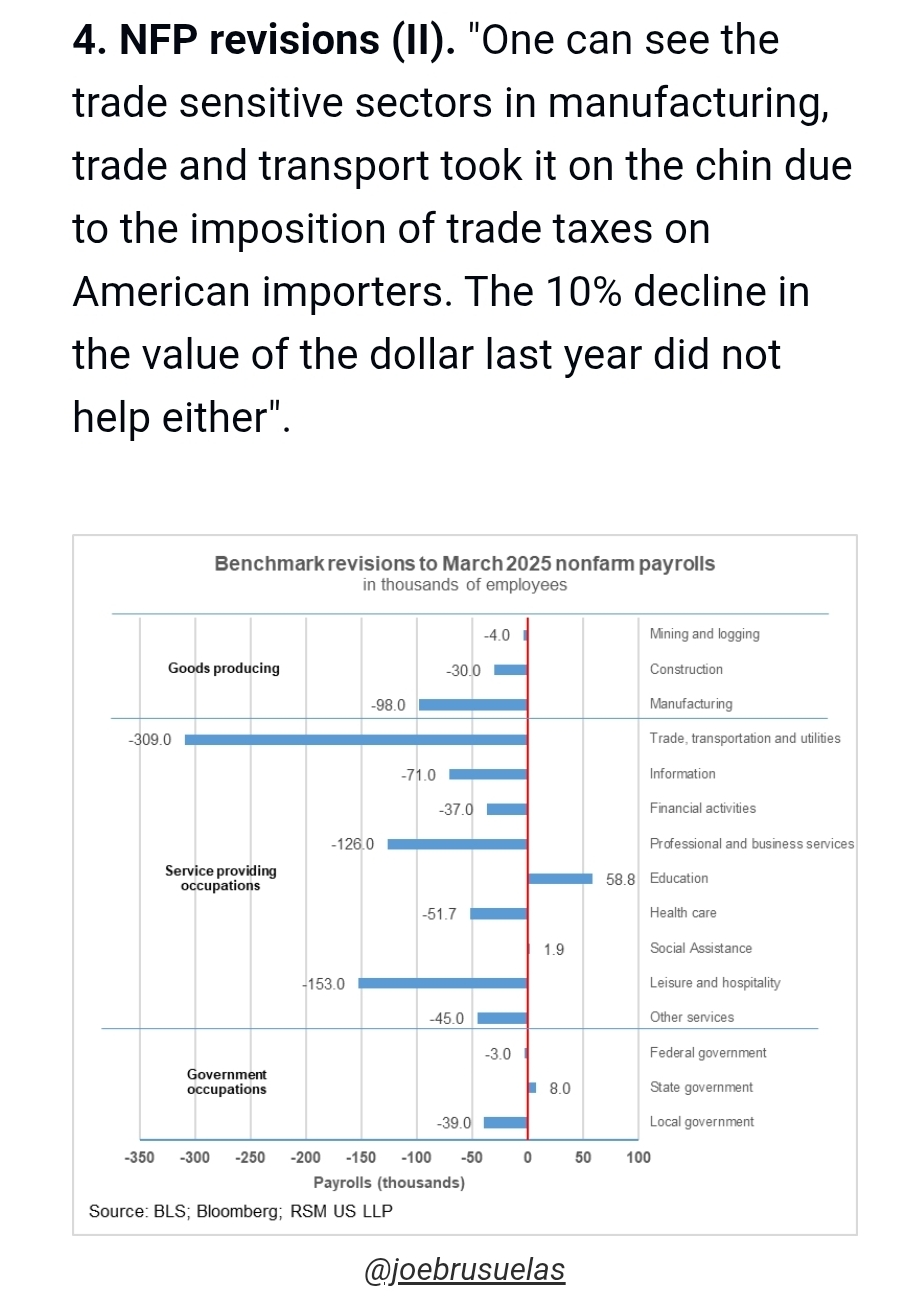
Manufacturing & Transportation Most Hurt By Tariffs.
Because You Can’t Make Stuff Without Importing Other Stuff
OK, so what about the overall economy?
The Good News!

The economy is growing at a strong rate.
WOW! Economists are racing to catch up to reality😉
“Cover your ass” pearl clutching hearding behavior😂
Be honest and stop pretending 1.8% growth is always base-case…Since 2021, 3.3% average growth and 3.4% median growth.
American Growth is back to average since 1913 (3.0%).
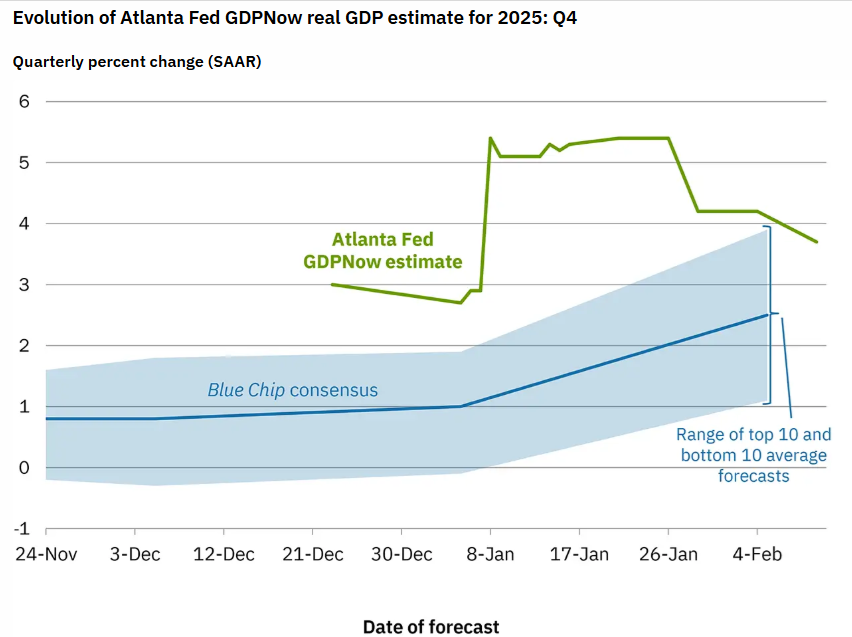
OK, but the Atlanta Fed is a volatile model, sometimes swinging by as much as 1% or more instantly.
Also, due to the shutdown, the Q4 GDP number will be released on Friday, Feb 20th. At which point Atlanta Fed can start forecasting Q1 growth (which comes out at the end of April)
Weekly Economic Index: The Gold Standard of Real-Time Economic Growth Estimates
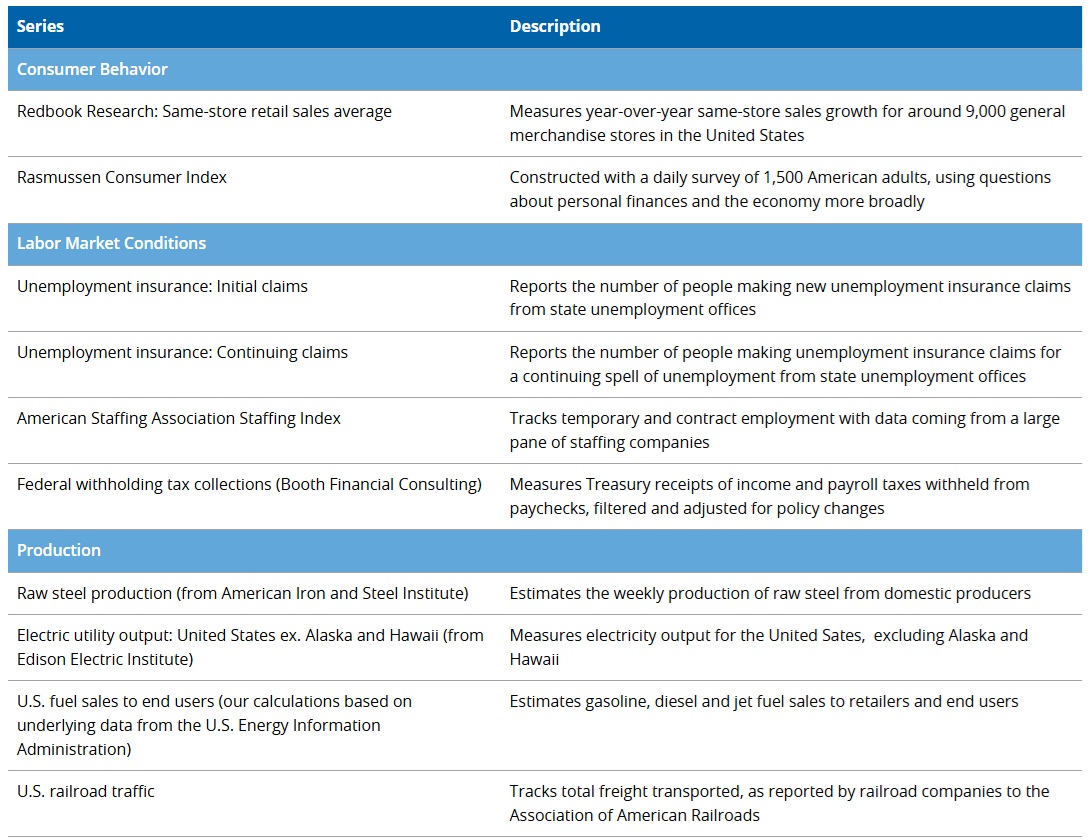
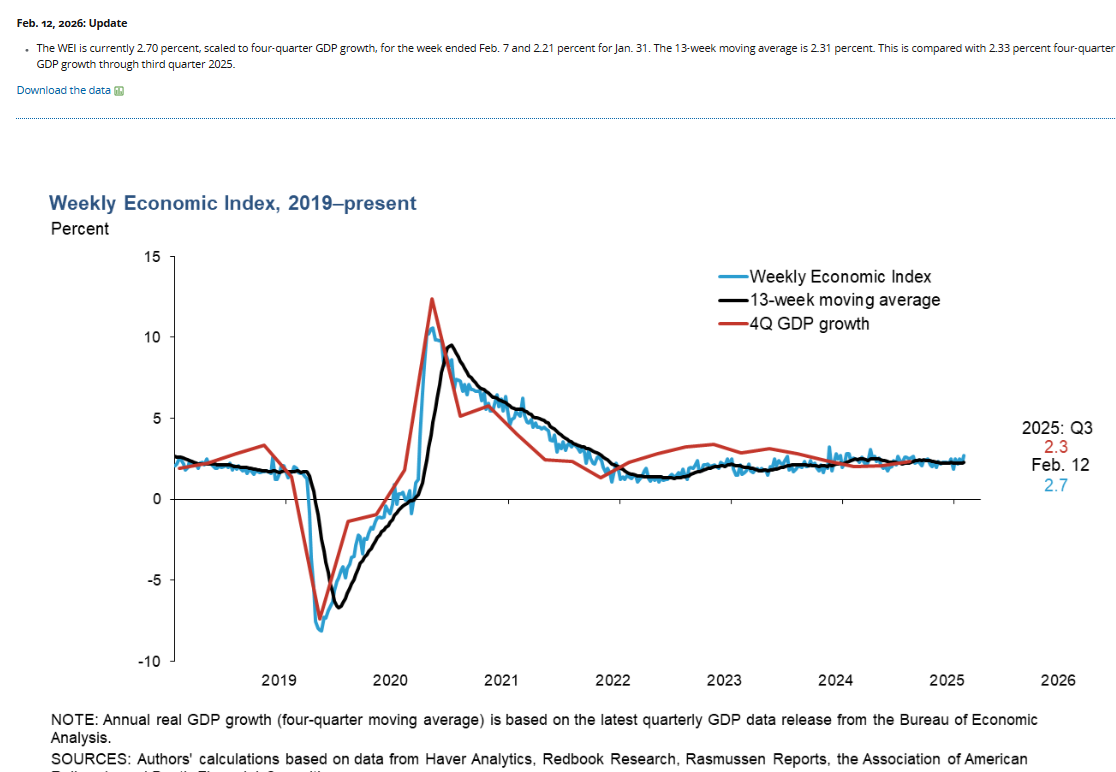
I love how the Dallas Fed’s model is 100% based on hard data on daily and weekly time series, but only on direct economic inputs.
There is no “vibes” in this model; it’s stone-cold economic inputs.
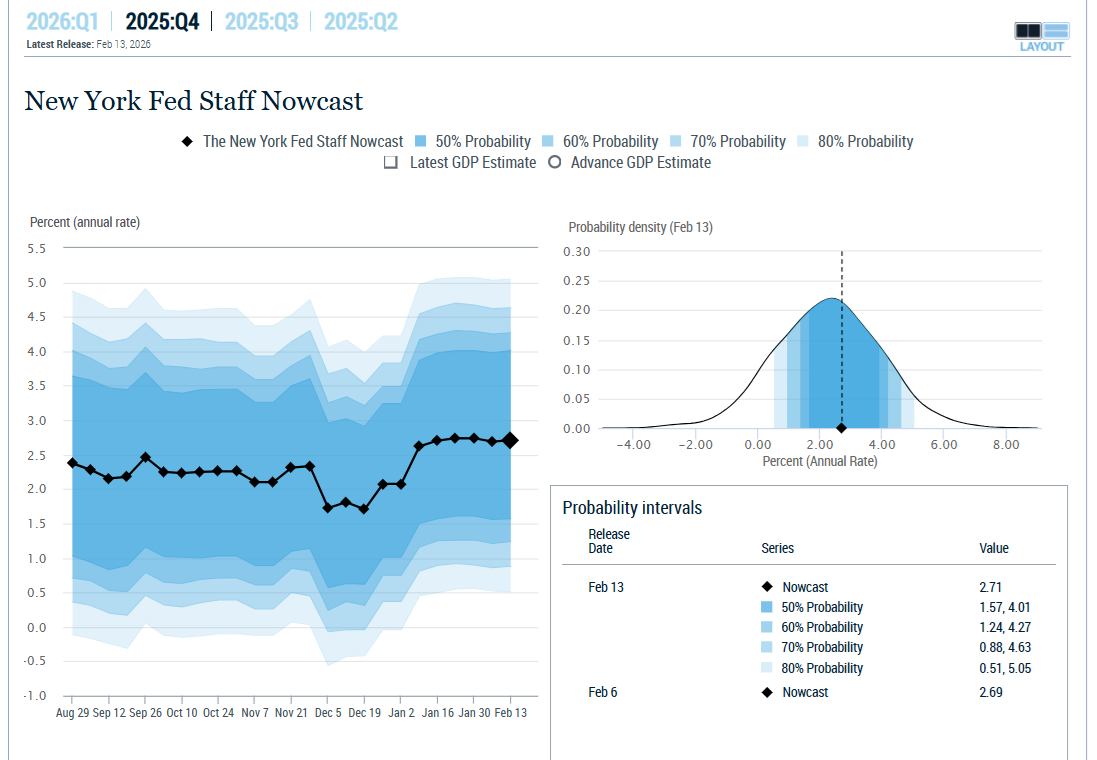
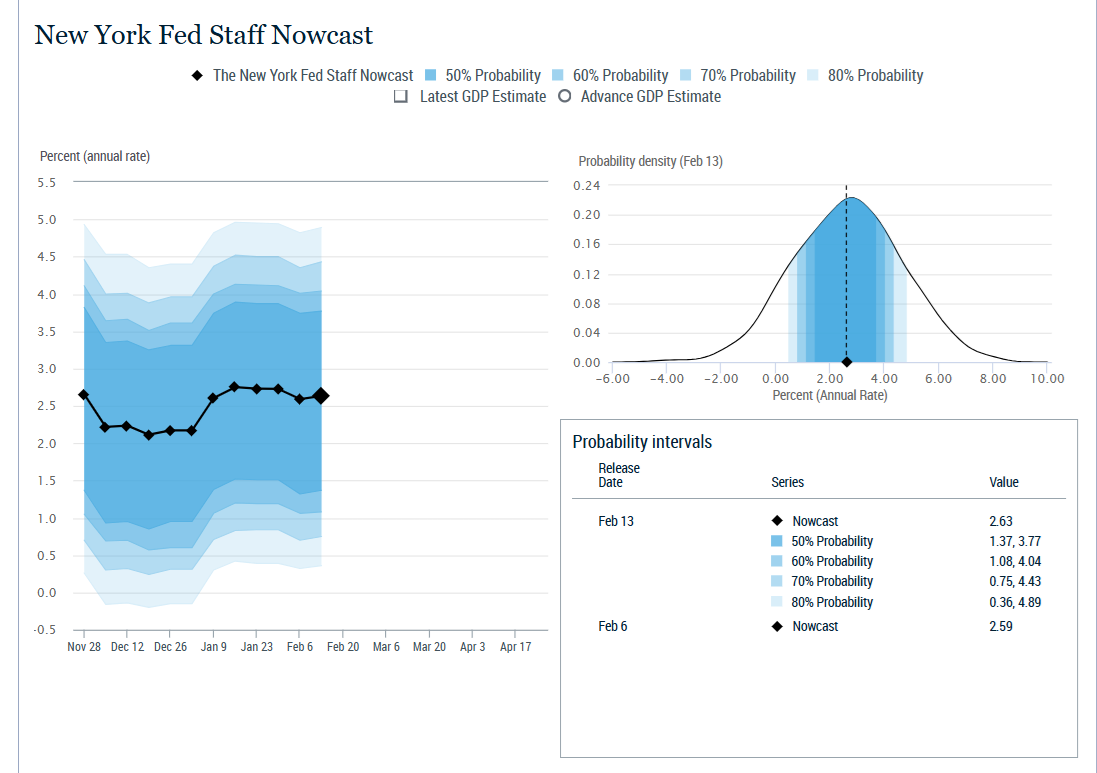
NY Fed confirms what the Dallas Fed is saying: Q4 economic growth is NOT weak.
95% of shutdown damage is reversed when the government reopens due to back pay.
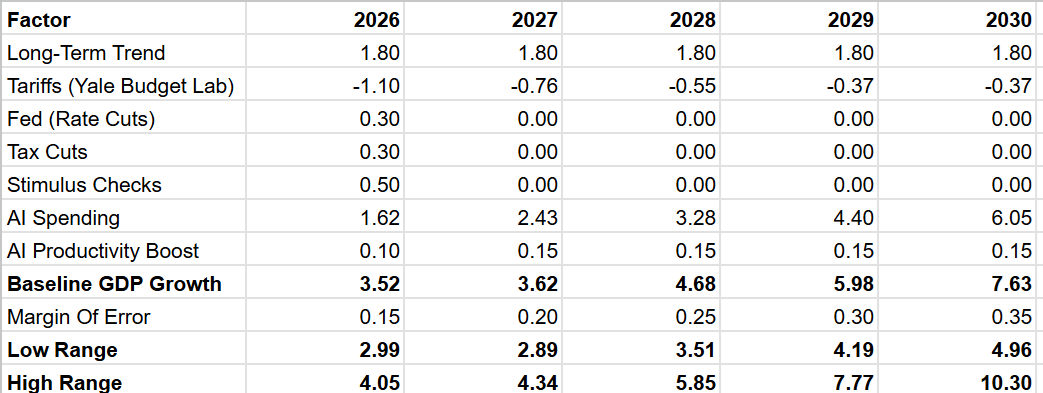
GNG’s Economic Model
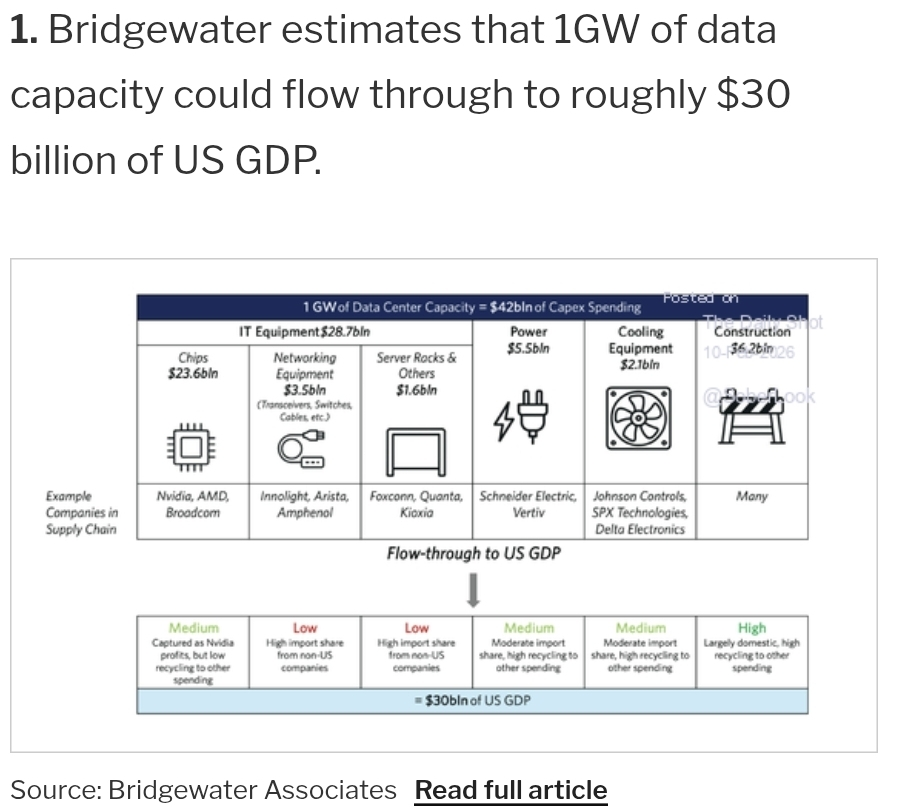
According to Bridgewater, the world’s largest hedge fund manager, 72% of AI spending flows into the economy, with the other 28% crowding out other areas of growth.
Microsoft is hiring electricians and carpenters at $200K per year for 4-year contracts.
Those people can’t build homes because they are building data centers.
So, making that adjustment to our economic model.
AI Spending = Boom Times Ahead
*NOT all Americans will prosper
**Even those that do MIGHT (probably) be miserable


*20% of Finns are on antidepressants, and 45% are anxious. Finland is the most satisfied nation on earth, but not the happiest (that would be Costa Rica).
Market Valuations: PEGY & Morningstar DCF Update
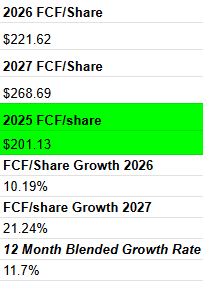
FCF growth in 2026 has been cut in half. Because of the hyper-scalers’ mega-spending (and still generating $60 billion in FCF).
For context, according to Bank of America, the profits generated for the S&P by the spending of the bottom 20% = $52 billion.
In Mega spend mode, the 5 hyperscalers generate more free cash flow than the $5 trillion in spending by America’s poorest people (67 million).
NOT saying this is a good thing, putting in context so you know why the stock market isn’t worried about “bad vibes” or rising stress among the bottom 50% of Americans.
Welcome to the Age of AI: First 5 Year Streak Of Double-Digit Growth In US History
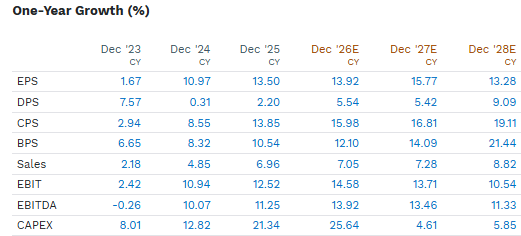
Capex growth of 20+% in 2025 and 2026...do you REALLY think it's going to collapse in 2027 and 2028?😉
Big tech is addicted to big growth spending, because it boosts growth...and they are growth stocks! Their job is growth.
Nasdaq Growth Rates In The Age Of AI
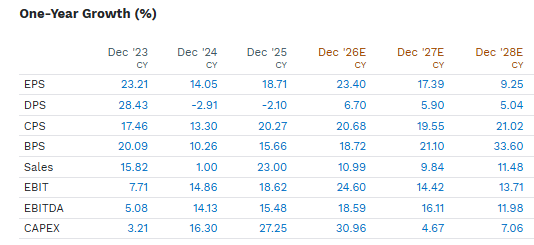
Look at the Cash Flow Growth Rate (CPS)
Morningstar Discounted Cash Flow Valuation Analysis
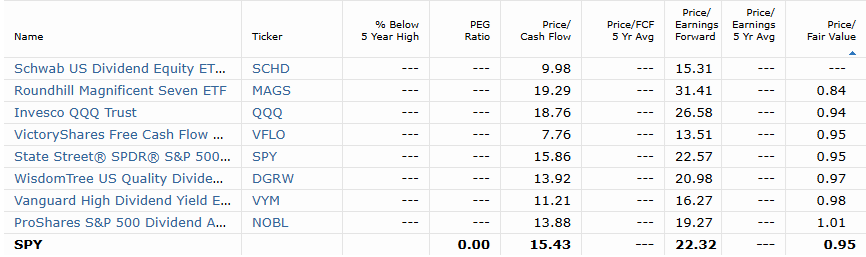
Mag 7 is so beaten down lately and growing so quickly that Morningstar estimates aa 16% discount while the Nasdaq is 6% undervalued, and the S&P is 5% undervalued.
Where’s the bubble? It’s everyone…except if you adjust for faster growth rates.
S&P PEGY Analysis
16.51% CAGR FCF/Share Growth From 2025-2028 vs 5.5% Historical Means Stocks Are NOT Overvalued
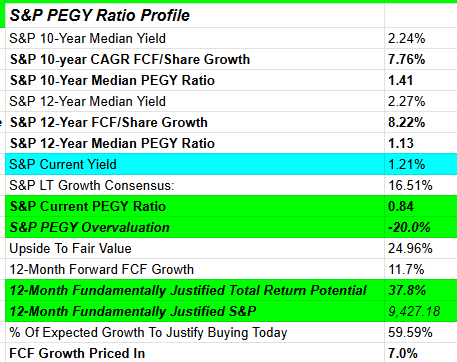
FCF/share growth that is 3X stronger than normal...and continues to accelerate year after year due to higher growth spending.

Other Important Stuff
I was hoping to run Monte Carlo Simulations on the S&P, Nasdaq, and Nvidia, over various time periods, and put together a table that shows the most likely outcomes for the next year. But alas, 3 hours of admin means that I have time for a handful of other important (though less interesting to most) stuff, like inflation, interest rates, and Q4 earnings results.
Real Time Inflation
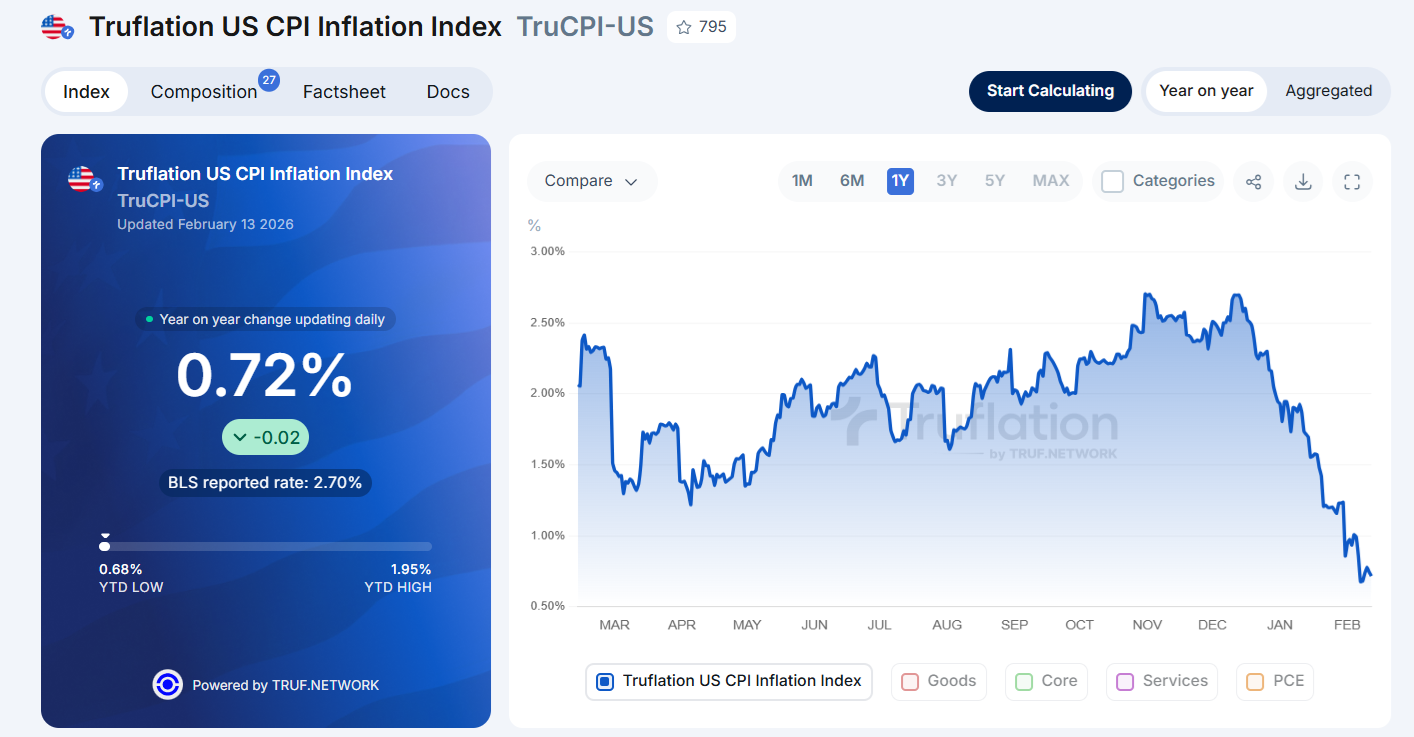
Inflation is beaten; it was beaten 2 years ago and is now running 3% below wage growth.
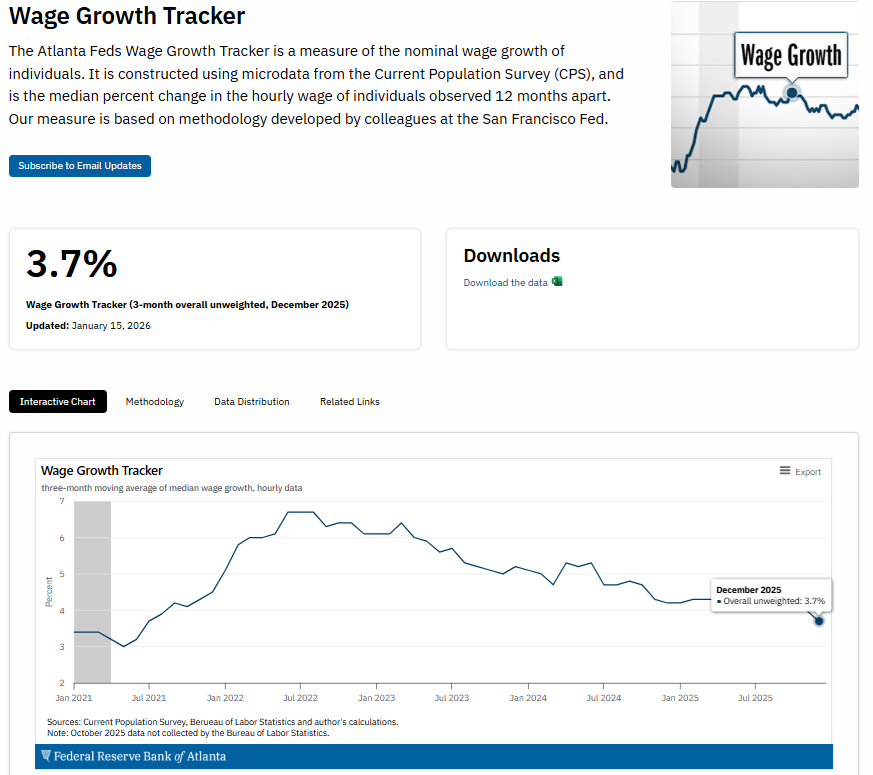
Real wages are 3.7% minus 0.7% inflation = 3% vs 2.3% during the “golden age” of 1945 to 1979.
Interest Rates: * Now that American GDP growth is back to normal, interest rates don’t actually matter, but 12 years of ZIRP taught everyone that they do, so here you go😉😂🤣
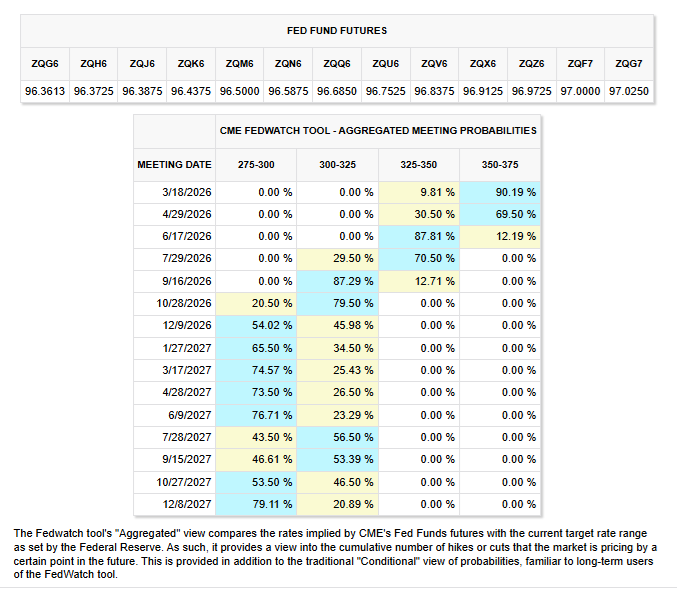
The bond market is not quite sure if the Fed will end at 2.75% to 3% or 3% to 3.25%.
Fed estimates 0% to 1% inflation-adjusted rate = neutral based on 0.4% historical average since 1929 and 0% to 1% range since 1913.
The actual inflation-adjusted rate is currently 2.9%.
It peaked around 3% in 2024 before the Fed began cutting rates in September.
Are rates too tight? Objectively? If you use real-time data that doesn’t depend on owner equivalent rent that lags by 18 months? Absolutely.
Does that hurt small businesses who actually create the majority of jobs? Without question.
Does that make the job market weaker and hurt the wage growth of new workers, creating slower family formation, dropping birth rates, and making the future workforce smaller (hurting growth by $100 billion this year, according to the WSJ)?
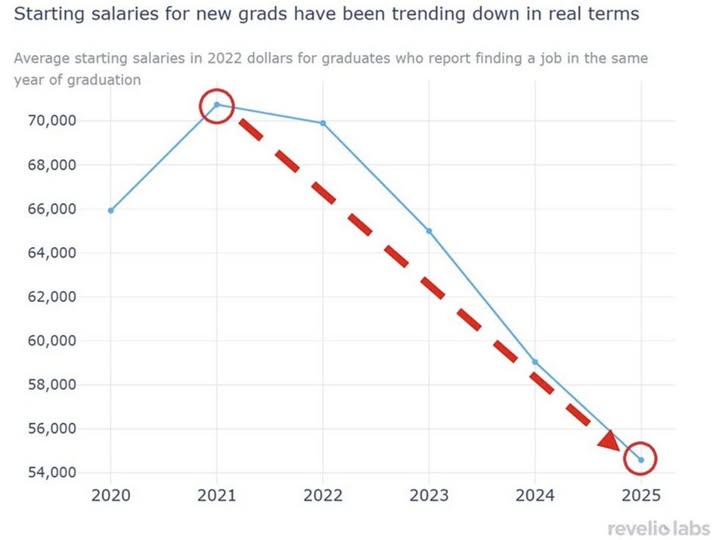
But does Wall Street care?
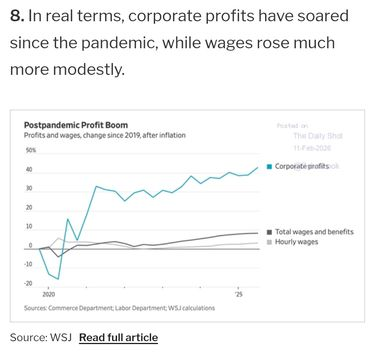
Wall Street cares about earnings, and specifically long-term cash flow, and those are growing at double-digits, accelerating, and as long as growth spending keeps rising, growth rates will likely also stay strong (or get stronger).
75% of consumer spending = retirees, and the top 20% of income earners (who own 95% of the stocks).
50% of the US economy is now disconnected (directly) from the job market.
Explaining why retail spending remains so strong despite the weak job market.
Q4 2025 EPS Update
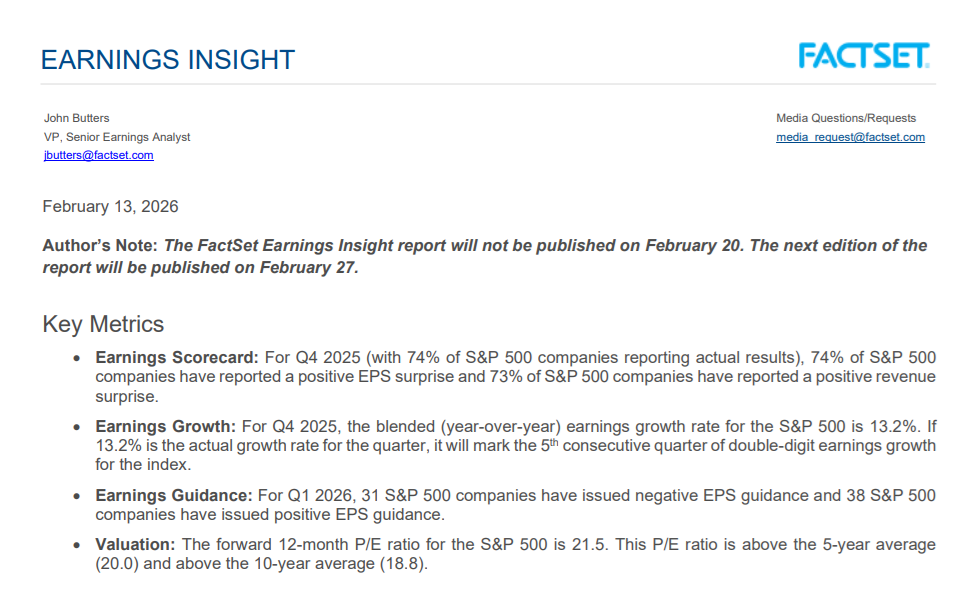
A good quarter, but most importantly, it’s a fundamentally healthier quarter. Not just financial engineering, not just buyback driven.
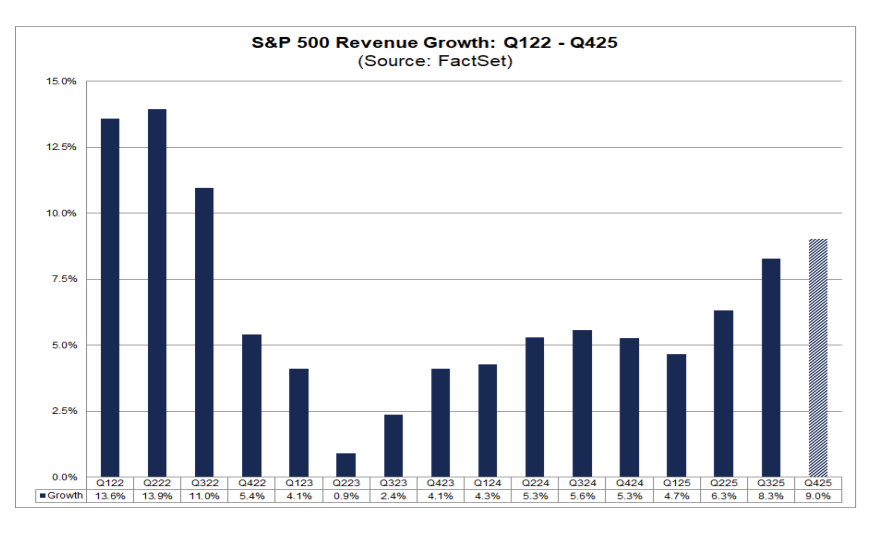
Sales are thriving, as large US companies figure out how to maximize revenue, markets, and growth in the age of AI.
The inflation point is Tech earnings week
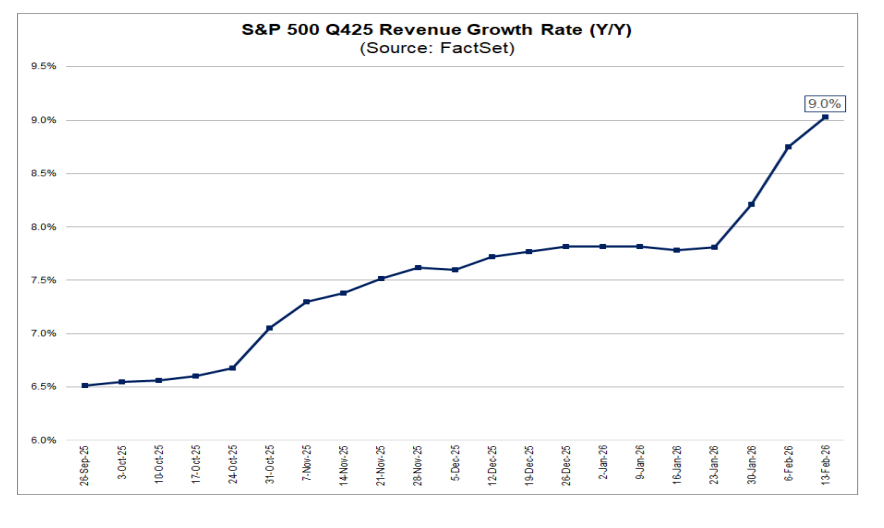
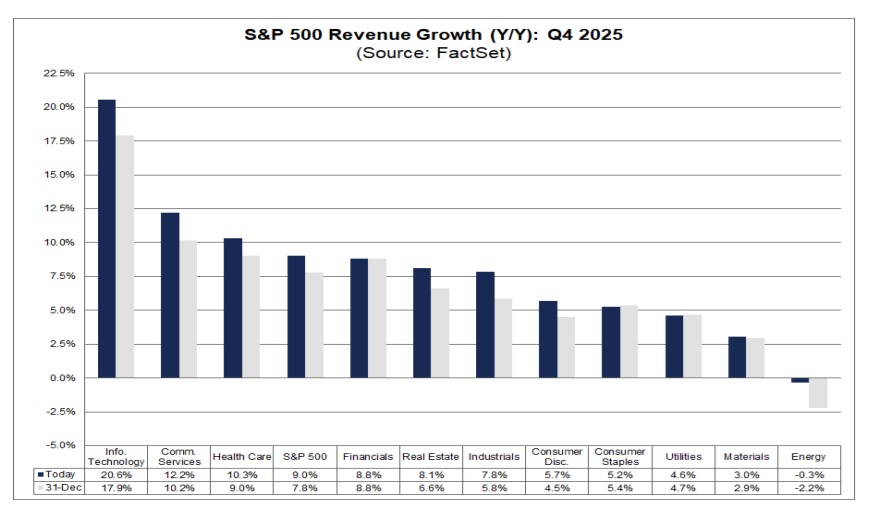
Big tech and healthcare are killing it, with everyone but energy companies reporting inflation-beating sales growth.
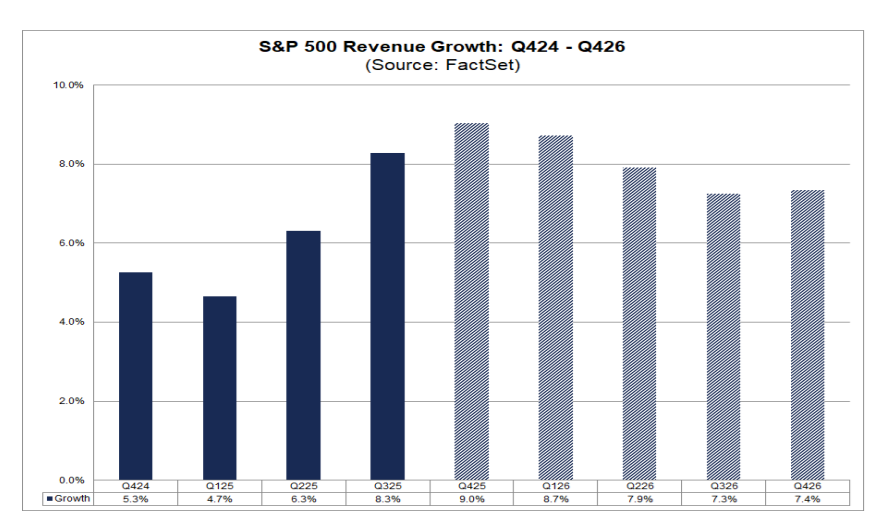
Nominal GDP (GDP + Inflation) is running 3.4% in real time. Anything above that indicates organic growth in sales, and strong sales is expected to continue.
This isn’t the 2010s when low rates were the only thing exciting investors.
Now we have REAL sales, REAL earnings, and REAL growth.
That is a REAL reason to be excited about US stocks.
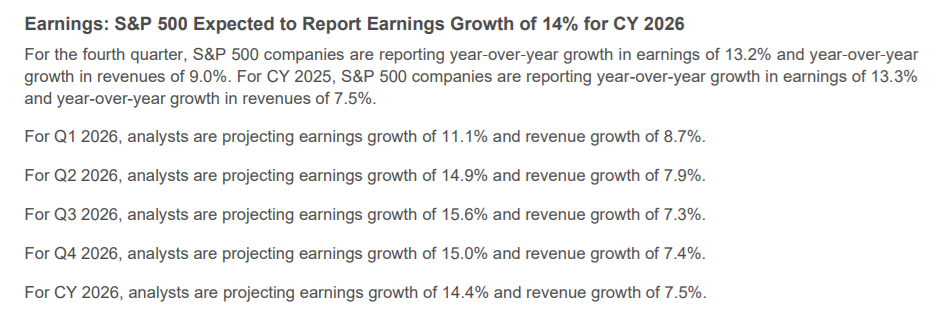
Bottom Line: Healthy Sales Growth, Healthy Margin Expansion, Accelerating Earnings, Even Stronger Cash Flow Growth, and the AI Boom Just Keep Getting Boomier🥳
Have a great weekend, everyone!
Sign in to leave a comment and join the discussion.
Sign Up Free