


Too Long Didn’t Read (For Those Lazy Bastards Who Can’t Even Be Bothered to Read 8 Bullet Points, We Still Love You)😉🤔😂🤗
FIRST, THE PART THE BLOOD-SUCKING LAWYERS MADE ME SAY 🙄
This is an economic update on what businesses are actually spending on AI, based on Ramp's payments data, and what it means for the demand thesis behind ZEUS's growth bucket — and for the Anthropic S-1 we're about to spend a week (maybe more) inside. It's research. It is not a recommendation for your account. GNG publishes analysis; GNG doesn't manage your money. Every number is sourced so you can check my work... which is the entire point of this place 😉
KIDS, IN THE FALL OF 2026, THE MOST ANTICIPATED S-1 SINCE SPACEX WAS ABOUT TO DROP...
...and before we read it the way we read SpaceX's — every footnote, every risk factor, every line of the cap table, with the intensity of three rabbis arguing over one comma 😂…or how my AI team and I spent 12 hours watching and debating the moral lessons of Moana😂 — I wanted to answer the question that comes BEFORE the S-1. The question every AI valuation depends on. The question that decides whether Anthropic's revenue is a rocket or a bubble.
Are businesses actually spending more on AI? Not "adopting." Not "experimenting." SPENDING. More. Every year.
Because here's the thing about an S-1: it tells you what ONE company made. It doesn't tell you whether the customers will keep paying. For that, you need the customers' receipts. And in September, Ramp — which processes corporate cards and bill-pay for over 70,000 U.S. businesses — released its full AI Index export: monthly adoption and spend through August, and a weekly token panel through September 20. Not a survey. Not what executives SAY. What they PAID 🤯
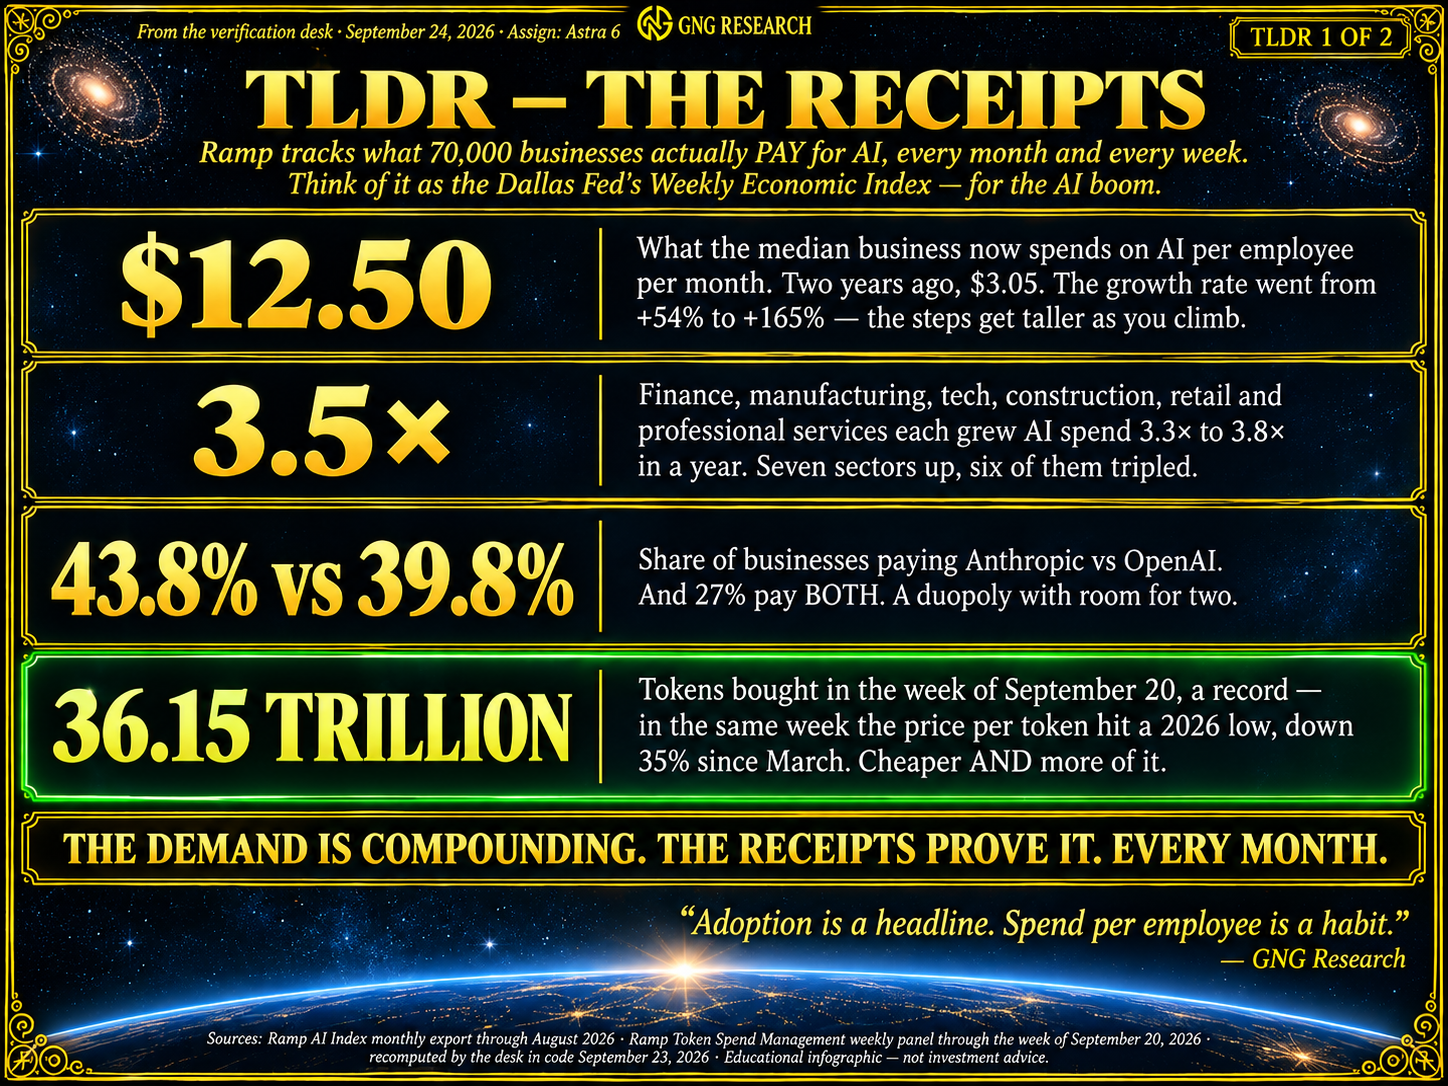
I handed every row to the desk. Here's what came back. The median company spends $12.50 per employee per month on AI. A year ago, $4.71. Two years ago, $3.05. The growth rate didn't just hold — it went from +54% to +165%. Nine months in a row of gains. Every sector with a year of history is up at least 1.8x. The biggest companies are accelerating fastest. And the week the data closed, businesses bought more tokens than in any week ever recorded 🥳
Carl Sagan said the cosmos is knowable — that the answer to "is it real?" is never a feeling; it's a measurement. This is the measurement. Seventy thousand businesses, two years, actual money. So when the S-1 lands and the risk-factors section says "demand for AI services may not continue to grow" — because every S-1 says that — you'll already know what the receipts say 🤔😉
THEY'RE SPENDING MORE. A LOT MORE 🤯
Are businesses spending steadily more on AI? Yes. And faster than a year ago.
That's the whole answer. The rest of this report is the receipts.
In one paragraph: adoption — the share of businesses paying for AI at all — is 56.1%, up 11 points in a year, and maturing the way every S-curve does past its midpoint. Intensity — how much each business spends per employee — is up 165%, accelerating, nine straight months. The price of a token is down 35% since March, and the number of tokens bought last week was a record 36 trillion. The newest, most expensive model on the market became the #1 model by spending in three weeks. And the frontier tier — the priciest models — just took the largest share of dollars ever recorded.
Demand is compounding. The labs are competing for it. And every dollar of it runs on the compute that ZEUS's growth bucket owns 😉
PART 1: $3 → $5 → $12.50. THE STAIRCASE WHERE THE STEPS GET TALLER 😉
Let me show you the single most important number in the report, and then explain why the SECOND most important number is the growth rate of the first.
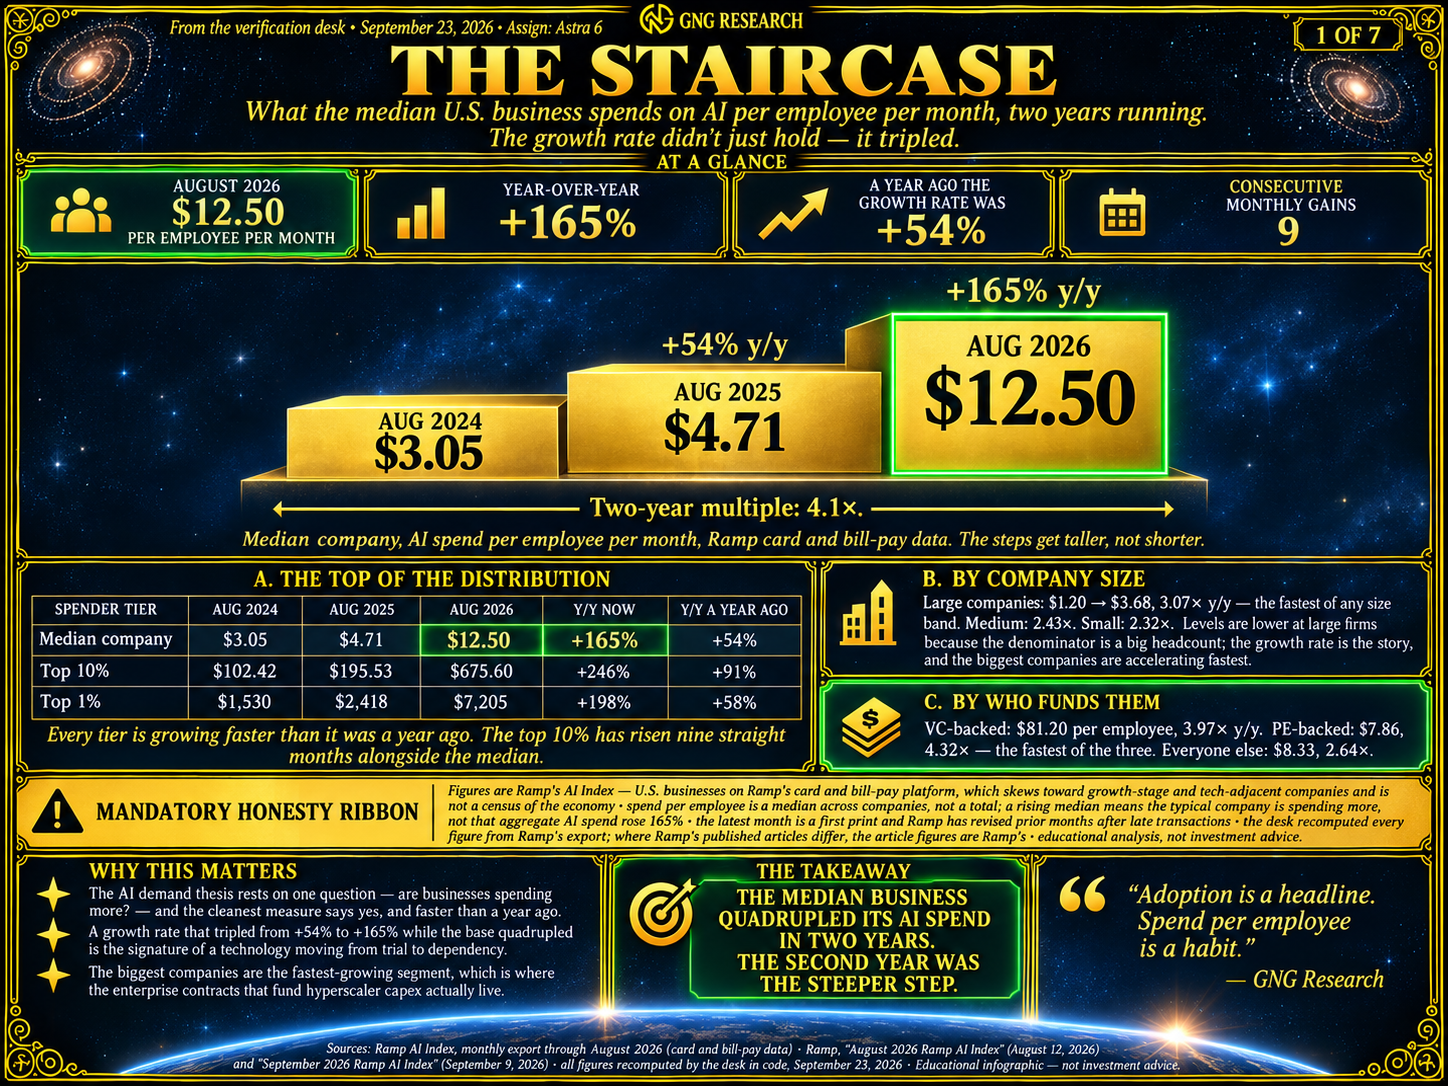
Median AI spend per employee per month for U.S. businesses on Ramp: August 2024, $3.05. August 2025: $4.71. August 2026: $12.50. Two-year multiple: 4.1x. And the growth RATE — the thing that tells you whether a trend is maturing or accelerating — went from +54% in the first year to +165% in the second. The steps get taller as you climb 🥳
It isn't a one-month print, either. The median has risen nine consecutive months, December through August. So has the top 10% of spenders, which sits at $675.60 per employee, up 246%. The top 1% is at $7,205, up 198%. Every tier is growing faster than it did a year ago.
Now slice it by company size, because this is where it gets interesting for anyone who owns hyperscalers — or is about to read an S-1 from a company that sells to them. Large companies went from $1.20 to $3.68 per employee — 3.07x, the fastest of any size band. The dollar level is lower because you're dividing a big bill by a big headcount, so ignore the level and watch the multiple: the biggest companies, the ones that sign the enterprise contracts that fund the data centers, are the fastest-accelerating segment. Medium companies, 2.43x. Small, 2.32x. And by who funds them: PE-backed businesses at 4.32x, the fastest of all — private-equity owners, whose entire job is squeezing efficiency out of a portfolio company, are the most aggressive AI spenders in the dataset 🤔
Sorry, Ed Zitron and Michael Burry, every month brings more evidence of your wrongness. But admitting the facts have changed is not just wisdom; it's bravery!
I promise not to be a dick when you admit you were wrong😂
PART 2: FEWER NEW CUSTOMERS? SURE. EXISTING CUSTOMERS SPENDING 2.65X MORE? THAT'S THE WHOLE GAME 🤔
Two lines, one chart, and the most important shape in the report.
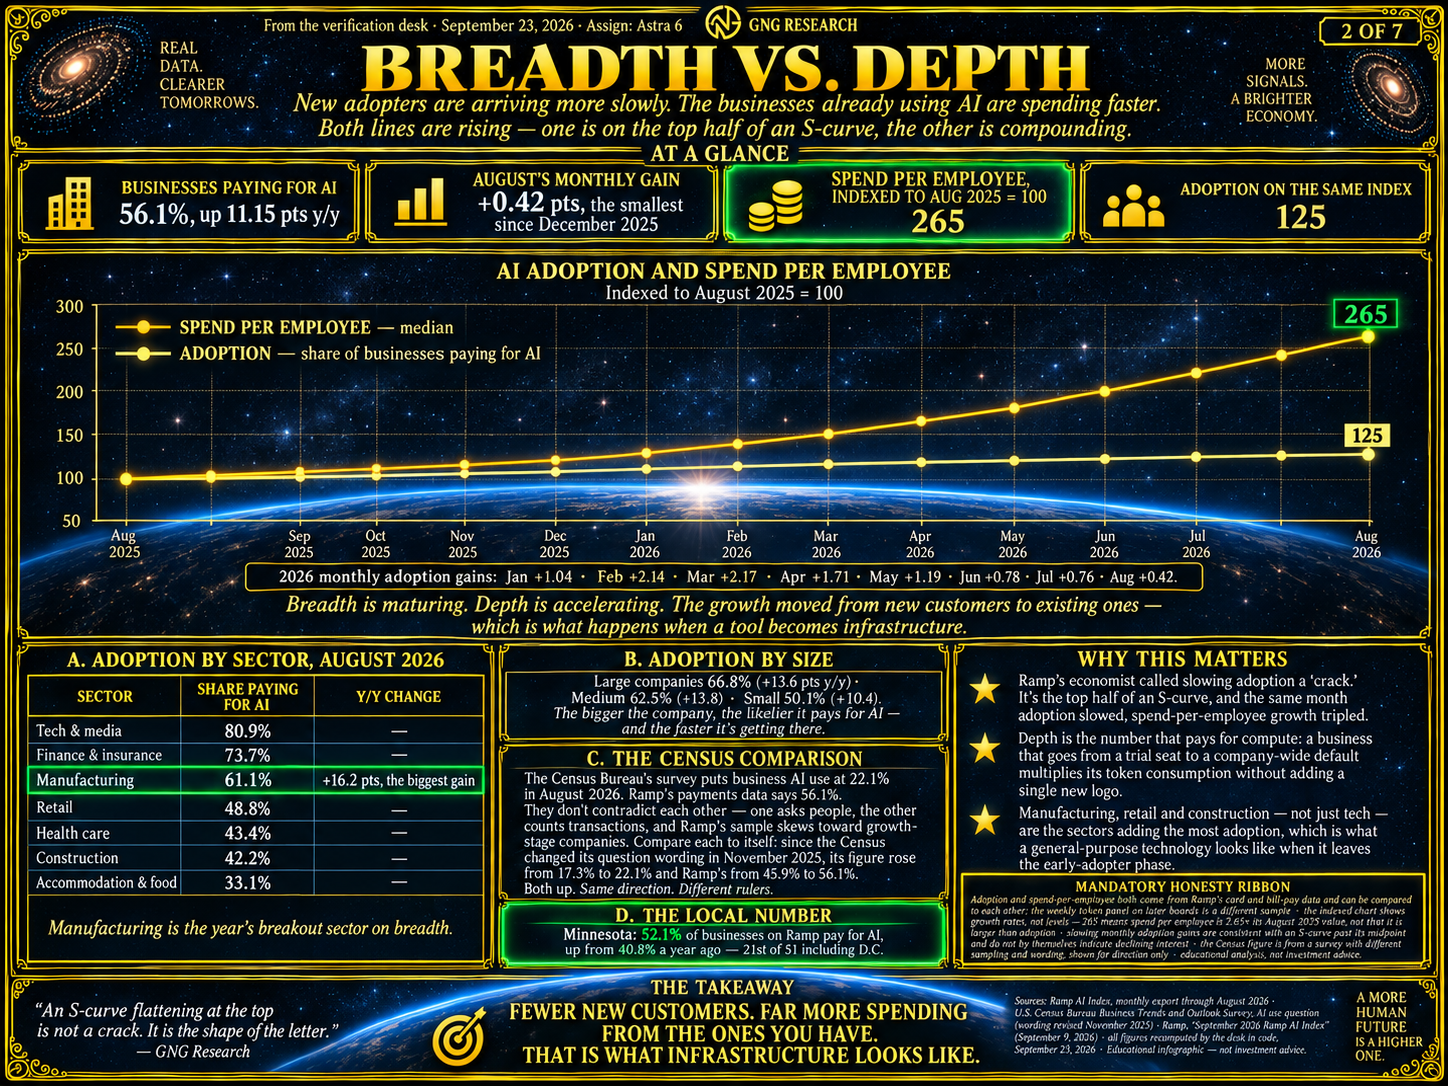
Adoption — the share of U.S. businesses on Ramp paying for AI — is 56.13% as of August, up from 44.98% a year ago. Eleven points in a year. The monthly gains through 2026: January +1.04, February +2.14, March +2.17, April +1.71, May +1.19, June +0.78, July +0.76, August +0.42. New businesses are still arriving, and they're arriving more gradually — which is exactly what every technology adoption curve in history does past its midpoint. It's the top half of an S. At 56%, AI is on it 😉
But look at what happened in the SAME months: spend-per-employee growth tripled. Index both to August 2025 = 100; adoption sits at 125, while spend per employee sits at 265. The growth moved from breadth to depth — from new customers to existing customers using it more. That's not a technology losing steam. That's a technology becoming infrastructure. Nobody "adopts" electricity twice. They just use more of it.
Some breadth details worth having. By sector: tech and media at 80.9%, finance at 73.7%, and manufacturing at 61.1% — up 16.2 points, the biggest gain of any sector. By size: large companies 66.8%, medium 62.5%, small 50.1%, and the bigger the company, the faster it's getting there. Minnesota, for the home crowd: 52.1%, up from 40.8%, twenty-first of fifty-one 🤗
One comparison you'll see is that the Census Bureau's survey reports 22.1% of businesses use AI. Both numbers are right. One counts survey answers; the other counts transactions, and Ramp's sample skews toward growth-stage companies. Compare each to itself since the Census changed its question in November: Census went 17.3% to 22.1%, Ramp went 45.9% to 56.1%. Same direction. Different rulers.
PART 3: FINANCE, MANUFACTURING, CONSTRUCTION... EVEN HEALTH CARE. EVERYBODY'S IN THE POOL 😂
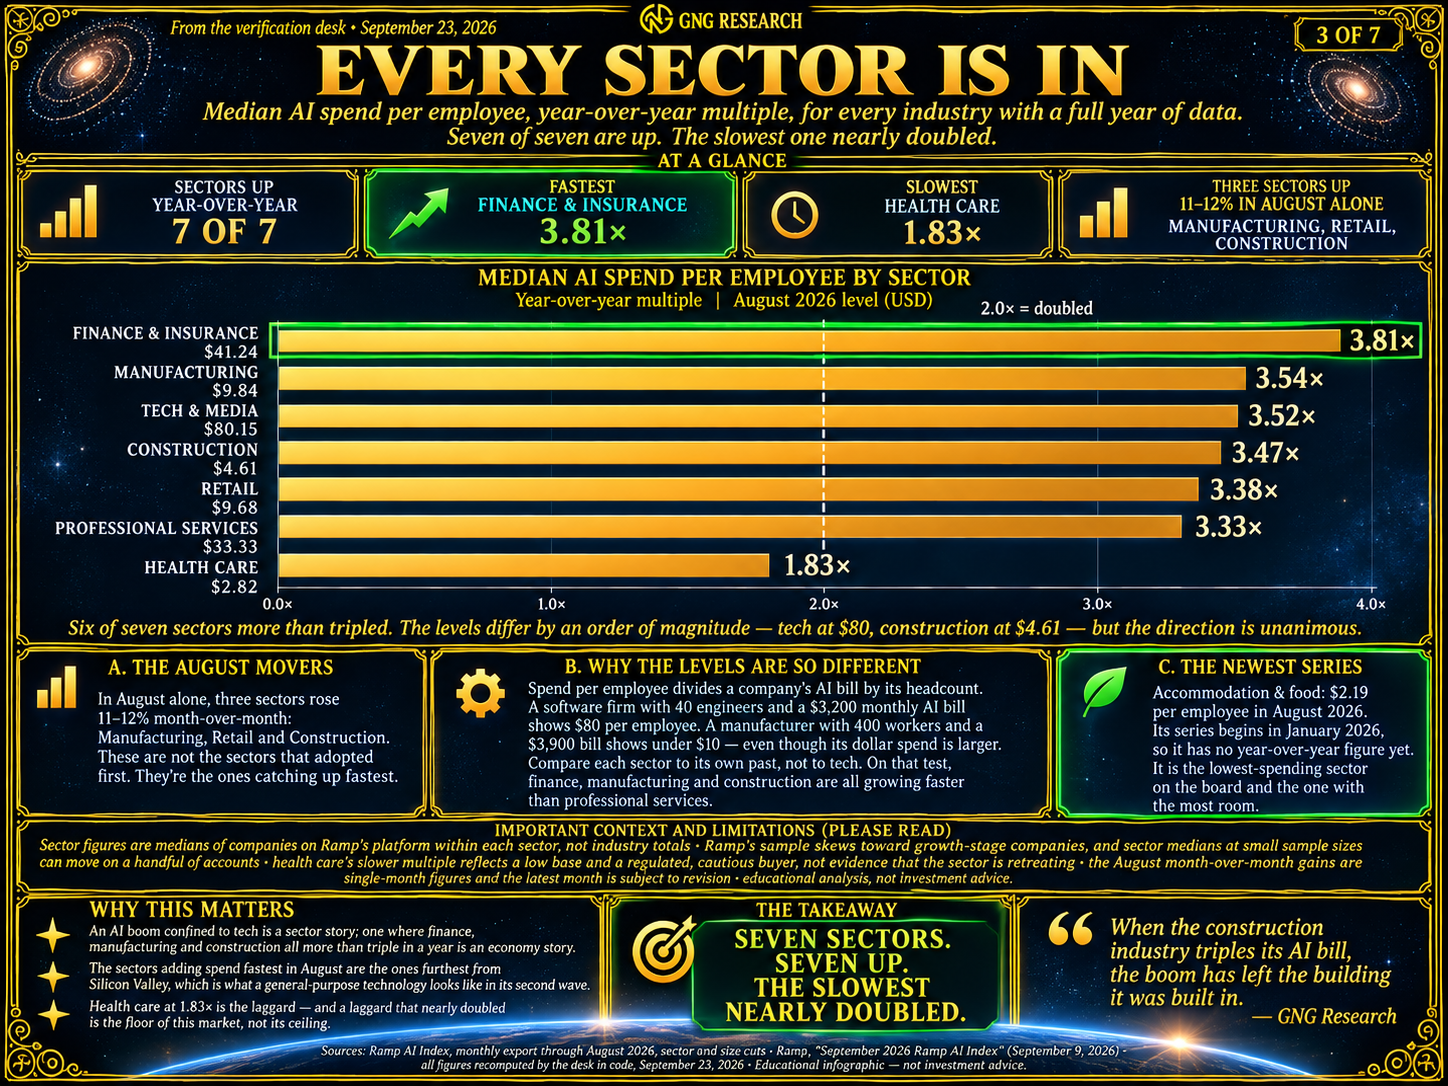
The single best argument that AI has left the early-adopter phase is this list. Median AI spend per employee, year-over-year multiple, every sector with a full year of data:
Finance and insurance 3.81x ($41.24). Manufacturing 3.54x ($9.84). Tech and media 3.52x ($80.15). Construction 3.47x ($4.61). Retail 3.38x ($9.68). Professional services 3.33x ($33.33). Health care 1.83x ($2.82).
Seven of seven up. Six of seven more than tripled. The slowest one — health care, the most regulated, most cautious buyer in the economy — nearly doubled. THAT is the floor of this market 🤯
Look at who's on that list. Tech and media at 3.52x is what you'd expect. But finance and insurance is the FASTEST. Manufacturing is second. Construction — the industry that puts up buildings — is fourth. And in August alone, manufacturing, retail and construction each rose 11 to 12% month over month. The sectors adding spend fastest right now are the ones furthest from Silicon Valley. When the construction industry triples its AI bill, the boom has left the building it was built in 😂
The dollar levels differ by an order of magnitude, and that's expected: spend per employee divides a company's AI bill by its headcount, so a 40-person software shop with a $3,200 bill shows $80, and a 400-person manufacturer with a $3,900 bill shows under $10 — even though the manufacturer is spending MORE. Compare each sector to its own past, not to tech. On that test, the "old economy" is accelerating faster than the professional-services firms that were supposed to be the natural buyers.
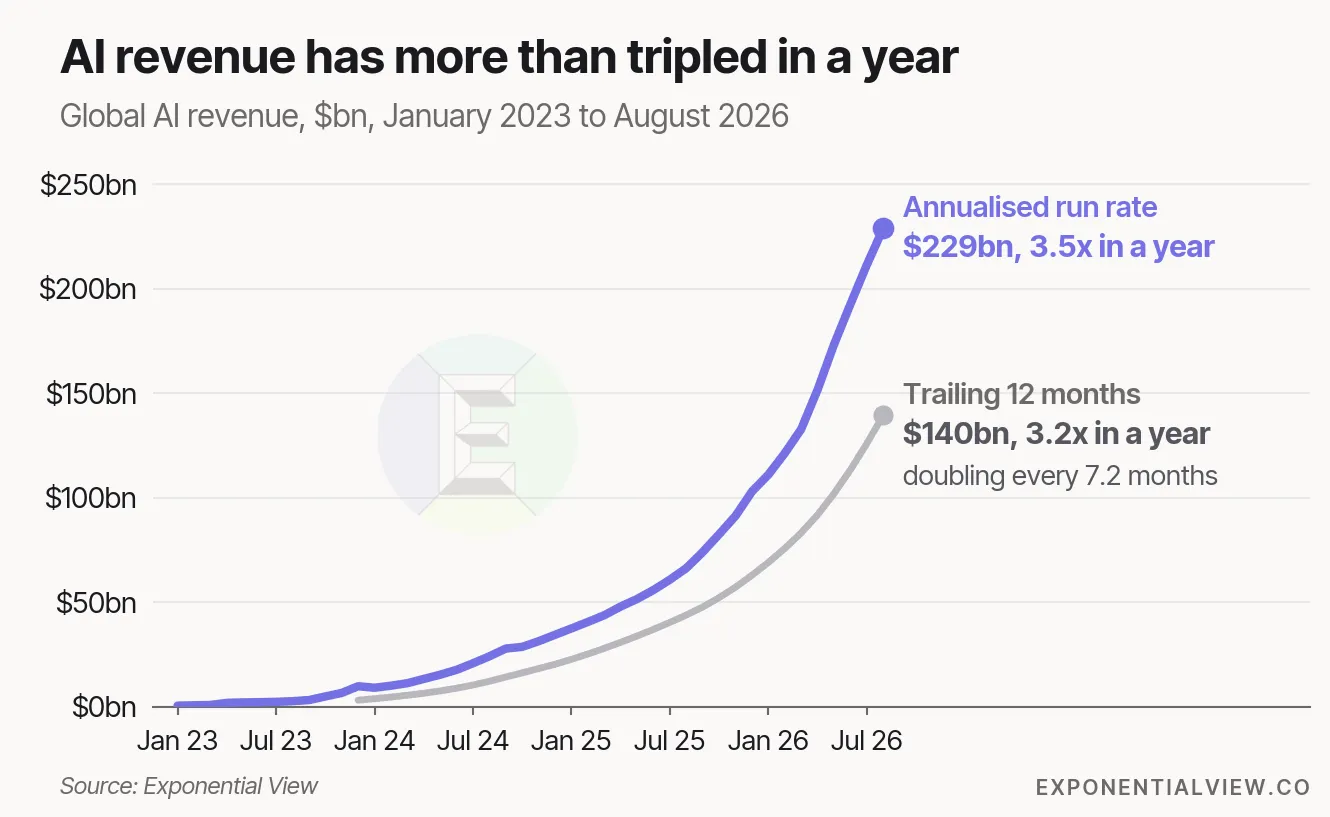
By the way, do you know what this reminds me of?
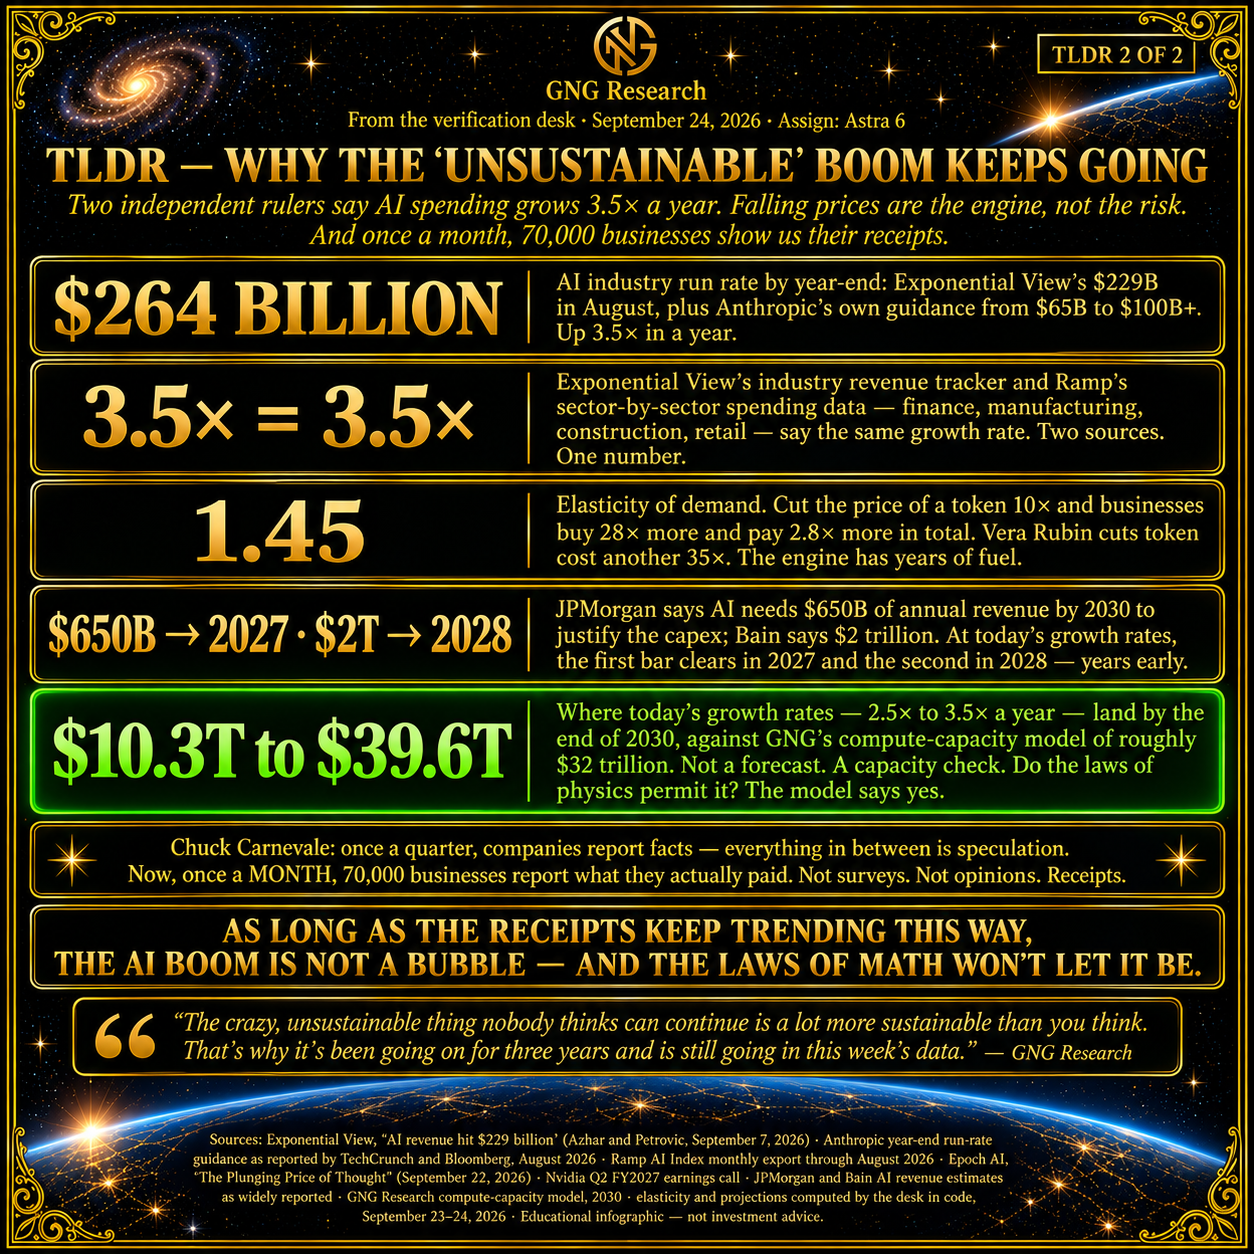
3X to 3.5X growth in AI revenue in almost every sector?
Guess what the growth rate of total AI revenue is? 3.5X per year😉🤔🤯
The bigger the numbers get, the faster the growth rate…seems crazy…but it’s true.
PART 4: WHO'S WINNING, ANTHROPIC OR OPENAI? YES 😉🤣
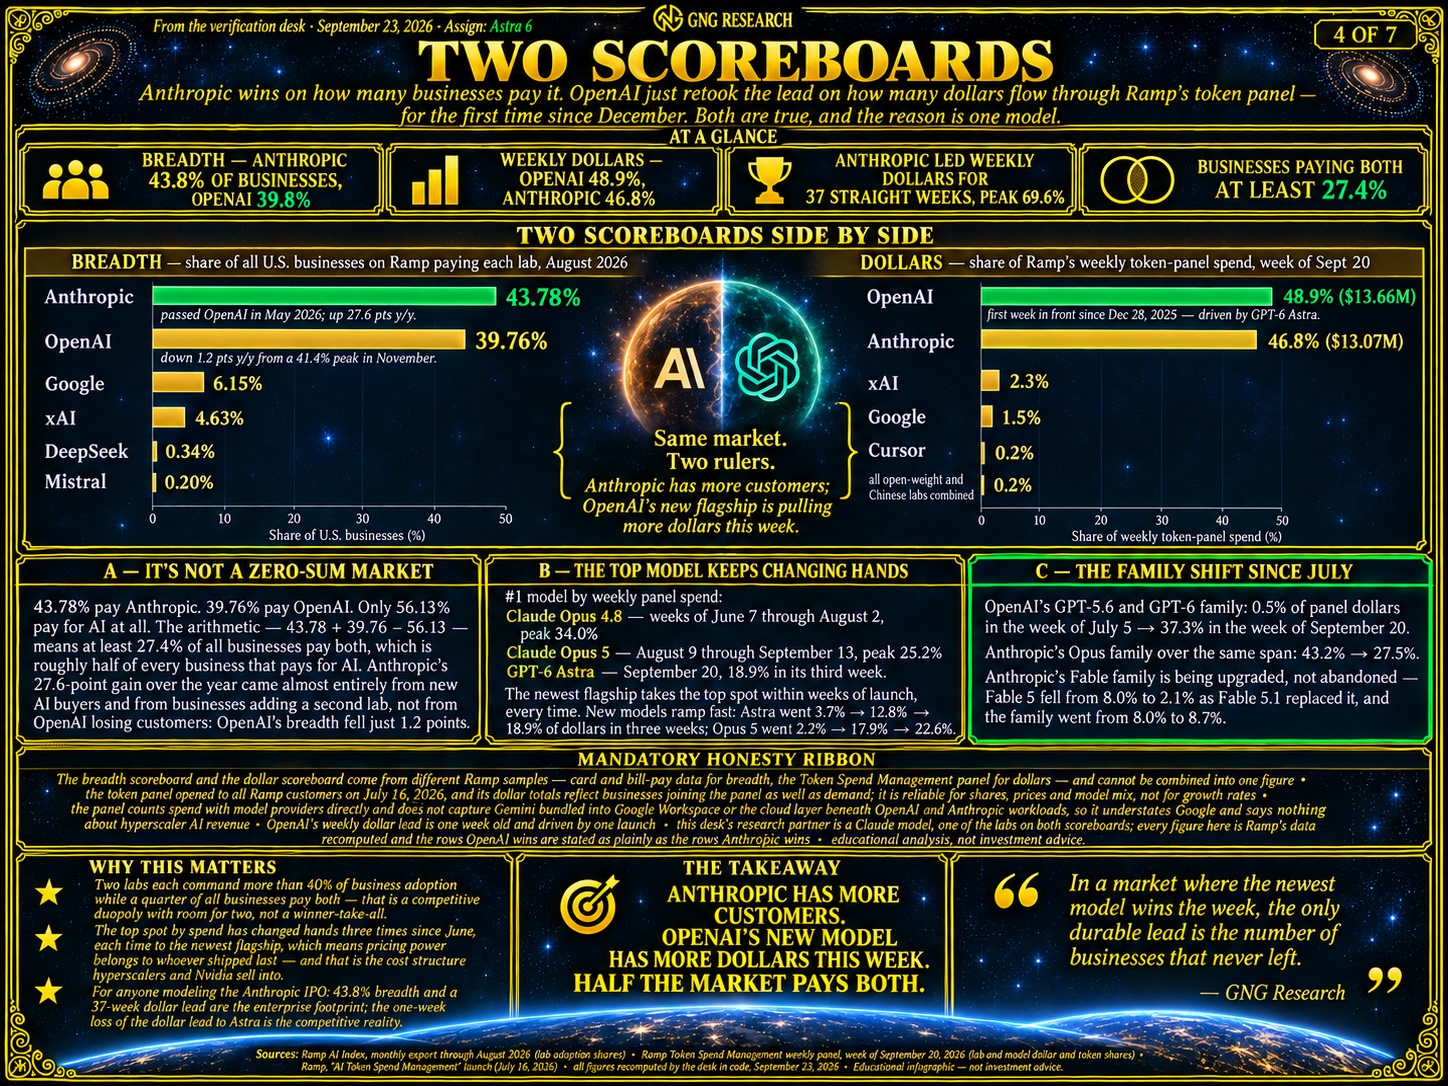
Now the part everybody asks about — and the part that matters most for the S-1: which lab is winning? The honest answer is that there are two scoreboards that disagree, and that disagreement is the most interesting thing in the report.
Scoreboard one — breadth. Share of all U.S. businesses on Ramp paying each lab, August 2026: Anthropic 43.78%. OpenAI 39.76%. Google 6.15%, xAI 4.63%, DeepSeek 0.34%, Mistral 0.20%. Anthropic passed OpenAI in May and has led since. Its gain over the year: 27.6 points, most of it in a February-to-April surge. OpenAI's breadth held near 40%, down 1.2 points from a November peak.
Scoreboard two — dollars. Share of Ramp's weekly token-panel spend, week of September 20: OpenAI 48.9% ($13.66M), Anthropic 46.8% ($13.07M). This is the first week OpenAI has led in dollars since December 28, 2025. Anthropic held the dollar lead for 37 straight weeks, peaking at 69.6% in March. What flipped it? One model. GPT-6 Astra launched, went from 3.7% → 12.8% → 18.9% of panel dollars in three weeks, and became the #1 model by spend — at 2.3 times the panel's average price per token.
So Anthropic has more customers, and OpenAI's newest flagship is pulling more dollars this week. Both true. And here's the arithmetic that explains why both can be true: 43.78% pay Anthropic, 39.76% pay OpenAI, but only 56.13% pay for AI at all. Do the subtraction, and at least 27.4% of ALL businesses pay both — roughly half of every business that pays for AI. Anthropic's rise didn't come out of OpenAI's customer base. It came from new AI buyers and from businesses adding a second lab. This is a duopoly with room for two 🤝
The top model by weekly spend has changed hands three times since June: Claude Opus 4.8 held it from June 7 through August 2 (peak 34%), Claude Opus 5 took it August 9 through September 13 (peak 25.2%), and GPT-6 Astra took it September 20. Every time, the newest flagship wins the week. Which means pricing power belongs to whoever shipped LAST — and that is exactly the cost structure the hyperscalers and Nvidia sell into. The labs compete; the shovels get paid regardless 😉
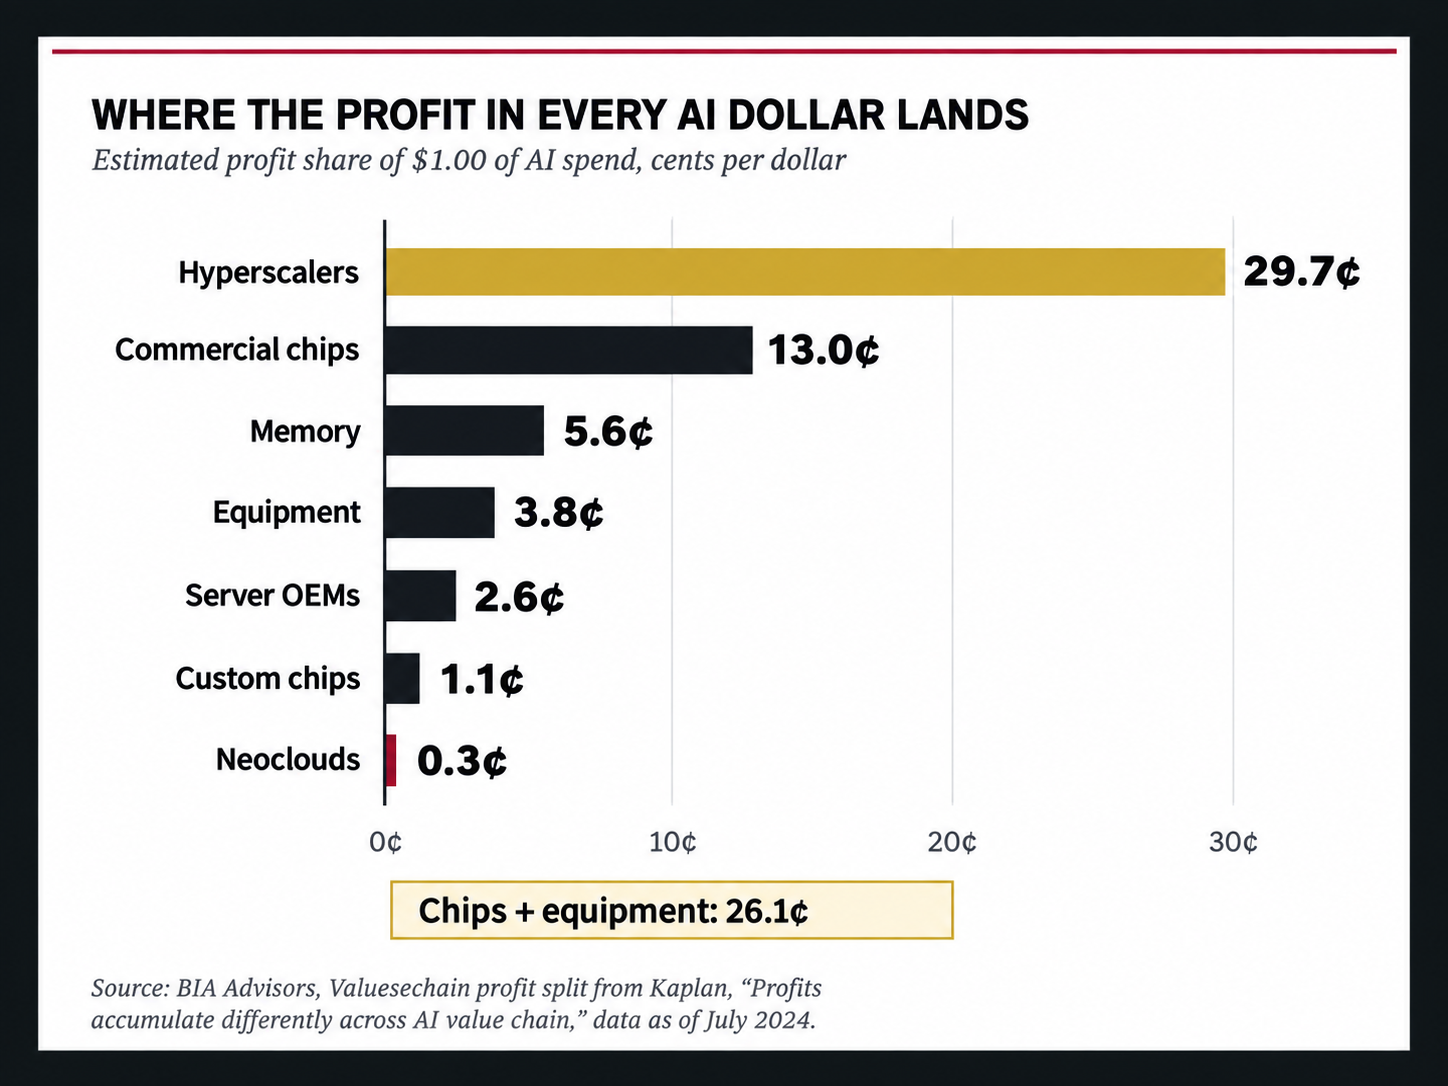
Neoclouds and Custom Chips? 1.4% of the profits vs. 54% for hyperscalers + hardware makers
Why does ZEUS invest in these AI companies? Why did Jesse James rob banks?😉🤔
Because that’s where the money is!😂🤣
Two things I want to say plainly, because I run a Claude-powered research desk and you deserve the disclosure — especially with an Anthropic S-1 on the way. First: every number here is Ramp's data, recomputed by that desk, and the rows OpenAI wins are stated exactly as plainly as the rows Anthropic wins. Second: when we open the S-1, THESE are the two numbers to hold it against — 43.8% breadth and a 37-week dollar lead are the enterprise footprint; the one-week loss of the dollar lead to Astra is the competitive reality. Both go in the model. Neither gets left out because of who signs my research desk's paychecks 😉
The joke is that my research team are all volunteers😂
PART 5: THE BARBELL — CHEAP TOKENS FOR THE GRUNT WORK, TOP DOLLAR FOR THE GENIUS 🤯
Here's the shape of how businesses actually buy AI, and it's beautiful.
GPT-5.6 Luna, OpenAI's cheapest model: 16.3% of all tokens, 2.4% of all dollars, at an implied $0.12 per million tokens. GPT-6 Astra, OpenAI's newest and most expensive: 8.3% of tokens, 18.9% of dollars, at $1.76 per million. The panel average is $0.77. Luna moves twice the tokens for one-eighth the money. Astra moves half the tokens for eight times the money. Same week, same panel, same buyers 🤯
That's a BARBELL. Businesses send the bulk work — the summarization, the classification, the grunt tasks — to the cheapest model that can do it, and they pay top dollar for the frontier model on the work that matters. Claude Opus 5 accounts for 17.1% of dollars; Claude Sonnet 5 accounts for 8.7% of tokens and 5.2% of dollars at $0.46. Every lab's lineup shows the same shape: dollars pool at the top of the table, tokens pool at the bottom.
And the frontier end just set a record. Take the frontier basket — Opus, Fable, Sol, and now Astra — and its share of DOLLARS in the week of September 20 was 66.4%, the highest in the panel's history, beating the prior record of 64.7% from early August. The most expensive tier of models took the largest share of spending ever recorded. In the same month, the cheap tier took a record share of volume. Both ends growing at once 🥳
The proof is Astra itself. It launched at 2.3 times the panel's average price and went 3.7% → 12.8% → 18.9% of panel dollars in three weeks, straight to #1. One model and three weeks is an early read; I'll recheck it at six. But when a product priced at twice the average hits number one in three weeks, businesses are telling you exactly what the best model is worth to them — which is the single most important input to any lab's margin model, Anthropic's included 😂
⬛ PLACE BOARD HERE: "THE BARBELL" ⬛
Source: Ramp Token Spend Management weekly panel, week of September 20, 2026 · Ramp, September 2026 AI Index report · recomputed by the desk in code September 23, 2026 · GNG Research
Sign in to leave a comment and join the discussion.
Sign Up Free