

Wage figures over the past several years present a serious puzzle. Between 2019 and 2024, the American labor market pulled off an extraordinary compression in hourly pay. The lowest-earning decile of the workforce secured real, inflation-adjusted wage gains that comfortably outstripped those of the middle class and senior corporate managers. On paper, roughly a third of the wage inequality that widened so remorselessly between 1979 and 2019 vanished in a four-year burst. Yet that momentum hit a hard ceiling. Throughout 2025 and into 2026, real wage growth for lower-income workers ground to a complete halt, flatlining at essentially zero real growth while headline inflation steadily eroded initial purchasing power. Look purely at hourly pay stubs during the peak of that cycle, one might believe Americans have begun an egalitarian renaissance.
That conclusion mistakes a momentary, cyclical shift in income flows for a permanent reallocation of economic power. Economic power isn’t determined by hourly wages - it’s anchored in personal balance sheets: equity in residential real estate, stakes in private enterprise, portfolios of productive capital, and the privilege of holding cash instruments that yield positive real returns. When emergency fiscal and monetary liquidity flooded the system in 2020, it was capitalized into those asset stocks first. By the time that stimulus filtered into the physical economy, producing labor shortages, bidding wars, and service-sector pay raises, the price of admission to asset ownership had moved permanently out of reach.
The bottom half of the workforce received a temporary raise that has now fully stalled, while the balance sheets of incumbent asset owners received a multiple. Because the entry price of productive capital inflated far faster than labor could save, the wage compression of the early 2020s did not narrow the divide. Instead, as real wage gains flattened to zero in 2025 and 2026, it seems to have locked the wealth gap into place.
Flows, Stocks, and Conversion Failures
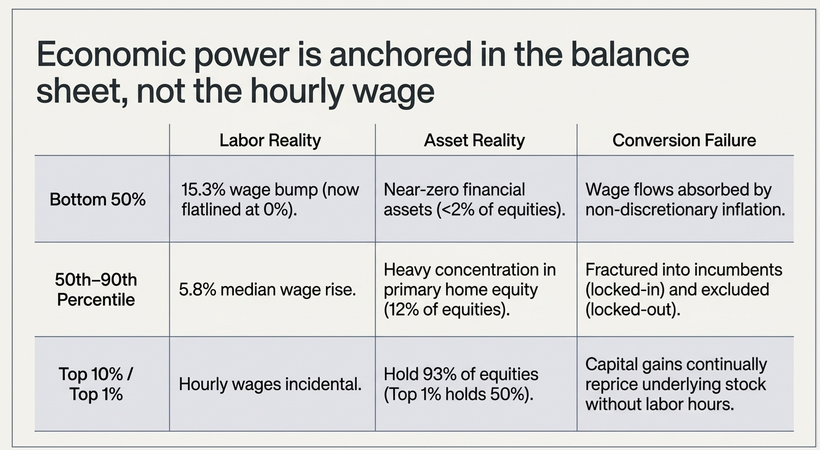
To understand why a narrower wage gap produced wider balance sheet divergence, we have to look across the income spectrum and trace how labor earnings interact with financial architecture.
The Illusion of Convergence
The labor data deserve a dispassionate hearing. Between 2019 and 2024, figures from the Current Population Survey and the Economic Policy Institute confirmed a rare structural shift. Real hourly wages for the 10th percentile climbed 15.3%, while the 20th percentile recorded an 11.4% increase. In contrast, the real median wage increased by just 5.8%, and the 90th percentile grew by 6.9%. Economists David Autor, Arindrajit Dube, and Annie McGrew showed that this post-2020 wage compression was propelled by exceptionally tight service-sector labor markets, aggressive state-level minimum wage increases, and high job-switching elasticity. For four years, low-wage workers commanded starting pay that would have seemed impossible in 2018.
This dynamic tempted commentators to celebrate an egalitarian recovery, yet viewing this trend as proof of closing inequality misses the arithmetic gulf between percentage changes and absolute sums. A 15% real wage increase on a low base yields modest additional purchasing power. For a worker earning $15 an hour, a 15% real bump amounts to an extra $2.25 an hour, or roughly $4,680 before taxes for a full working year. At the same time, an investor holding a $2,000,000 equity portfolio experienced the financial effects of historic multiple expansion. Between the market lows of March 2020 and the highs of late 2024, the S&P 500 more than doubled. A modest 10% annual nominal return on a seven-figure asset base generates $200,000 in unearned balance sheet appreciation, which is more than four times the entire annual gross income of the entry-level worker.
The subsequent years removed any remaining ambiguity about whether this compression represented a new economic baseline. In 2025 and into 2026, real wage growth for the bottom decile ground to an absolute halt. The tight labor market cooled as quit rates retreated to pre-pandemic levels, service-sector hiring moderated, and nominal wage growth dropped to roughly zero in real terms after accounting for persistent service and shelter inflation. Wage compression was an artifact of an overheated cyclical labor market rather than a permanent structural reset. The wage gains hit a plateau, but the repriced asset base remained firmly in place.
Flow Versus Stock: The Mechanics of the Conversion Failure
The core structural failure of the post-2020 economy lies in the conversion rate between flow and stock. In personal finance, income is a flow variable, while net worth is a stock variable. Savings represent the rate at which an economic actor converts surplus flow into permanent stock. When asset prices appreciate rapidly, the value of that stock expands independently of any corresponding labor flow. To see why the bottom half could not convert higher pay into durable wealth, examine the microeconomics of a full-time worker earning between $35,000 and $42,000 a year:
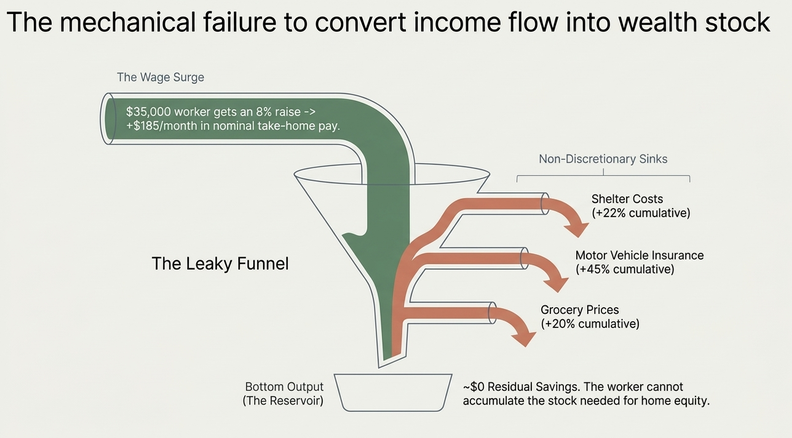
Suppose a worker earning $35,000 received an 8% real wage increase over a three-year period. Gross pay rose by $2,800 annually, yielding roughly $185 per month in additional take-home pay. However, official headline inflation measures systematically understate the lived expenses of the bottom two income quintiles. Lower-income households allocate a much larger portion of their disposable income to non-discretionary necessities such as rent, groceries, automotive insurance, utilities, and used vehicle maintenance.
Between 2020 and 2024, while core CPI rose significantly, cumulative shelter costs jumped by more than 22%, motor vehicle insurance rose by over 45%, and grocery prices climbed by more than 20%. The additional $185 a month in take-home pay was absorbed by rent renewals, higher utility bills, and insurance premiums before a single dollar could reach a savings account. As real wage growth stalled at zero percent through 2025 and 2026, even that narrow discretionary margin disappeared completely.
Now check out the capital required to purchase an entry-level home:
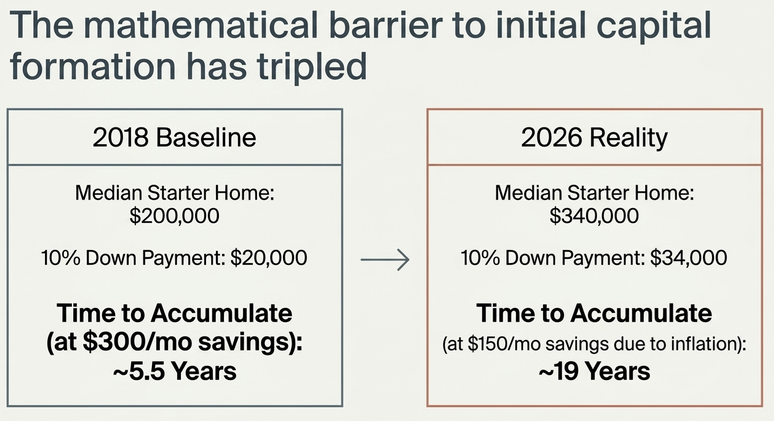
Even after receiving their largest percentage wage bump in half a century, the entry-level household was pushed further away from the down payment threshold. The arithmetic simply did not work in their favor. The Census Bureau’s Survey of Income and Program Participation documents this balance-sheet reality in clear detail. In 2024, median household wealth in the United States stood at approximately $204,900. For households in the 10th percentile, net worth sat at or below zero, weighed down by unsecured debt and an absence of appreciating assets. At the 90th percentile, median net worth was approximately $1.81 million.
The composition of that wealth illustrates the structural gap. The bottom 50% hold their limited net worth primarily in used vehicles and basic transaction deposits. The middle 40% hold their wealth almost exclusively in primary residential housing equity, alongside modest retirement accounts. The top 10% hold their wealth in income-generating commercial assets, including private business equity, high-grade debt instruments, and public equities. Capital gains represent pure income in an economic sense, yet they do not appear in Current Population Survey wage statistics. This omission explains how headline data can celebrate shrinking wage inequality while wealth concentration accelerates.
The Asset Wall: Housing as the Binding Constraint
Housing is the primary mechanism through which the American middle class builds durable net worth. When access to homeownership is cut off, the primary ladder of capital accumulation breaks down completely. Historically, the ratio of median home prices to median household income in the United States hovered near 3.0. By late 2024 and through 2026, that ratio climbed to roughly 5.0. Harvard’s Joint Center for Housing Studies documented that for households headed by individuals under 40, which is the prime demographic for family formation, the ratio climbed from 2.9 in 2019 to 3.5 by 2024.
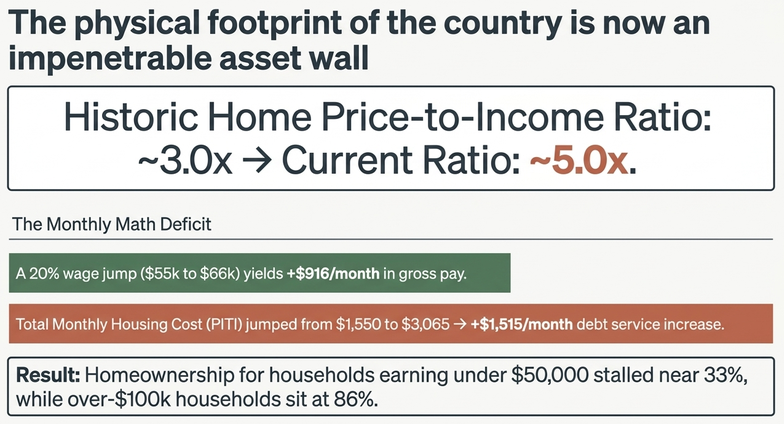
This structural shift was driven by two sequential phases. First, from 2020 through 2021, emergency fiscal transfers, zero-bound interest rates, and the massive expansion of the Federal Reserve’s balance sheet reduced borrowing costs across the economy. Mortgage rates fell to historic lows near 3%. Households with pre-existing balance sheets capitalized on this cheap debt, sparking nationwide bidding wars that drove home prices up by more than 40% in two years. Second, when the Federal Reserve raised its policy rate to combat inflation, mortgage rates surged toward 7%. In a standard cyclical adjustment, borrowing cost increases force prices downward. Instead, existing homeowners refused to list their properties and forfeit their 3% mortgages. Inventory dried up, locking current owners in place and preventing home prices from mean-reverting. The monthly carrying costs reveal the severe impact on affordability:
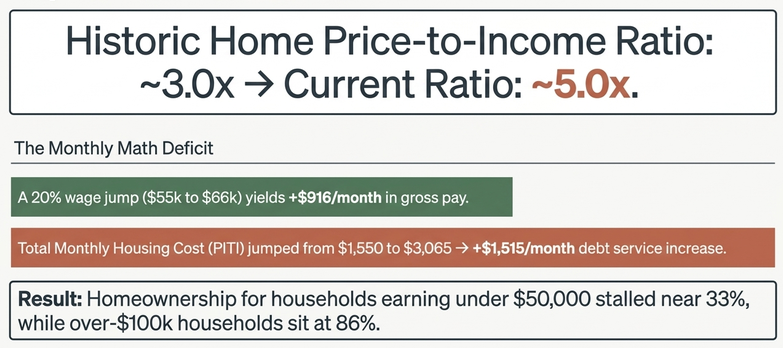
A household that saw its gross pay jump 20% over this period, rising from $55,000 to $66,000, experienced an increase in gross monthly income of $916. But the monthly debt service on the median home climbed by $1,515, while the cash required for a 10% down payment rose by $16,500. The math decisively shut the gate. Federal Reserve data show that homeownership rates sit near 33% for households earning under $50,000, compared to roughly 86% for those earning over $100,000. Purchase originations to low- and moderate-income borrowers have dropped to multi-decade lows as a direct result. Because municipal zoning restrictions, elevated building material costs, and rising catastrophe insurance premiums keep replacement costs elevated, housing supply remains stubbornly unchanged. The capital injected in 2020 was permanently capitalized into real estate values. This dynamic turned the physical footprint of the country into an asset wall that wage increases cannot overcome.
The Middle-Class Squeeze: The Owner-Renter Divergence
This asset wall split the American middle class into two distinct groups, separating balance-sheet incumbents from unanchored earners. The middle class can no longer be evaluated as a single cohort. The traditional 50th-to-80th income percentiles did not benefit from the wage premiums that tight service-sector labor markets awarded to the bottom 20%. Over the 2019 to 2024 period, median real wages rose just 5.8%, and the 90/50 wage ratio remained essentially flat. As corporate cost-cutting accelerated into 2025 and 2026, white-collar professionals faced hiring freezes, restructured management tiers, and rising living costs.
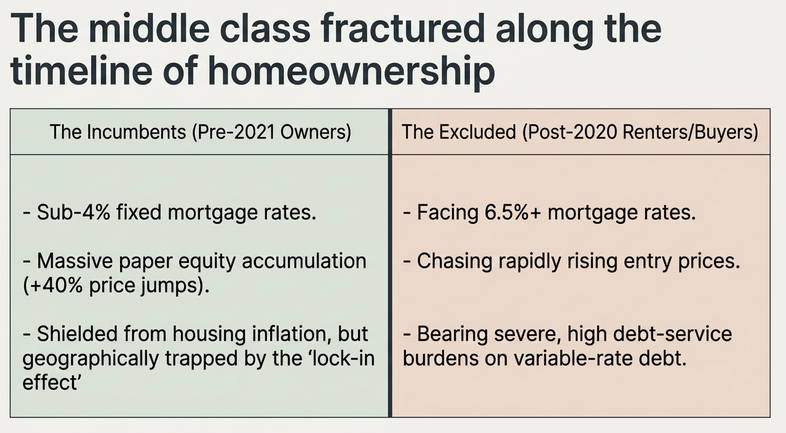
The division between these two groups is determined by their homeownership status in early 2020. Households that owned a home prior to 2021 locked in historically low mortgage rates between 2.75% and 3.5%. The subsequent inflation shock drove up their home equity, while their primary monthly expense remained fixed in depreciating nominal dollars. On paper, their balance sheets look remarkably healthy. However, they face their own structural constraint in the form of the mortgage lock-in effect. Selling their home to relocate for career opportunities or family needs means exchanging a 3% debt facility for a 7% loan on an asset that has appreciated drastically. Mobility among existing homeowners has fallen sharply, creating an economy of capital-rich but geographically trapped households. Meanwhile, households that were renting in 2020 or entered the workforce after the initial stimulus wave faced escalating rents, an immediate 40% jump in housing acquisition costs, and doubling interest rates on auto loans and credit cards. For this group, a modest annual raise was completely swallowed by rent increases, daycare bills, and elevated car payments.
Aggregate household balance sheets look stable at first glance. The Federal Reserve’s Debt Service Ratio, which measures aggregate household debt payments as a percentage of disposable personal income, sat at roughly 11.2% in early 2026. That is well below the 15.8% peak seen prior to the 2008 Great Financial Crisis. However, aggregate debt metrics mask this sharp divergence. The metric looks healthy because tens of millions of incumbent homeowners hold historically cheap, long-dated fixed debt. For the unanchored household, the personal debt-service burden has risen sharply. Delinquency rates on credit cards and auto loans among non-homeowning demographics climbed through 2024, 2025, and into 2026, reflecting intense strain on households that hold variable-rate debt without an appreciating asset to borrow against.
Modern Liquidity Plumbing and the Cantillon Effect
This divergence did not happen by accident. It is the natural consequence of how monetary liquidity moves through modern financial markets. When the Federal Reserve expands its balance sheet, it does not distribute currency directly to consumer checking accounts. Instead, it purchases Treasuries and agency mortgage-backed securities from primary dealers, crediting commercial banks with digital reserves. This process was designed to stabilize balance sheets, lower long-term interest rates, and support credit creation during market panics, but it acts primarily as an asset-collateral engine.
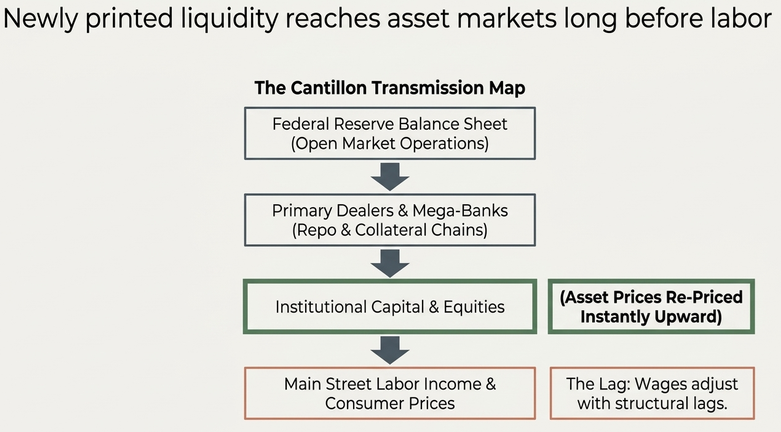
This sequence illustrates the classic Cantillon Effect, which demonstrates that the first receivers of newly created capital benefit disproportionately because they deploy liquidity into real assets before prices rise across the broader economy. The first receivers include institutional primary dealers, hedge funds, private equity sponsors, corporate treasuries, and high-net-worth investors with direct credit access. They borrow at low baseline rates, acquire tangible assets, recapitalize balance sheets, and bid public equities to elevated multiples. The second receivers are mid-tier corporate operations, regional lenders, and incumbent property owners who refinance high-cost debt into long-term facilities. The final receivers are salaried and hourly workers. By the time central bank liquidity filters into the broader economy through consumer demand and wage negotiations, asset valuations have already adjusted upward. The rate-hiking cycle that began in 2022 simply transformed it into a new regime driven by fiscal deficits and high nominal cash yields. To suppress inflation, the Fed raised its policy rate. But the federal government continued to run budget deficits between 6% and 7% of GDP, requiring massive Treasury issuance. By fiscal year 2025 and into 2026, net annual interest payments on the U.S. federal debt climbed toward $1 trillion, becoming one of the largest single line items in the federal budget.
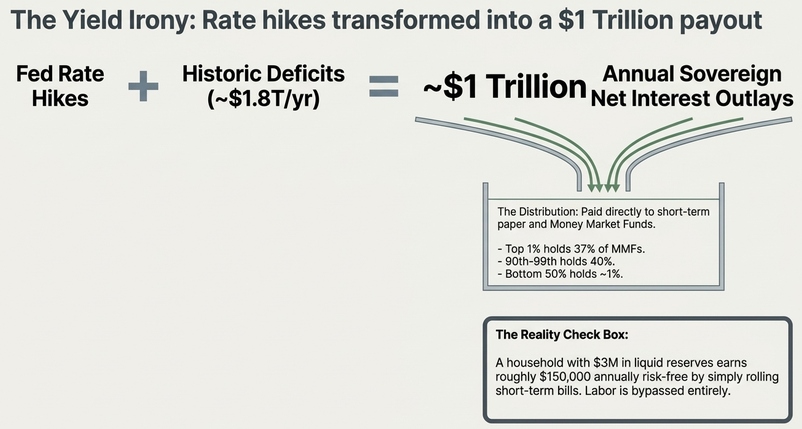
Where did that $1 trillion in annual interest go? It was paid directly to holders of short-term U.S. sovereign debt, including institutional balance sheets, primary dealers, foreign central banks, and domestic money-market funds. Federal Reserve Distributional Financial Accounts make clear who owns these assets. Households in the top 1% hold roughly 37% of all money-market fund shares, while the 90th to 99th percentiles hold another 40%. The entire bottom 50% of the population holds approximately 1%. For the first time in two decades, investors holding large cash reserves received a risk-free 4.5% to 5.25% yield on short-term paper. Capital-rich households were paid handsomely to park liquidity in Treasury bills, generating substantial cash flow without taking on operational or labor market risk. An entry-level worker cannot capture high risk-free yields on an hourly wage. A household with $3 million in liquid reserves, however, earns roughly $150,000 annually simply by rolling short-term bills. The return to higher interest rates, originally designed to cool the economy, created a massive income stream for the balance-sheet class while higher borrowing costs weighed heavily on everyone else.
The Orthodox Defense and Its Analytical Limits
A rigorous thesis must engage its most persuasive critics on their own terms. Economists of a more orthodox disposition argue that this balance-sheet critique understates the structural resilience of American households, mistakes corporate productivity for central-bank manipulation, and discounts the genuine egalitarian gains achieved during the post-pandemic cycle. These objections carry weight, yet each runs into an analytical limit when tested against the mechanics of asset ownership. The most common defense begins with the sheer scale of direct pandemic relief. Between 2020 and 2021, the state bypassed the financial plumbing entirely. Through stimulus checks, expanded unemployment buffers, and student-loan pauses, fiscal authorities injected liquid balances straight onto consumer balance sheets, sending lower-income deposits to historic highs. This argument is correct on the initial flow, but it misjudges duration. A bank deposit is a buffer against immediate shocks, not an engine of capital appreciation. By 2023, the excess cash accumulated by the bottom quintiles had been almost entirely absorbed by elevated grocery bills, utility tariffs, and rent adjustments. Because that temporary relief was never converted into equity or physical property, it left the underlying distribution of wealth untouched once the consumer price level permanently reset.
A second defense points to aggregate balance-sheet health. Debt service burdens across the broader economy remain comfortably below the precarious thresholds seen on the eve of the 2008 crash. In this telling, the American consumer is unusually well insulated against higher interest rates. Here, the aggregate statistic conceals the underlying fracture. The national debt service ratio appears benign precisely because the incumbent majority locked in generational mortgage terms before rates began their ascent. For unanchored households, recent labor-market entrants, and renters, the credit environment looks radically different. Consumer distress among non-homeowning cohorts has climbed steadily, with subprime auto and credit card delinquencies matching recessionary levels. To celebrate aggregate solvency is to confuse the fortress balance sheets of incumbent property owners with the financial stability of the workforce at large.
A third objection holds that labor captured genuine economic rent at the direct expense of capital. Between 2021 and 2023, wage-push inflation across retail, hospitality, and transport demonstrably compressed corporate margins, providing empirical evidence that workers held authentic pricing power. Yet this margin compression was highly localized. While labor-intensive, low-margin operators felt the pinch, corporate profits across the wider economy remained near record highs as a share of national income well into 2025. Large firms with proprietary market power passed along input costs with ease, while asset-light technology monopolies expanded their margins untroubled by physical wage pressures. The compression of hospitality margins did not alter the macro-level distribution of income; it merely highlighted the gulf between low-productivity services and scalable capital assets.
A final, more sophisticated defense asserts that elevated asset multiples reflect the extraordinary productivity of American enterprise rather than the collateral plumbing of central banks. The equity market’s surge from 2020 through 2026 was driven by tangible breakthroughs in enterprise computing, artificial intelligence, and unmatched global scale. This observation is entirely true, yet it fails as a refutation. High corporate productivity and concentrated capital ownership are natural partners, not competing explanations. Silicon Valley’s earnings are undeniably real. But because the top decile commands over 90% of listed equities, the dividends of that innovation accrue almost exclusively to a narrow slice of the populace. Whether driven by central-bank liquidity or genuine technological genius, the macroeconomic result remains identical: capital compounds at rates that labor income cannot hope to match.
Testing the Framework
An analytical framework is only useful if it can be tested against real-world data over the coming business cycle. The thesis that post-2020 liquidity permanently priced labor out of middle-class capital accumulation would be weakened if several clear shifts were to occur:
Price-to-Income Ratios Mean-Revert to Historical Norms: The national home price-to-income ratio retreats from ~5.0 back toward its historical baseline of ~3.0 without an economic collapse that wipes out middle-class household equity.
First-Time Homebuyers Reclaim Market Share: Purchase lending to low- and moderate-income buyers rebounds, and first-time homebuyer activity rises back toward historical averages without requiring unsustainable leverage.
The Bottom 50% Wealth Share Expands via Real Assets: The wealth share of the bottom 50% climbs significantly through equity ownership, business ownership, and real estate, rather than short-lived spikes in cash deposits.
Wage Compression Resumes in a Normalized Labor Market: The 90/10 wage ratio resumes its compression even as the national unemployment rate normalizes and cyclical service-sector labor shortages subside.
Conversely, this framework will be reinforced if the following conditions hold:
Housing Lock-In Persists alongside High Asset Multiples: Existing home inventory remains tight, maintaining home prices near 5.0 times median income despite sustained 6.0%+ mortgage rates.
Low-End Real Wages Remain Stagnant: The post-pandemic compression remains definitively ended, with real wage gains for the bottom 20% hovering near zero or turning negative relative to consumer inflation.
Public Debt Service Continues to Funnel Trillions to Cash Pools: Net interest payments on federal debt remain near or above $1 trillion annually, continuing to pay high risk-free yields to the 10% of households that hold the vast majority of money-market funds and short-term Treasuries.
The Incomplete Promise of Higher Wages
The American economy in the 2020s did not repeat the industrial and agrarian crises of the twentieth century, nor did it operate as a centrally managed extractive system. Its institutions acted deliberately to stabilize debt markets during a panic and inject liquidity to avert an economic collapse. Yet the mechanics of that intervention exposed the structural limitations of the modern economy. When monetary and fiscal stimulus is injected into an economy characterized by inelastic housing supply and financialized assets, liquidity accumulates where capital is already organized. The labor market delivered a rare, genuine compression in entry-level hourly pay. But that extra income flow was absorbed by higher rents, non-discretionary consumer costs, and an elevated entry price for the primary asset that builds middle-class wealth. Once the cyclical labor market cooled, real gains flatlined at zero, leaving the bottom half without the continuing wage momentum needed to overcome the repriced asset base.
The lesson of the post-2020 economy is clear. In an era of persistent financialization and structural supply shortages, an hourly wage increase cannot close the gap against compounding assets. The bottom half of the workforce received a temporary raise, while the balance sheet received a multiple. Until public policy addresses the underlying mechanics, including the physical supply of housing, the barriers to middle-class asset ownership, and the distributional effects of sovereign debt issuance, wage compression will remain an optical convergence while true balance sheet divergence quietly compounds.
Sign in to leave a comment and join the discussion.
Sign Up Free