You must be logged in to view this page. Log in or create a free account.
Monte Carlo Forecasting
Stress-test any portfolio with up to 100,000 simulated market paths, from a one week trade horizon to a ten year retirement plan.
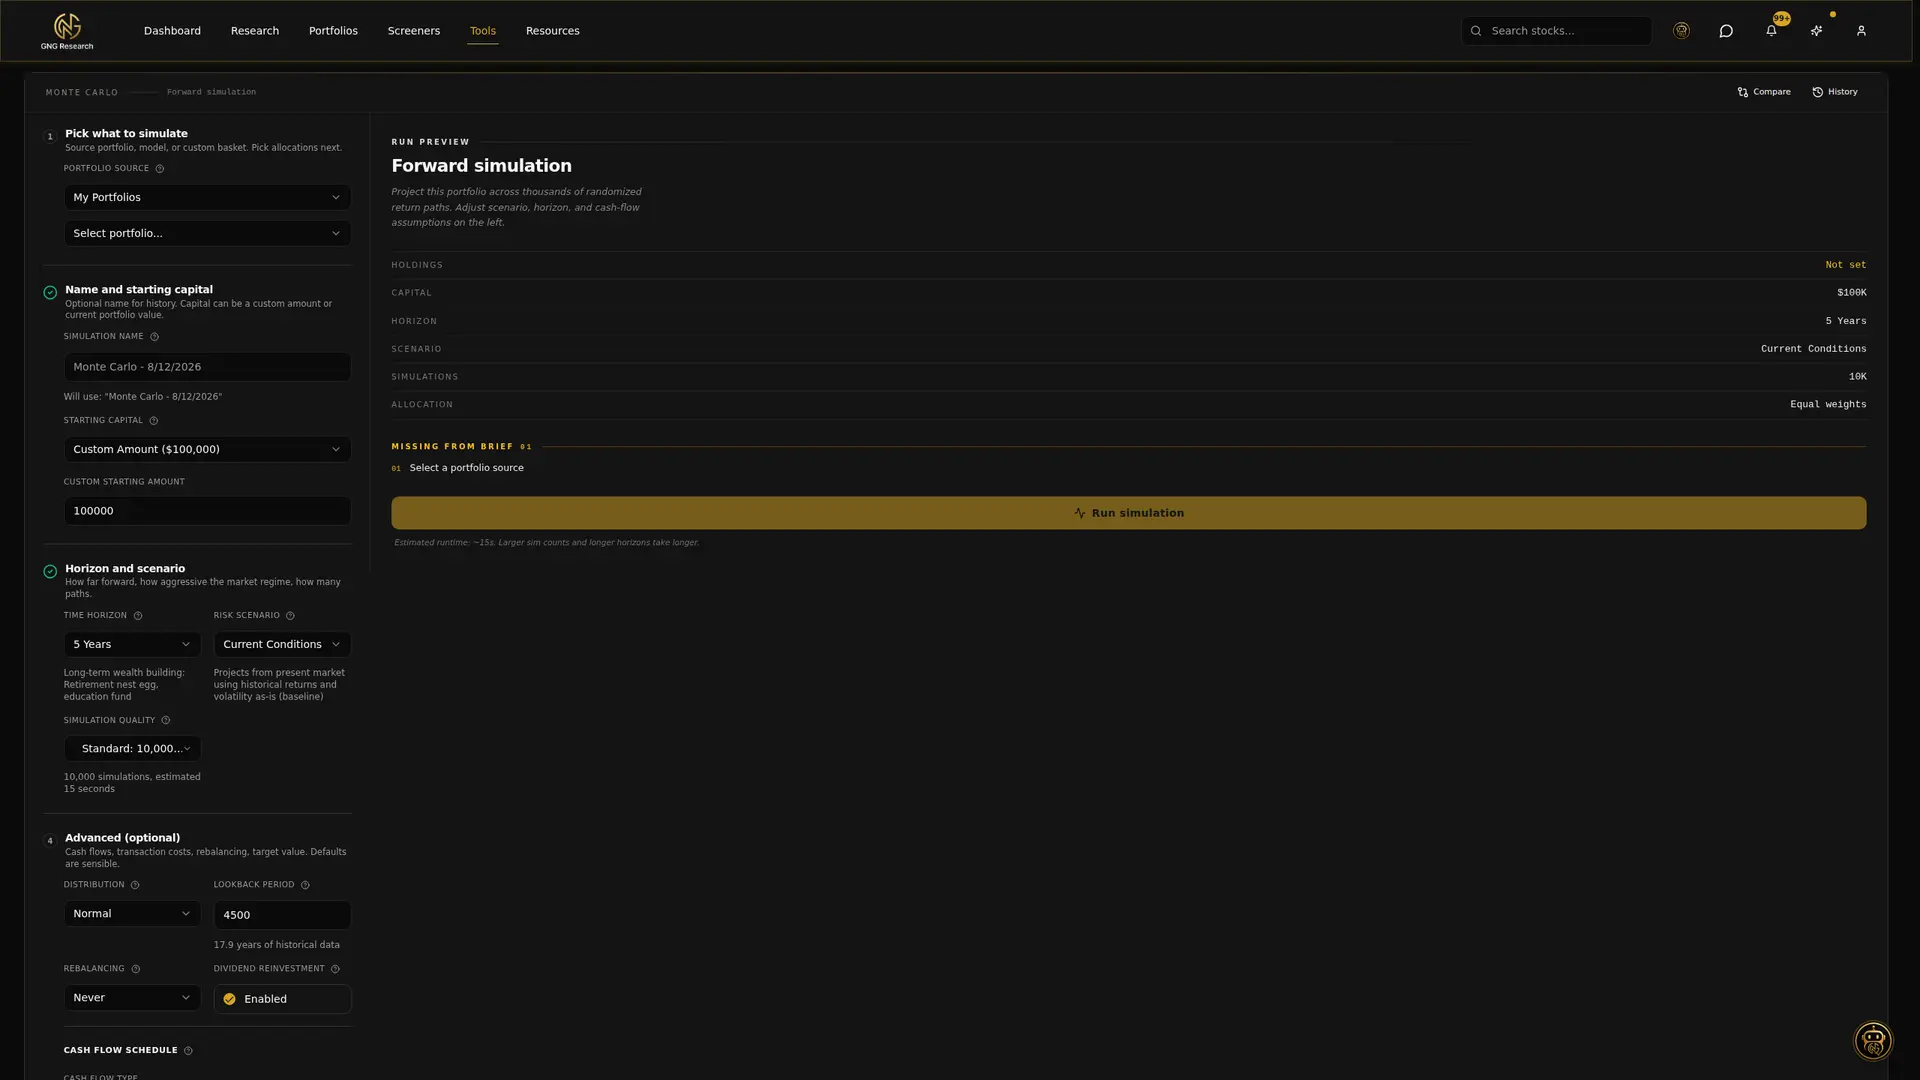
Set the scenario
Choose a portfolio source, starting capital, time horizon, and risk regime. Thirteen horizons run from one week to ten years, so the same engine covers an earnings trade and a retirement plan.
- Four precision levels: 5,000 to 100,000 simulated paths
- Horizons from 1 week to 10 years
- Risk regimes from conservative up to 2008 crisis conditions
- Recurring contributions or withdrawals for retirement planning
A real simulation engine
Returns are estimated from a historical lookback window you control and drawn from a normal or fat-tailed Student-t distribution, with the correlation between your holdings preserved. Rebalancing and dividend reinvestment are modeled explicitly.
- Normal or Student-t distributions to capture fat tails
- Adjustable historical lookback window
- Correlation heatmap across every holding
- Dividend reinvestment and rebalancing settings
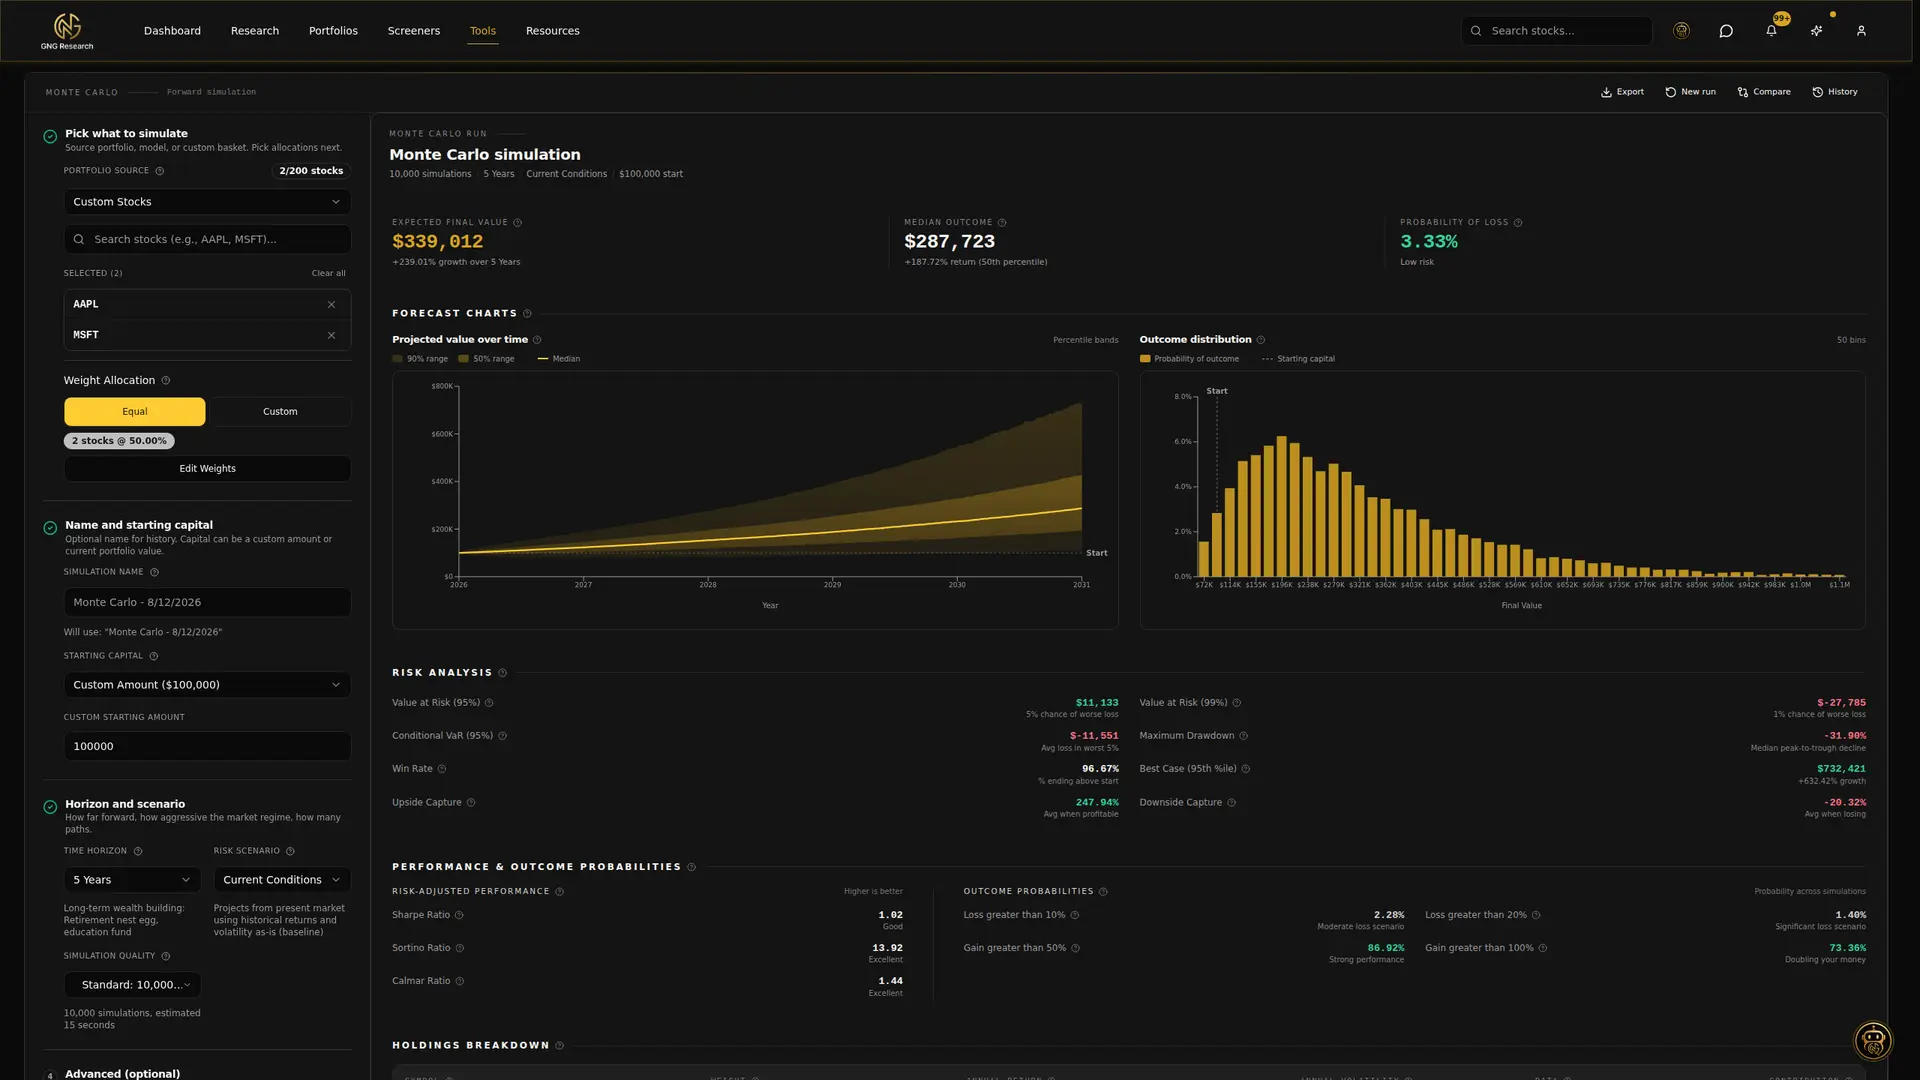
Probability bands, not a single guess
Results show the 5th, 25th, 50th, 75th, and 95th percentile paths of your portfolio value, so you can see the downside case before you find it the hard way.
Estimates, not predictions
Monte Carlo output is a probabilistic estimate for education and planning. It is not a prediction and not investment advice.
Save and compare
Keep simulations in history and compare scenarios side by side.
Create a free GNG Research account to get started.
Free to join. No credit card. Takes seconds.