

This is part 3 of the “How Big Could AI Get” series, where we take a Tom Lee (of Fundstrat) approach to bottom-up, first-principles investment research and then present the math-based results, even if the numbers seem insane 😂.
Part 1: The $5 Trillion AI Revenue Gold Rush: Why The Bubble Bears May Be Missing The Math
Part 2: The $4 Trillion AI Infrastructure Potential No One Is Talking About: Why Hyperscaler Capex Could 5.5X By 2030
We are planning a YouTube channel like “The Compound” where analysts (and teams of analysts) give their takes on investment and economic and member questions.
My favorite show is called “Hot Take With Adam & BARP.”
I would walk viewers through a “hot take” that seems crazy…but is 100% backed up by the math and then have my BARPiverse fact-checkers act as the straight man to my “wild-eyed Danny Ives style enthusiasm”🤣
Let me give you an example of a “hot take” that sounds crazy…until you check the math😉
Bottom Line Up Front: Nvidia has 122% to 185% Upside Potential Over The Next 1 to 2 Years (57% to 69% CAGR), and 5 Year Return Potential Is A Tad Bigger😉🥳🤑🤯
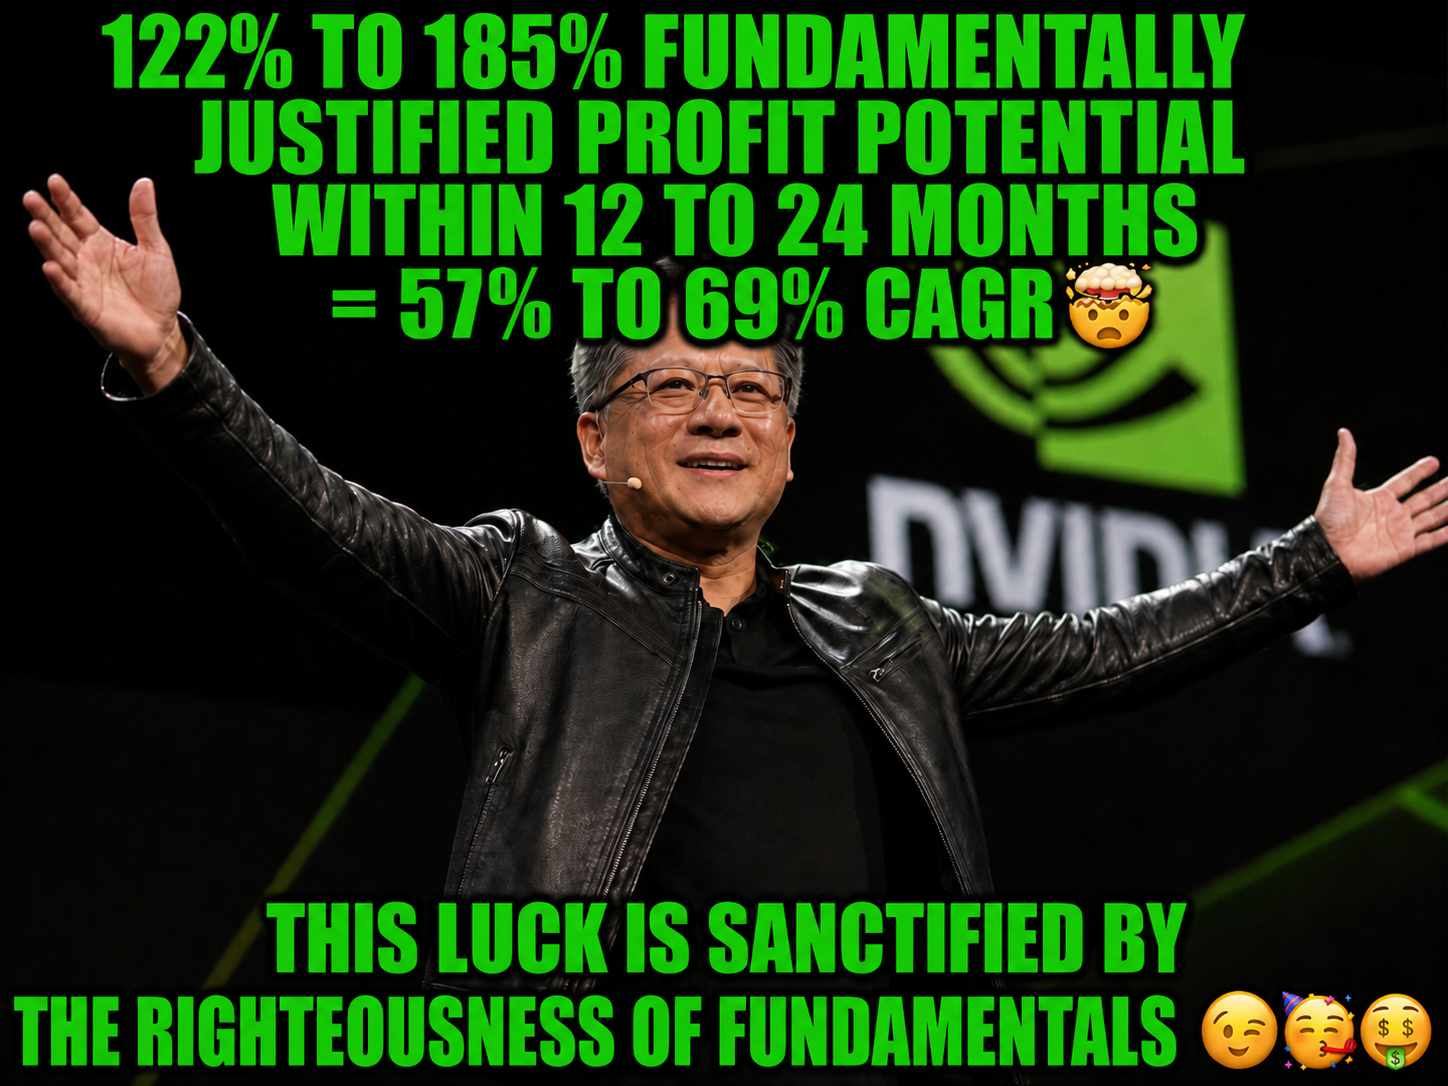

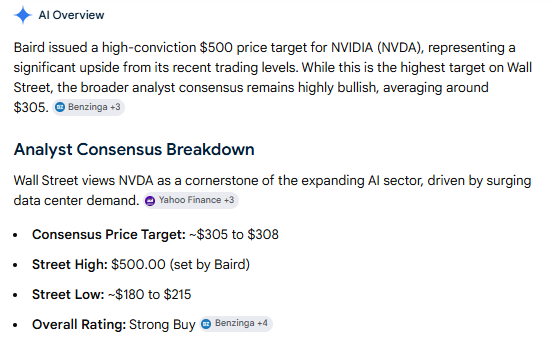
Let Me Walk You Through Baird’s $500 Price Target And Why It’s 100% Fundamentally Justified
If you take a look at the consensus estimates from 2027 and 2028, you can estimate the 12-month forward EPS, meaning the 12-month forward earnings for NVDA…but a year from now.
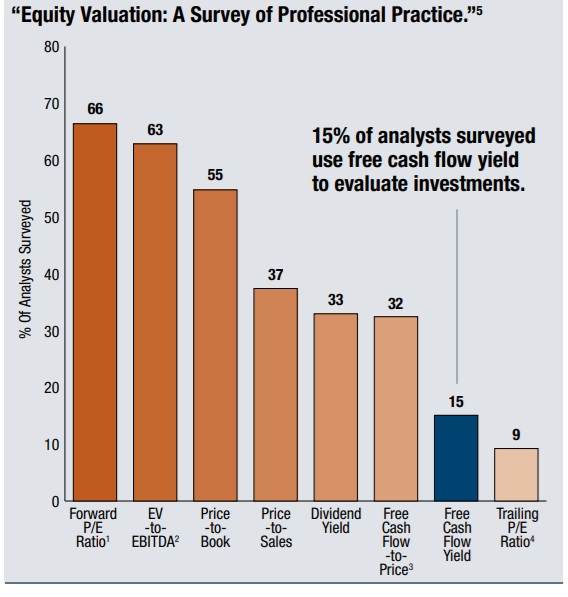
66% of fund managers (controlling 80% of fund flows) look at forward PE…so that’s why when asking “what valuation metric is Wall Street most likely looking at,” it’s usually forward PE.
Anthropic has tracked 20X sales.
Amazon 22X to 24X operating cash flow
REITs track FFO.
Currently, the forward EPS on NVDA is $10.23 and rising by the week (literally because 2027 becomes more important vs 2026 with every passing week), and 12 months from now, that is $13.22, and 24 months from now, it’s $14.61.
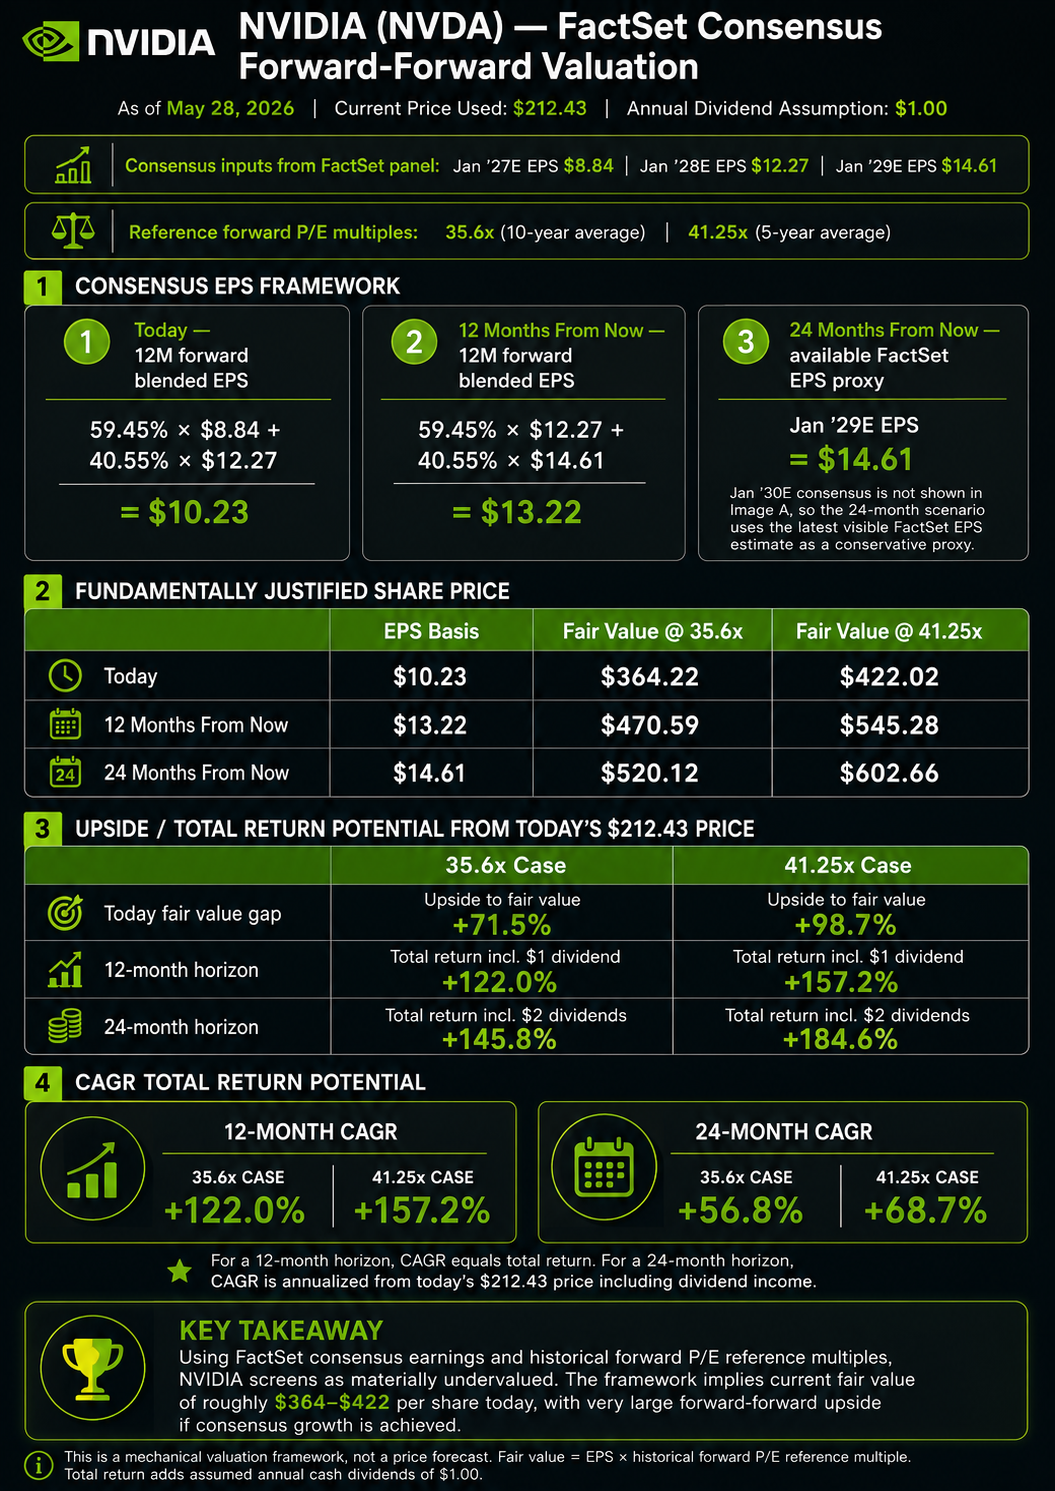
OK, so 12 months from now, when Baird is saying “$500 high conviction,” that means 37.8X forward PE in 12 months vs a 35.6X to 41.2X 5-10 year average forward PE. Is that reasonable? Yes. Do I think it will happen? That’s not how I think.

On Wall Street, smart investors make their own luck, so I always calculate the fundamentally justified upside potential and base my recommendations and investment thesis updates on it.
Applying the best available data X the market’s historical multiple during periods of similar conditions (growth adjusted) is the least speculative way to estimate returns.
“Nvidia’s new fair value is a PE of X or Y” that is speculative storytelling…the ZEUS portfolio operates on facts…and stories that explain the facts…not stories that attempt to front-run the facts.
OK. So now that I have shocked you with some really cool (yet 100% fact-based) return potential math…let me answer the question that I’ve been working on for almost a week.
What is the maximum revenue potential of AI by 2030…and what does that mean for Hyperscaler Capex (50% of which goes to Nvidia)?… And so what does that mean for Nvidia’s potential share price and total return in 2030?
The Shocking Investment Return Potential Of Nvidia By 2030: AKA Fun With Infographics!😉
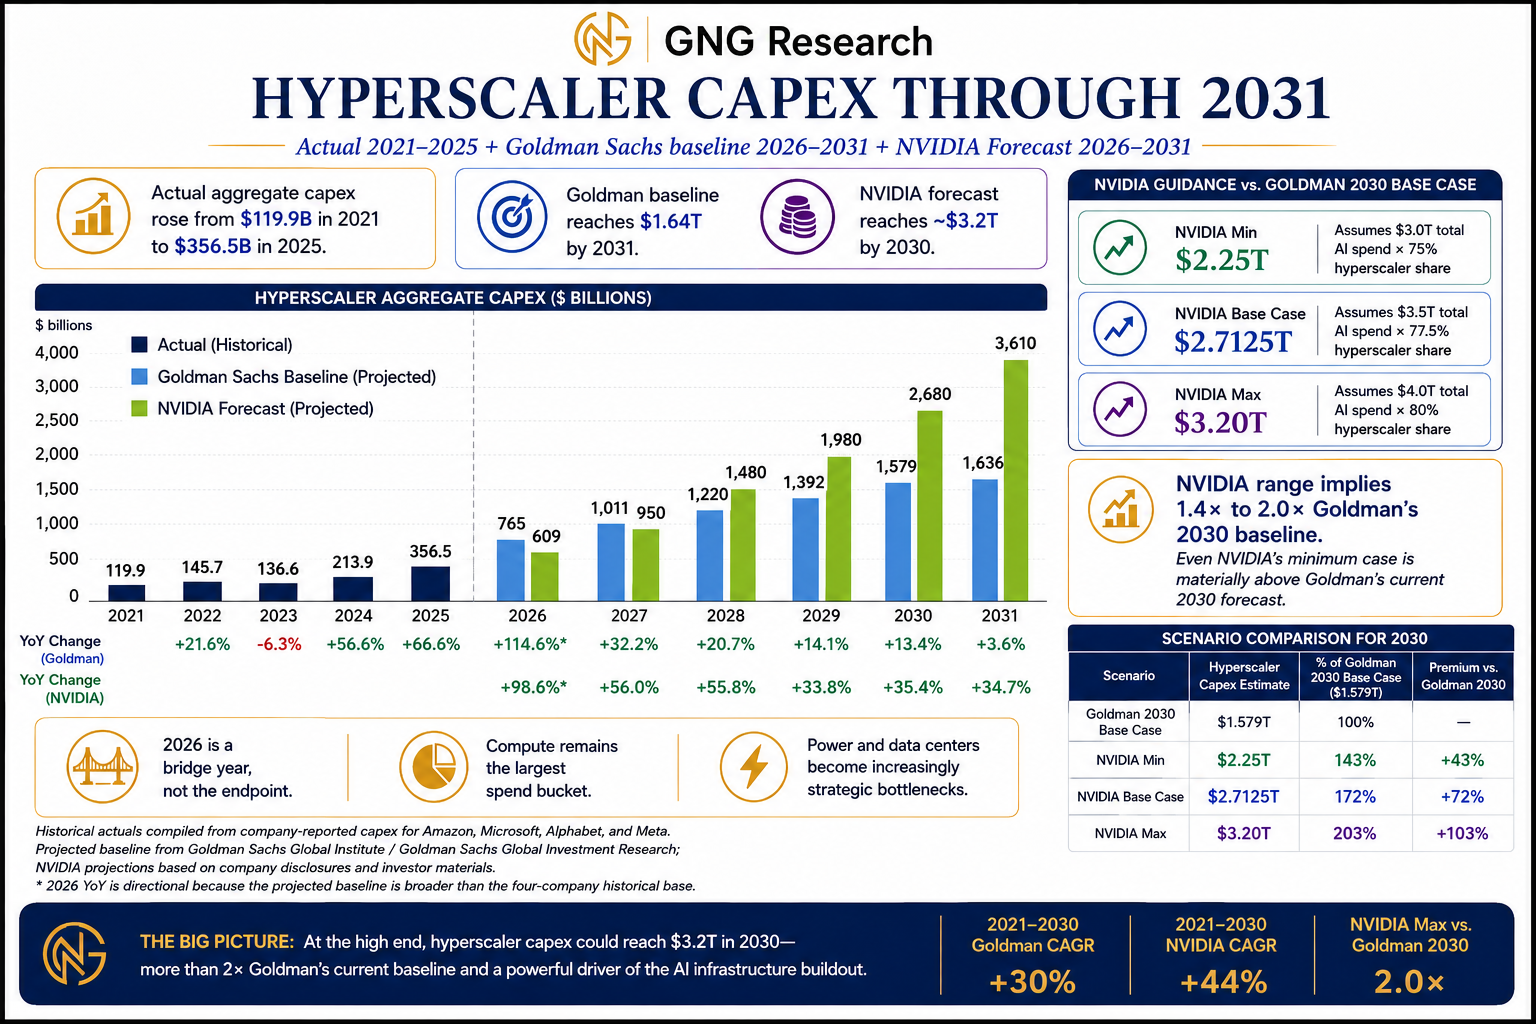
OK, so let’s start with this really important chart. It shows Goldman’s base case for hyperscaler capex spending through 2031. And then we apply the $3 to $4 trillion chart from Nvidia (that 4 other analyst firms now agree with).
Note that the 2026 estimates are lower for the Nvidia forecast BECAUSE the estimates for 2026 and 2027 are rising so quickly.
Here is The Consensus For Hypercalers 2 weeks after Earnings Day (April 29th)
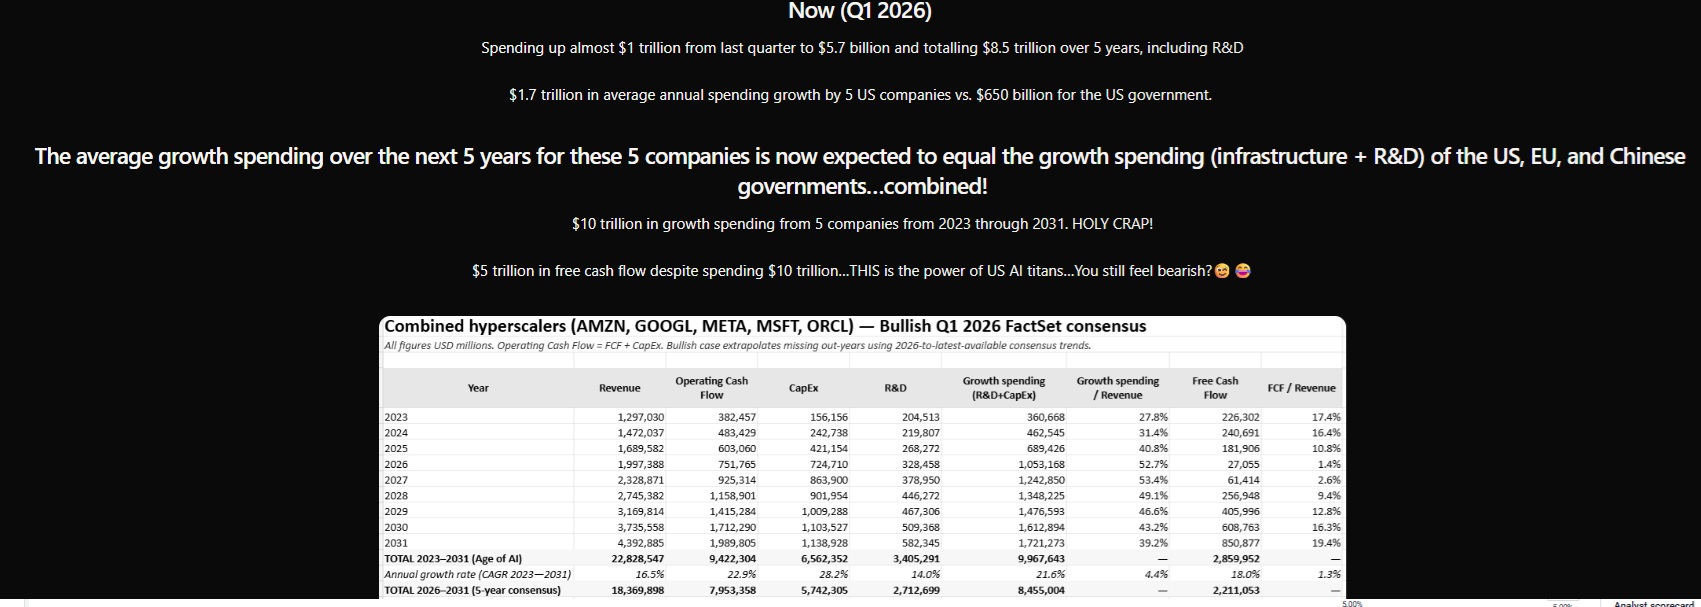
$863 billion in growth capex for next year…and within 2 weeks of that estimate, Moody’s, Goldman & Morgan Stanley all said $1 to $1.1 trillion.
Thus, the reason it’s valuable to calculate the maximum potential the numbers might rise to.
It’s the conspiracy of silence. “The growth capex numbers that must not be named😉” aka “Growth capex whisper number that sounds so crazy no one will raise estimates UNTIL we all raise them at the same time.😂CYA!🤣
Note that the capex consensus for 2029 was “just” $901 billion, and Morgan Stanley’s estimates of $1.1 trillion are now what analysts (just 3 weeks ago) thought hyperscalers would be spending in 2030!
Goldman's base-case is now $1.636 trillion for 2031…which is 44% higher than the consensus…from 3 weeks ago!
Quick Update: The Numbers Keep Getting Bigger
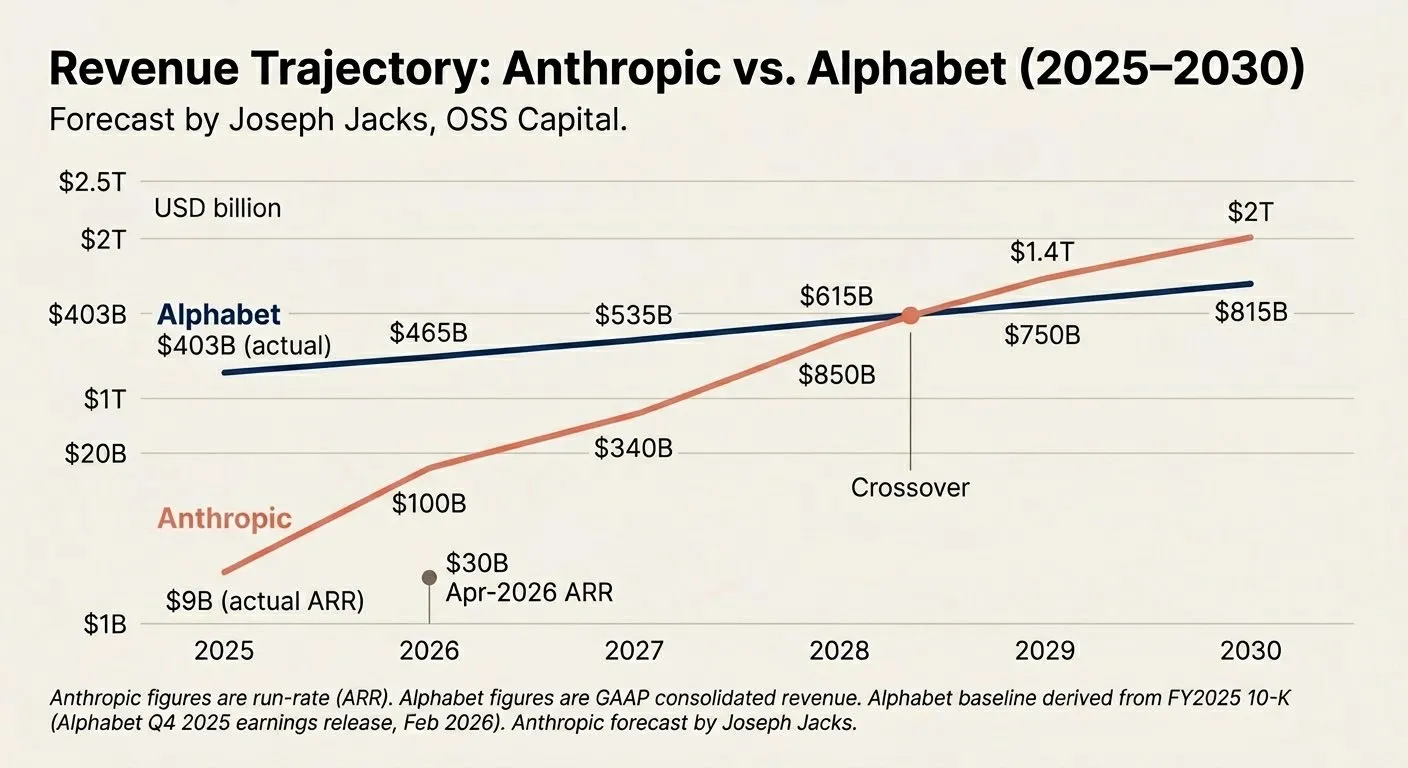
Joseph Jacks of OSS Capital is the first analyst offering a 2030 revenue forecast for Anthropic. And his model (while almost certainly wrong) is useful in that it provides 2 important takeaways (if it is directly correct).
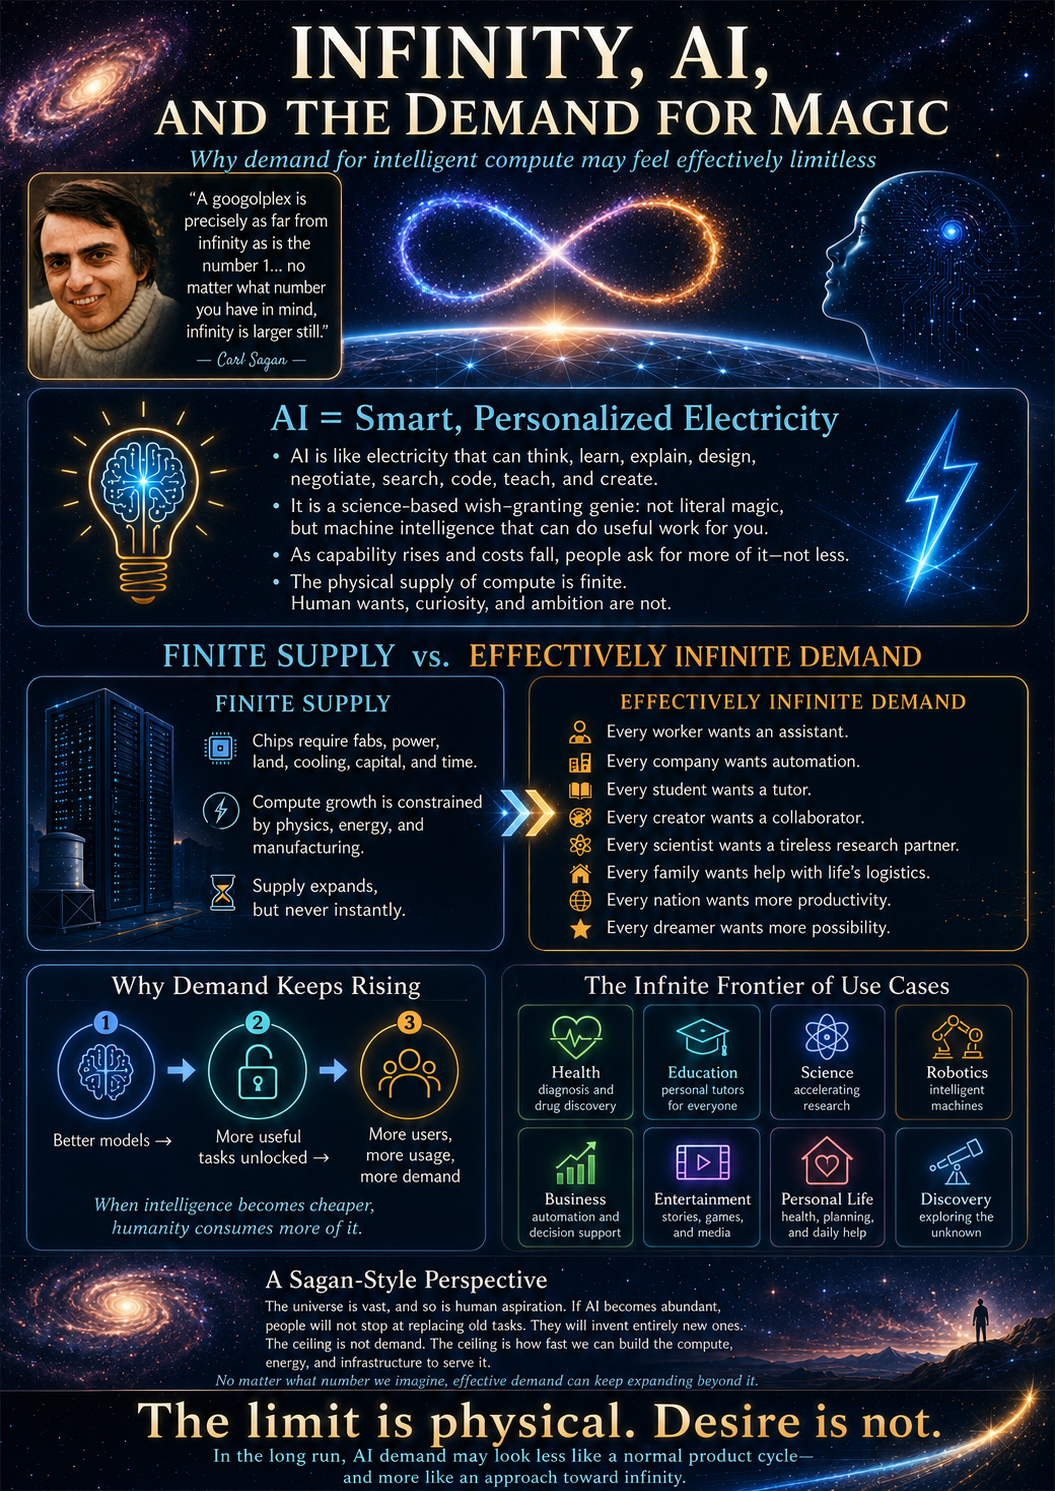
Here is the best explanation I’ve yet seen for my (and David Blundin’s) hypothesis that compute constraint is the new normal. A permanent state of affairs, and just like Carl Sagan’s wonderful explanation for infinity. “No matter how large the number you think of, infinity is larger”.
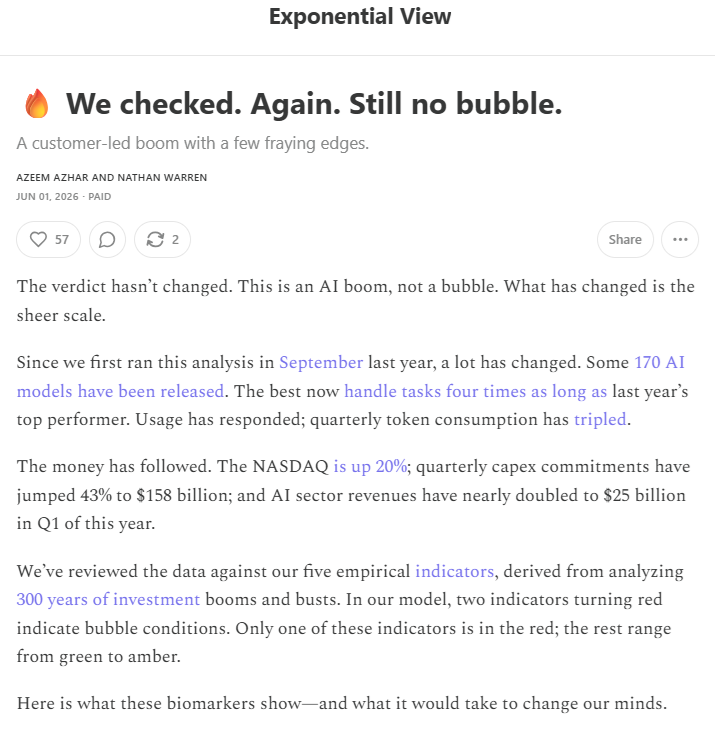
And Here’s What That Means On An Annualized Basis
A 4X-per-year improvement rate is Jensen's law. His 1 million X improvement over 10 years = doubling every 6 months. AI capabilities, as measured by Expontential View's model, are doubling... every 6 months. Just as Nvidia is guiding for.
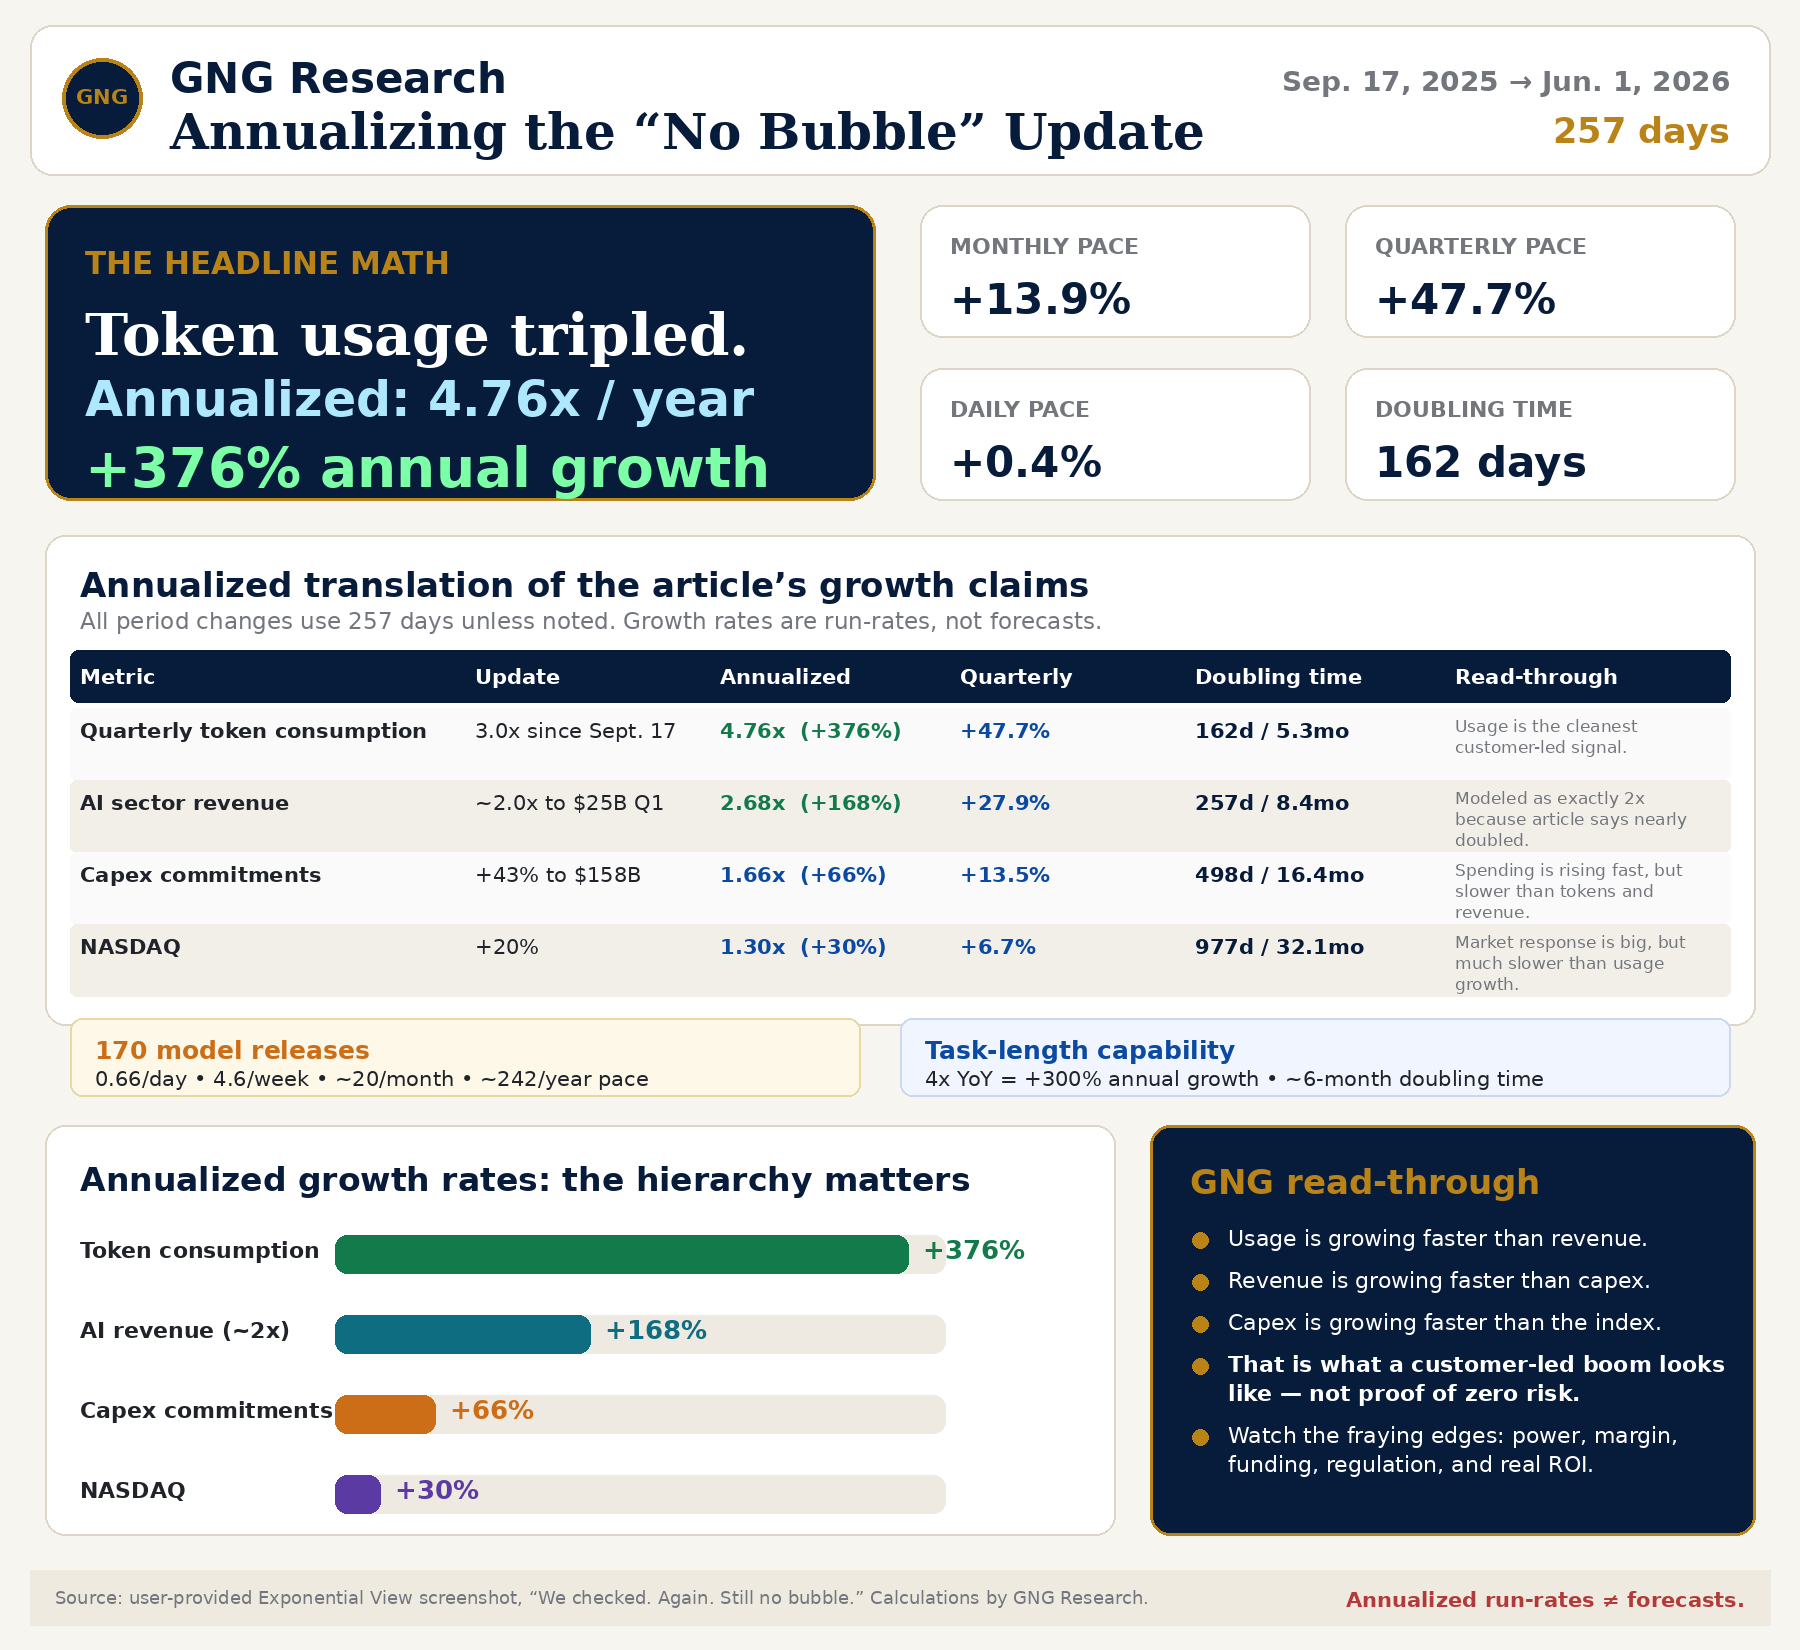
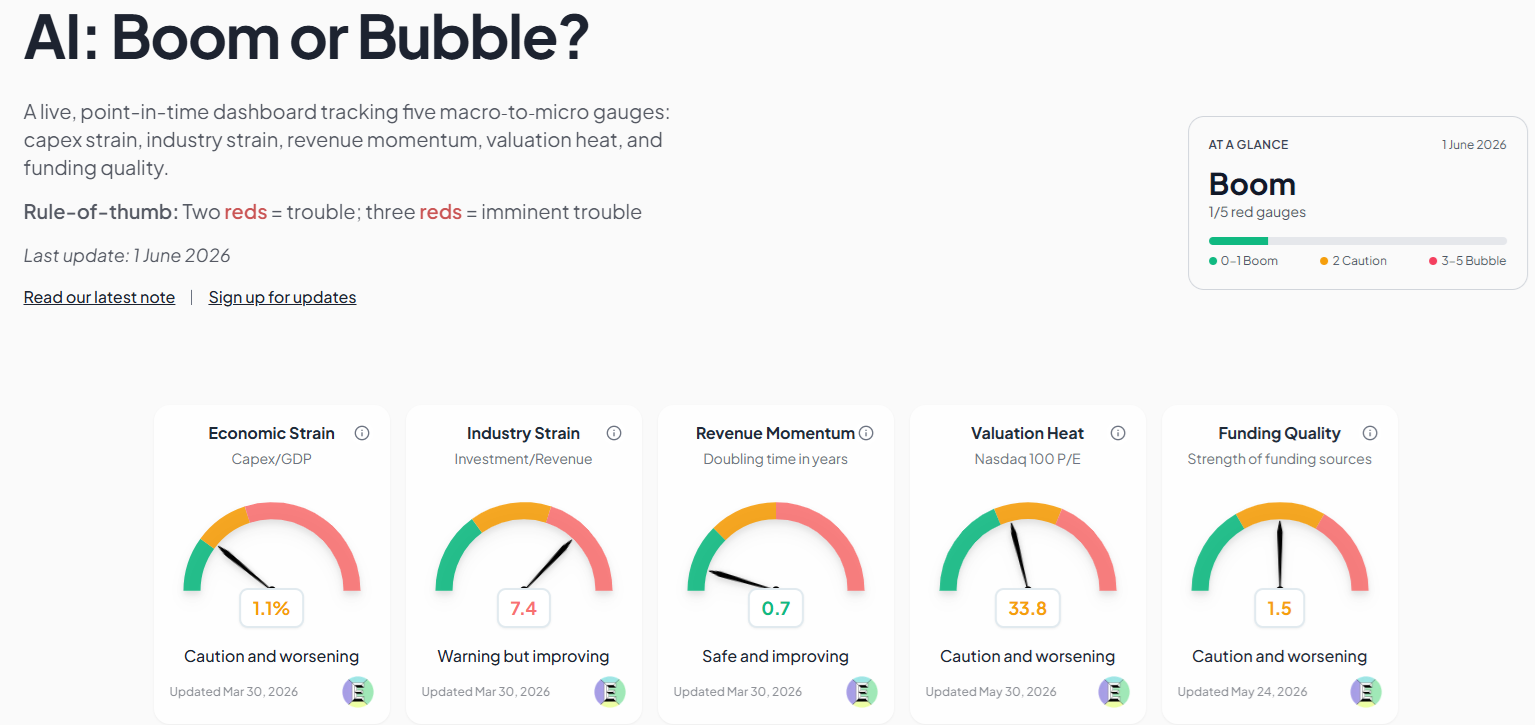
Thank you, Azheem, for your incredible work…Exponential View has studied all 22 previous bubbles, going back to the first one (Dutch Tulip Mania), and created a model that tracks (with weekly data updates) the AI boom and watches for a sign of a bubble.
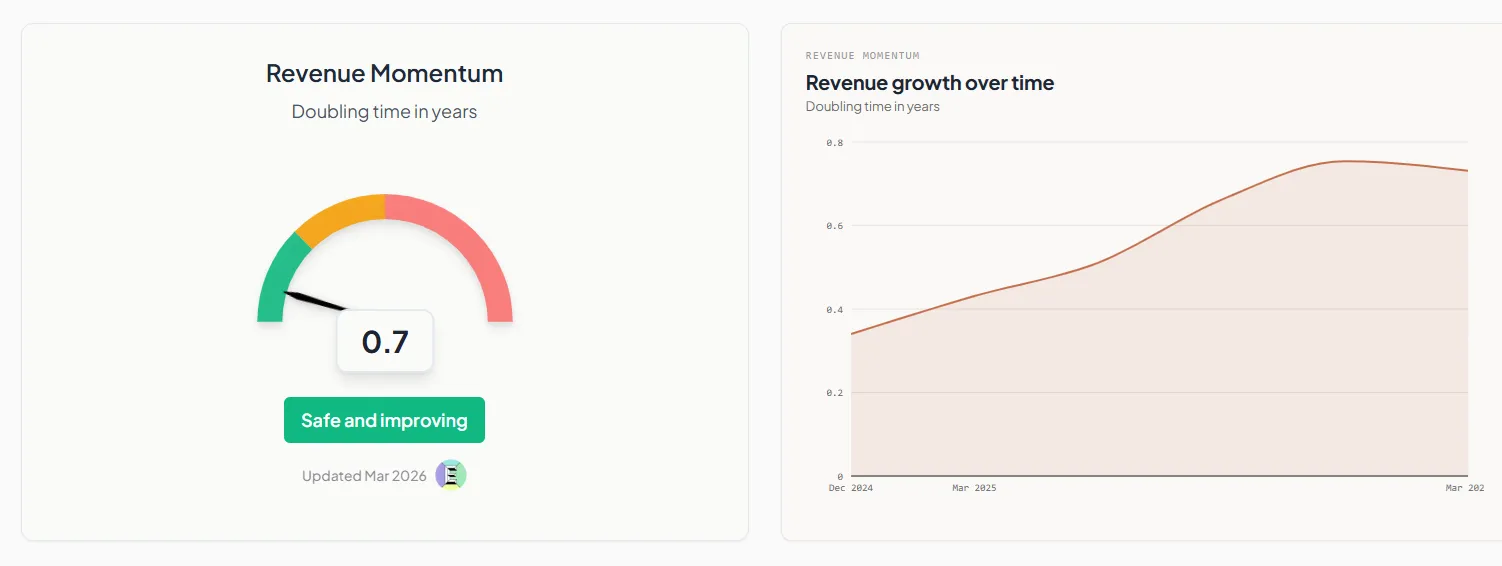
The Revenue Growth Rate is completely different. This Time Really IS Different (For Now)
By the way, Azheem is estimating $25 billion per quarter in AI revenue vs $112 billion ARR from Microsoft + Anthropic + OpenAI. So he is being conservative on purpose😉
That's the revenue doubling time. 8.4 months. 50% to 106% CAGR revenue growth for Microsoft, Anthropic, and OpenAI alone through 2030 = $650 billion to $2 trillion revenue = justifies the capex boom (JPmorgan, and Bain)
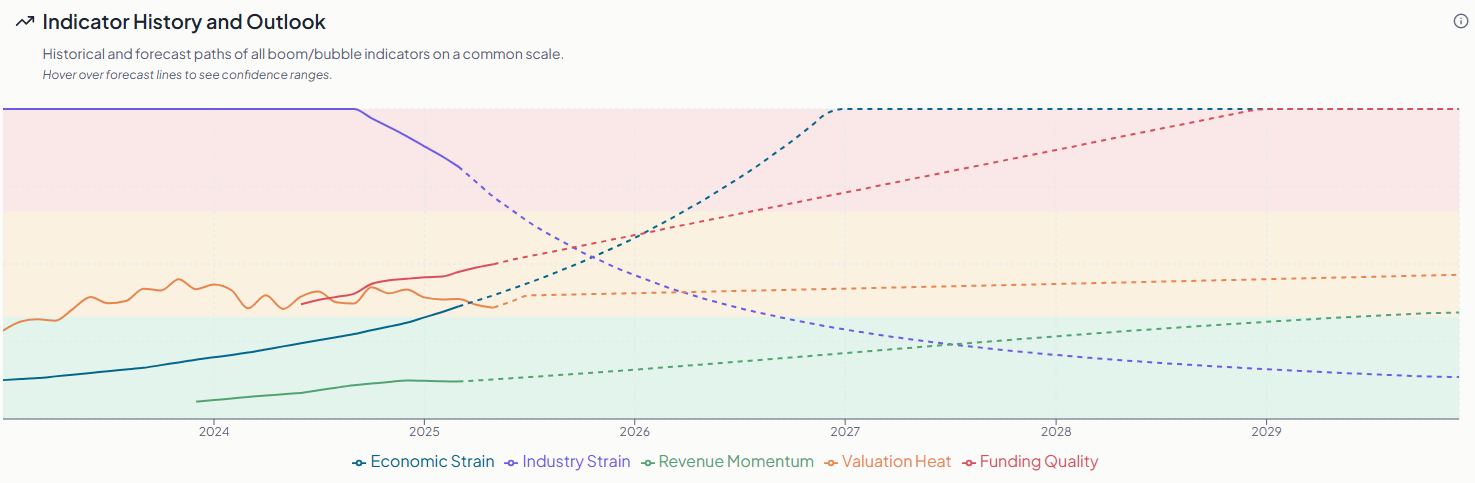
So based on his model, by the end of the decade, we'll have 2/5 showing red due to the size of the AI spending (the $3 to $4 trillion per year up to $5.33)
So...people in 2030 will be worried about a bubble due to more debt funding and we'll be watching the leverage ratios of the hyperscalers like a hawk...but no...there is no indication of a collapse like 2000...not in the next 4 years. 5 years per Goldman's estimates of rising capex every year (and FCF would explode at the rate they are forecasting).
But here is perhaps one of the most important charts that investors need to know.
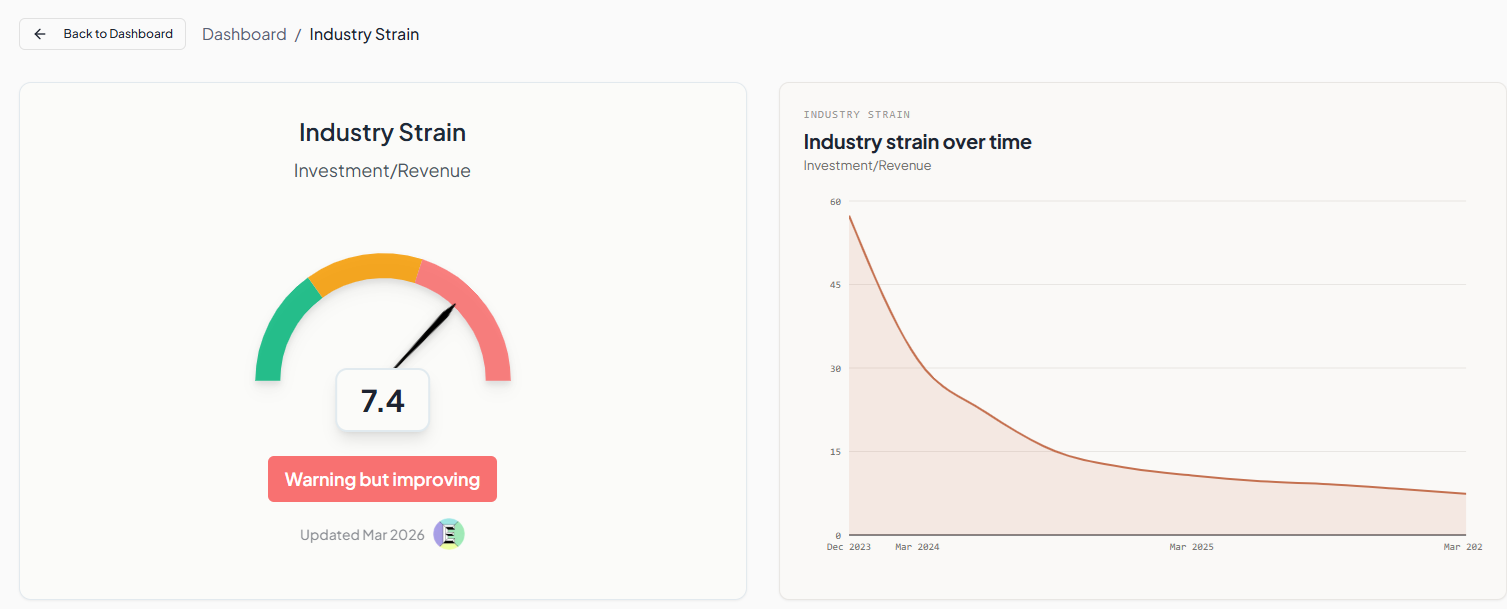
At the start of 2023, AI spending/revenue was 57… It’s now 7.4, and Azheem’s model expects it to continue improving steadily through the end of 2029.
Sign in to leave a comment and join the discussion.
Sign Up Free