

A single stock idea used to cost me an entire evening. Twenty browser tabs, numbers copied by hand into a spreadsheet, and the low hum of suspicion that I had missed the one filing that actually mattered.
That whole process now takes about fifteen minutes.
I want to show you exactly how, starting from zero. No jargon, no assumed knowledge, no skipped steps.
One thing before we start, because I'd rather set this straight now than have you disappointed at step nine. The AI Analyst isn't a stock-picking oracle and I don't want you treating it like one. Think of it as a research analyst who works at machine speed. It pulls live prices, fundamentals, dividends, earnings, filings, and news, then renders the evidence as interactive charts right inside the conversation.
What it kills is the tab sprawl. It won't do the thinking for you, and that part stays yours.
Everything below runs on the console's built-in capabilities. No add-ons, no marketplace agents, no custom setup. If you can type a question, you can do all of this.
Here is where we are going: get logged in, run a screen, take one company apart, then save the work so it survives a closed tab. Let's get to it.
Bookmark this page for you to reference how to use the GNG AI Analyst.
Part 1: Getting In
Step 1: Open the AI Console
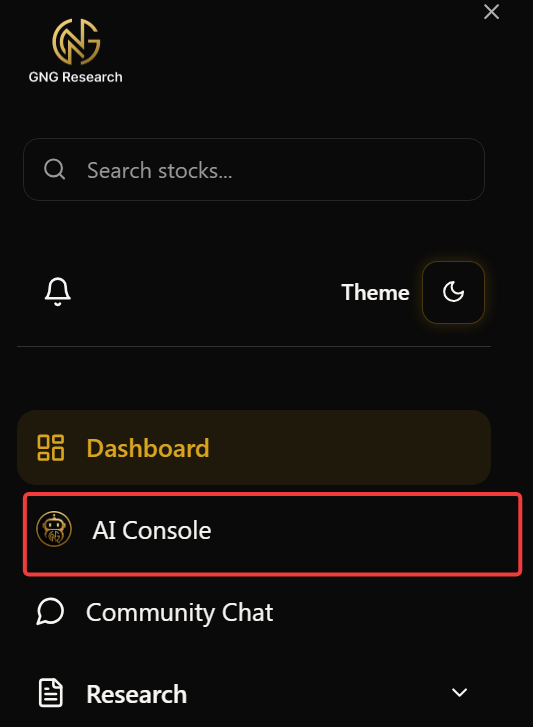
Log in at gngresearch.com and open the AI Console from the main navigation. You land in a chat workspace, with a message box at the bottom and your saved conversations down the left side. That message box is the entire interface. There's no query builder to learn and no filter panel to configure, because you type English.
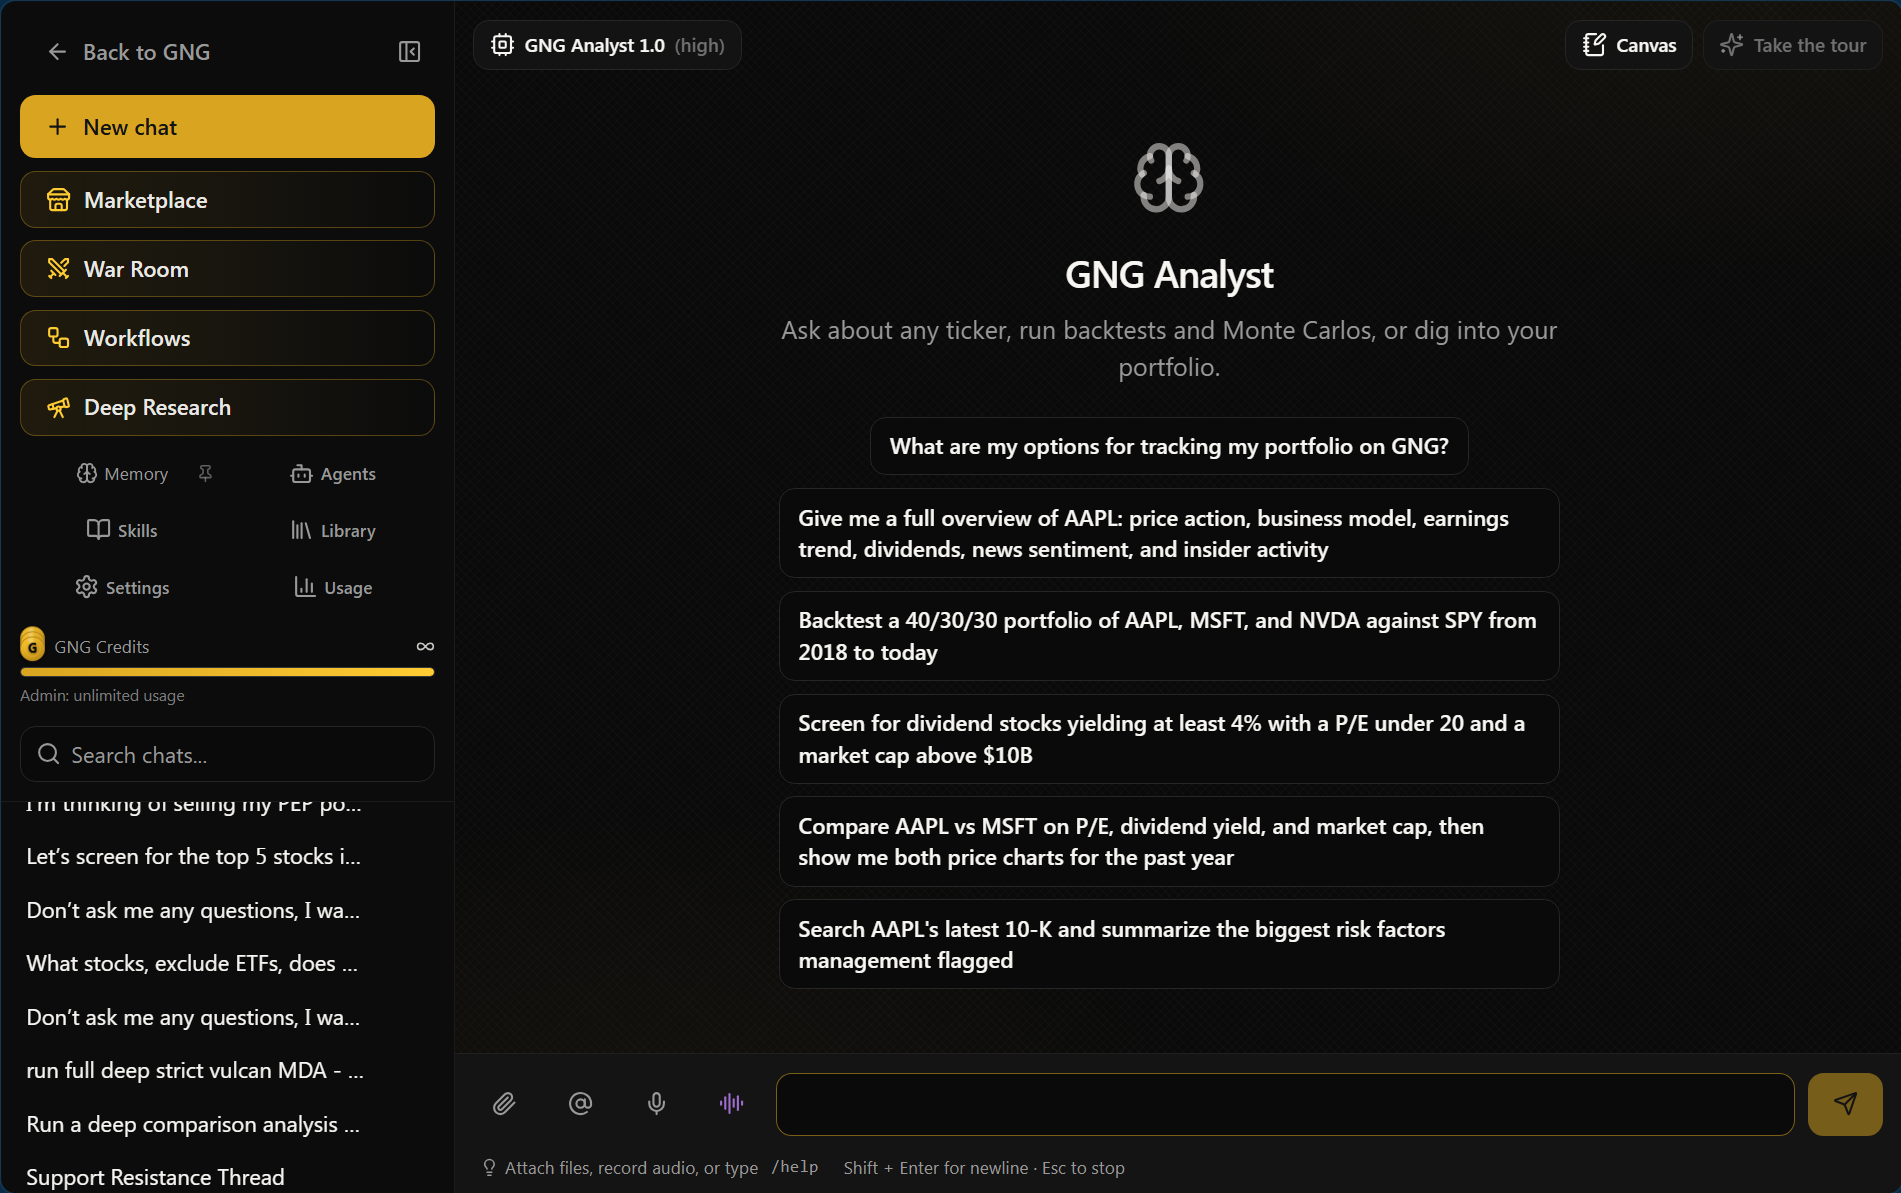
There's also a floating AI widget on other pages of the site, that small panel in the corner, which is handy for quick questions while you're reading an article or checking your portfolio. It shares the same chats as the full console. Stay in the full console for this walkthrough, though. The charts need the room.
Step 2: Start a chat and find the fuel gauge
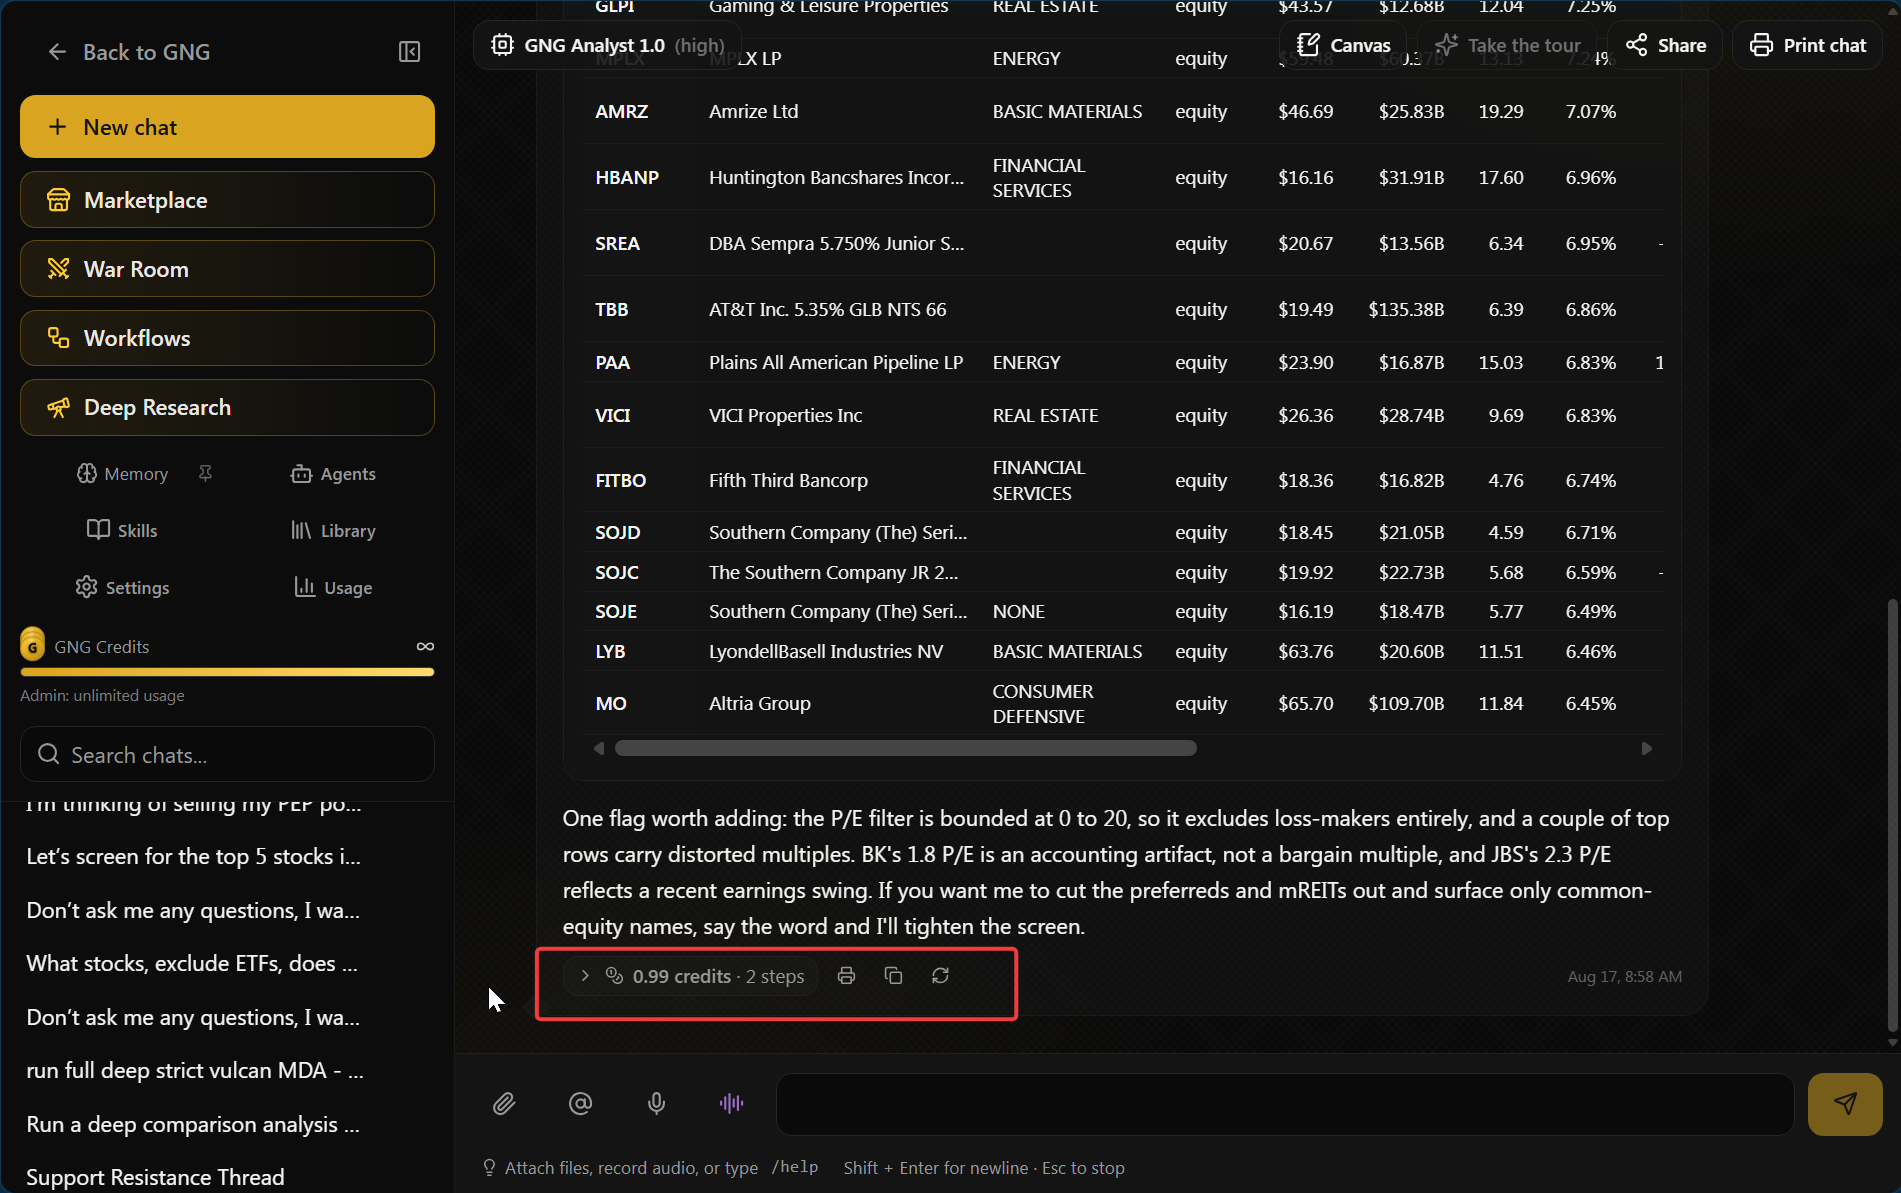
Click New Chat. Before you type anything, find the GNG Credits meter. Every question spends a small number of credits, and the meter shows your balance and when it refills. Free accounts get a working allowance, so you can follow this entire guide without paying a cent.
Don't obsess over the meter, though. A typical question costs pennies worth of credits, and a glance at the gauge beats wondering about it.
Part 2: Finding Candidates
Screening is the skill almost nobody teaches, with any tool. And the goal isn't to find the best stock, which doesn't exist in a form anyone can identify in advance. You're shrinking thousands of tickers down to a shortlist that fits your strategy, so your limited attention only gets spent on candidates that already qualify.
That reframe matters more than any single filter you'll set.
Step 3: Tell it what you actually want, in plain English
Decide what kind of investor you're being today. Income? Growth? Some of both?
Then say it the way you'd say it to a human analyst sitting across a desk from you. Type this into the message box:
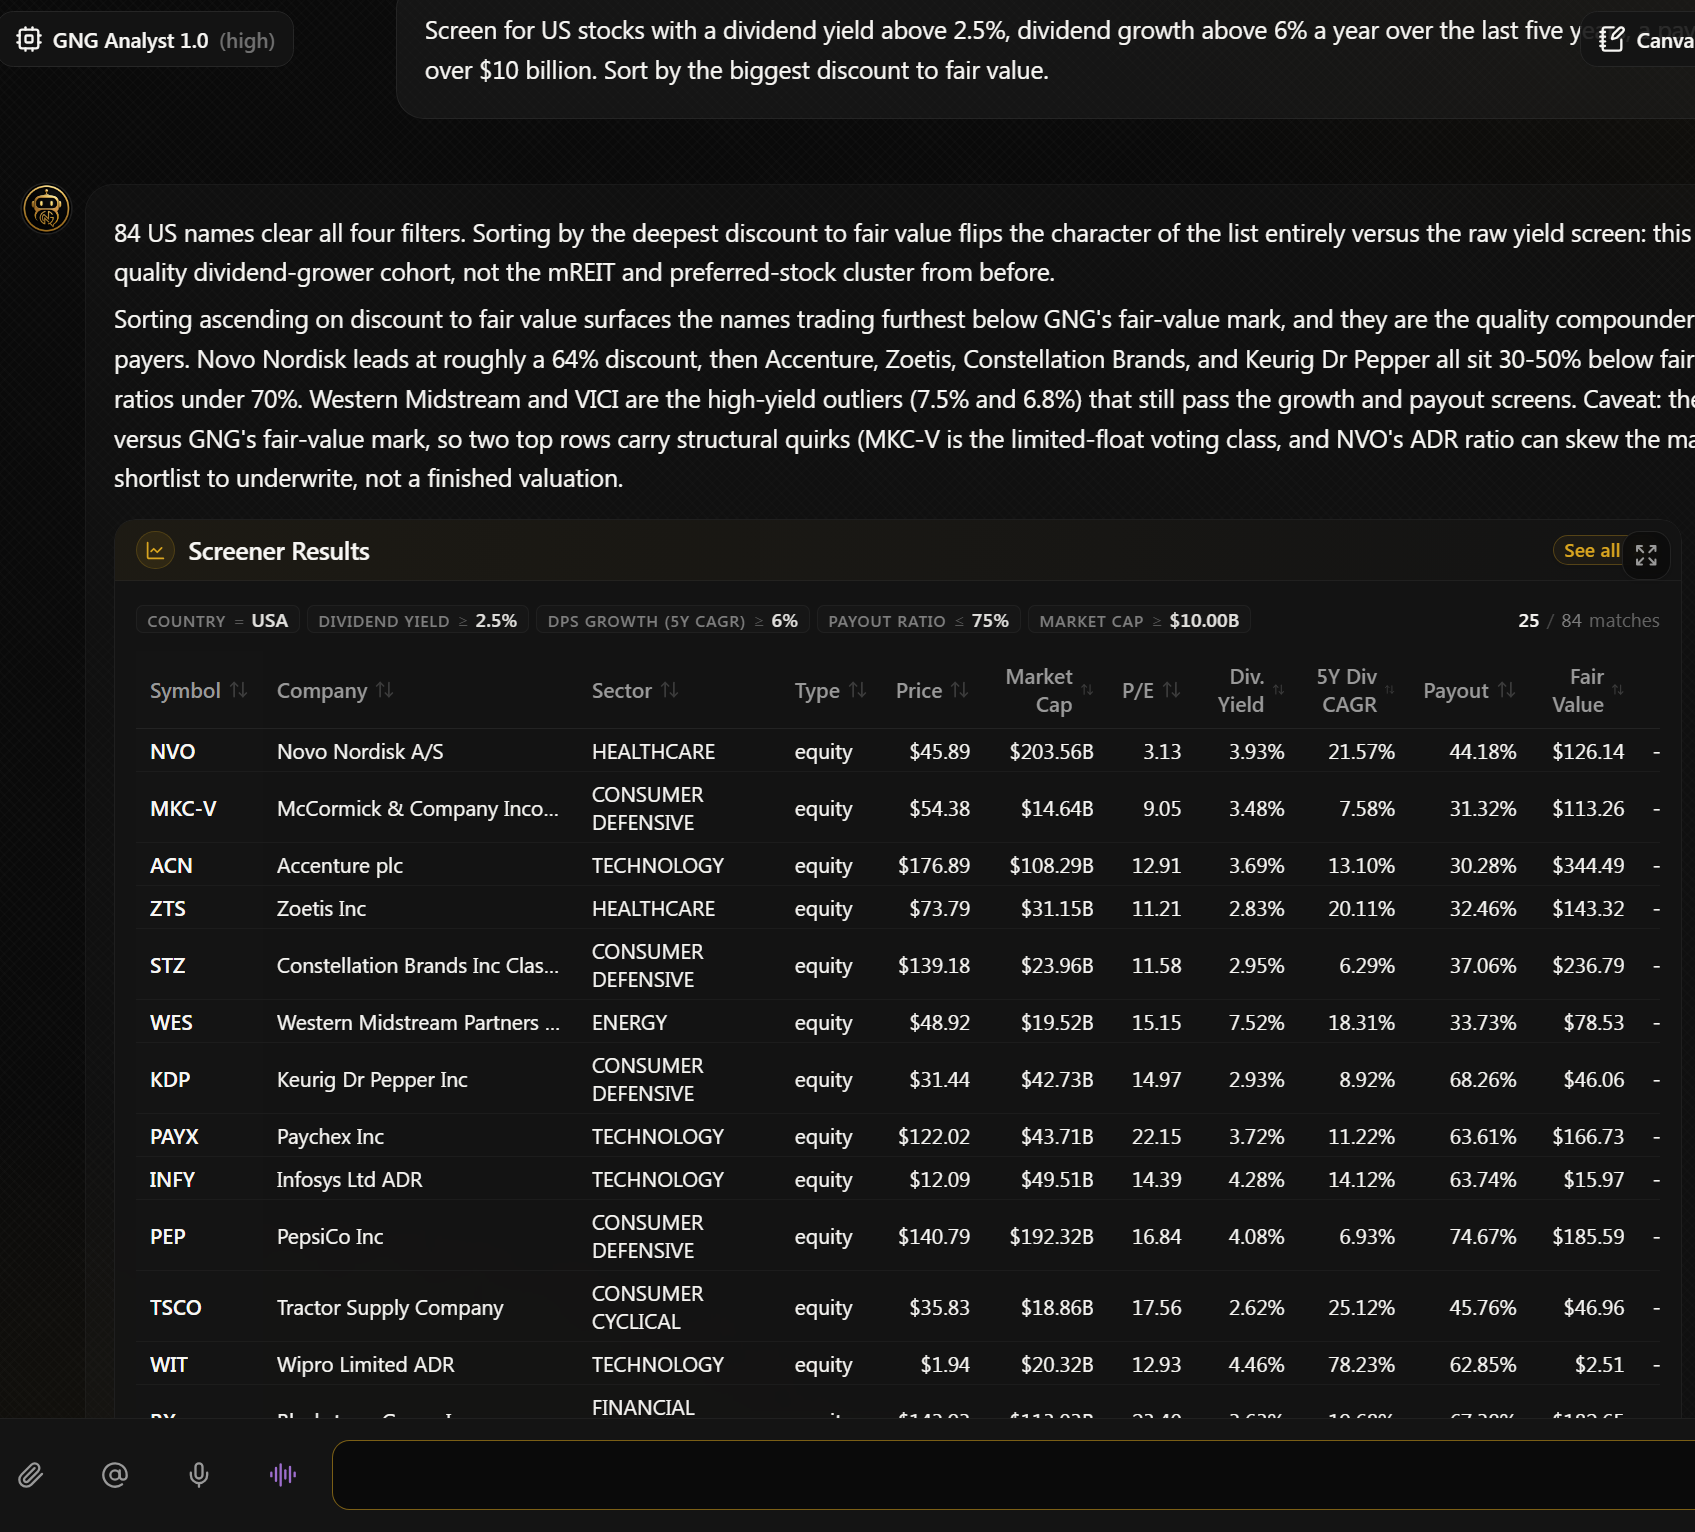
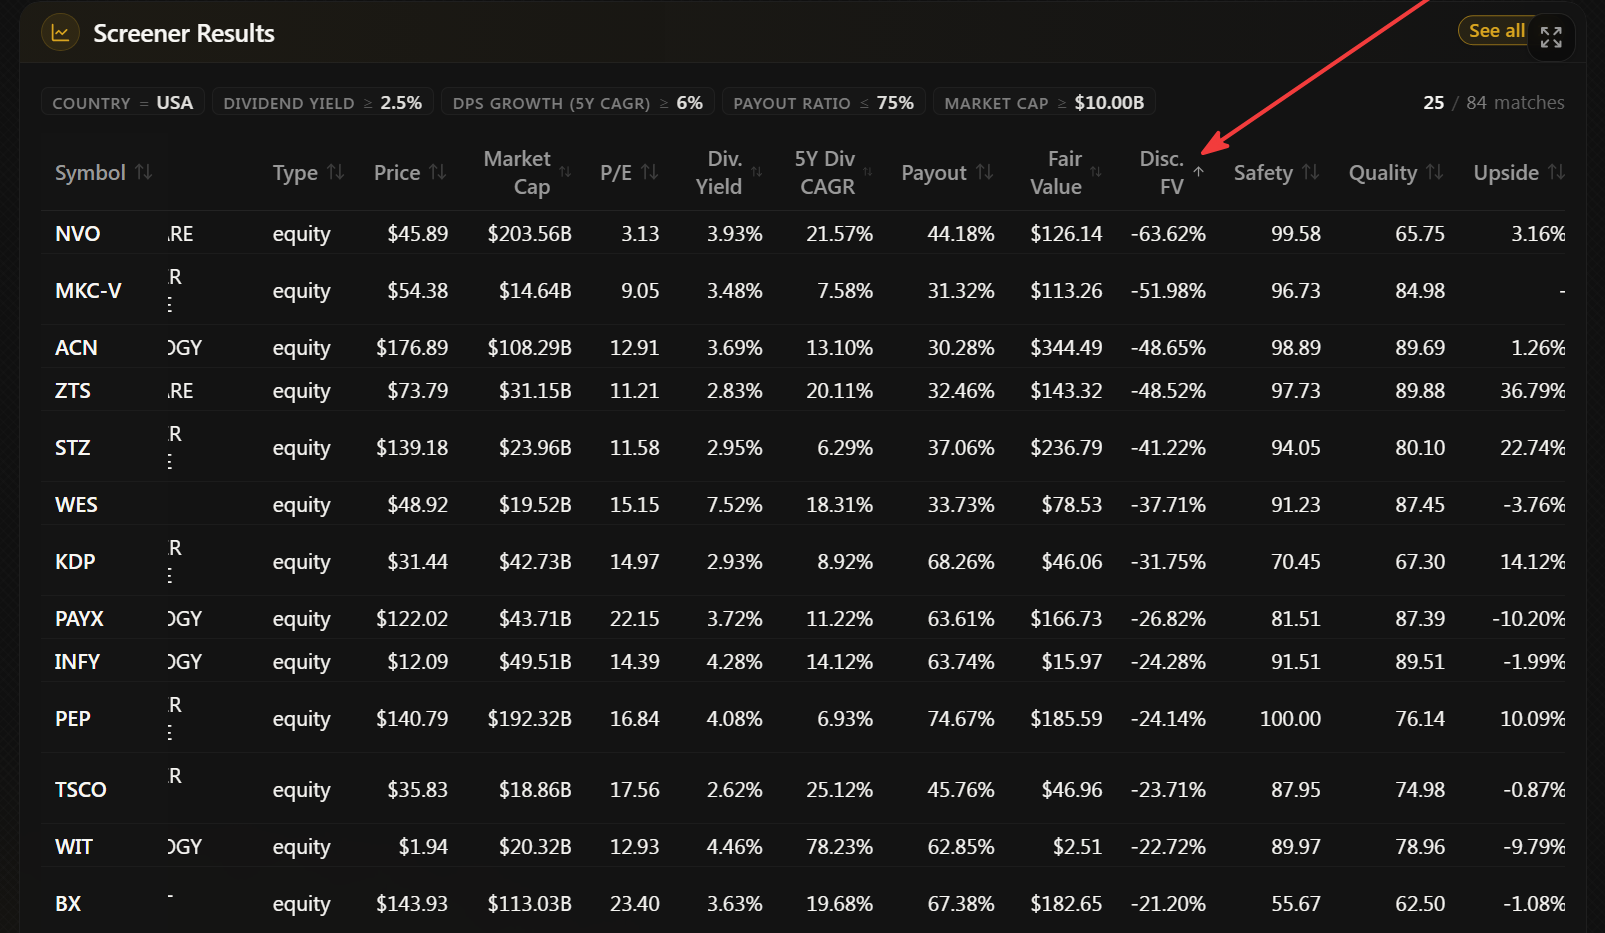
Screen for US stocks with a dividend yield above 2.5%, dividend growth above 6% a year over the last five years, a payout ratio under 75%, and a market cap over $10 billion. Sort by the biggest discount to fair value.
Press enter and watch. The AI turns that sentence into a real screen across roughly 5,000+ stocks and hands back an interactive results table, right there in the chat. Notice you never had to learn what any of those filters is called inside the database. It’s running Research Terminal for you!
When done you can click the screen results (right where it says screener results) directly in your AI window and it will open a new tab/window in the research terminal tool with this AI generated screen all done for you.
Step 4: Read the results table like an analyst, not a lottery player
Every column here is saying something. Yield is what the stock pays you today. Dividend growth is whether that paycheck is outrunning inflation. Payout ratio is whether the dividend is comfortable or stretched, and discount to fair value is whether you're being offered the business on markdown or on markup.
If a column means nothing to you, ask. "What does payout ratio actually measure?" is a perfectly good use of a credit, and you'll get a plain-English answer in the same thread you're already working in. Also GNG AI Analyst begins to learn on your skill level and will slow adapt to how you work, research, and learn best.
Now here is the habit that separates a real screener from a list collector: be suspicious of the top row.
The deepest discount is usually discounted for a reason. In my experience the names worth your time sit in the middle of the table, solid in every column and spectacular in none. That's my preference rather than a law of nature, so hold it loosely.
Step 5: Refine by talking, not by starting over
You're probably expecting to go back and rebuild the screen with different settings. You don't. You just keep talking.
Only show me ones outside the technology sector.
Or:
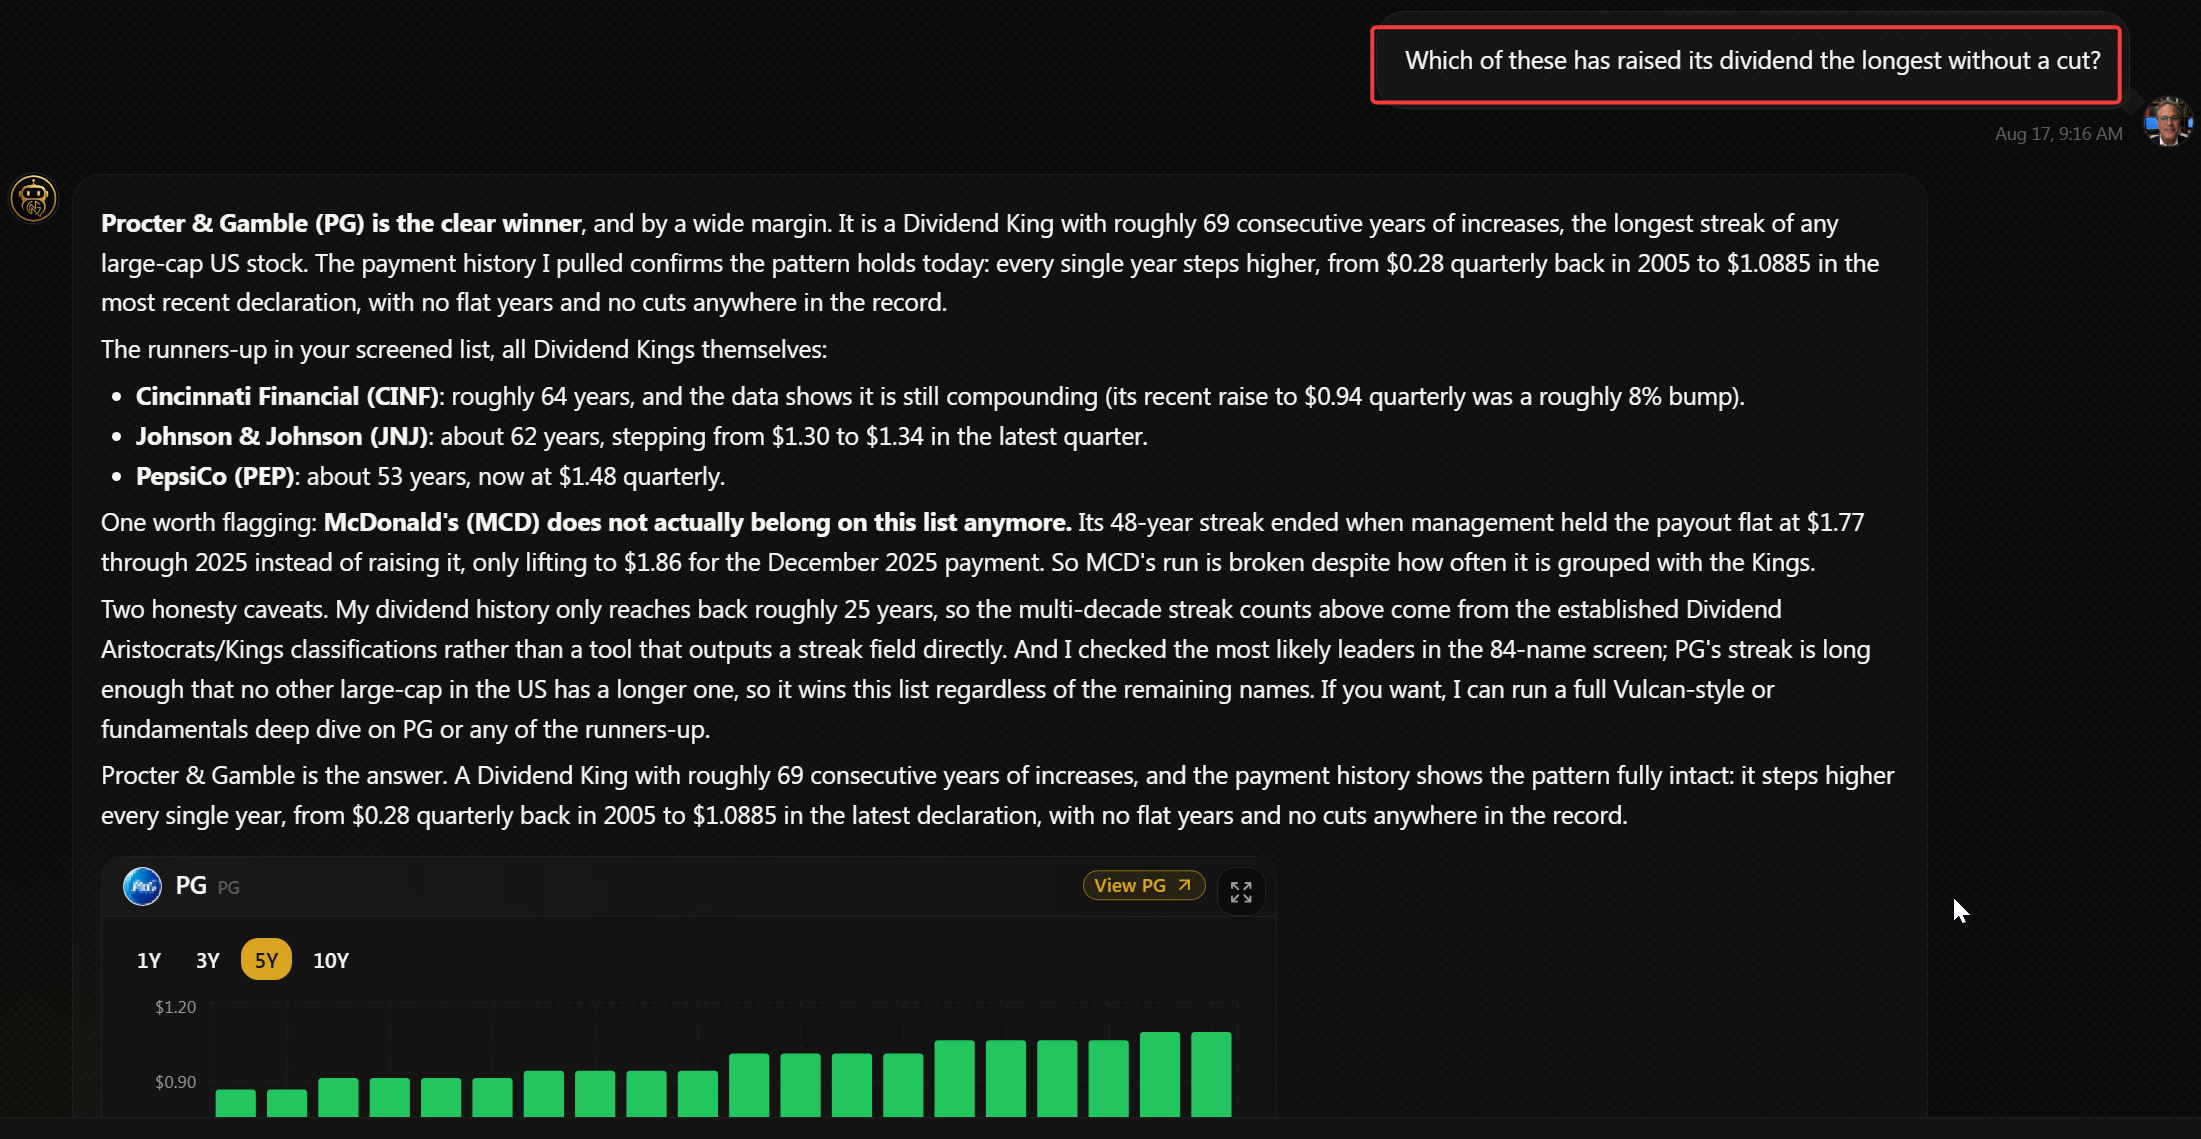
Which of these has raised its dividend the longest without a cut?
The thread remembers everything you've said. Each refinement narrows the field, and two or three in, you should be looking at five to ten names instead of thousands. That's a shortlist.
Pick the one you find most interesting, because we're about to take it apart.
Part 3: The Deep Dive
For the rest of this guide I'll use Broadcom (AVGO) as the worked example. It's a name most readers recognize, which makes the screenshots easier to follow, and nothing here should be read as a recommendation to buy it. Substitute any ticker off your own shortlist, because every prompt below works the same way.
Step 6: Get the full overview in one question
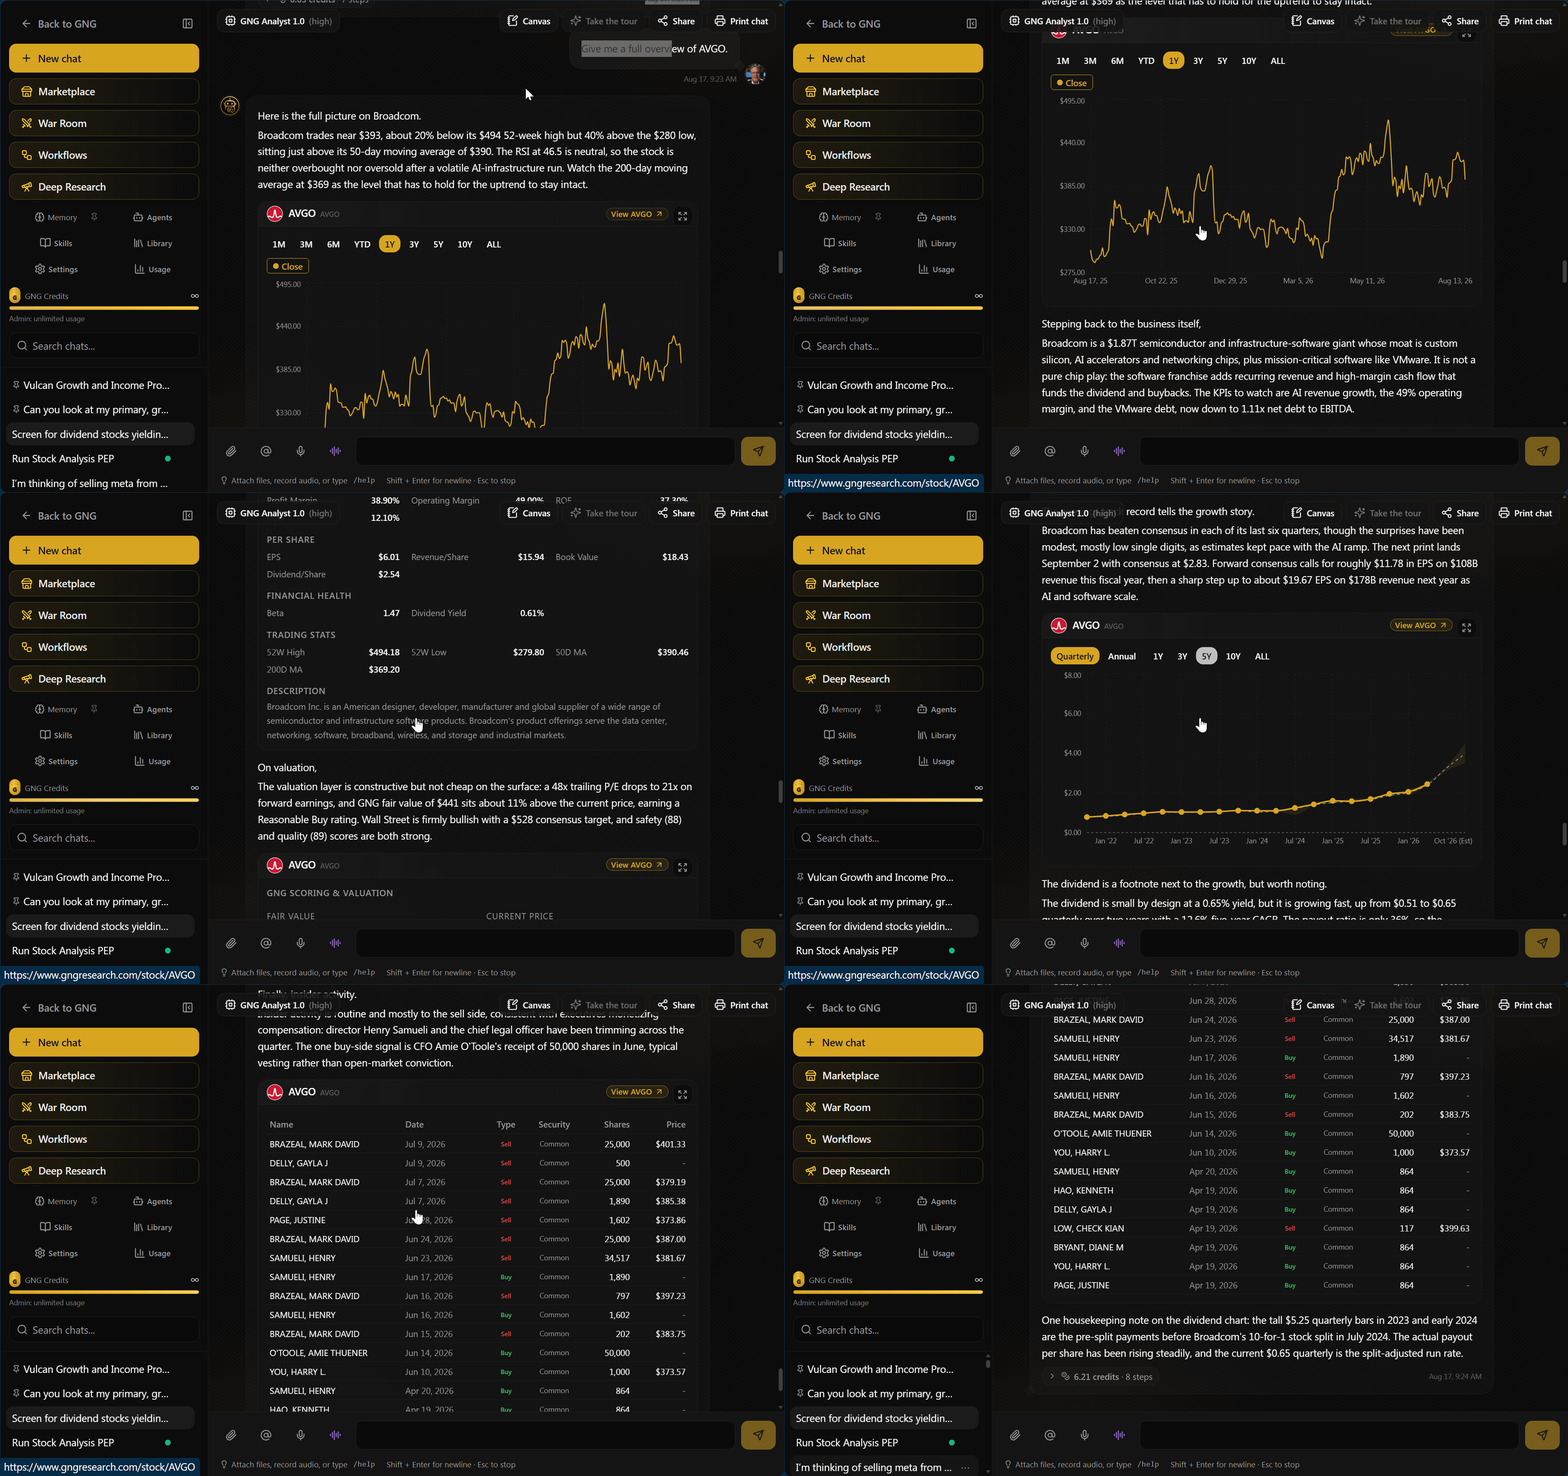
Give me a full overview of AVGO.
That single sentence replaces what used to be an hour of assembly work. Back comes a price chart, a company profile, the earnings record against estimates, the dividend history, news sentiment, and recent insider activity, each chart carrying a written interpretation above it.
Don't just look at the pictures. The paragraph above each chart is where the analyst tells you what it actually means, and it's the part almost everyone skips.
Step 7: Check the earnings engine
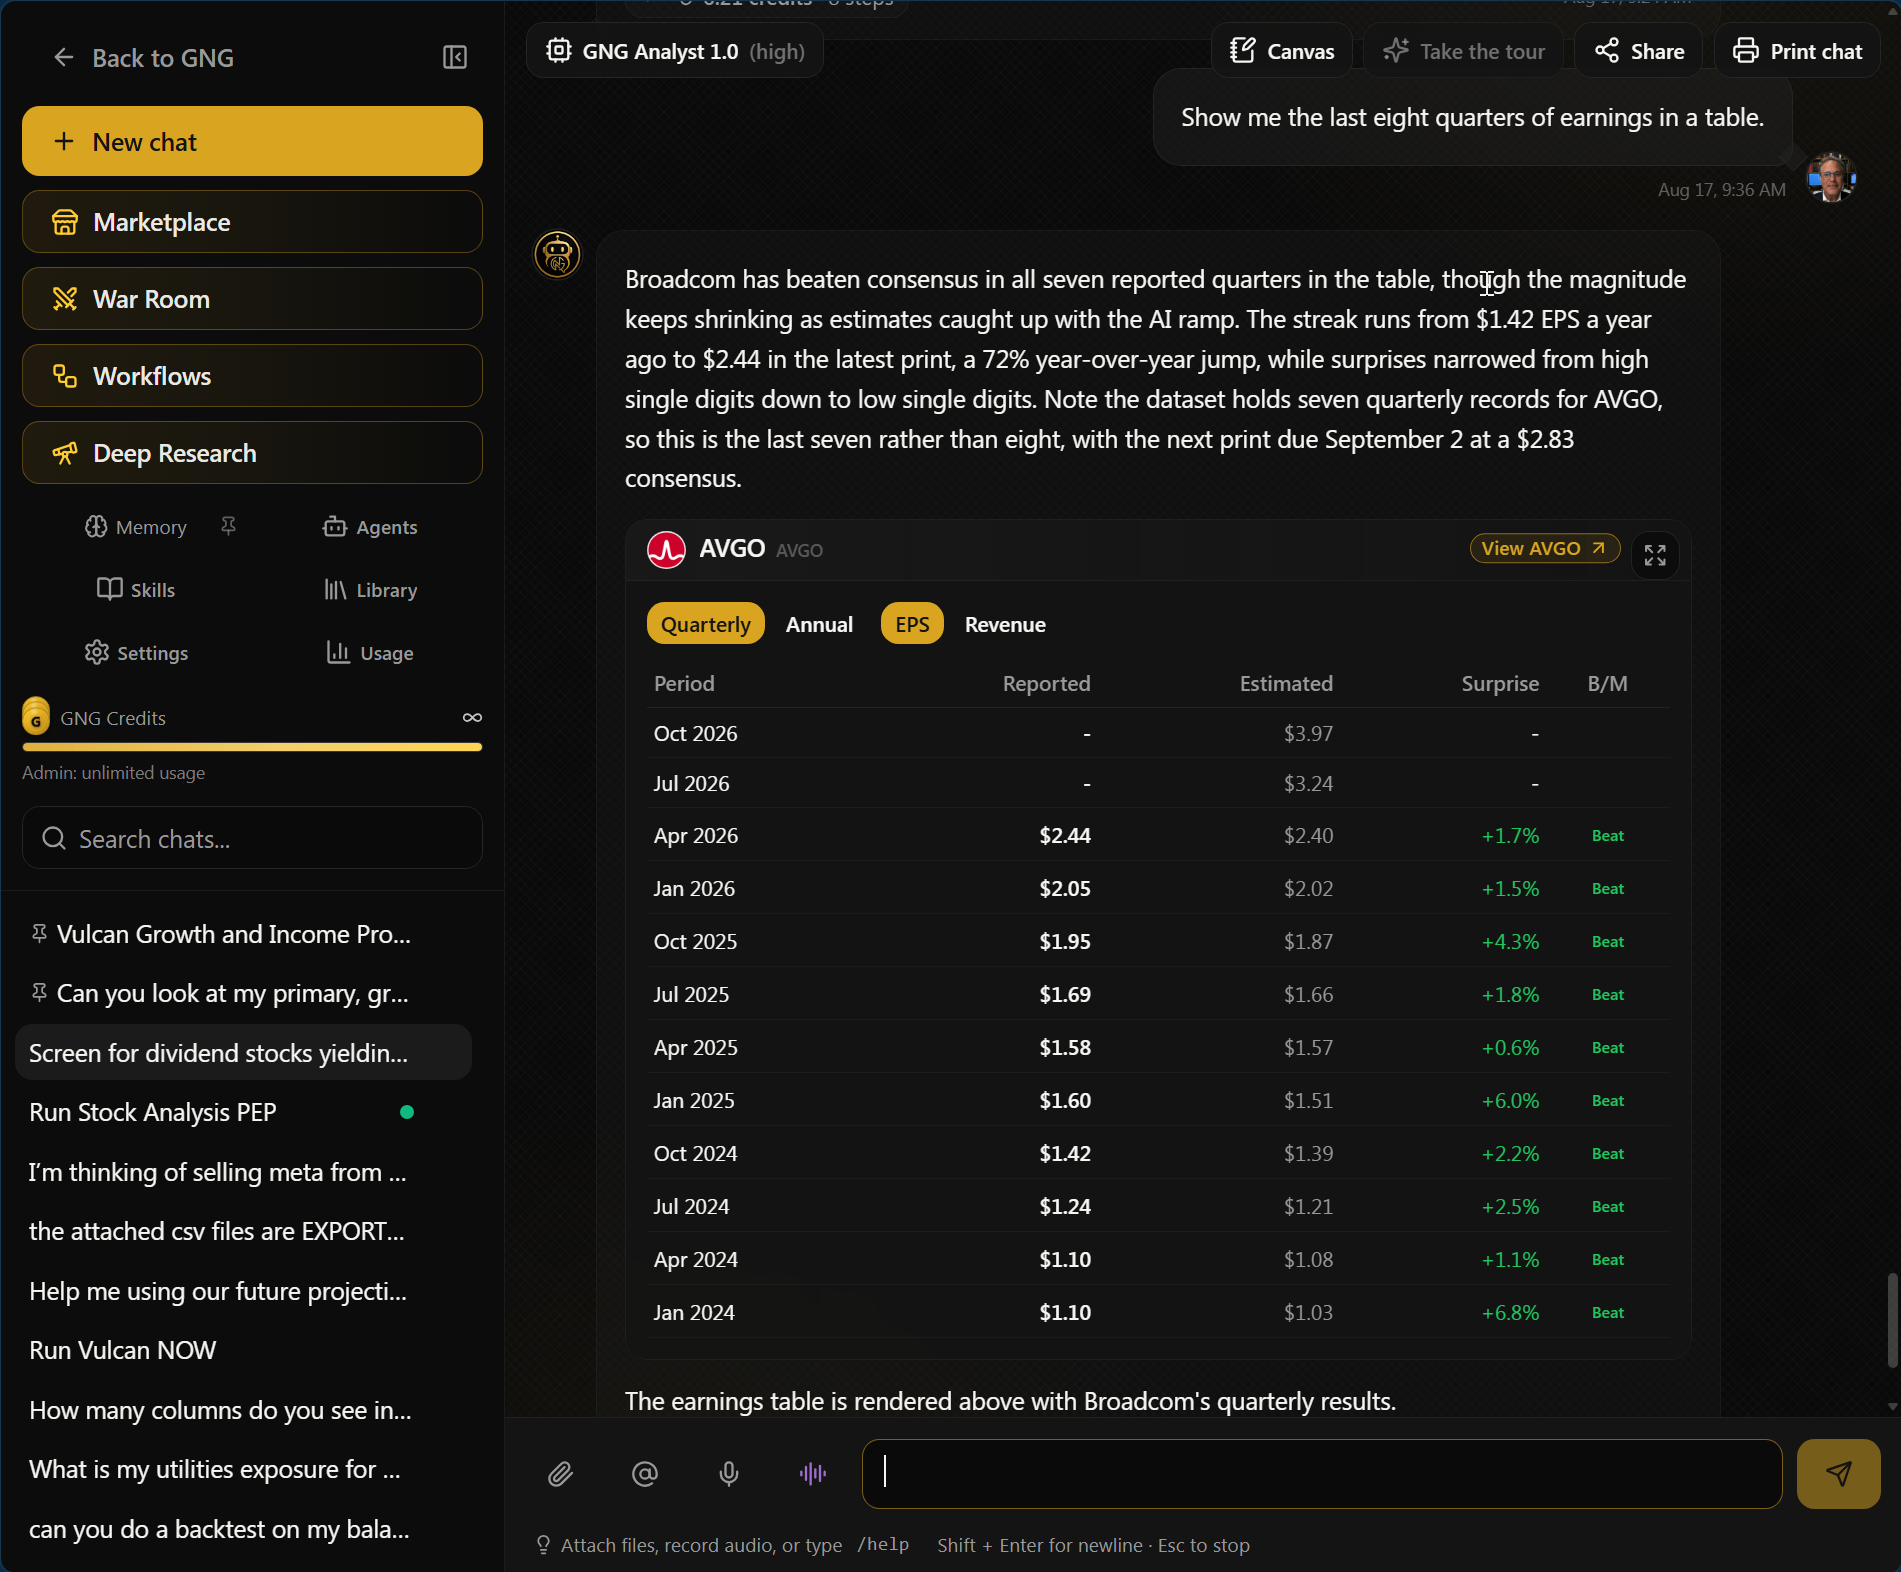
Scroll down to the earnings chart. You're looking for one thing above everything else. Does this company do what it said it was going to do?
A long run of beats against estimates usually means a management team that guides honestly and then executes. Repeated misses are a yellow flag no matter how cheap the stock looks. Want more detail?
Show me the last eight quarters of earnings in a table.
Step 8: Check the dividend, if income matters to you
The dividend chart shows every payment going back years. What you want is a staircase, steady payments stepping up over time. A past cut, a sudden drop, or a decade of flat payments should worry you.
Then ask the follow-up that actually matters:
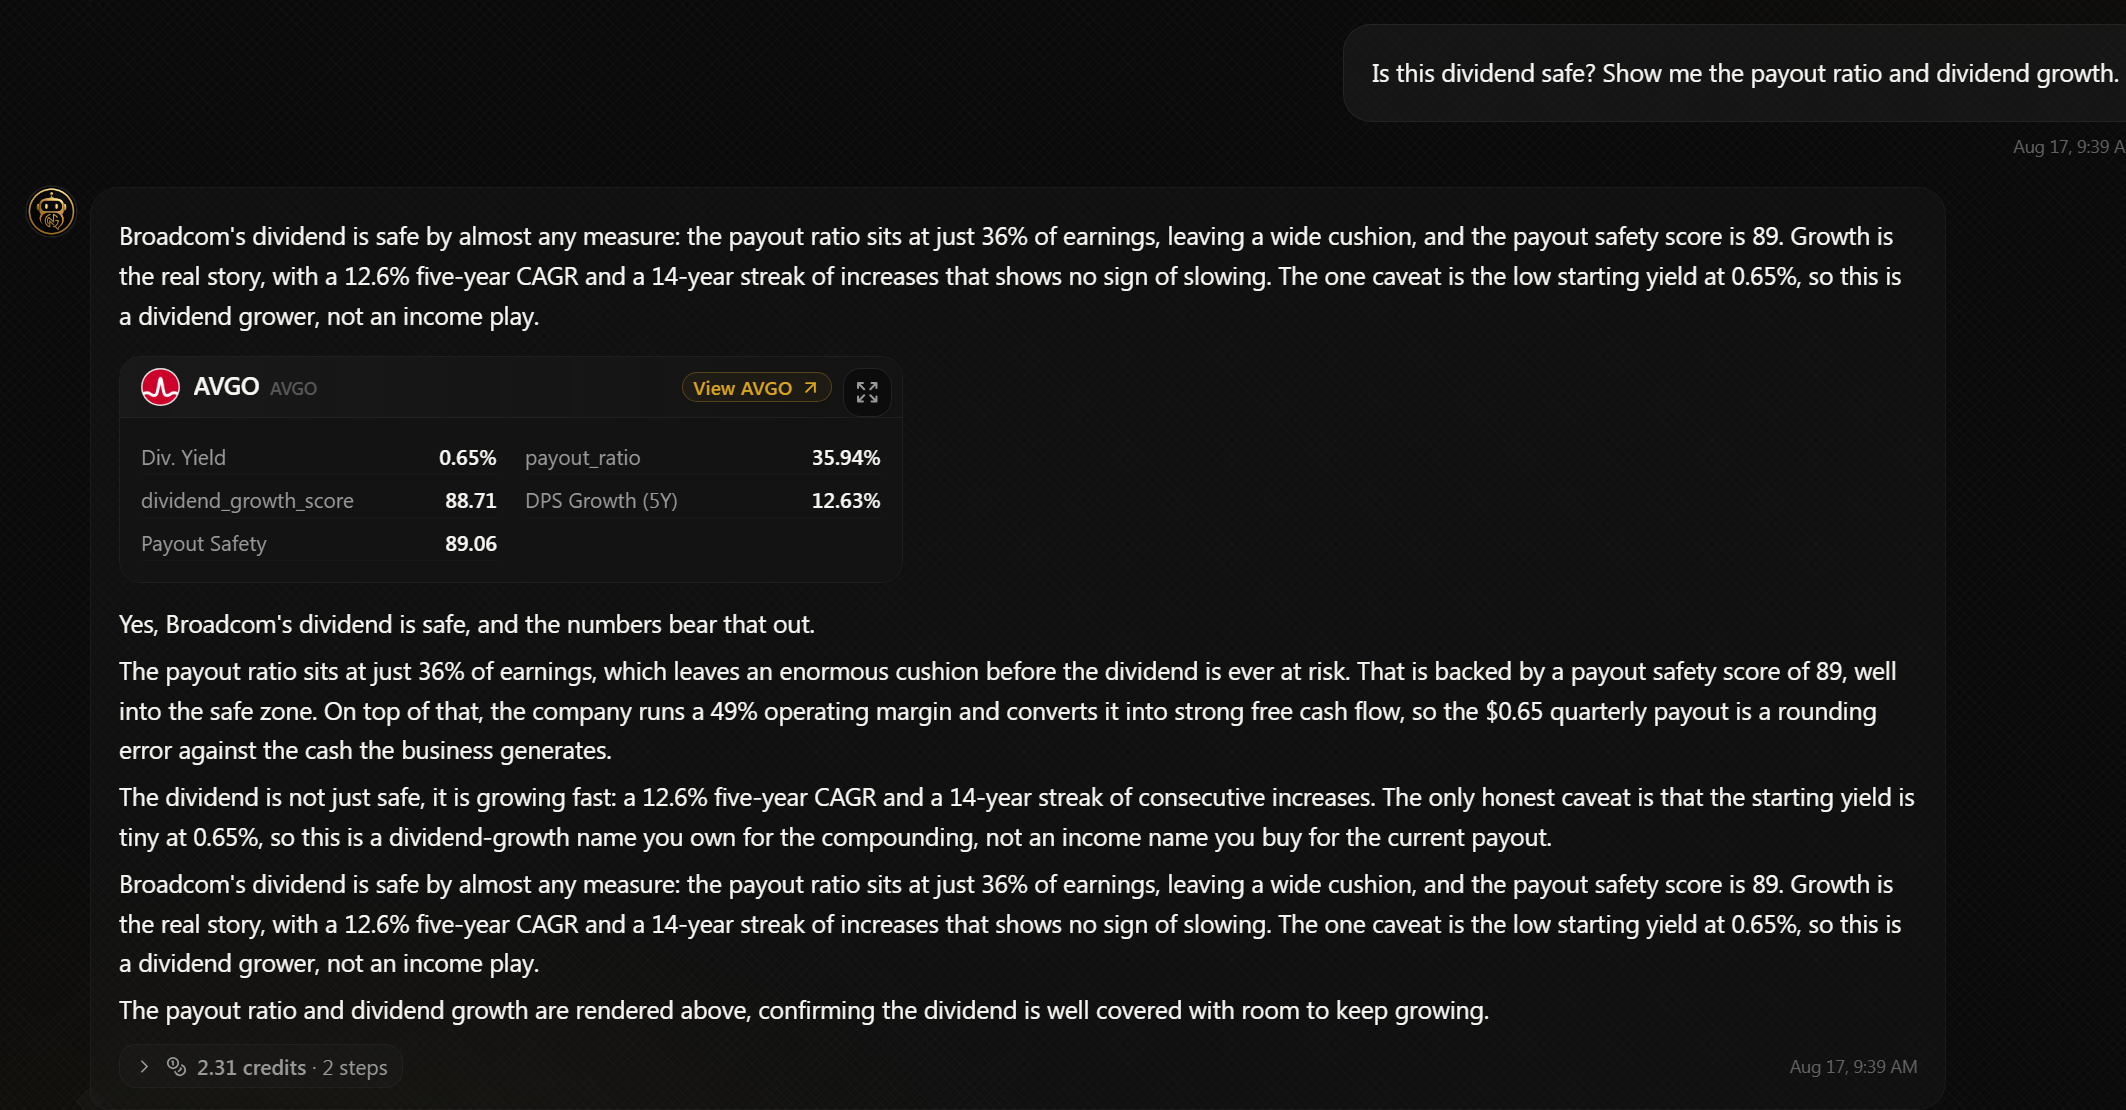
Is this dividend safe? Show me the payout ratio and dividend growth.
A dividend eating 30% to 40% of earnings has room to grow and room to survive a bad year. One eating 90% or more sits a single recession away from a cut. Those numbers are rules of thumb rather than hard lines, and they bend by industry, since utilities and REITs live comfortably at payout levels that would frighten me in an industrial.
Step 9: Get the verdict layer, ratings and fair value
Now the money question:
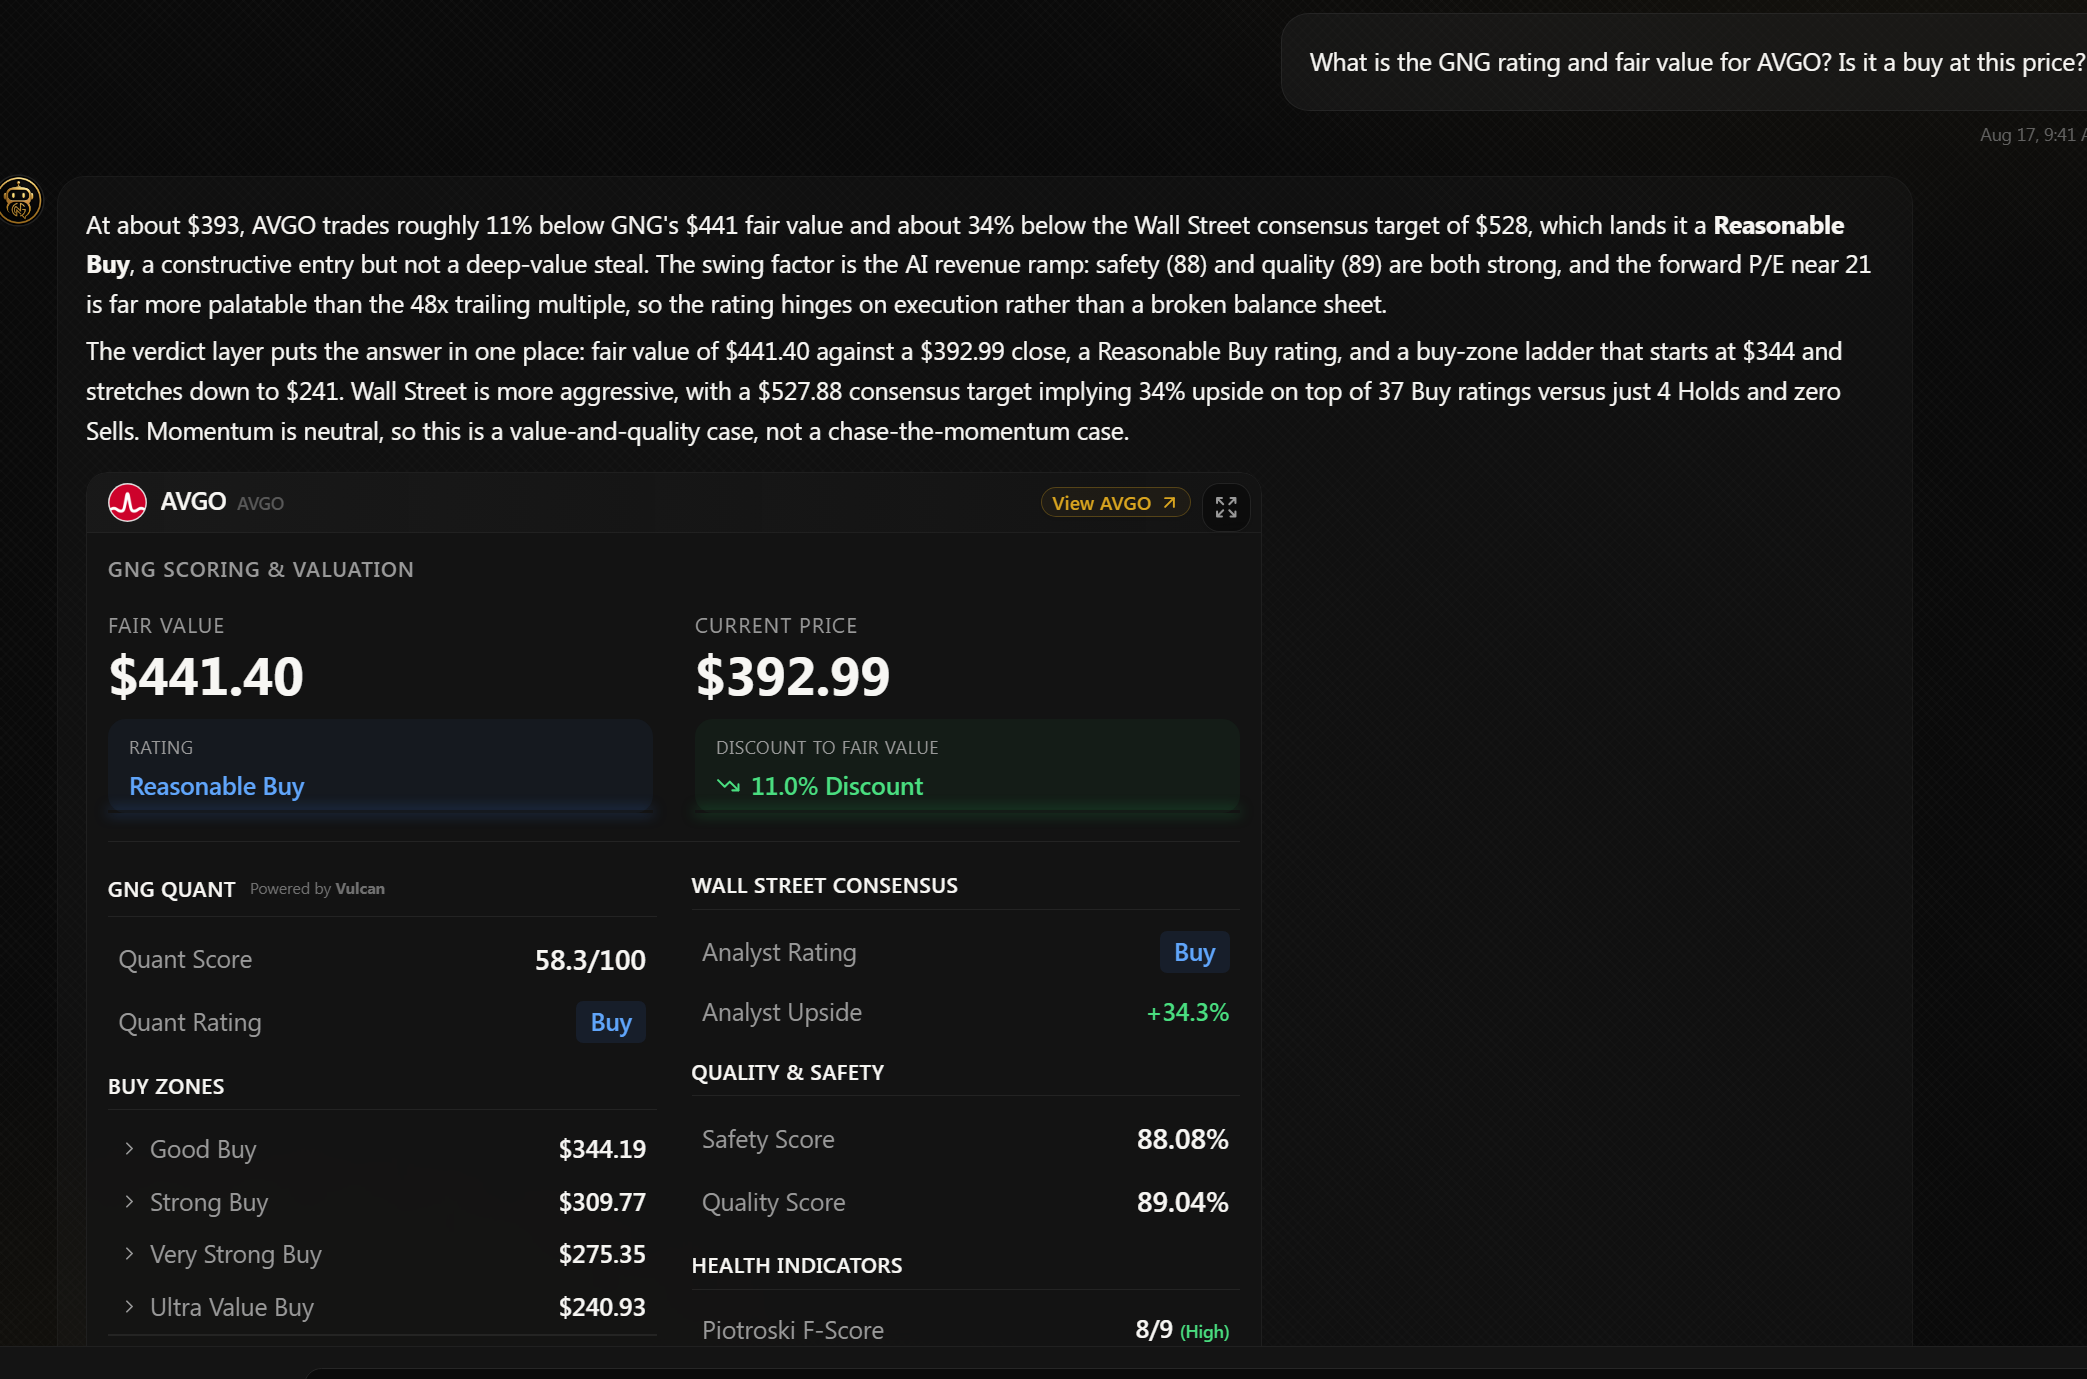
What is the GNG rating and fair value for AVGO? Is it a buy at this price?
This renders the ratings panel, and it's the most information-dense widget on the platform. You get the fair value estimate, the discount or premium the current price represents, the seven-tier rating, specific buy zones and a trim price, the quant rating, Wall Street's consensus, and safety and quality scores with the financial health checks sitting behind them.
Straight with you, free readers: this verdict layer is part of GNG Pro. Everything else in this guide works on the free plan.
One rule I follow, and I think you should too. When the fair value model and the quant rating disagree, that isn't a malfunction. It's one of the more interesting situations in investing, and it usually means the fundamentals are saying cheap while the price trend is saying falling. Ask the AI why they disagree, and read the answer before you act.
Step 10: Stress-test the past
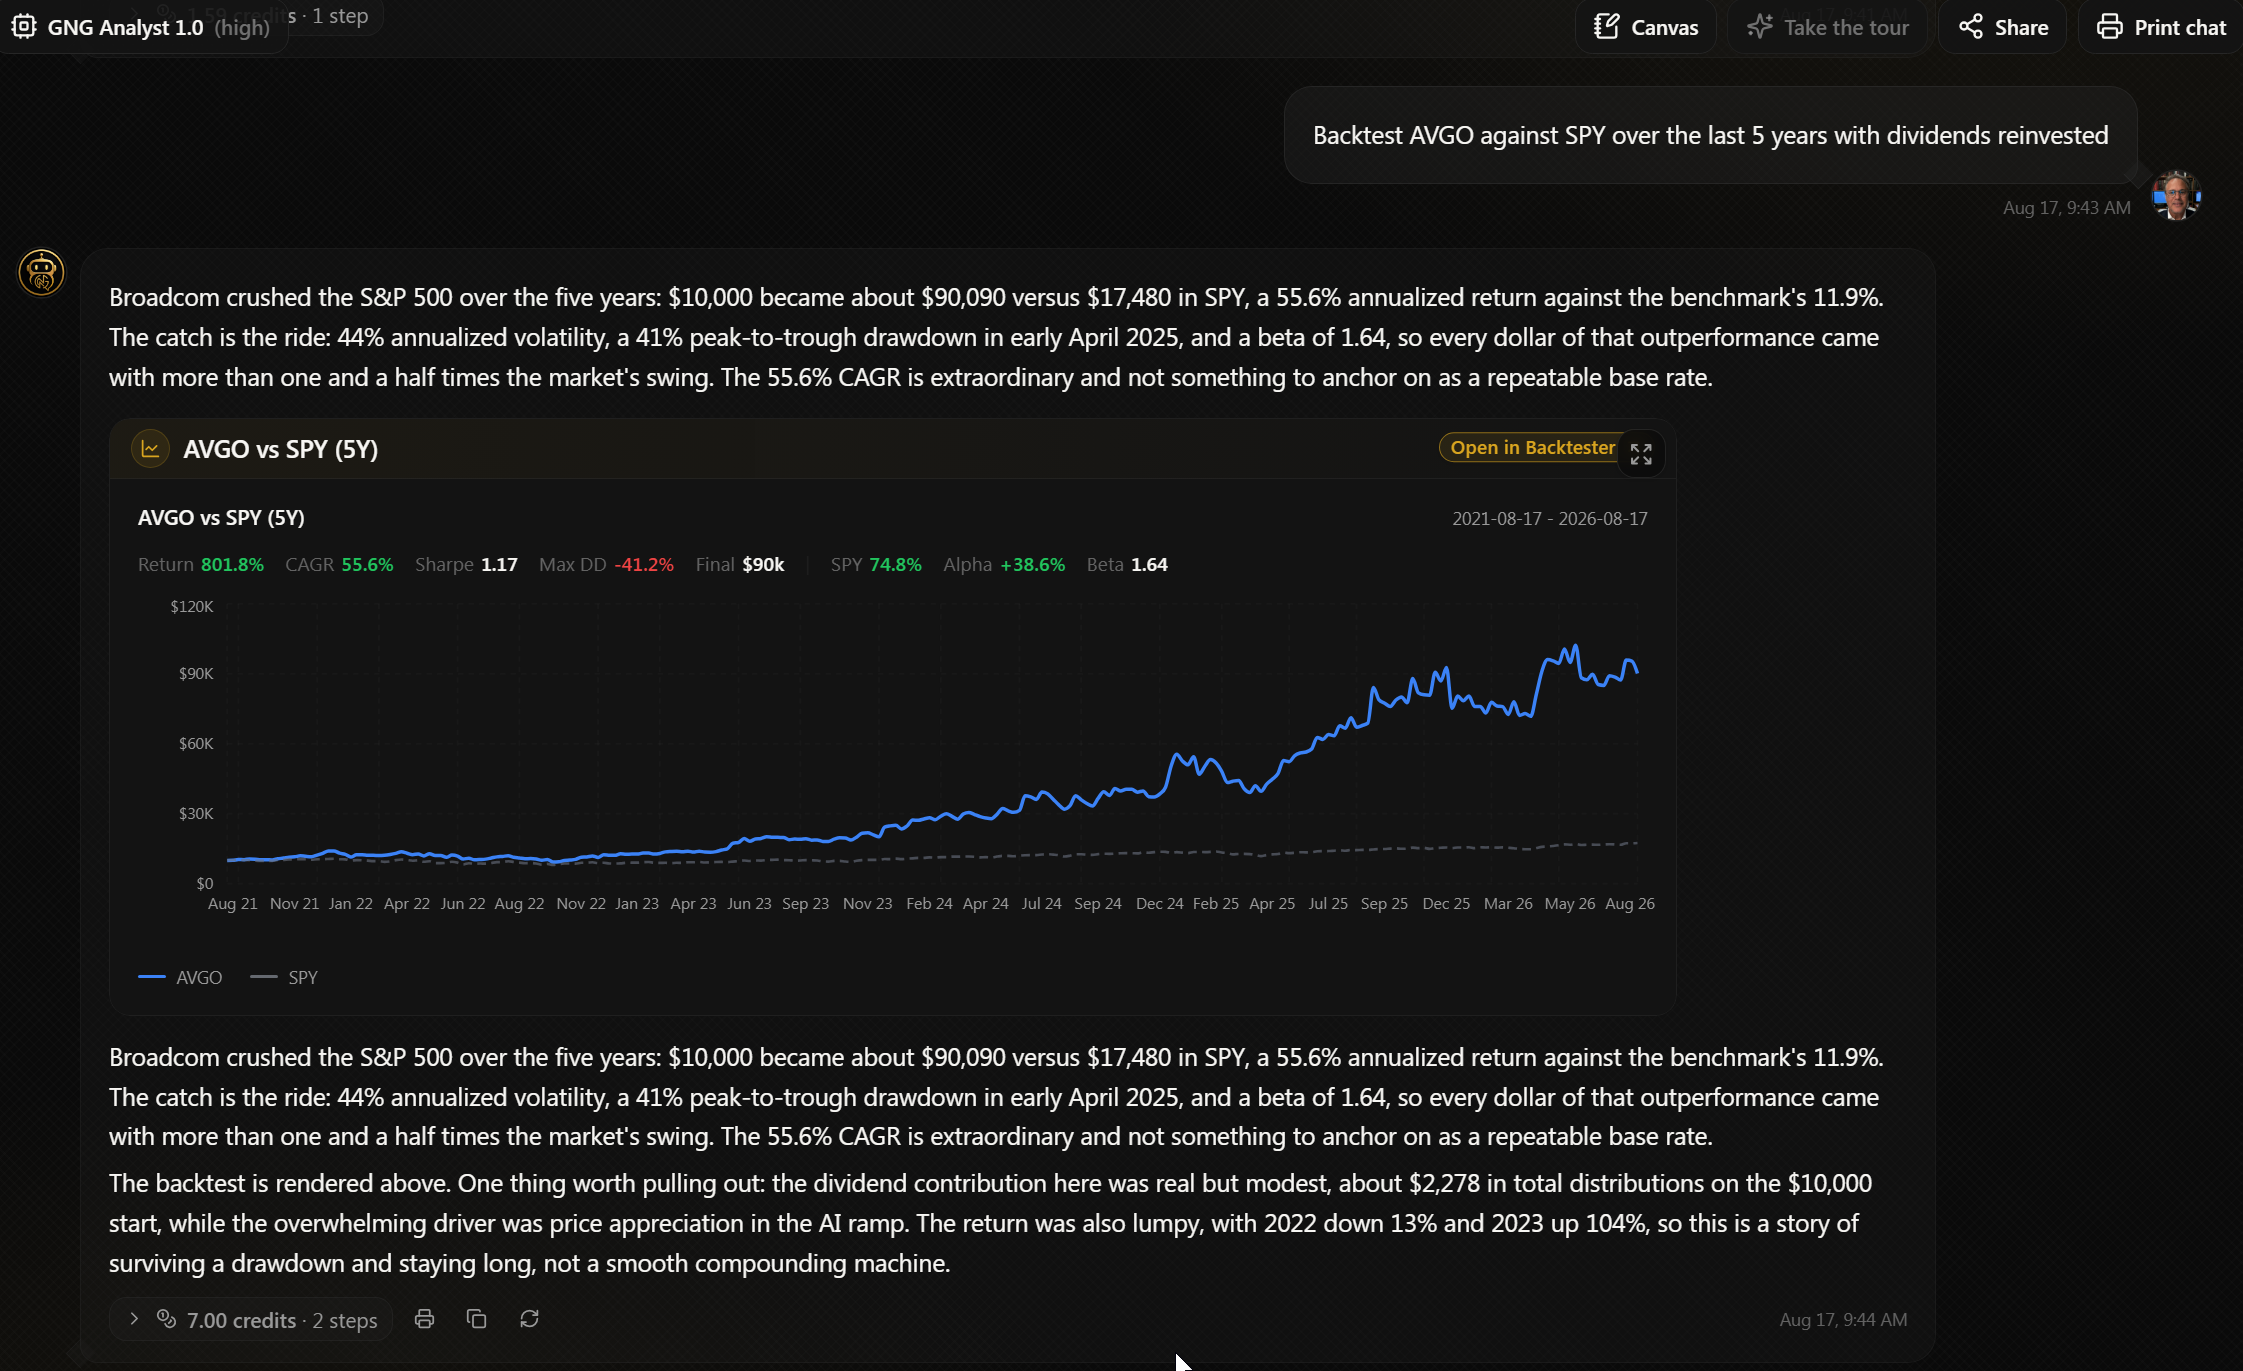
Backtest AVGO against SPY over the last 5 years with dividends reinvested.
Thirty seconds later you have a full comparison: total return, annualized return, and the number I want you looking at hardest, maximum drawdown.
Drawdown is the honest answer to how much pain you'd have felt actually owning this thing. If seeing negative 40 percent on a screen turns your stomach, far better to find that out from a chart than from your own account balance.
Step 11: Stress-test the future
History gives you one path. The future is a spread of them.
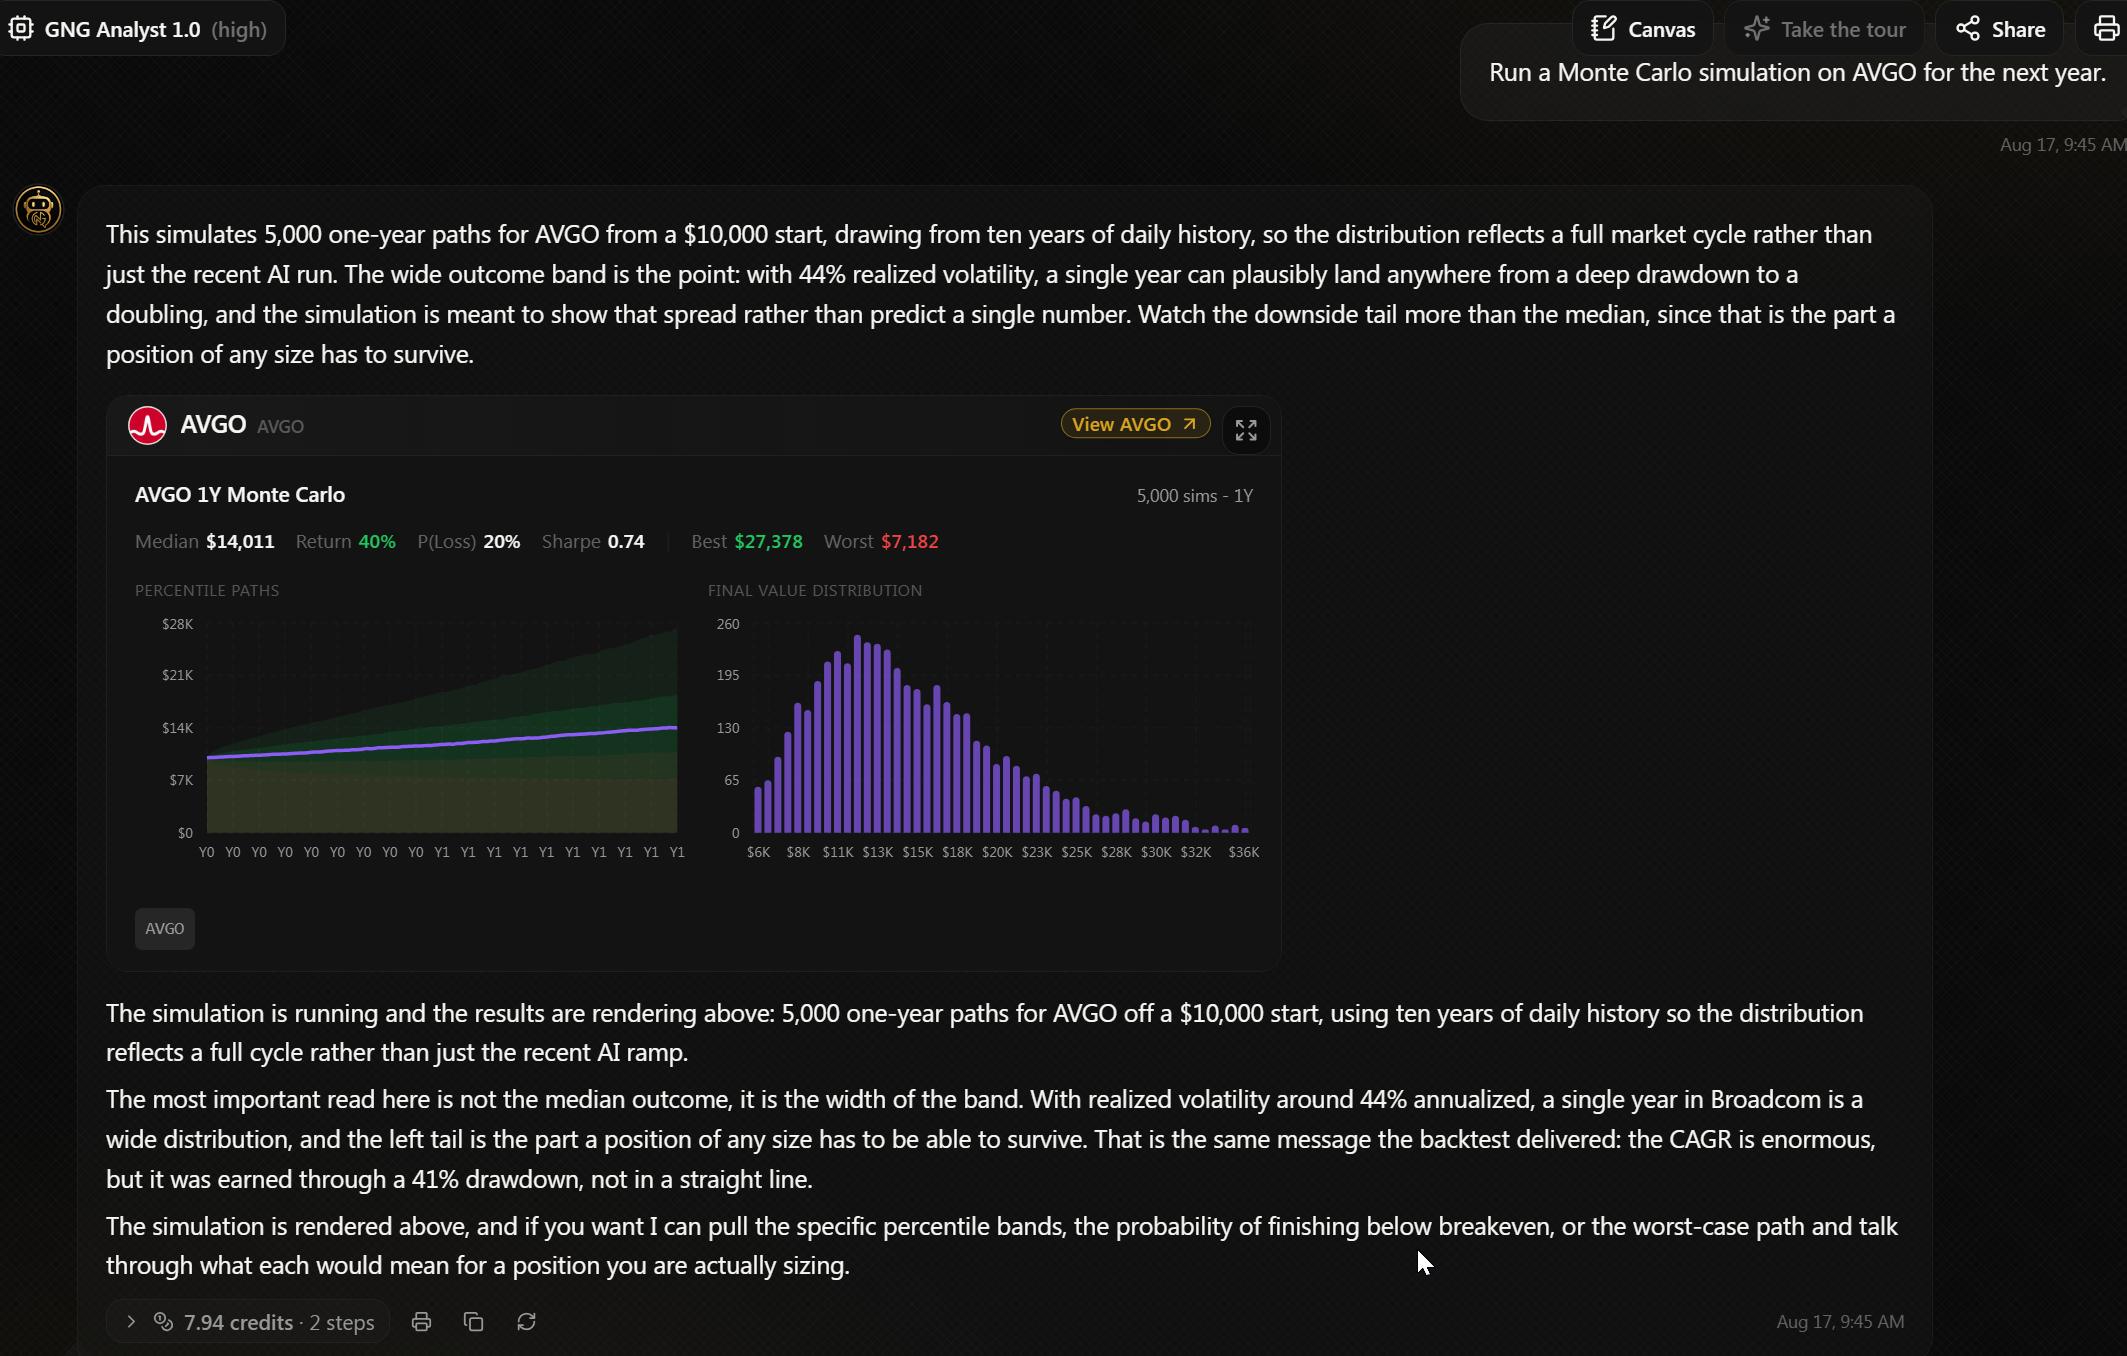
Run a Monte Carlo simulation on AVGO for the next year.
The AI runs five thousand simulated futures based on the stock's actual behavior and shows you the range: the median outcome, the good tail, and the ugly one. Nobody, human or machine, knows which path you'll get. The chart's real use is sizing, because it forces you to pick a position you could survive on that ugly tail.
Step 12: Ask the question you're afraid of
Before I buy anything, I make the case against it.
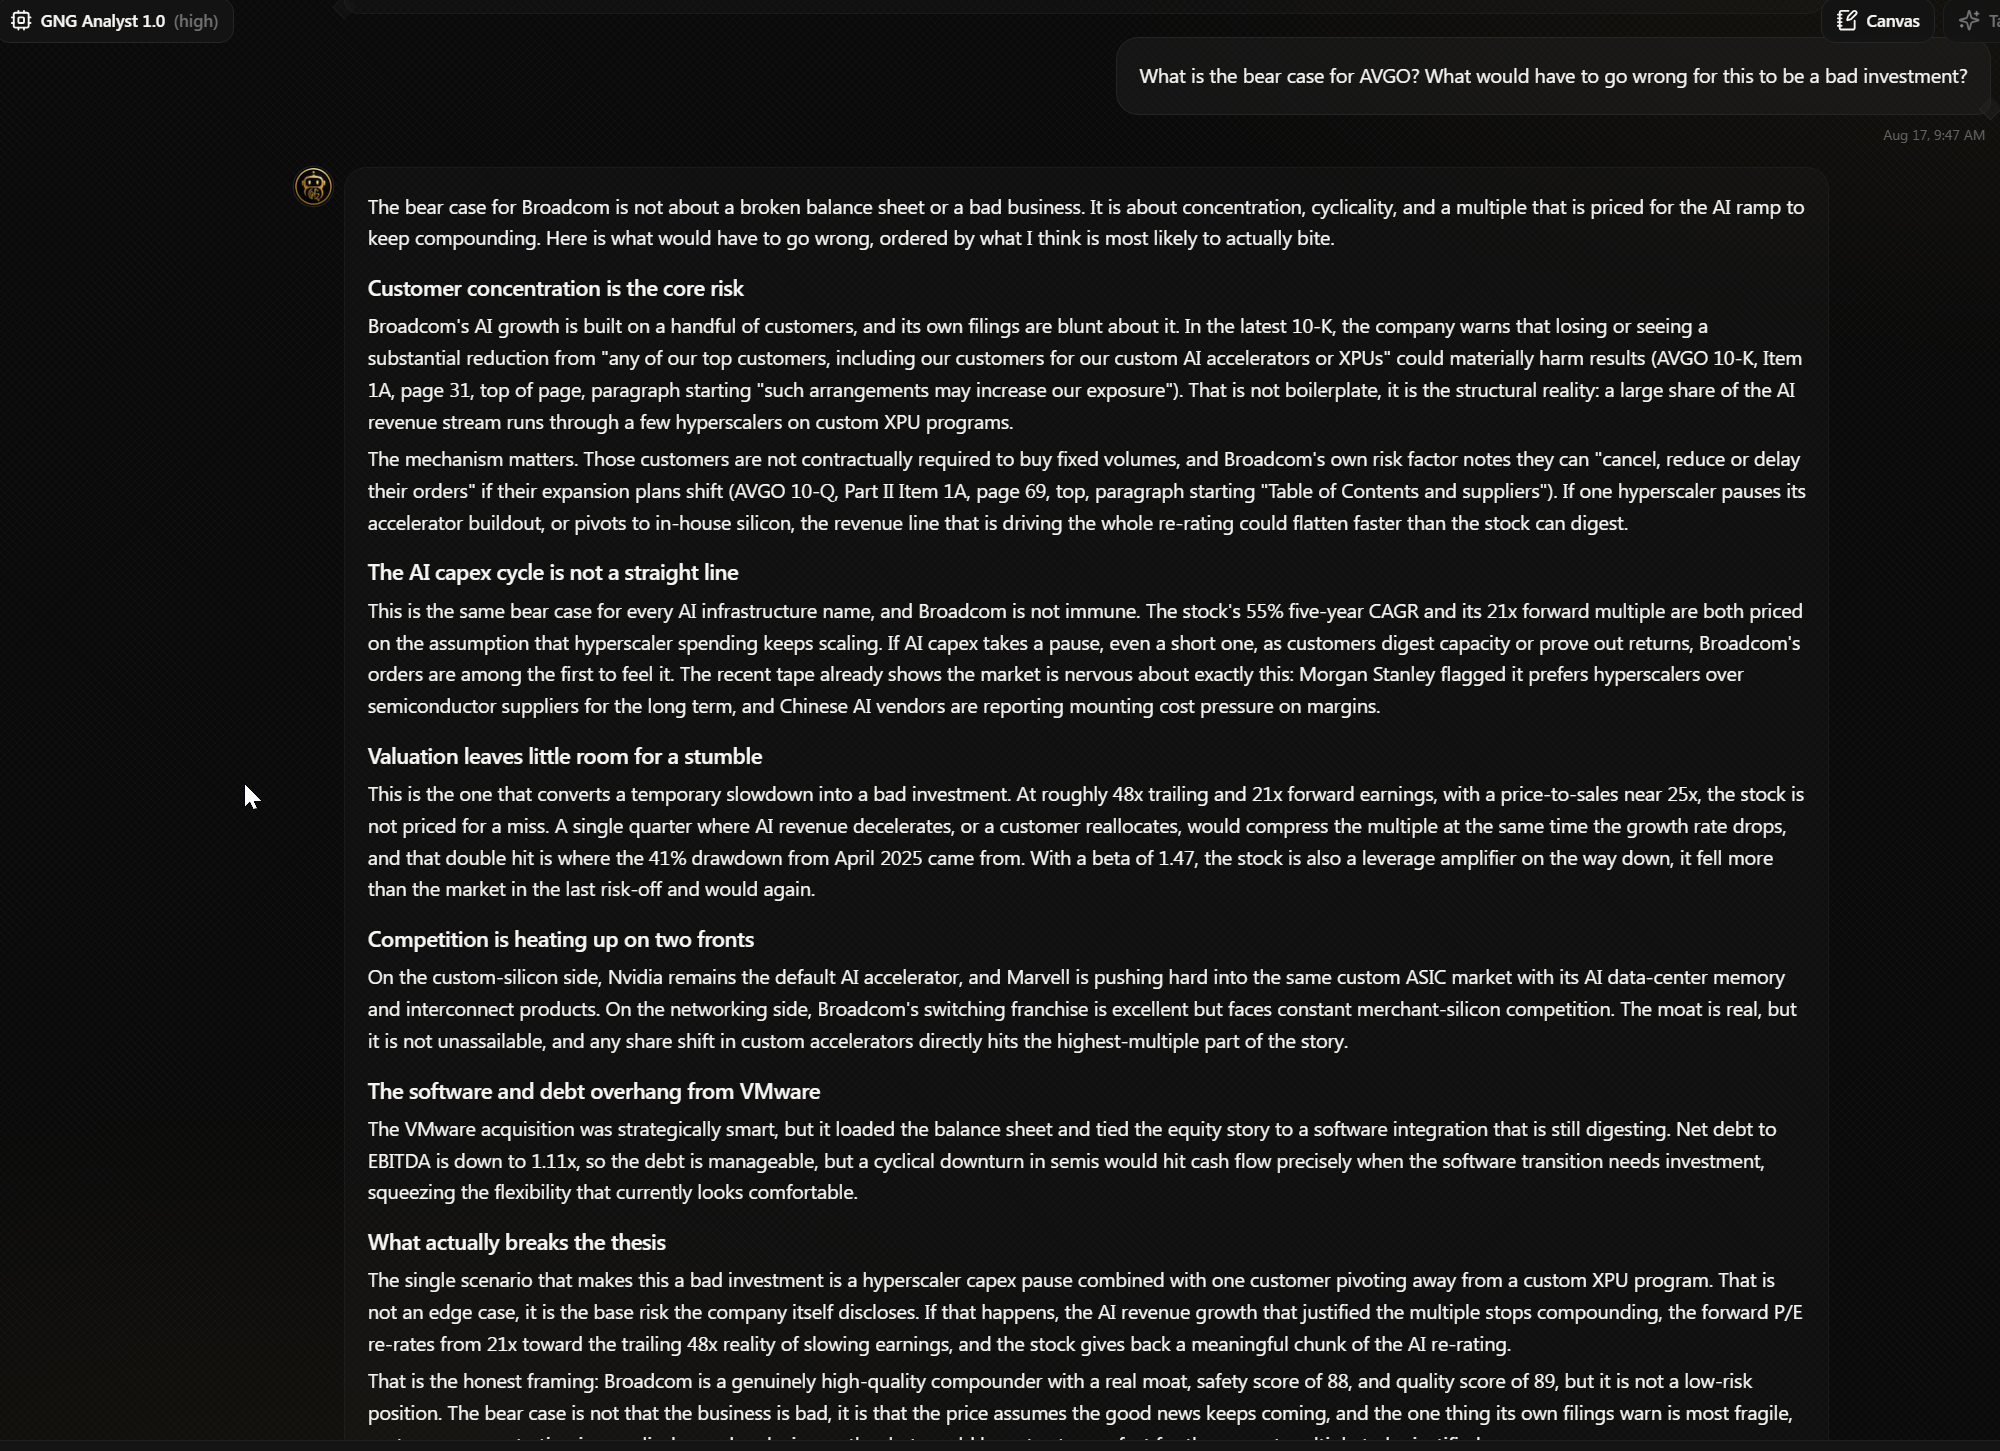
What is the bear case for AVGO? What would have to go wrong for this to be a bad investment?
Make the AI argue with you. It'll pull risks out of the filings, the negative news, the valuation stretch, whatever the evidence supports. If the bear case comes back vague and hand-wavy, my conviction goes up. If it comes back specific and plausible, I want to know that before the money moves rather than after.
Part 4: Keep What You Found
Step 13: Save your shortlist to a watchlist
Don't let the work evaporate when you close the tab.
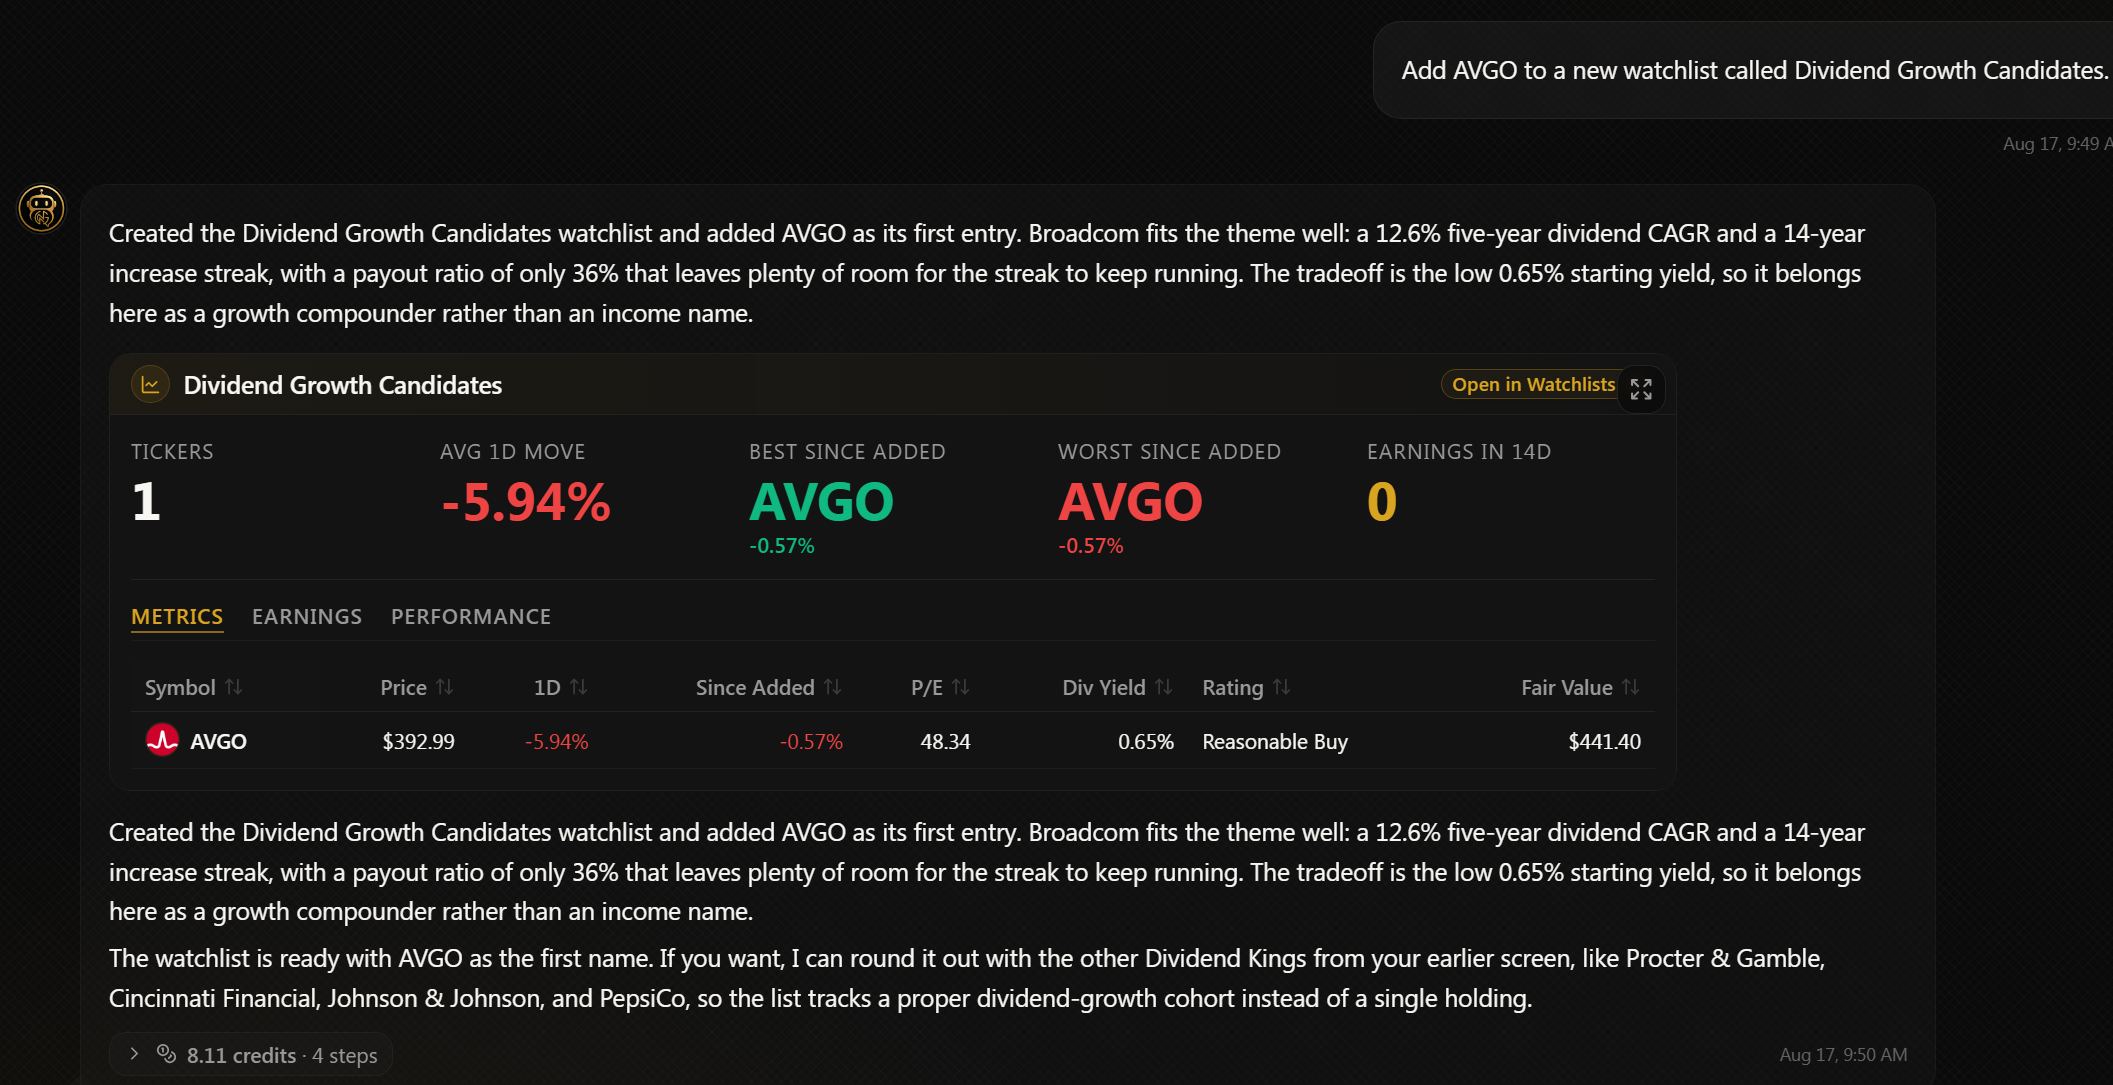
Add AVGO to a new watchlist called Dividend Growth Candidates.
The AI builds the list and confirms it with a live watchlist widget. Next week you can ask how the Dividend Growth Candidates watchlist is doing and get prices, moves, and updated ratings in one shot.
Step 14: Teach it your preferences
Tell the console, once:
Remember that I am a dividend growth investor with a 3-5 year horizon and I prefer companies with payout ratios under 60%.
It saves that to memory, and future conversations start from your context instead of from nothing. This is the part that compounds. The console gets more useful the more you use it, because it stops handing you generic answers and starts handing you yours.
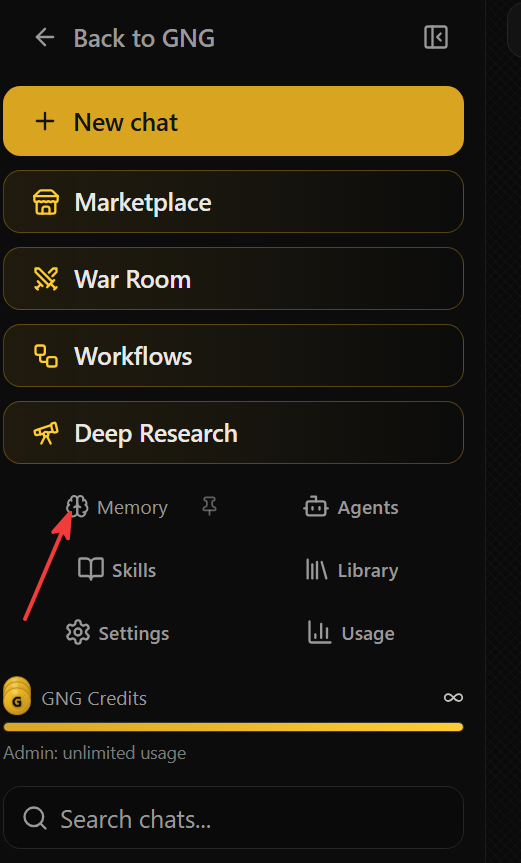
I won’t make a screenshot of this as my investment is slightly different. DO NOT run this prompt as it saves it to memory, although you can delete old memories you no longer want. However, you should do a similar prompt that reflects who YOU are! You can even ask GNG AI Analyst to delete memories for you, or on the left nav in AI Console do yourself.
The Workflow, Compressed
Once you've run this twice, the whole loop takes about fifteen minutes. Screen in plain English, refine to a shortlist, overview the best candidate, check the earnings and the dividend, get the fair value verdict, backtest the past, simulate the future, demand the bear case, then save whatever survives.
That sequence isn't a toy version of research. It's the same shape as the institutional process, and not long ago running it took a data terminal most people can't afford plus a junior analyst to do the fetching.
Two closing cautions, because I'd rather lose you as a reader than mislead you.
Everything the console shows you is evidence, not instruction. Nothing in this guide or in that chat window is personalized financial advice, and position sizing stays your job no matter how convincing the charts look.
The second one is simpler. This tool amplifies the quality of your questions, so lazy questions get lazy answers. Ask the ones in this guide and you'll be doing more genuine diligence than most retail investors have ever done on anything they own.
Now go run your first screen.
Sign in to leave a comment and join the discussion.
Sign Up Free