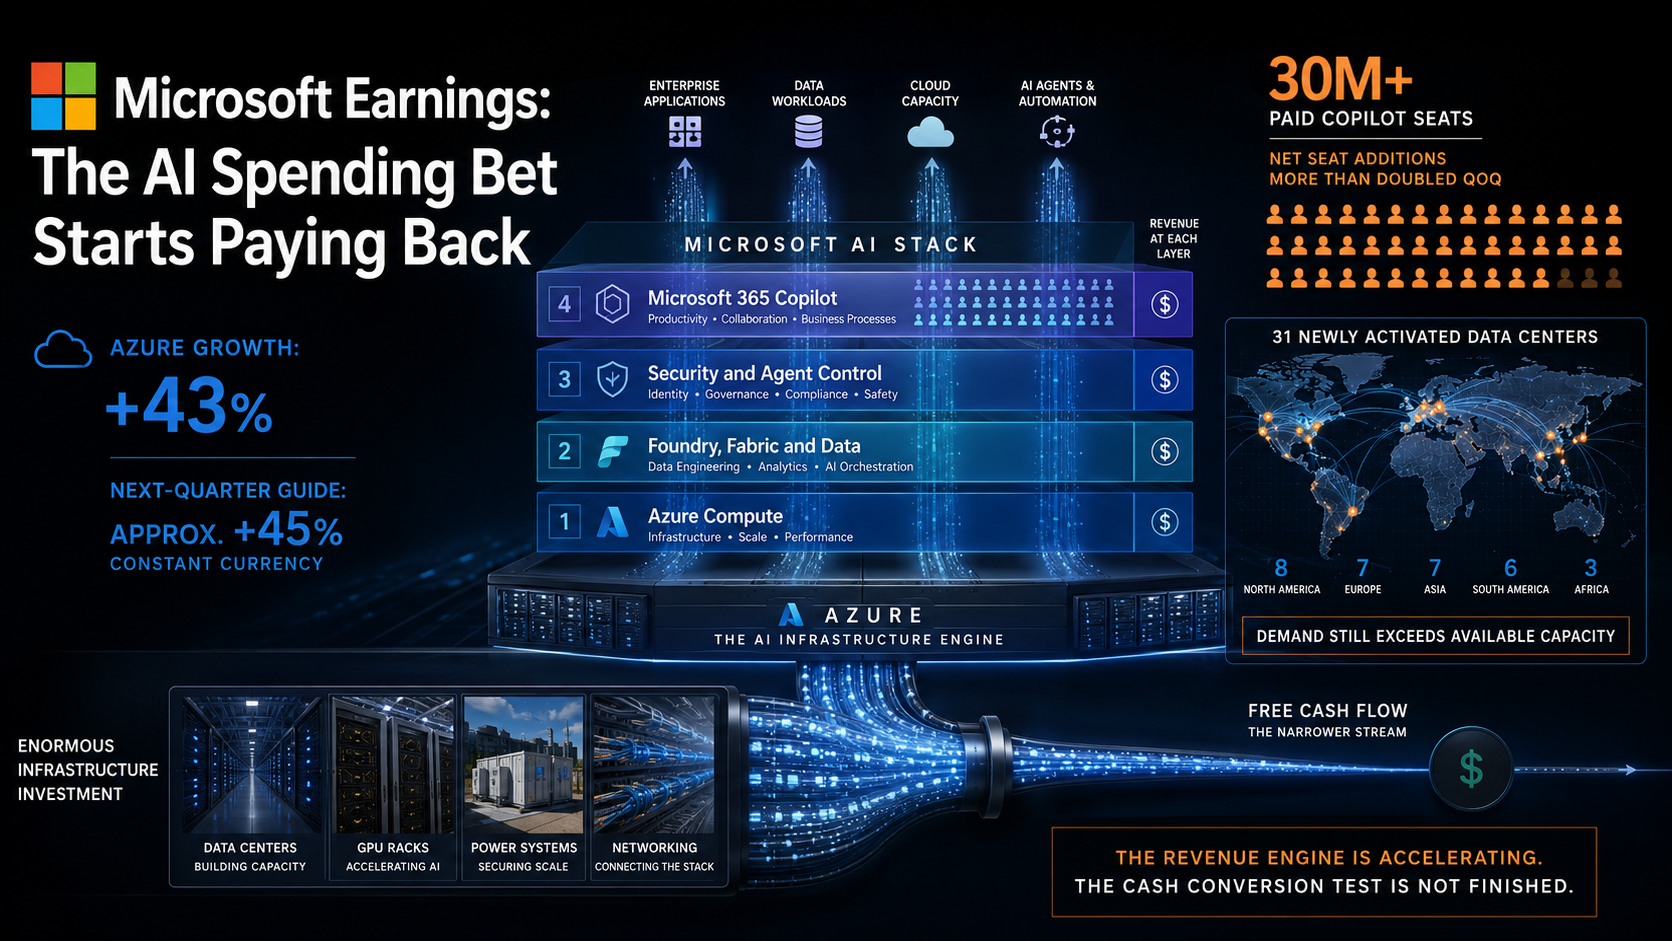

I have owned Microsoft (MSFT) through one of the ugliest stretches of relative performance of the Nadella era. Shares went into Wednesday's print down roughly 19% for the calendar year while the S&P 500 had gained about 7%, and the trailing twelve month total return sat near negative 24%. The forward multiple compressed from around thirty times earnings into the low twenties, and none of that happened because the business stopped working.
It happened because the market stopped believing the spending would ever come back as cash.
Wednesday night changed the mood in about ninety minutes. Shares jumped roughly 8% after hours on the fiscal fourth quarter results and the September quarter guide, and as I write this they are trading in the low $420s against a July 29 close of $390.54. That number will be different by the time you read this, so treat every price reference here as a marker rather than a live quote. What I want to do is walk through what actually happened, what the pop priced in, and the two things I think it skipped.
The number that moved the stock
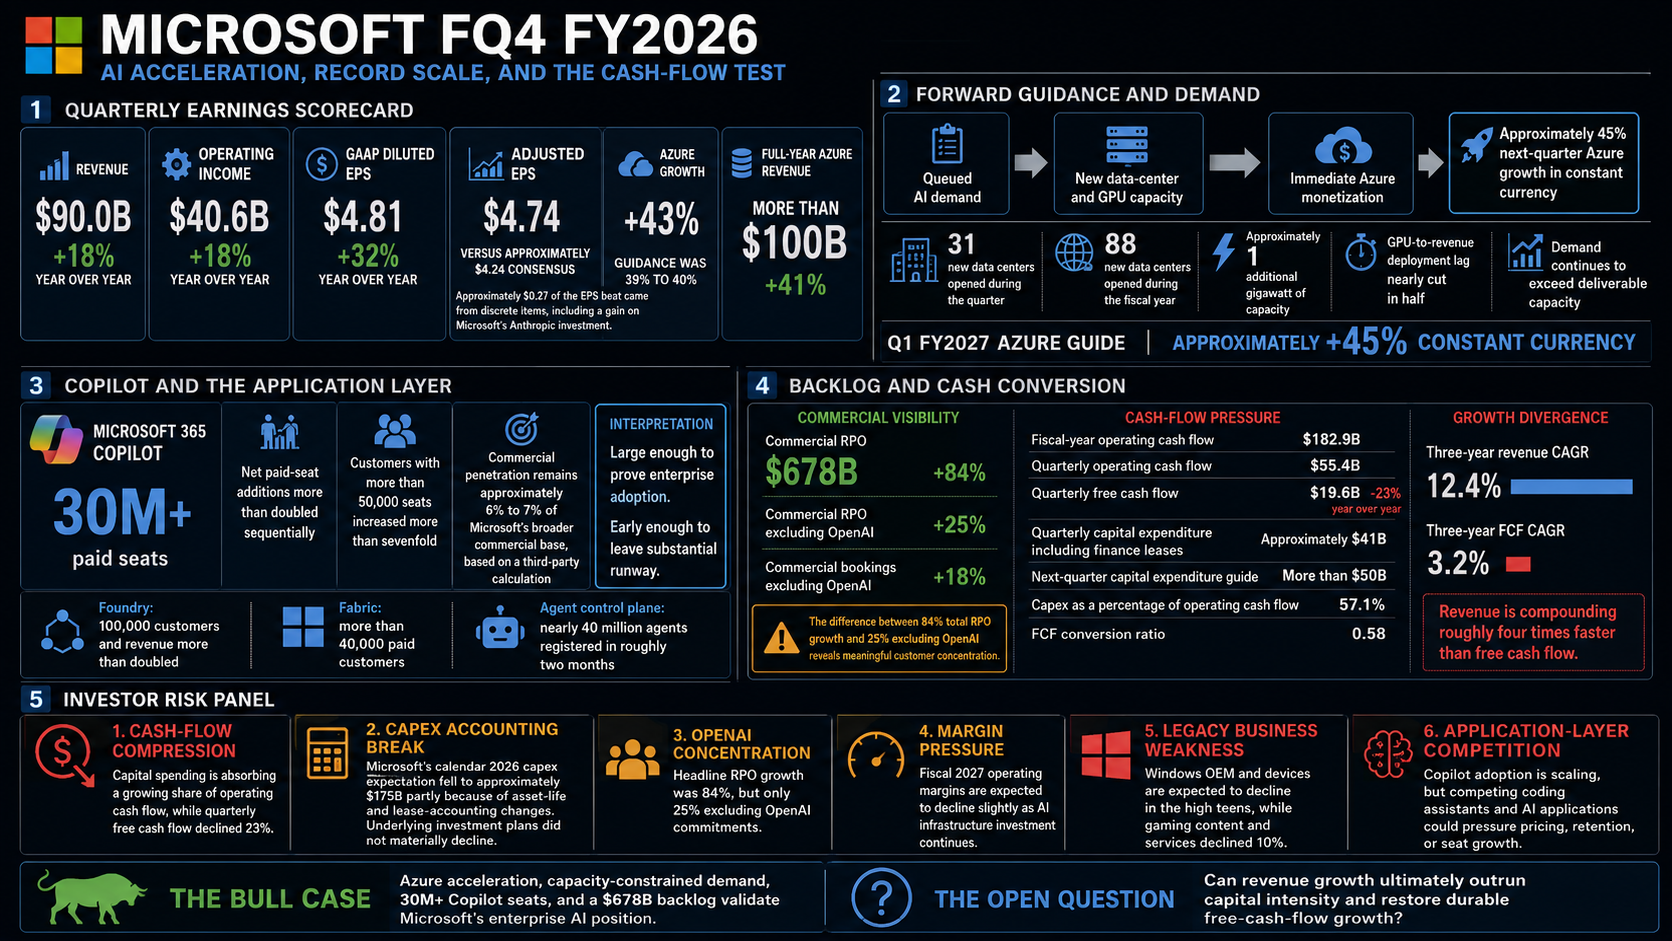
Azure grew 43% in the June quarter against a guide of 39% to 40% and a street estimate right at 40%. Management then guided the September quarter to roughly 45% in constant currency, against a consensus that sat closer to 41%. Full year Azure revenue crossed $100 billion for the first time, up 41%.
Acceleration at that revenue base is genuinely rare, and I want to be precise about why rather than just calling it impressive. At $100 billion of annual scale, moving the growth rate up three points means adding several billion dollars of incremental annualized revenue that was not in the prior trajectory. Microsoft is doing that while telling you plainly that demand still exceeds the capacity it can deliver.
So why has the stock been down 19% on the year if the flagship business is doing that? Because growth was never the disputed variable. The argument has been about what the growth costs, and I will get to that.
The rest of the quarter supported it. Total revenue reached $90.0 billion, up 18%, with operating income up 18% to $40.6 billion and GAAP diluted earnings of $4.81, up 32%. Adjusted earnings of $4.74 landed roughly fifty cents above consensus, though I would flag that about $0.27 of the beat came from discrete items including a $3.2 billion gain on the company's Anthropic stake. Strip those out and this is still a beat, just a less spectacular one.
Here is the part I think the pop got backwards
The consensus read on Wednesday night is that the market finally accepted that AI capital spending converts into revenue. I think that is directionally right and specifically wrong, and this is the piece where I am going to argue with the crowd.
Two things deserve a harder look.
The first is that Azure's acceleration was described by management as a supply event. The CFO attributed the upside to efficiency gains across the existing CPU and GPU fleet and to process changes that pulled capacity forward, which then monetized almost immediately because demand was already queued up behind it. Thirty one new data centers went live on five continents during the quarter, taking the annual tally to 88, alongside roughly another gigawatt of capacity and a near halving of the lag between GPU delivery and revenue-bearing workloads. Growth is currently being set by how fast Redmond can pour concrete and rack silicon, which means the reported growth rate is telling you about Microsoft's build velocity and not yet about the ceiling on customer appetite.
That cuts both ways, and I want to be honest that reasonable people land differently here. The bull reading is that a supply-constrained business has visible runway. The bear reading is that Microsoft is spending an extraordinary sum to relieve the constraint, and the quarter you finally clear it is the quarter you discover what unconstrained demand actually looks like.
The second thing is subtler, and this is where I would ask you to slow down with me. Part of the capital spending relief that soothed investors came from an accounting change rather than a spending change. Effective fiscal 2027, Microsoft is extending the estimated useful life of data centers and office buildings from fifteen years to twenty five, and more future data center leases will land as operating leases rather than finance leases, which pulls them out of the reported capital expenditure line. That revision moved the calendar 2026 capital spending expectation from roughly $190 billion to roughly $175 billion, and management said plainly that underlying investment plans had not changed.
So the headline got smaller while the checks stayed the same size. I am not calling that misleading, because it was disclosed clearly on the call, but if you are tracking capital intensity year over year you now have a definitional break in your series.
What I am actually underwriting
Strip out the noise and my thesis rests on one structural feature: Microsoft earns a toll at multiple layers of the same workload.
When a customer runs an AI application, Azure captures the compute. Foundry captures model selection and governance, and now sits at 100,000 customers with revenue more than doubling year over year across a catalog exceeding 11,000 models. Fabric and the database layer capture the data, with paid Fabric customers above 40,000 and PostgreSQL revenue up 55%. Then Copilot, the security stack, and the newly launched agent control plane capture the application layer, and that last product registered close to 40 million agents in roughly two months of availability.
Makes sense so far, right? The important consequence is that Microsoft's economics are largely indifferent to which model wins. The number of customers building with models from more than one provider rose fivefold since the start of the year, which is exactly the pattern you would want if you are worried about single-vendor dependence.
Copilot is where I would push back on my own bullishness. Paid seats crossed 30 million with net additions more than doubling sequentially, customers above 50,000 seats grew more than sevenfold, and weekly engagement now sits alongside the company's most-used applications. All good. But 30 million paid seats against a commercial base north of 460 million is somewhere near 6% or 7% penetration, and that figure is a third-party calculation rather than a company disclosure, so hold it loosely.
The backlog question nobody wants to ask out loud
Commercial remaining performance obligation reached $678 billion, up 84%. That is the number that gave investors a denominator for the capital spending, and it deserves the credit it received.
Excluding the OpenAI commitments, it grew 25%.
Is that a problem, or am I looking for one? Twenty five percent growth on a backlog that size is a fine result and I do not want to sneer at it. But the gap between 84% and 25% tells you how much of the headline visibility rests on one counterparty whose own funding structure is the subject of active public debate. Commercial bookings showed the same shape, up 18% excluding OpenAI and up 10% including it. Concentration risk in a backlog is not the same thing as credit risk, and I am painting with a broad brush here, but the two are related enough that I size accordingly.
Where the cash actually goes
This is the section that keeps me disciplined, and it is where the GNG data does more work than the press release.
Fourth quarter operating cash flow was a remarkable $55.4 billion, with the full fiscal year at $182.9 billion. Free cash flow for the quarter was $19.6 billion, down 23% year over year, because capital expenditure including finance leases ran roughly $41 billion against about $17 billion in the year-ago quarter. On GNG's platform data, free cash flow conversion sits at 0.58, capital spending consumes 57.1% of operating cash flow, and the three year free cash flow growth rate is 3.2% against three year revenue growth of 12.4%.
That spread is the entire bear case expressed in two numbers. Revenue compounding at four times the rate of the cash the business hands you does not sound great, does it?
You can see the same pressure in capital returns. Buyback yield has fallen to 0.71% with the three year share count barely down at 0.3% annually, so total shareholder yield is 1.62% on a company that historically leaned much harder on repurchases. Dividends now absorb 35.5% of free cash flow even though the payout ratio against earnings is only 15.5%. Management guided fiscal 2027 to free cash flow positive, which is a notably modest commitment from a business that generated $182.9 billion of operating cash flow.
The five risks I actually track
Cash flow compression is first and largest. September quarter capital spending is guided above $50 billion, fiscal 2027 spending rises again, and operating margins were guided to decline slightly.
Second, backlog concentration. If OpenAI restructures or slows, the $678 billion figure gets re-underwritten in public and the multiple goes with it.
Third, quality screen deterioration. GNG's Piotroski F-Score reads 5 of 9 against a Safety Score of 100 and a Quality Score of 90.5, and the Vulcan chunk data reads 7, so the two disagree and I am using the more conservative figure. Heavy capital intensity is exactly what drags that screen.
Fourth, the legacy franchises. Windows OEM and devices revenue is guided down in the high teens for fiscal 2027 on weak PC demand and higher component costs, and gaming content and services fell 10% in the quarter with an impairment charge attached.
Fifth, competitive erosion at the application layer. Rival cloud units are compounding faster off smaller bases, and there is at least one publicly reported case this month of a large enterprise moving its coding assistant to a competitor. One data point is not a trend, but it is the kind of data point I want to see repeated or not.
The plan, in specifics
GNG carries fair value at $524.84 and the Vulcan model at $511.12, which blends to roughly $518. Against the low $420s that is about a 19% discount, down from roughly 27% before the print. The platform buy bands are Good Buy at $419.87, Strong Buy at $377.88, and Very Strong Buy at $335.90, so the after-hours move pushed the stock from comfortably inside the Strong Buy zone to the very edge of Good Buy.
So why not simply buy more here, given I have just spent eight hundred words explaining why the business is working? Because a 19% discount is a reasonable discount and not a gift, and because the cash flow question stays unresolved for at least another eighteen months. Treat that as my judgment rather than a stone-cold fact.
At roughly 21 to 22 times forward earnings on an estimate near $19, with return on invested capital at 28%, an Altman Z-Score of 7.95, interest coverage near 29 times, and net debt of only $8.2 billion, I am comfortable holding and adding on weakness rather than chasing the gap. My own position is sized inside the one to two percent per-name cap I apply to every individual equity, and I have no intention of breaking that discipline for a good quarter.
My invalidation triggers are deliberately specific. Azure constant currency growth below 35% in any quarter, backlog excluding OpenAI growing under 15% for two consecutive quarters, quarterly free cash flow turning negative, Copilot net seat additions falling sequentially twice in a row, or operating margin dropping below 42%. Any two of those together and I am trimming rather than debating.
For the long-term compounder, this remains one of the highest quality balance sheets in the market attached to a genuine multi-layer toll on enterprise AI, available roughly a fifth below model fair value. For the income-first reader, understand that the 0.9% yield and 11.1% five year Chowder reading do not clear a serious dividend growth screen, and capital spending has first claim on the cash for at least two more years. For the deep value reader, note that the strict no-growth earnings power value in the Vulcan data sits near $115, which is a blunt way of saying every dollar above that price is a bet on execution.
I am making that bet. I am just making it in the size I can be wrong in.
Master metrics table
Metric | Value | Source |
|---|---|---|
FQ4 FY26 revenue | $90.0B, +18% | Company release |
FQ4 operating income | $40.6B, +18% | Company release |
GAAP diluted EPS | $4.81, +32% | Company release |
Adjusted EPS | $4.74 vs ~$4.24 est. | Company release |
Azure growth | +43% (guide was 39-40%) | Company release |
Azure FY26 revenue | >$100B, +41% | Company release |
Q1 FY27 Azure guide | ~45% constant currency | Earnings call |
Commercial RPO | $678B, +84% (+25% ex-OpenAI) | Company release |
FY26 operating cash flow | $182.9B | Company release |
FQ4 free cash flow | $19.6B, -23% | Company release |
FQ4 capex incl. finance leases | ~$41B | Earnings call |
Q1 FY27 capex guide | >$50B | Earnings call |
Calendar 2026 capex | ~$175B post-reclassification | Earnings call |
Copilot paid seats | 30M+, net adds 2x QoQ | Earnings call |
GNG Fair Value | $524.84 | GNG Research |
Vulcan Fair Value | $511.12 | Vulcan MK5 |
GNG Rating | Good Buy | GNG Research |
GNG Quant Score / Rating | 54.3 / Hold | GNG Research |
Safety Score | 100.0 | GNG Research |
Quality Score | 90.5 | GNG Research |
Vulcan Overall vs Peers | 82 (Quality 99, Growth 99, Value 70) | Vulcan MK5 |
Altman Z-Score | 7.95 | GNG Research |
Piotroski F-Score | 5 (Vulcan reads 7) | GNG Research |
Interest coverage | 28.8x | GNG Research |
ROIC / 5Y avg | 28.0% / 28.7% | GNG Research |
Operating margin TTM / 5Y avg | 46.3% / 43.1% | GNG Research |
Capex / operating cash flow | 57.1% | GNG Research |
FCF conversion ratio | 0.58 | GNG Research |
FCF CAGR 3Y vs Revenue CAGR 3Y | 3.2% vs 12.4% | GNG Research |
Buyback yield / total shareholder yield | 0.71% / 1.62% | GNG Research |
Dividends / FCF | 35.5% | GNG Research |
Chowder Rule 5Y | 11.1% | Vulcan MK5 |
Earnings Power Value | $115.09 | Vulcan MK5 |
WACC | 9.2% | Vulcan MK5 |
Net debt / EBITDA | 0.04x | GNG Research |
Buy bands | Good $419.87 / Strong $377.88 / Very Strong $335.90 | GNG Research |
12-month return | -24.3% | GNG Research |
52-week range | $349.20 to $555.45 | Market data |
Sign in to leave a comment and join the discussion.
Sign Up Free