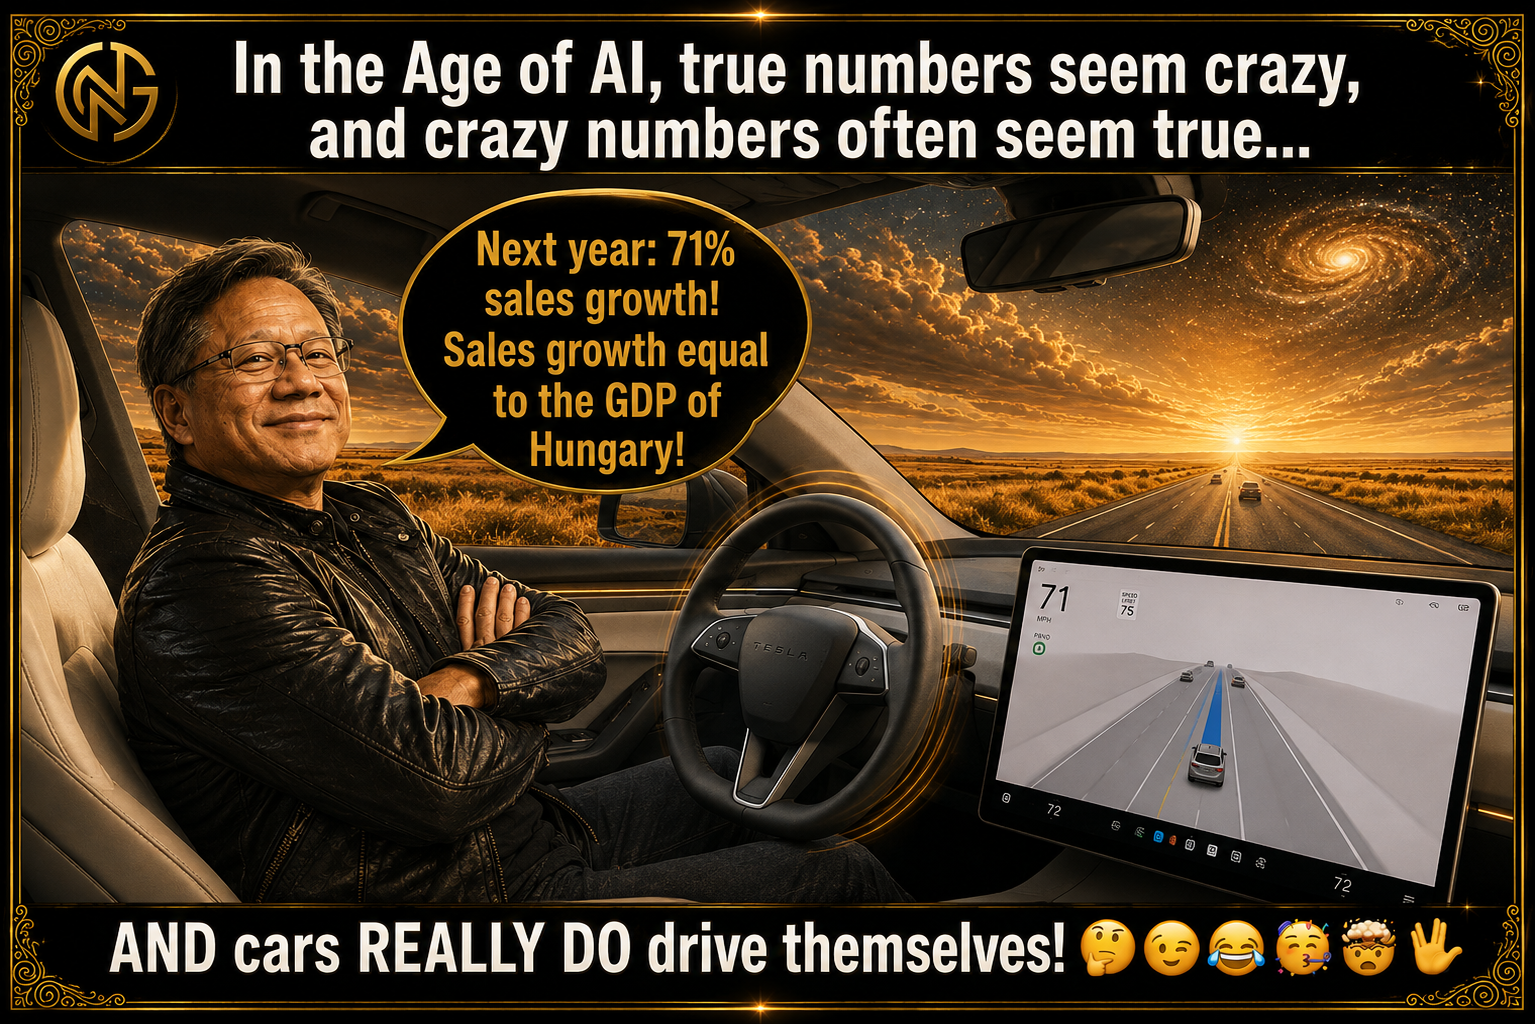

THE TLDR, FOR THOSE WHO SKIP THE BULLETS 😉…AND Everything Else😂
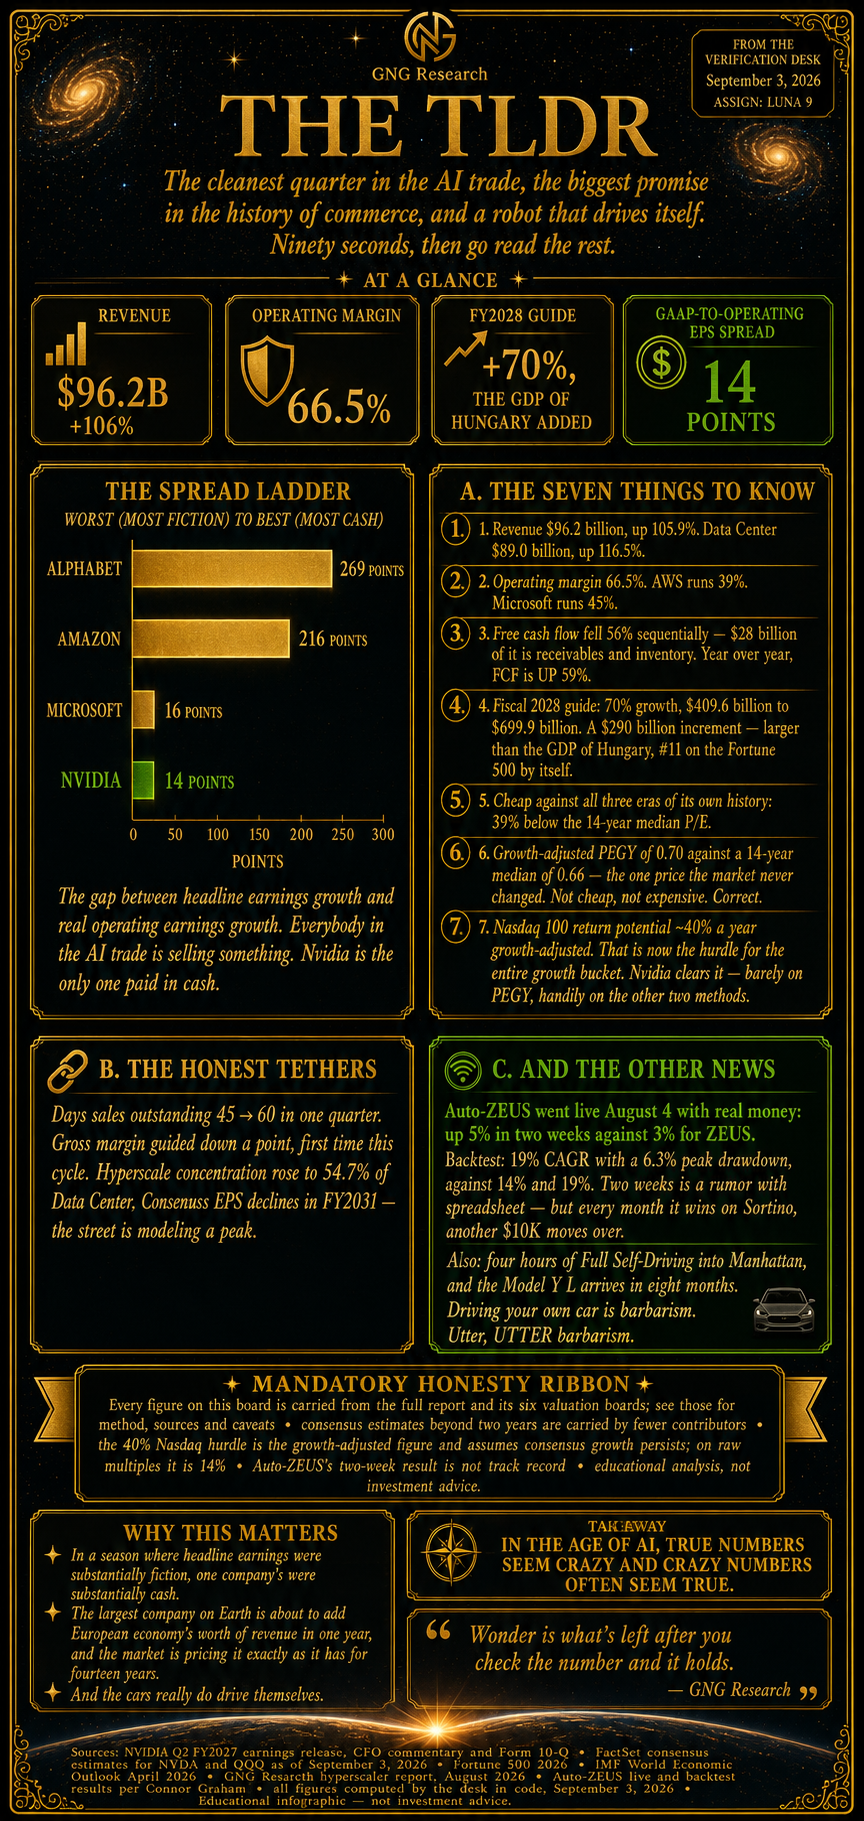
Nvidia grew 106%, ran a 66.5% operating margin, and posted the only clean income statement in a season where three of the largest companies on Earth manufactured their earnings by marking up private AI startups. Then Jensen guided to 70% growth on a $409 billion base — adding the GDP of Hungary in twelve months, which nobody has ever done. Free cash flow fell 56%? Working capital. They earned it; they haven't been paid yet. Cheap on every raw multiple across fourteen years of history, and priced EXACTLY at its growth-adjusted median — the one number the market never changed through gaming, crypto and AI. The Nasdaq 100 is now a 40% hurdle rate for the entire growth bucket, and Nvidia is the concentrated version of the same bet. Meanwhile, Auto-ZEUS beat ZEUS by 66% in its first two weeks of real money, and I rode Full Self-Driving into Manhattan and will never willingly drive a car again. Barbarism, Utter, UTTER BARBARISM!🤣
Accept any number, no matter how big. Just check it first 🖖
Let’s Celebrate The Fundamentals Justified Glory That Is Nvidia! And NYC! And Tesla?!🤔🤯
The next few weeks are going to be a firehose from this desk, so here's the flight plan 😉
Nvidia earnings. The economic update, including PEGY analysis for the S&P and Nasdaq. Enterprise AI adoption and spending from Ramp Capital's latest monthly. Part 2 of the optimal hedging bucket — SDCI is a top 1% ETF that Traveler found for us, and it needs to be in the optimization. VFLO update (Glenn's request). Glenn's three AI ETF review — VFLO and the growth ETFs can potentially replace individual stocks in ZEUS, which we're building into the optimizer options. And the Anthropic IPO preview, because the S-1 could land any day and an October IPO now looks likely per The Information.
By the time we're through all that, it'll be earnings season again 🤯
Meanwhile, Auto-ZEUS is running in the background, and we're working out how to track Auto-ZEUS against ZEUS side by side. That gets its own report.
SOME NYC VACATION-INSPIRED WONDERFUL NEWS
We started GNG Research to automate ZEUS — the family charity hedge fund that supports the entire ZEUS family, our charities, and the company while we scale.
I spent twelve years optimizing that fund by hand. Twelve years of reading filings at 2 a.m. so that a family and a set of charities could keep the lights on.
Then on August 4th, Connor turned on Auto-ZEUS with real money.
Two weeks later: Auto-ZEUS is up 5%. ZEUS is up 3%.
Sixty-six percent better returns. In real money. In two weeks 😱
Now the walk-forward backtest sitting underneath that:
AUTO-ZEUS: 19% CAGR with a 6.3% peak decline.
ZEUS: 14% CAGR (long-term) with a 19% peak decline.
Calmar ratio (CAGR/peak decline) of 3.02 vs 0.74 ZEUS = 4.1X better than ZEUS!
Sit with that pair, because five percentage points sounds like a rounding error, and it is not. Over twenty years, 14% turns a million dollars into $13.7 million. Nineteen percent turns it into $32.4 million. Same starting dollar, same twenty years, two and a half times the money 🤯
And you got there through drawdowns three times smaller.
As Connor reminds us, “Sleep is still a thing!”😉
That second part matters more than people think. Nineteen percent drawdowns are survivable. Six point three percent drawdowns are forgettable — and the forgettable ones are the ones you actually stay invested through. Half of investing is arithmetic. The other half is not throwing up in March.
Return per unit of pain: ZEUS 0.74. Auto-ZEUS 3.02. Four times better.
Now ,the honest part, because that's the house rule and I'm not going to skip it just because the number flatters me. Two weeks is not a track record. Two weeks is a rumor with a spreadsheet. Moving from ZEUS to Auto-ZEUS is a multi-year aeffortthat requires ongoing confirmation that GNG's algos and neural networks can genuinely outperform wmy own work
But every month Auto-ZEUS beats ZEUS on Sortino; we transfer another $10K — until eventually Auto-ZEUS becomes the primary asset the ZEUS family owns 🙏
AND THEN THERE'S SEAN
During my vacation in NYC I met up with Sean Yea, my oldest ZEUS friend.
10 years, we’ve known each other. We met on his financial blog and geeked out about various dividend investing strategies while I helped built Dividend Kings.
So I asked him what he actually wants. Not what return he's targeting. Not a number with commas in it. What he WANTS.
He said: to take road trips with his family. Anytime they want.
We’re planning a “finance bro” road trip next year to Seattle with a stop in Yellowstone.
And one day around the entire Continental US!
With the Tesla driving the entire time, of course😉
That's it. That's the whole dream.
Not a yacht. Not an island. Not a private jet with his initials on the tail. A Tuesday. The freedom to put his kids in a car on a Tuesday morning because the weather looked good and nobody had anywhere else to be 🥰
We are a species that figured out how to photograph our own planet from four billion miles away, and what a good man wants — what he ACTUALLY wants, when you ask him plainly — is to drive his family somewhere nice without asking anyone's permission.
That's been the dream since day one. White-mirror AI helps you dream bigger than you thought possible — and THEN you ask what returns you need to live that dream. The algos and the neural networks handle the rest. A hundred thousand global markets, across every kind of trading, and a recipe for every individual member's account.
Whatever you need to live your best life... the math will math 😉🤔
ABOUT THAT "ONE YEAR AWAY" THING
I know some of what we've been building feels like Tesla's Full Self-Driving — one year away, for the last decade 😂
But I did a four-hour road trip with Sean on Sunday. In FSD. Into NYC traffic, of all places, which is less a driving environment than a contact sport with lane markings.
The tech is FINALLY ready. Maybe not "pick up grandma from the airport on its own" ready — but this is science-based magic, and I am not being cute about it.
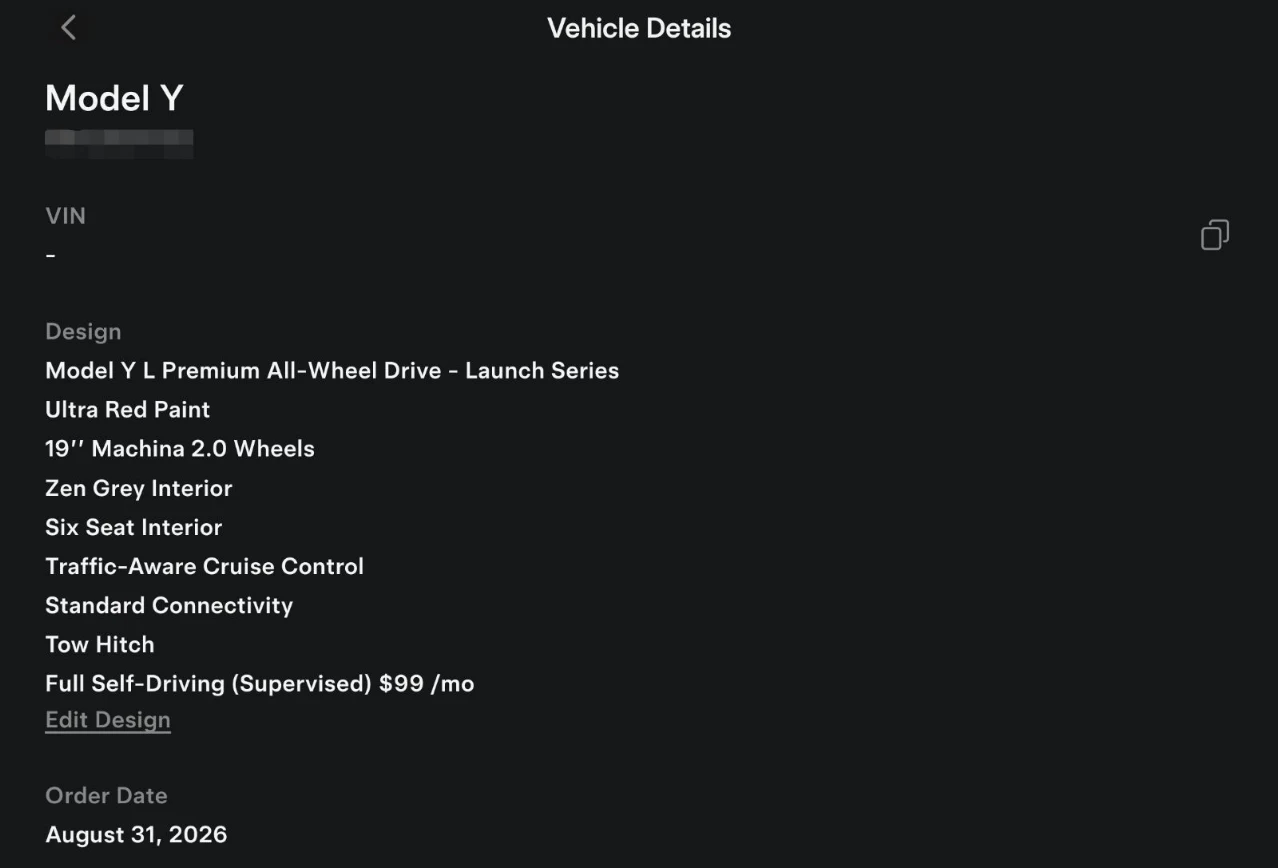
My family is getting a Tesla with FSD in eight months when the RAV4 lease is up. Because ever since that road trip, I cannot STAND driving.
I have to pay a thousand dollars a month for a car... AND DRIVE IT?!
Barbarism! Utter, UTTER BARBARISM! 🤣
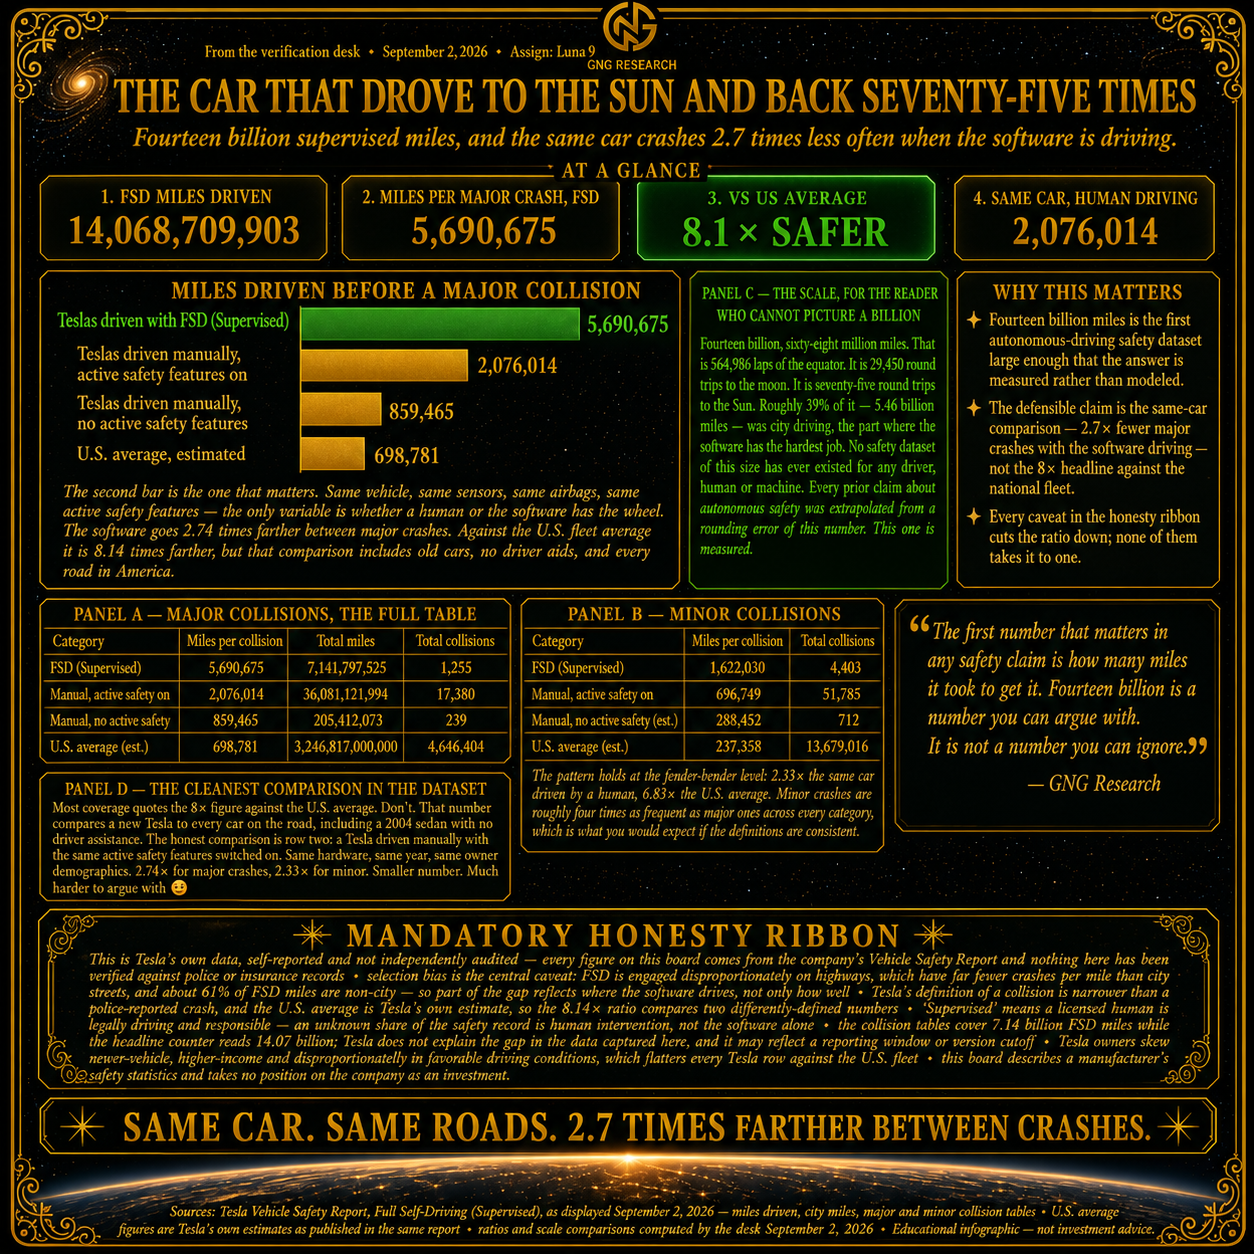
Sure, I love cool tech (I’m a nerd after all😉), but fundamentally we need something more than “robot cars are cool” to justify replacing a Toyota with a Tesla, but safety data like this = 92% optimal decision, so…8 months until my family can stop living in the UTTER BARBARISM of driving our own car😉😂
Toyota Is Offering To Buy Out The RAV4 Lease Early!
“Christmas Comes Early!” Adam to family
Turns out Christmas is coming late this year 😉…Typical Elon😂 This is going to be the most popular version of the world’s most popular car🤔…Elon PLEASE BUILD these instead of your cybercabs🤣
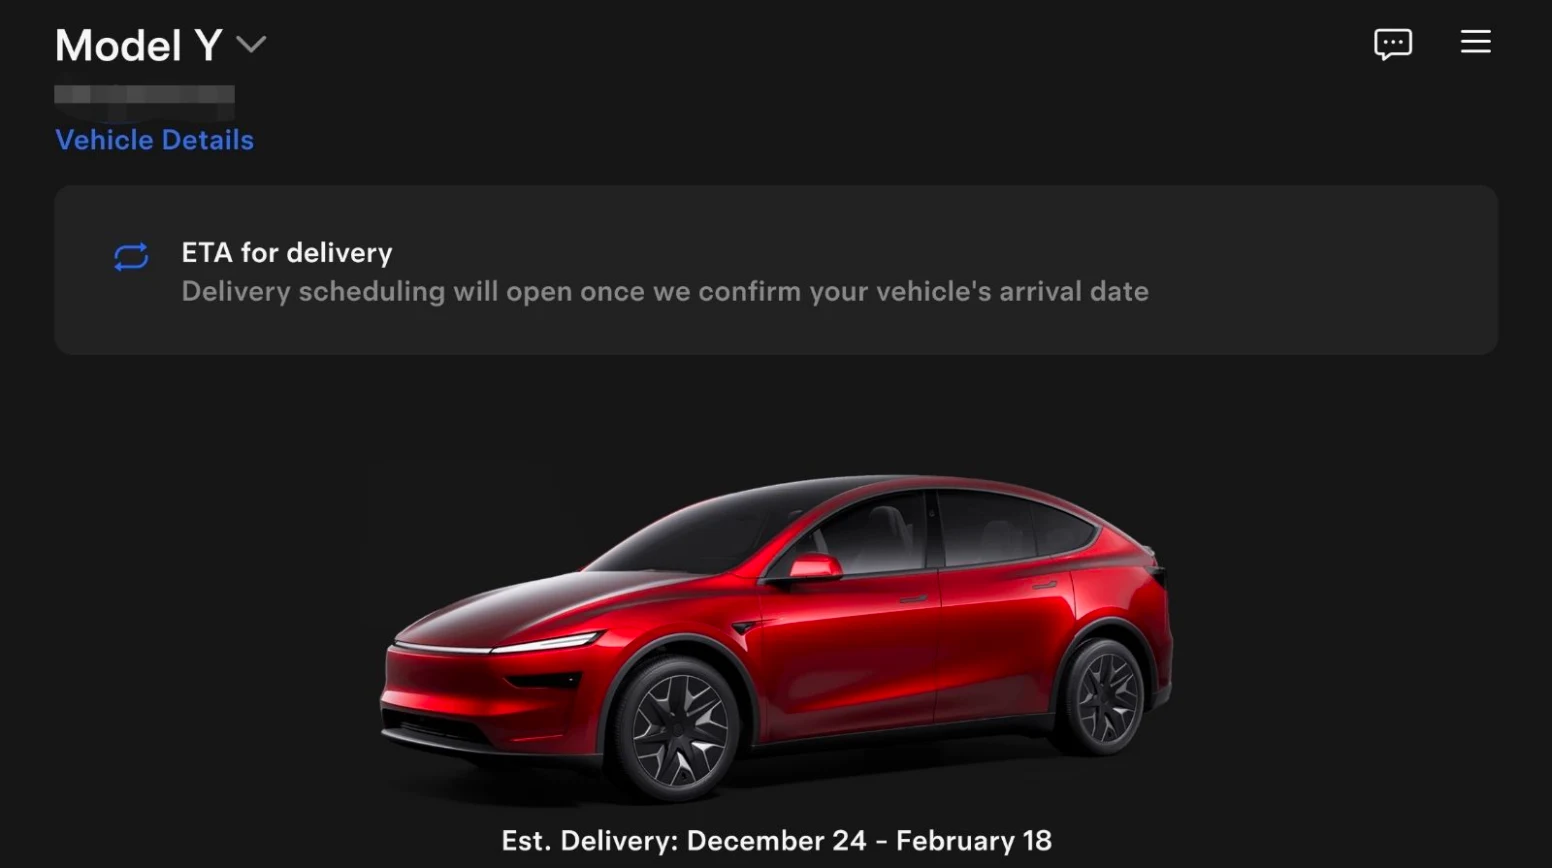
Model Y is the most popular car in the world in the last 3 years…and the waiting list on the Model Y L has gone from 2 months (June Launch) to 5 months by the end of August.
55% of new Tesla buyers are subscribing to FSD.
So most people are like us. “We’re paying $68K for FSD and getting a Tesla for Free😉🤣”
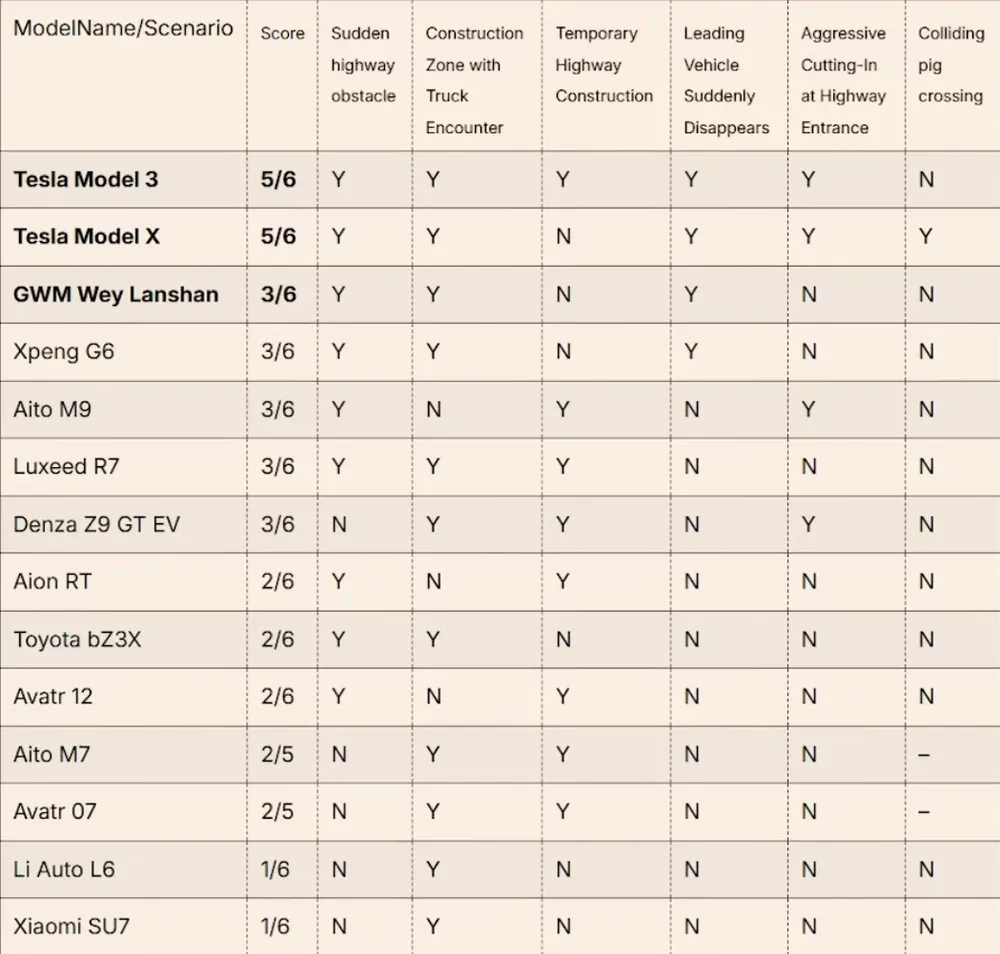
Key Sourcing & Testing Details: Conducted By: Dongchedi (懂车帝), one of China’s largest automotive testing and news publications. Reported & Translated By: CarNewsChina (which translated the original Chinese results table into the English version shown in your screenshot). Video Coverage: Analyzed by Sam Evans on The Electric Viking. Test Scope: Vehicles Tested: 36 production electric and hybrid vehicles sold in the Chinese market. Test Setup: A total of 15 obstacle scenarios—split into 6 high-speed highway scenarios (featured in your screenshot) and 9 complex urban scenarios. Scenarios Shown in the Chart: Sudden highway obstacle (stopping/evading at highway speeds) Construction zone with truck encounter Temporary highway construction Leading vehicle suddenly disappears/changes lane Aggressive cut-in at highway entrance/merge Colliding/crossing wild pig dummy Scoring Criteria: Y (Yes) indicated the vehicle successfully passed via autonomous emergency braking (AEB) or automated evasive lane change; N (No) indicated the vehicle failed to react properly or made contact with the obstacle.
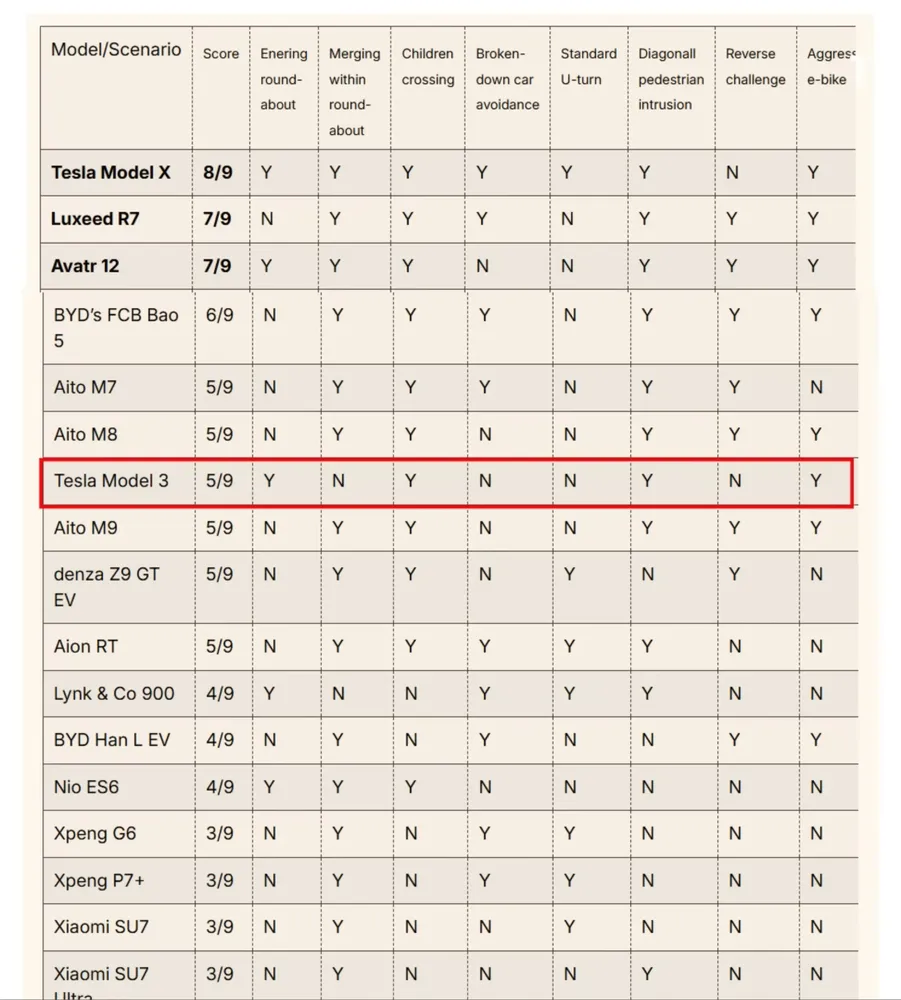
This chart shows the urban driving segment from the same Dongchedi test, covering complex city scenarios. The 9 Urban Scenarios Tested * Entering roundabout: Navigating entry into circular traffic. * Merging within roundabout: Lane positioning and merging while inside the circle. * Children crossing: Detecting and yielding to pedestrian child dummies. * Broken-down car avoidance: Steering around a stationary, stalled vehicle. * Standard U-turn: Executing a complete 180-degree turn autonomously. * Diagonal pedestrian intrusion: Reacting to a pedestrian crossing diagonally across the path. * Reverse challenge: Navigating a tight space or obstacle in reverse. * Aggressive e-bike: Detecting and reacting safely to sudden, erratic electric bikes/scooters cutting across traffic. --- Key Results & Takeaways * Tesla Model X Placed 1st (8/9): The Model X was the top-performing vehicle in the entire urban cohort, passing 8 out of 9 tests. It only failed the reverse challenge. * Huawei-Powered Vehicles Tied for 2nd (7/9): The Luxeed R7 and Avatr 12 (both running Huawei’s Qiankun ADS system) followed closely behind. * Tesla Model 3 Mid-Pack Finish (5/9): * Passed (Y): Entering roundabout, children crossing, diagonal pedestrian intrusion, and aggressive e-bike avoidance. * Failed (N): Merging within roundabout, broken-down car avoidance, standard U-turn, and the reverse challenge. * Roundabouts & U-Turns Were Common Chokepoints: Most vehicles struggled with roundabout entry and complex maneuvers like automated U-turns or reverse obstacles. The discrepancy between the Model X (8/9) and Model 3 (5/9) highlights how sensor placement, vehicle ride height, and differing software builds can yield substantially different results within the same brand.
Bottom Line: The North American Version of FSD (Which is even better than the Chinese or international versions) is the #1 self-driving tech.
Even the Superior Chinese EVs can’t hold a candle to what Tesla offers in its personal robo-taxis.
5 Star crash tests AND 8.1X less chance of a crash (and getting better by the month).
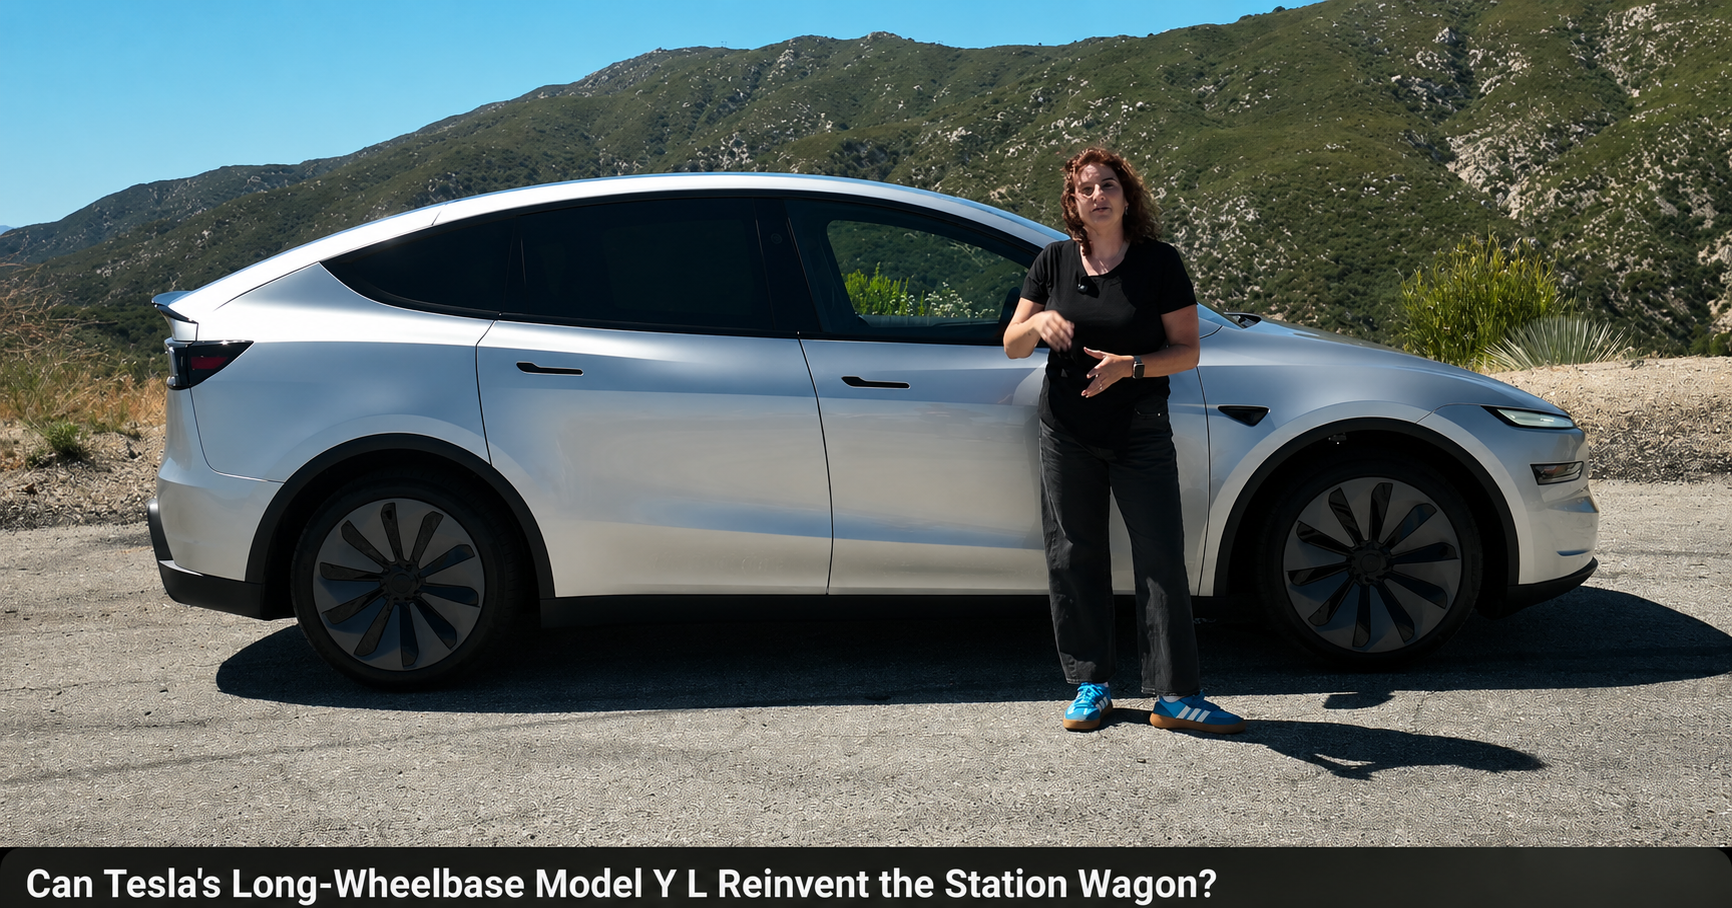
Model Y L the Ultimate Vegan family car😉🤔🥳
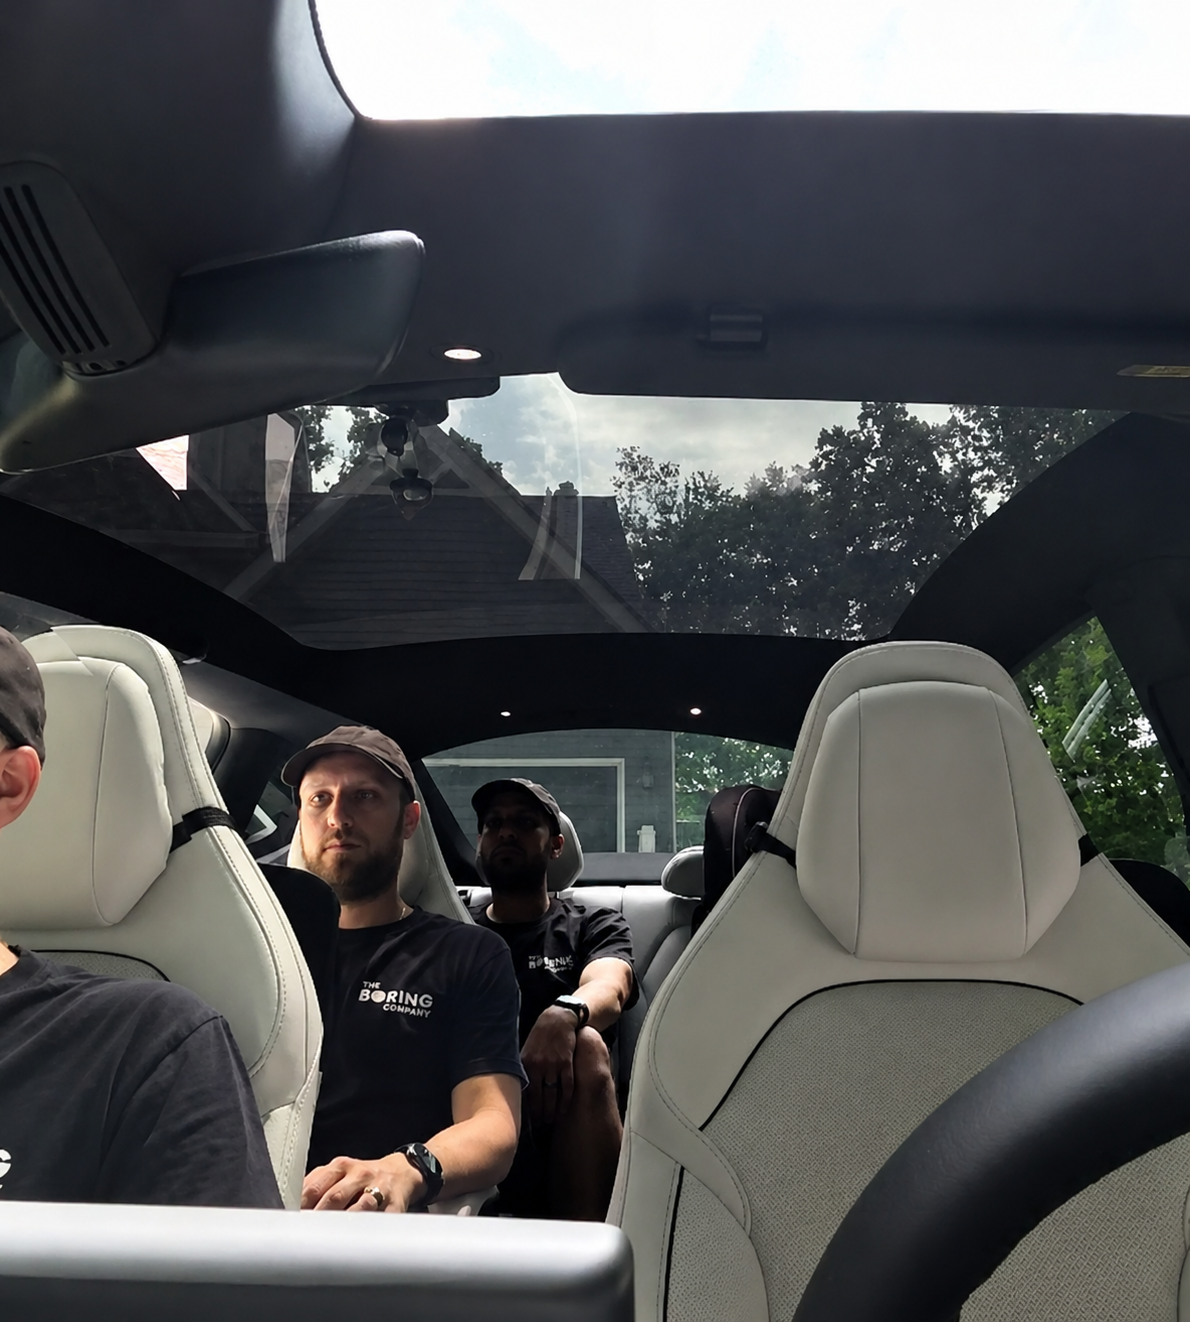
6 Adults fit in this thing!
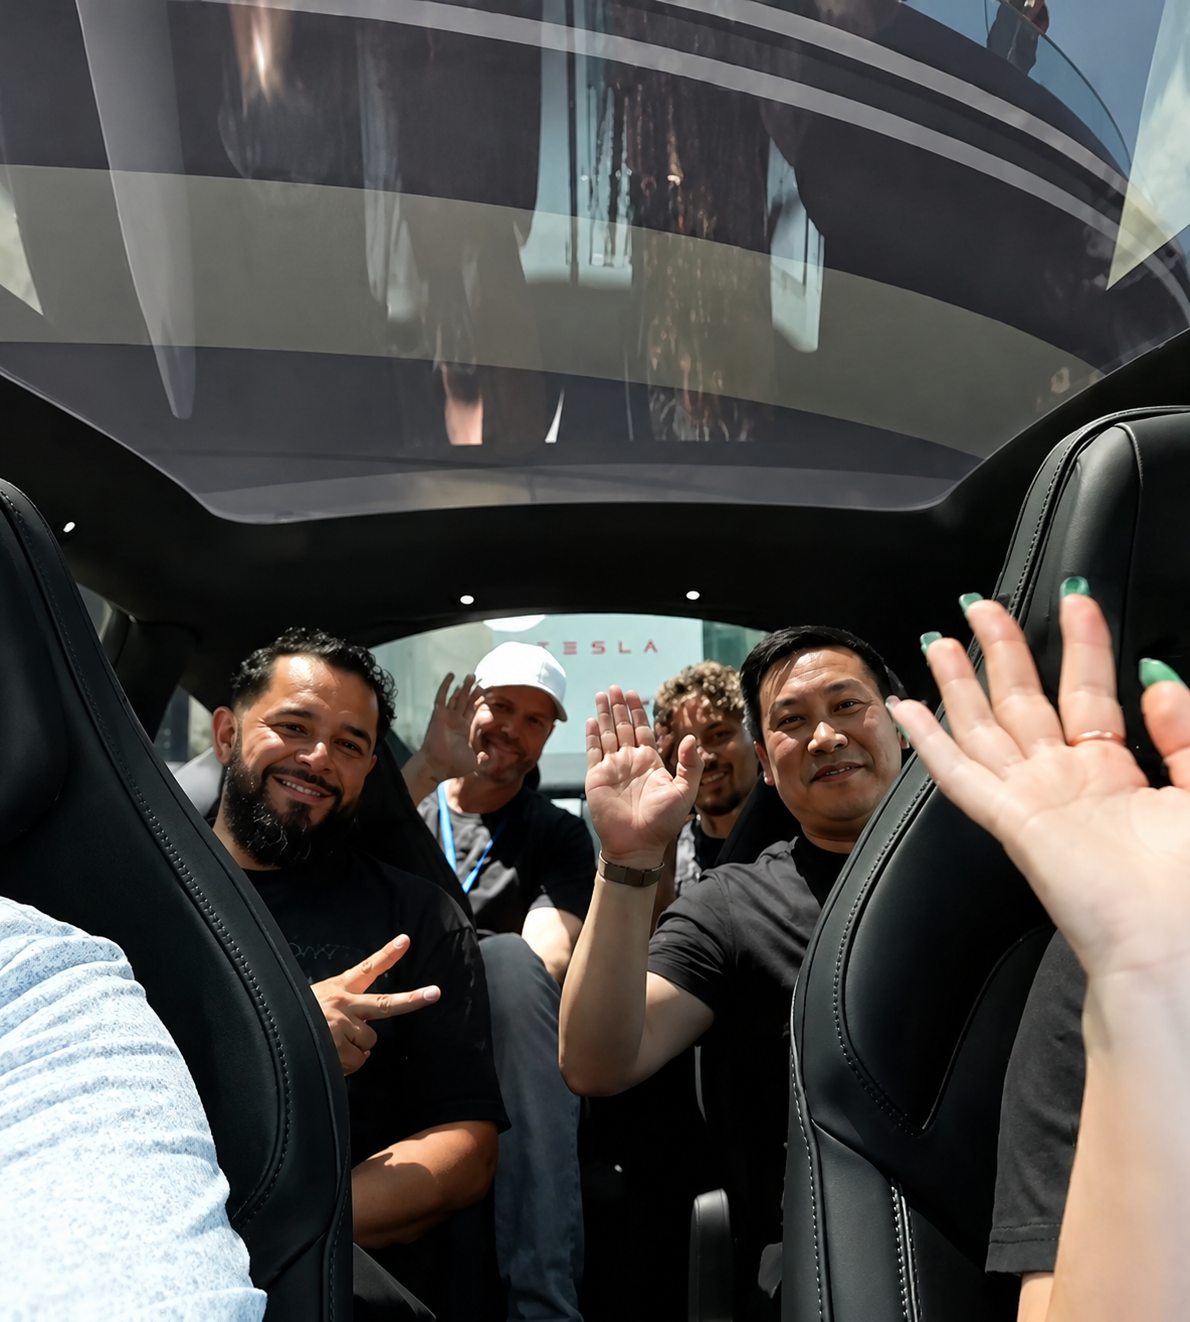
And 4 Car Seats!
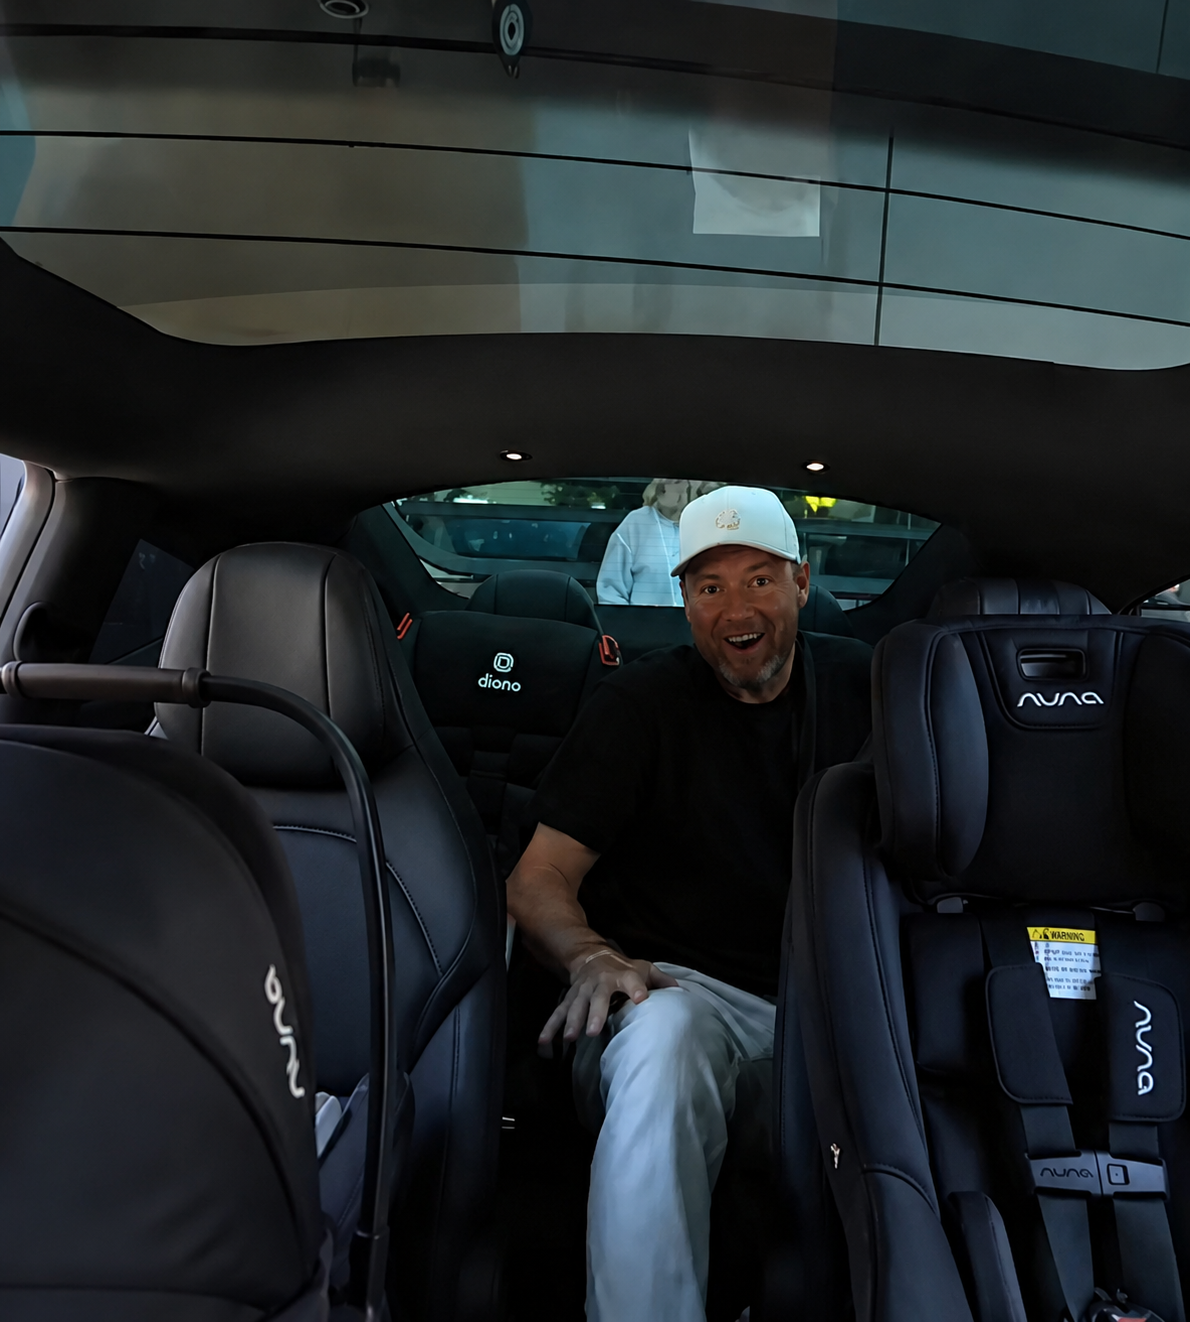
Even 6’4 Men Fit In The 3rd Row (Which is Heated, Reclining, Has Air Vents, Cup Holders, And USB Phone Chargers)

Silver In The Glass Deflects Heat + Nano Ceramic Glass Treatment (Which we’re getting) cuts 98% of UV rays and 90% of infrared heat
It increases the range by about 14 miles and mile per gallon equilvent by 10.5 mpg to 127.5 mpge
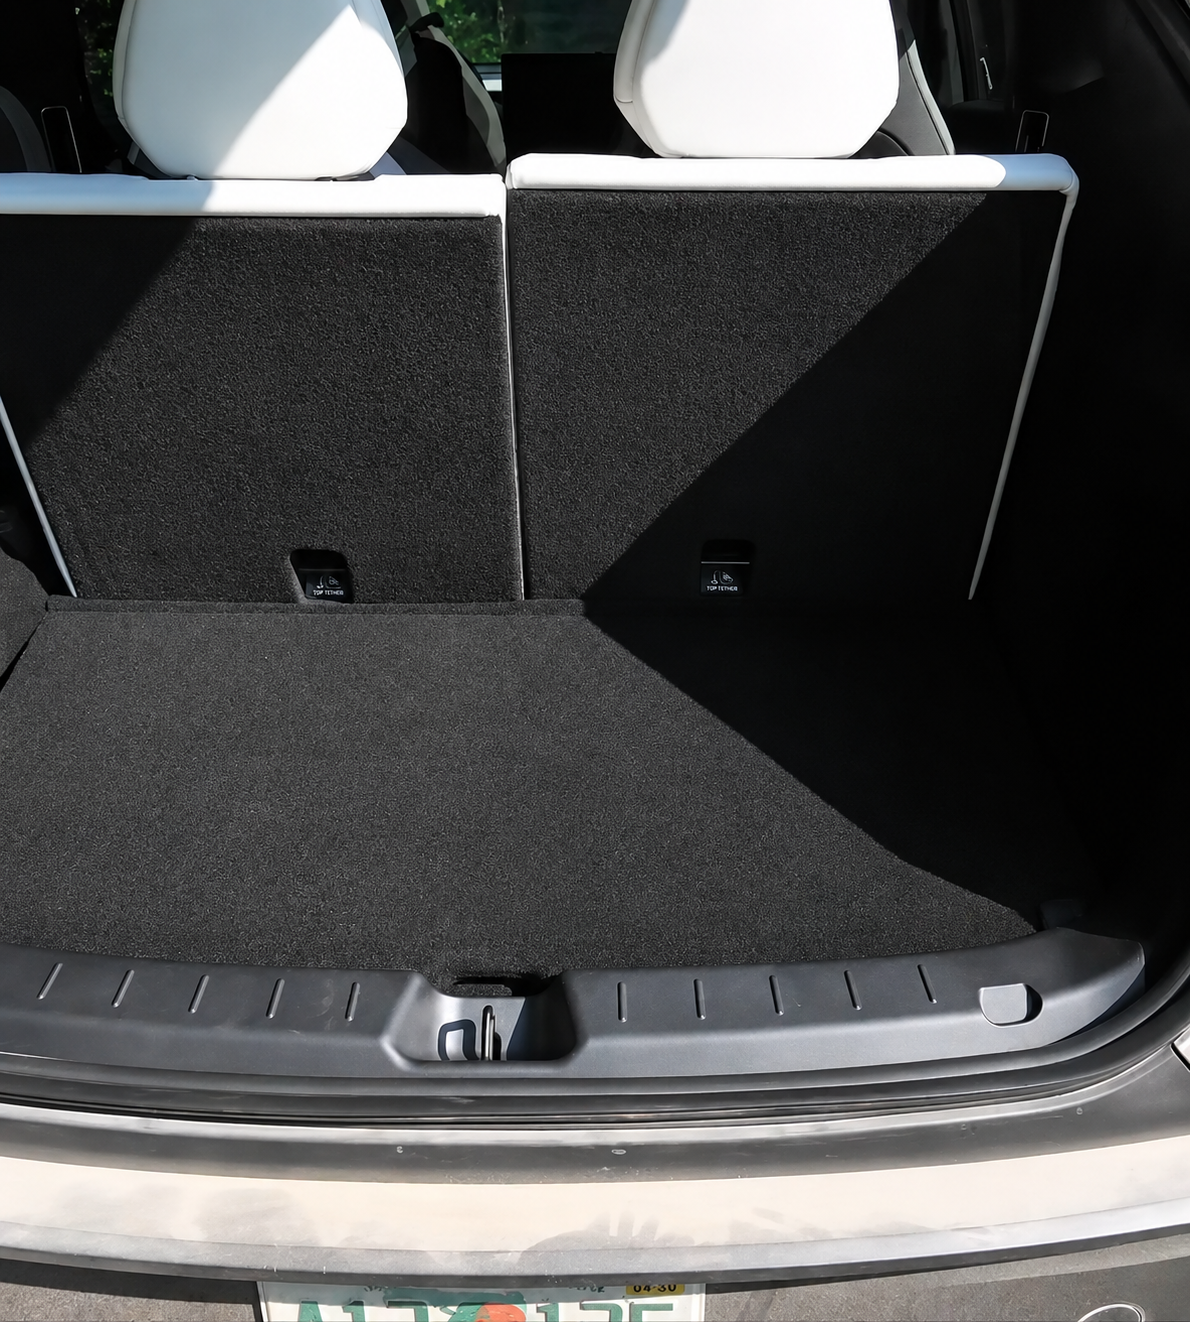
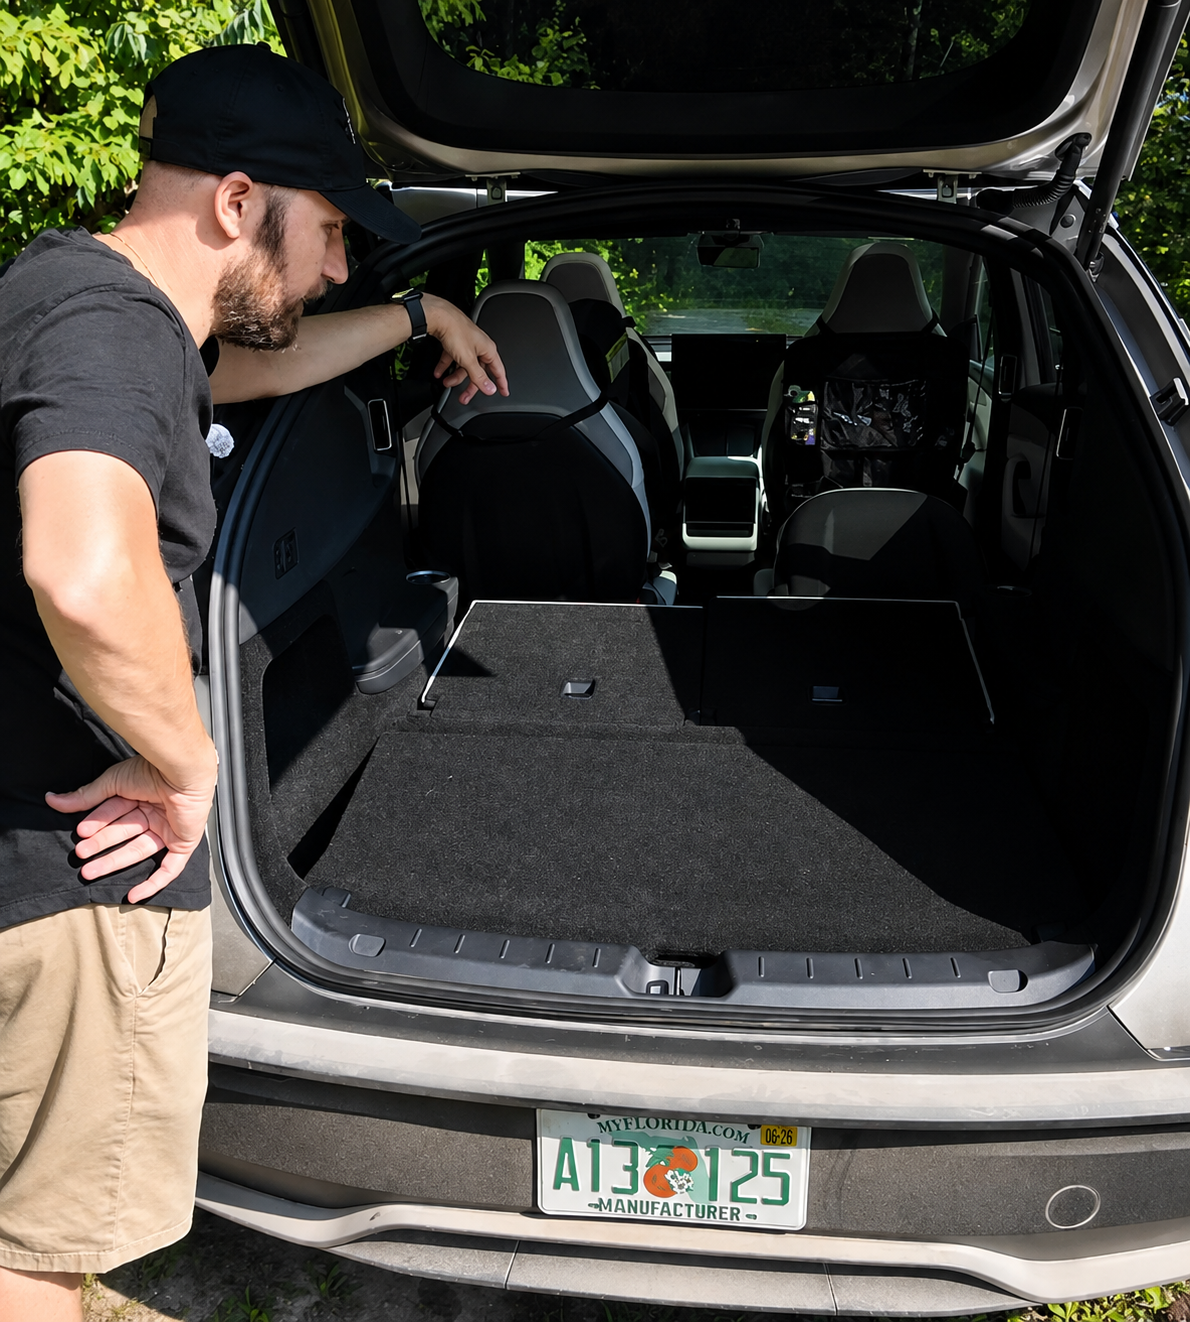
Lots of Storage Room No Matter How Many Seats You Need
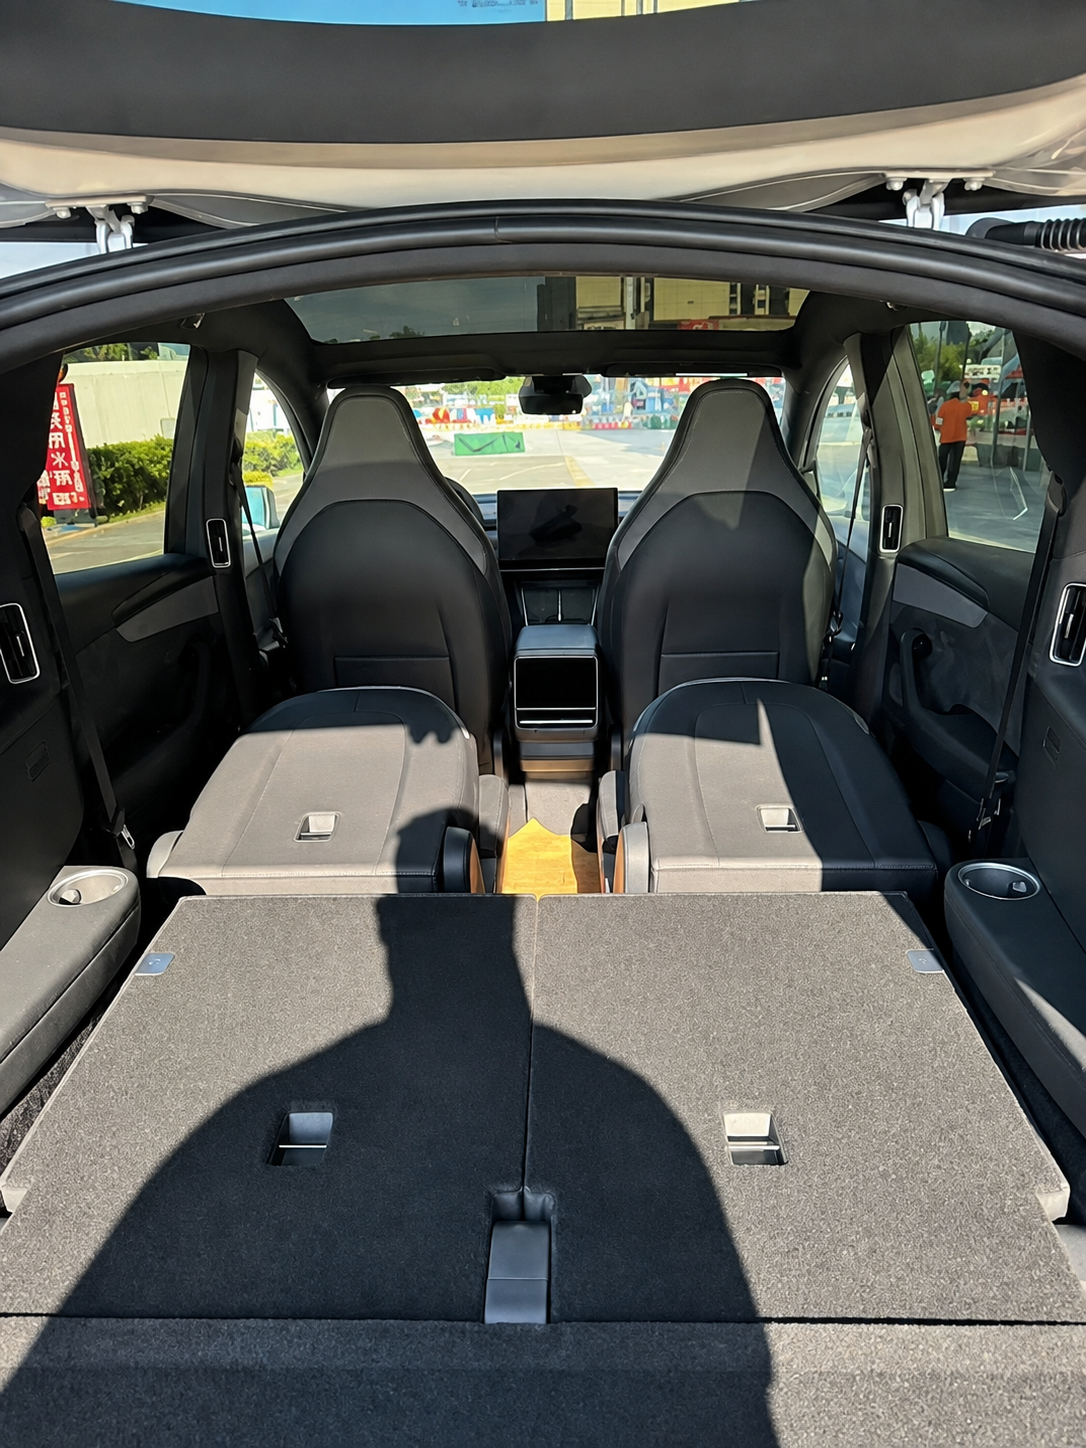
4,612 Pounds…BUT 127.5 MPG equivalent = over 2X more efficient than a Prius Plug-in Hybrid!
3X The Efficiency Of the RAV4 Plug-In Hybrid!
5X The Efficiency of the Honda CRV (Parents' main car)
BUT it’s bigger, safer, and drives itself! (and thus 8.1X safer still!)
Tesla, Your Engineers Are Amazing! 😉🤔🥳
WHY WE DO IT THIS WAY
GNG eats its own cooking. Everything we teach and everything we believe, we do — with our own money, in public, with the drawdowns printed right next to the returns.
Because we are not interested in max returns for their own sake. We aren't building "magic money machines" just so that a few rich dicks can become even richer! 😉
The AI age of abundance is a world in which everyone you care about is able to live a life that is their best, most enriching self.
If your daughter wants to be a poet in London? Done.
If your grandson wants to be a marine biologist studying Galapagos tortoises? Done.
If your wife or husband — or you — wants to quit a corporate job to volunteer full-time at a charity you believe in? Done.
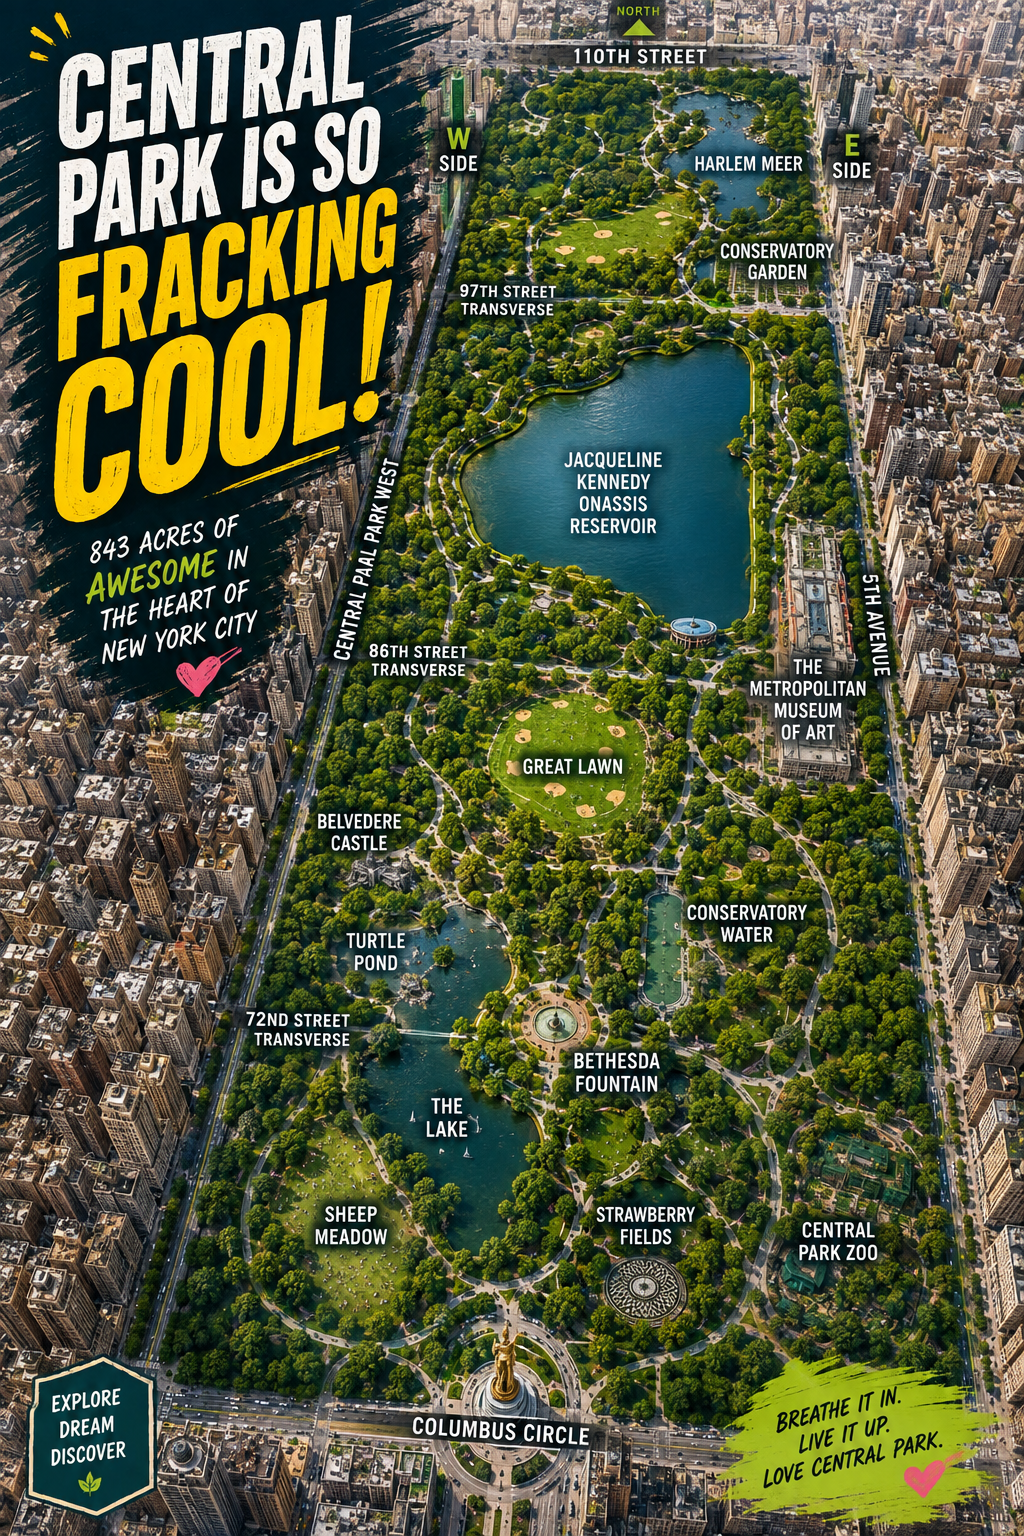
Or if you want to move your entire family to NYC because Central Park is SO FRACKING AWESOME! 😂

Money should NEVER be the limiting factor. Not on a life. Not on anyone's.
What life do you want? The "magic money machines" will figure it out. As the saying goes, "if it doesn't violate the laws of physics, engineers will find a way!"
Well, our team of engineers and egg heads 🤔 are hard at work on the systems that will allow us all to become NYC (and London) living tortoises studying poets who volunteer at animal shelters… or whatever fills your life with joy and meaning 🤣
THE ASTERISK-FREE QUARTER: Nvidia Reports 106% Growth, a 66% Operating Margin, and the Biggest Promise in the History of Commerce 🤯
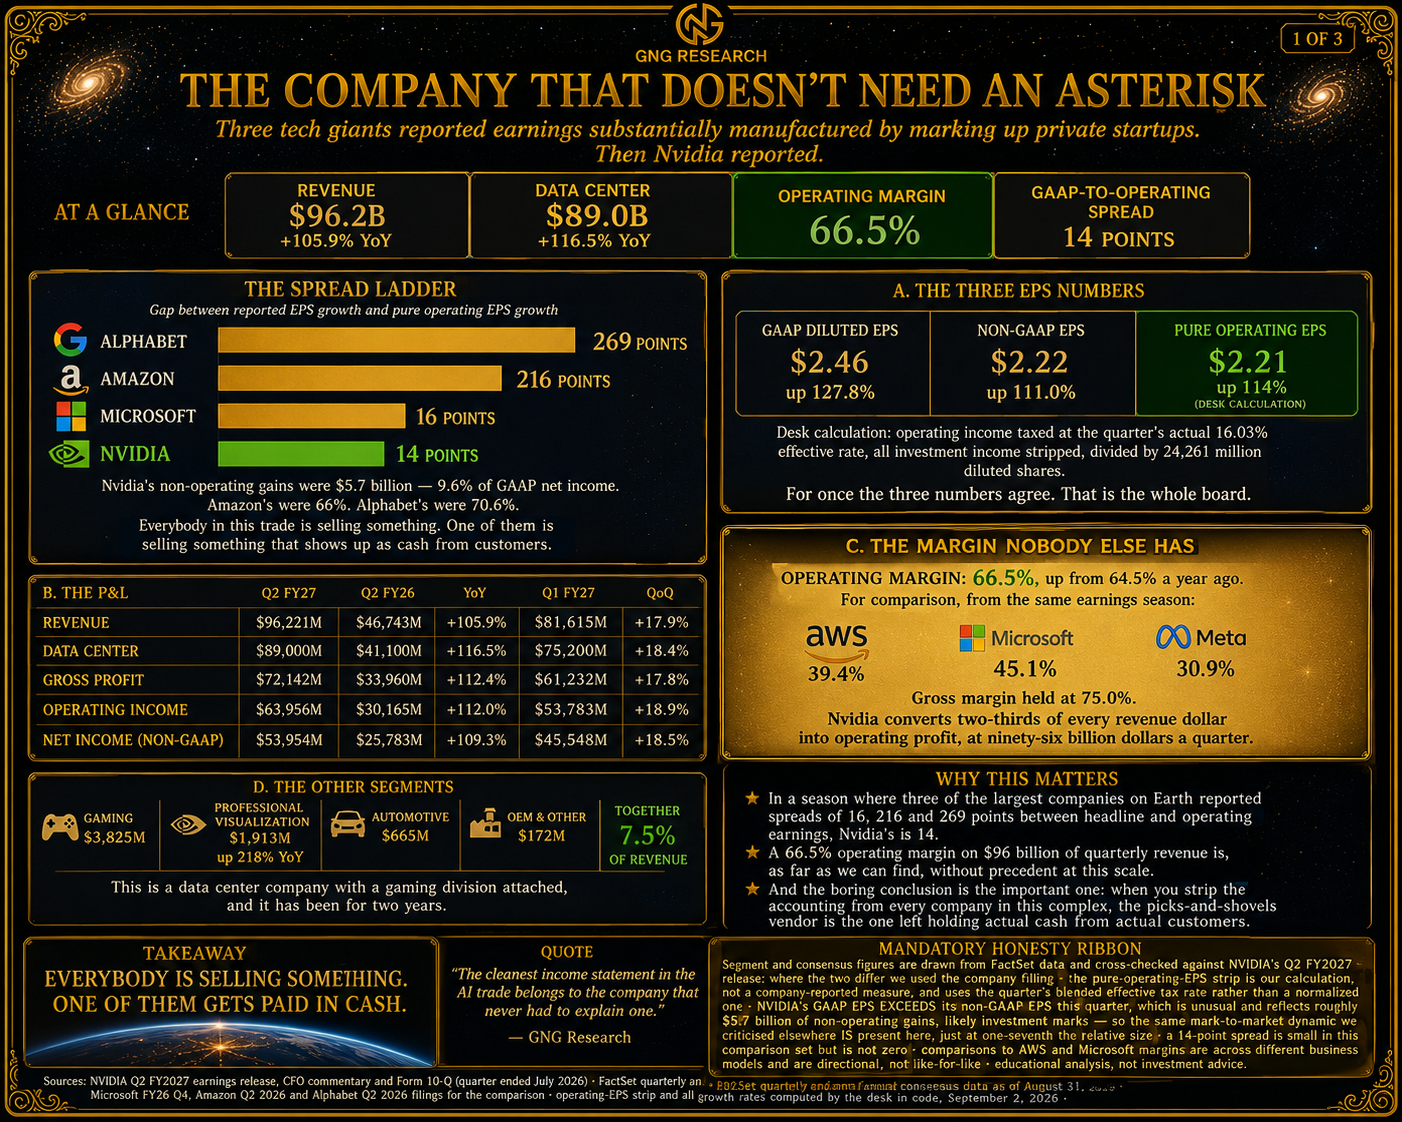
Three of the largest companies on Earth reported headline earnings this month that were substantially manufactured by marking up private AI startups they happen to own.
Microsoft's GAAP EPS grew 32% while its real operating earnings grew 15% — a sixteen-point spread. Amazon's was 216 points. Alphabet's was 269.
Then Nvidia reported. Let me show you what a clean quarter looks like 😉
Revenue of $96.2 billion, up 105.9% year over year and 17.9% sequentially. Data Center of $89.0 billion, up 116.5%. Gross margin 75.0%. Operating margin 66.5%.
Read that operating margin again. AWS — the best cloud business ever constructed — runs 39.4%. Microsoft runs 45.1%. Nvidia runs sixty-six and a half percent, on ninety-six billion dollars of quarterly revenue 😱
And now the number nobody else is going to run.
GAAP EPS: $2.46, up 127.8%. Non-GAAP EPS: $2.22, up 111.0%.
Strip every dollar of non-operating income, tax operating income at the quarter's actual 16.03% rate, divide by 24,261 million diluted shares:
PURE OPERATING EPS: $2.21, up 114%.
A fourteen-point spread. Nvidia's non-operating gains were $5.7 billion — 9.6% of GAAP net income. For Amazon that figure was 66%. For Alphabet, 70.6%.
Everybody in the AI trade is selling something. Nvidia is the only one selling something that shows up as cash from customers.
NOW THE PART THE BEARS WILL LEAD WITH, AND THEY'RE HALF RIGHT
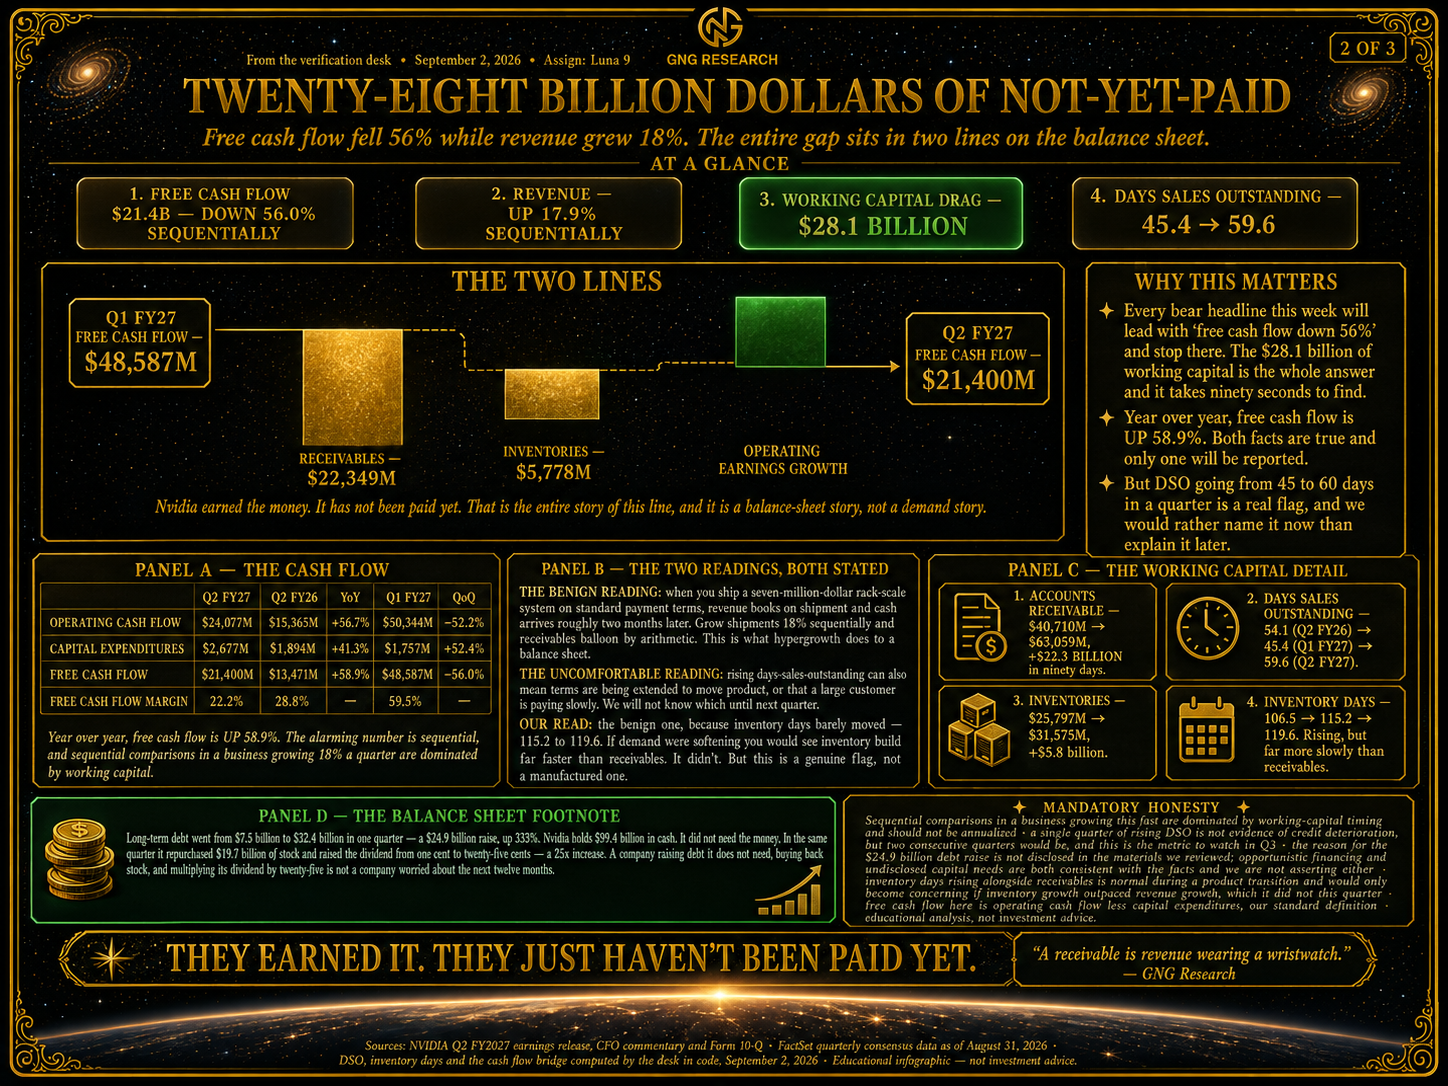
Free cash flow: $21.4 billion. DOWN 56.0% sequentially, from $48.6 billion in Q1.
Operating cash flow fell 52.2% while revenue GREW 17.9%. Free cash flow margin collapsed from 59.5% to 22.2% in ninety days.
Accounts receivable went from $40.7 billion to $63.1 billion. Up $22.3 BILLION in one quarter. Inventories went from $25.8 billion to $31.6 billion, up another $5.8 billion. Combined working capital drag: $28.1 billion.
That is the entire gap. Nvidia earned the money. They just haven't been paid yet.
Days sales outstanding went from 45.4 days to 59.6 days. That's the number to watch, and it cuts both ways.
The benign reading: when you ship a $7 million NVL72 rack to a hyperscaler on net-60 terms, revenue books on shipment, and cash arrives two months later. Grow shipments 18% sequentially, and receivables balloon by arithmetic. This is what hypergrowth looks like on a balance sheet.
The uncomfortable reading: rising DSO can also mean you're extending terms to move product, or that a customer is slow-paying. We will not know which until next quarter, and it's a genuine flag rather than a manufactured one.
The benign reading wins for now, because inventory days barely moved — 115.2 to 119.6 — and if demand were softening, you'd see inventory pile up far faster than receivables. It didn't. But watch Q3 🙏
And year over year? Free cash flow is UP 58.9%. Both facts are true. Only one of them will be reported.
AND HERE IS WHAT NOBODY ELSE CAUGHT: NVIDIA SPLIT THE DATA CENTER
For the first time, the Data Center line is broken into two pieces.
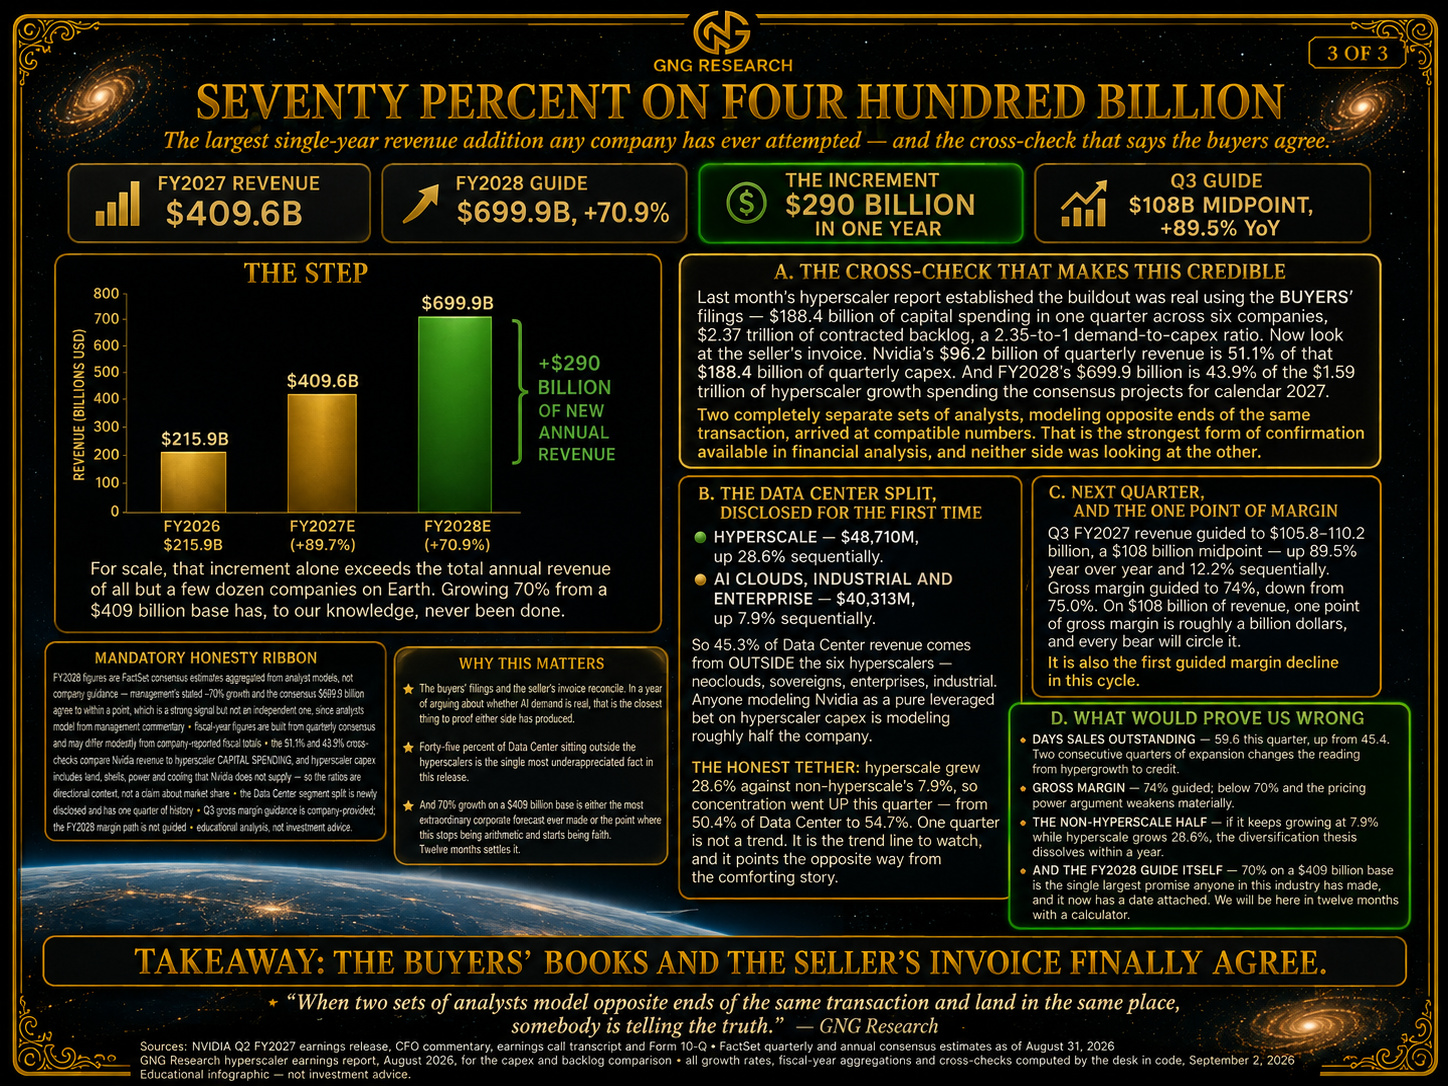
Hyperscale: $48.7 billion, up 28.6% sequentially. AI Clouds, Industrial and Enterprise: $40.3 billion, up 7.9%.
Which means 45.3% of Nvidia's Data Center revenue does not come from the six hyperscalers 🤯
Everyone modeling Nvidia as a leveraged bet on hyperscaler capex is modeling roughly half the company. The other half is neoclouds, sovereigns, enterprises and industrial customers — a base that is broader, more diversified, and considerably harder to kill.
Now the honest note, because it's the first quarter of this disclosure and it matters: hyperscale grew 28.6% sequentially while the non-hyperscale half grew 7.9%. The concentration got worse this quarter, not better — hyperscale went from 50.4% of Data Center to 54.7%. One quarter is not a trend. But it's the trend line to watch, and it points the opposite way from the comforting story.
THE GUIDE, AND WHY IT'S THE BIGGEST NUMBER IN THIS REPORT
Q3 revenue guided to $105.8–110.2 billion. Midpoint $108 billion — up 89.5% year over year.
Gross margin guided to 74%, down from 75.0%. That's the honest tether: a point of margin compression, and every bear will circle it. On $108 billion of revenue, one point is roughly a billion dollars. It's also the first guided margin decline of this cycle.
But the number that matters is the one Jensen gave for fiscal 2028.
Seventy percent revenue growth.
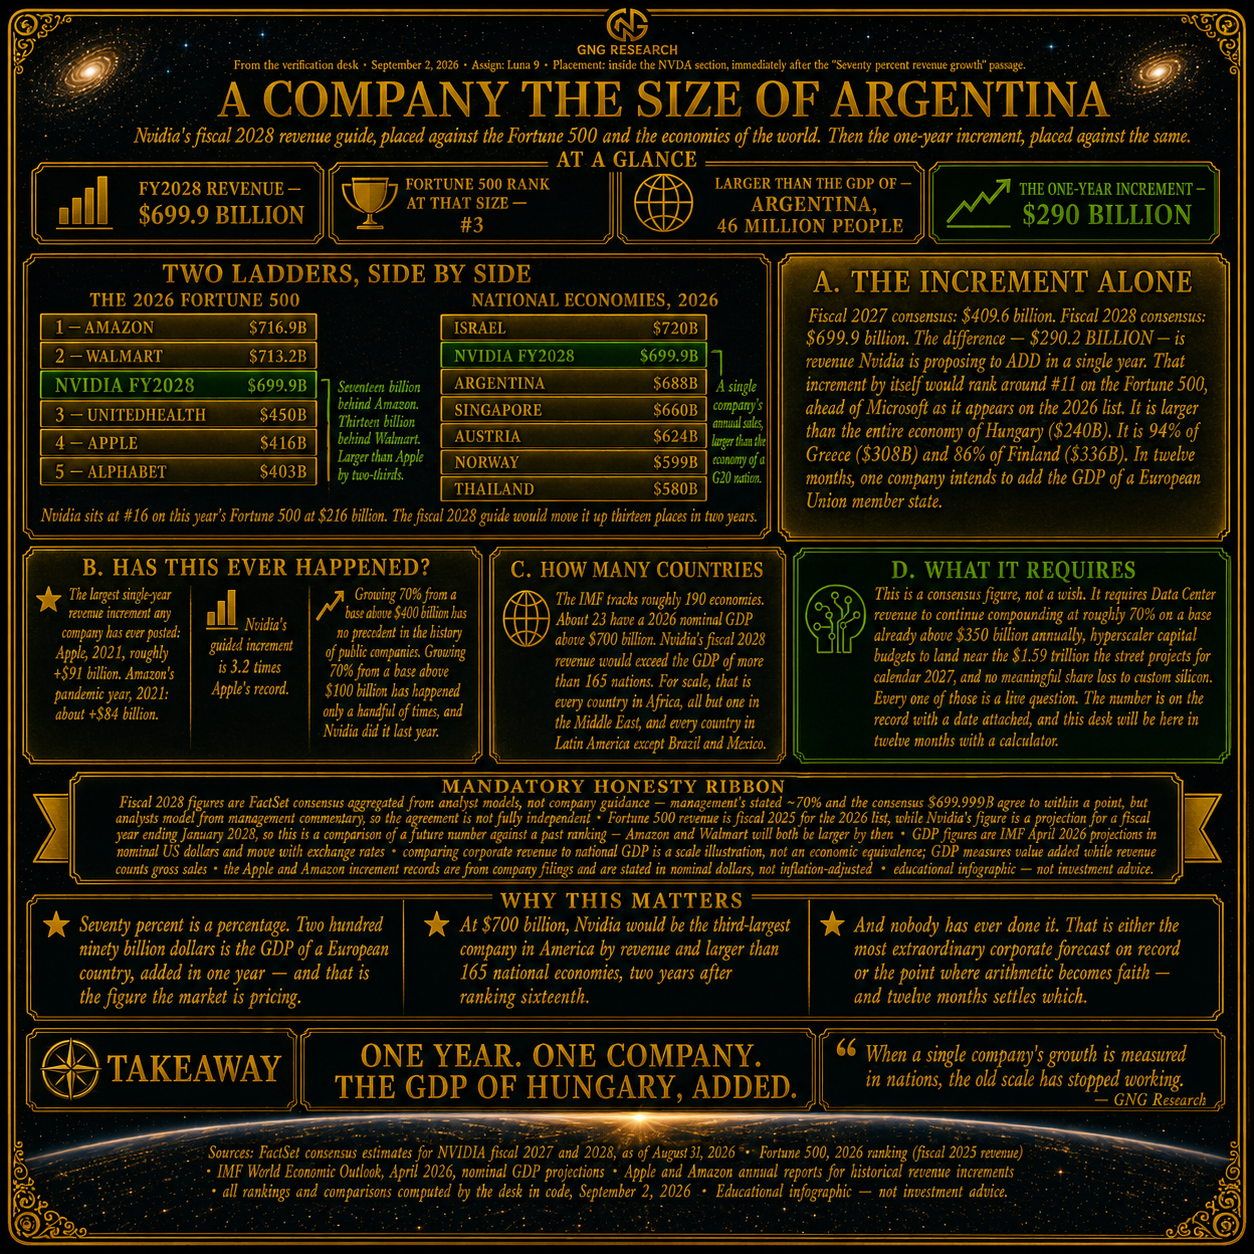
Consensus confirms it. FY2027 sits at $409.6 billion. FY2028 at $699.9 billion. That's +70.9% — Jensen's guide, to within a point 😱
Sit with the size of that increment. Two hundred ninety BILLION dollars of additional annual revenue, in one year.
For scale: that increment alone is larger than the entire annual revenue of every company on Earth except a few dozen. Nvidia is proposing to ADD, in twelve months, more revenue than Tesla generates in total.
And the base is already $409 billion. Growing 70% from a base that size has, to my knowledge, never happened in the history of commerce 🤯
Fun fact: by 2030, Nvidia's consensus revenue is expected to exceed $1 trillion, and only Amazon is expected to exceed it.
And by 2032, NVDA revenue = the GDP of Poland!
By 2029, Free Cash Flow Alone will be equal to the GDP of Denmark🤔
HOW IT CONNECTS TO EVERYTHING FROM LAST MONTH
Three things, and they're the whole thesis.
One. Nvidia's quarterly revenue of $96.2 billion is 51.1% of the $188.4 billion those six hyperscalers spent on capital in the same quarter. Last month's report said the buildout was real. This is the receipt from the other side of the invoice.
Two. Traveler's RIA chart showed commercial chips capturing 13.0 cents of every dollar of AI profit, compared with hyperscalers' 29.7. That looked like a knock on Nvidia. Look at the operating margin — 66.5% — and you see what the chart actually means: the hyperscaler tier is larger in aggregate, but Nvidia converts a far higher share of each revenue dollar into profit. Both facts, same page.
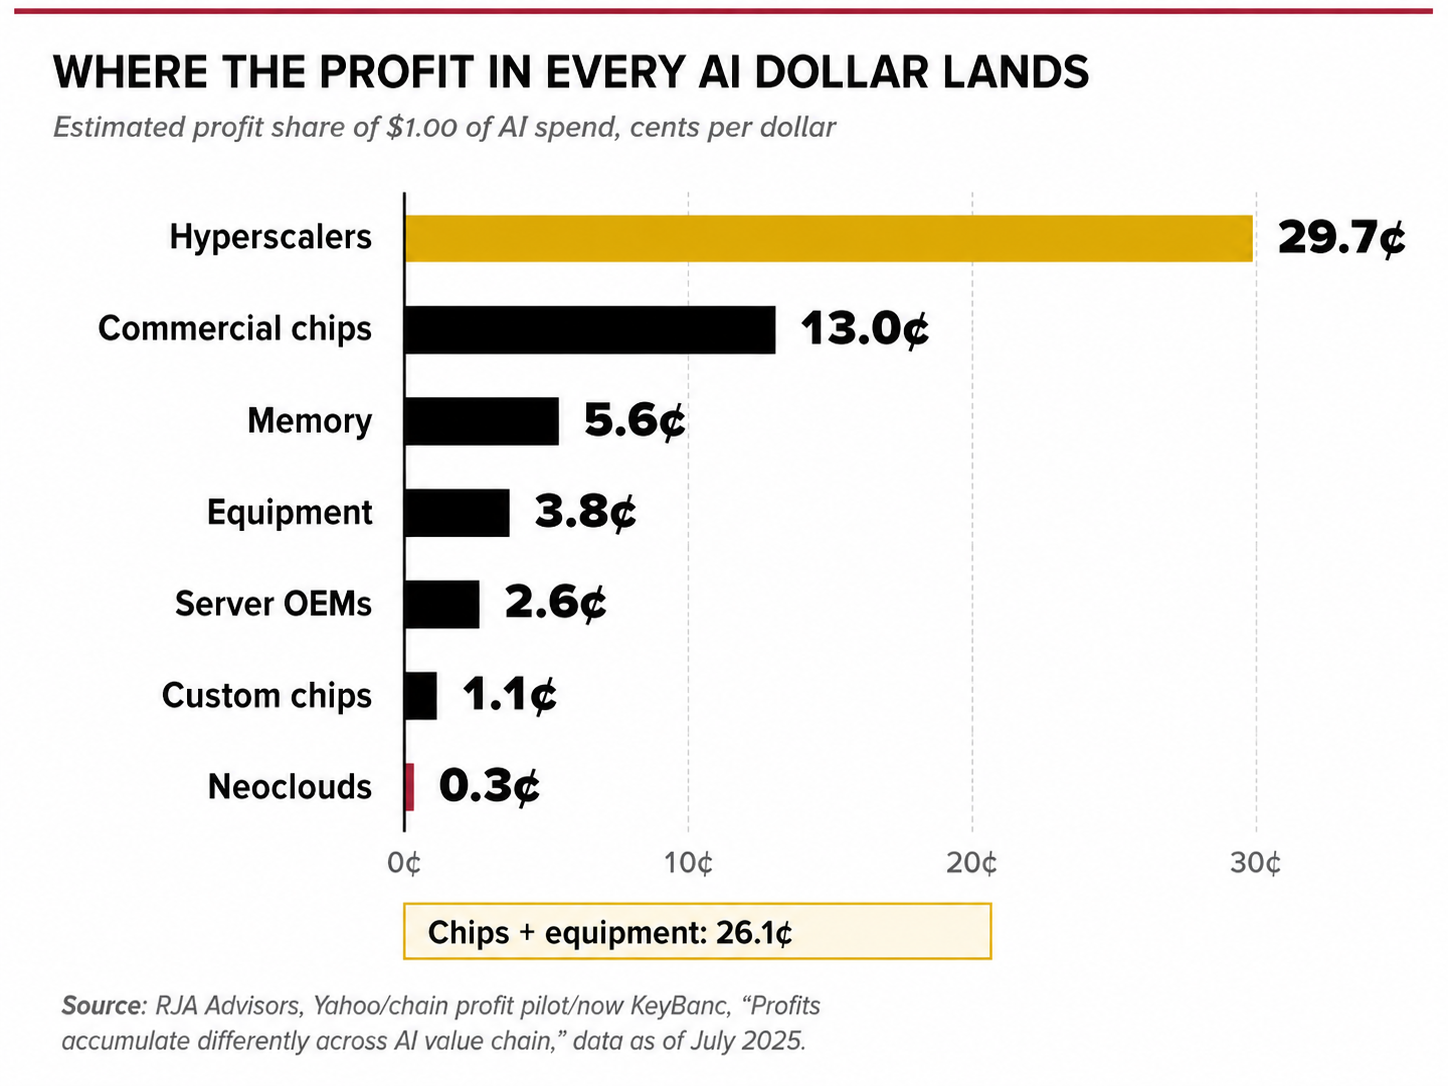
A super useful chart Traveler found for us!
56% of AI profits go to hardware leaders like NVDA and hyperscalers.
Will that change? Maybe, BUT NO ONE thought that they would command 56% of profits 4 years into the AI boom...so picks and shovels are where the money is at for now🤔
Three. FY2028's $699.9 billion is 43.9% of the $1.59 trillion of hyperscaler growth spending that the consensus projects for calendar 2027. Which is the cleanest cross-check in this entire series: the money the buyers say they'll spend and the money the seller says it'll collect reconcile. Two completely different sets of analysts, modeling opposite ends of the same transaction, arrived at compatible numbers 🖖
THE BALANCE SHEET FOOTNOTE WORTH A LOOK
Long-term debt went from $7.5 billion to $32.4 billion in a single quarter — a $24.9 billion raise, up 333%.
Nvidia has $99.4 billion in cash. It did not need the money. Which means this is either opportunistic financing at attractive rates, or capacity for something not yet announced. And in the same quarter they bought back $19.7 billion of stock and raised the dividend from a penny to a quarter — twenty-five times.
A company raising debt it doesn't need, buying back stock, and multiplying its dividend by 25x is not a company worried about the next twelve months 😉
THE HONEST LEDGER
Against: free cash flow down 56% sequentially. DSO out from 45 to 60 days. Inventory days at 119.6. Gross margin was guided down a point. Hyperscale concentration is rising, not falling. And a FY2028 guide that requires the largest single-year revenue addition any company has ever attempted.
For: revenue up 105.9%. Data Center up 116.5%. Operating margin at 66.5%. A fourteen-point GAAP-to-operating spread in a season where the average was over a hundred. Nearly half of the data centers are outside the hyperscalers. Q3 guided to +89.5%. And a balance sheet with $99 billion of cash that just raised $25 billion more for reasons it hasn't explained.
Jensen has never overpromised in a way anyone can find. This quarter didn't change that. But 70% growth on a $409 billion base is the largest promise anyone in this industry has made, and now it's on the record with a date attached.
We'll be here in twelve months with a calculator.
Wonder, audited.
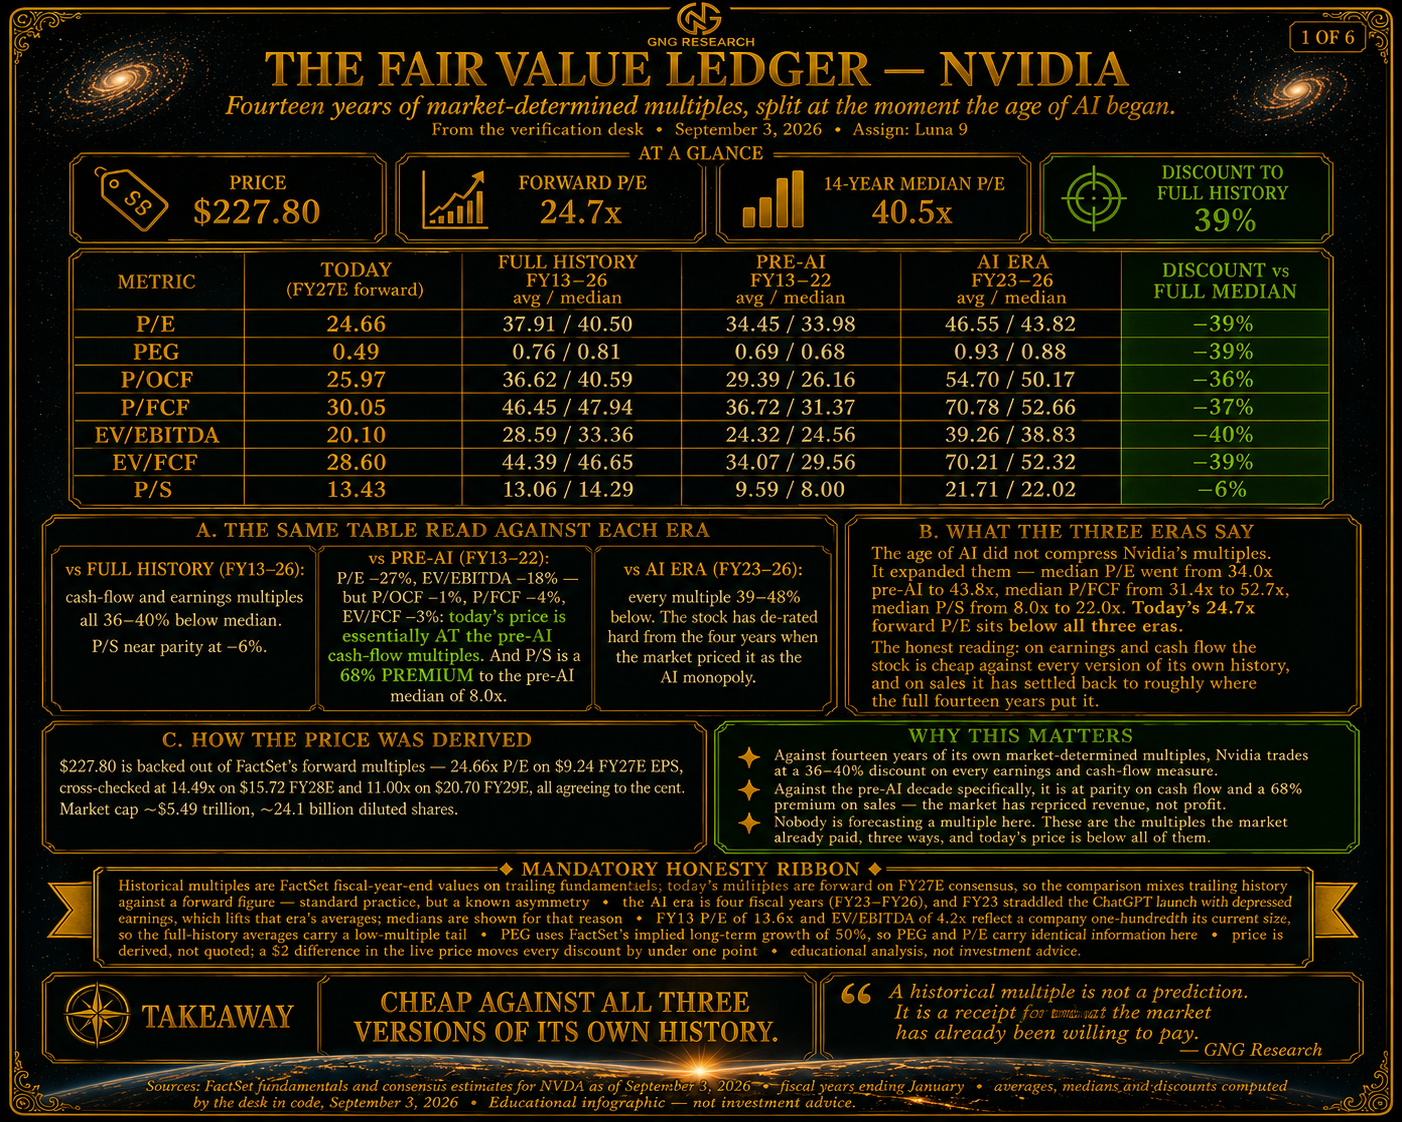
CHEAP AGAINST ALL THREE VERSIONS OF ITS OWN HISTORY
Anyone claiming NVDA is expensive? Sorry, you’re wrong😉
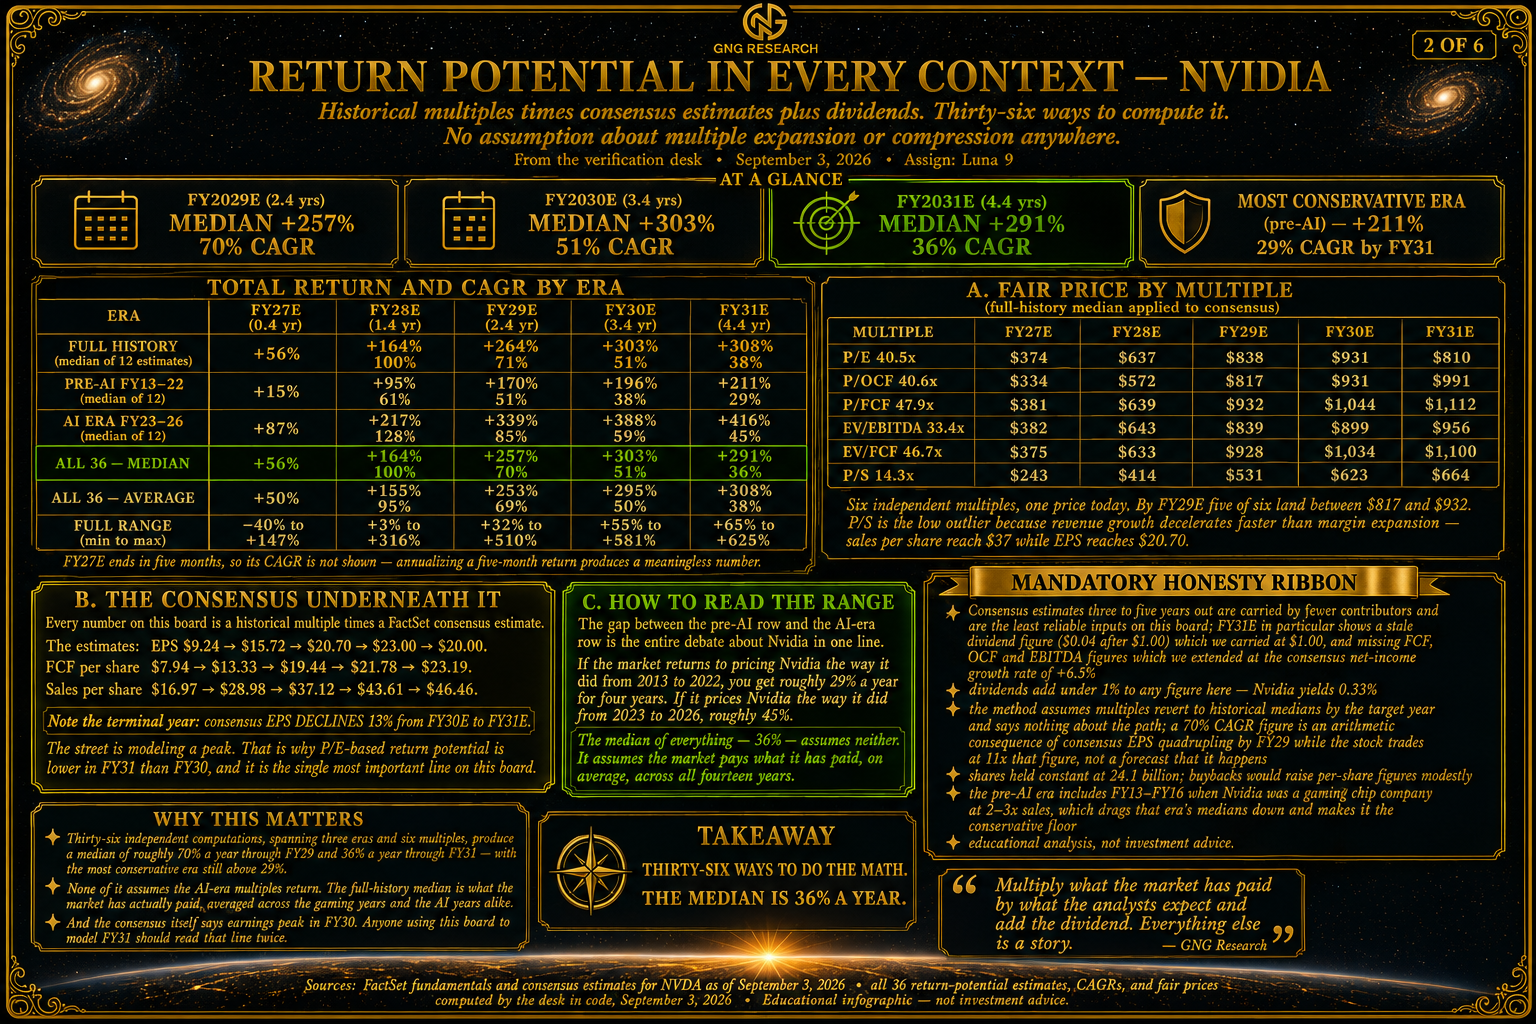
What is the return potential of NVDA?
Historical multiples X consensus fundamental estimates + dividends = total return, and CAGR is the annualized return.
ZERO speculation, purely historical fair value multiples + current consensus (which rises every quarter).
How does Nvidia compare to Tech stocks?
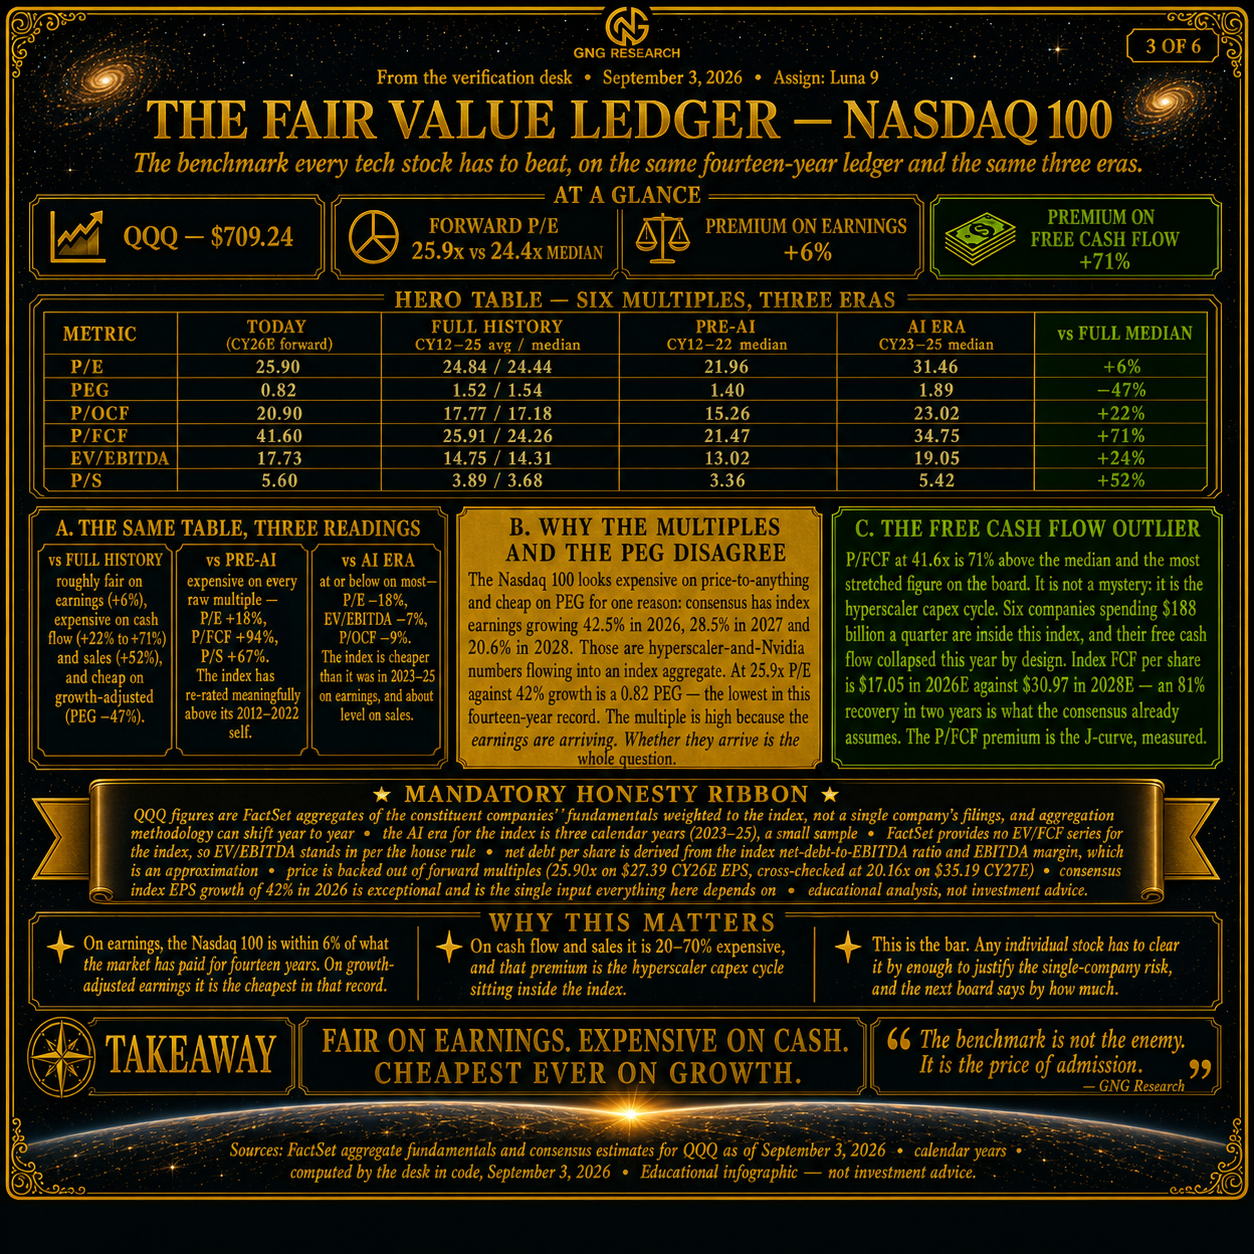
Nasdaq IS only overvalued IF you ignore that FCF is growing 2X faster than historical rates AND that Capex is driving this…Hyperscalers can crank up growth and keep it high unless they want to stop growth spending (and why would growth stocks do that?)
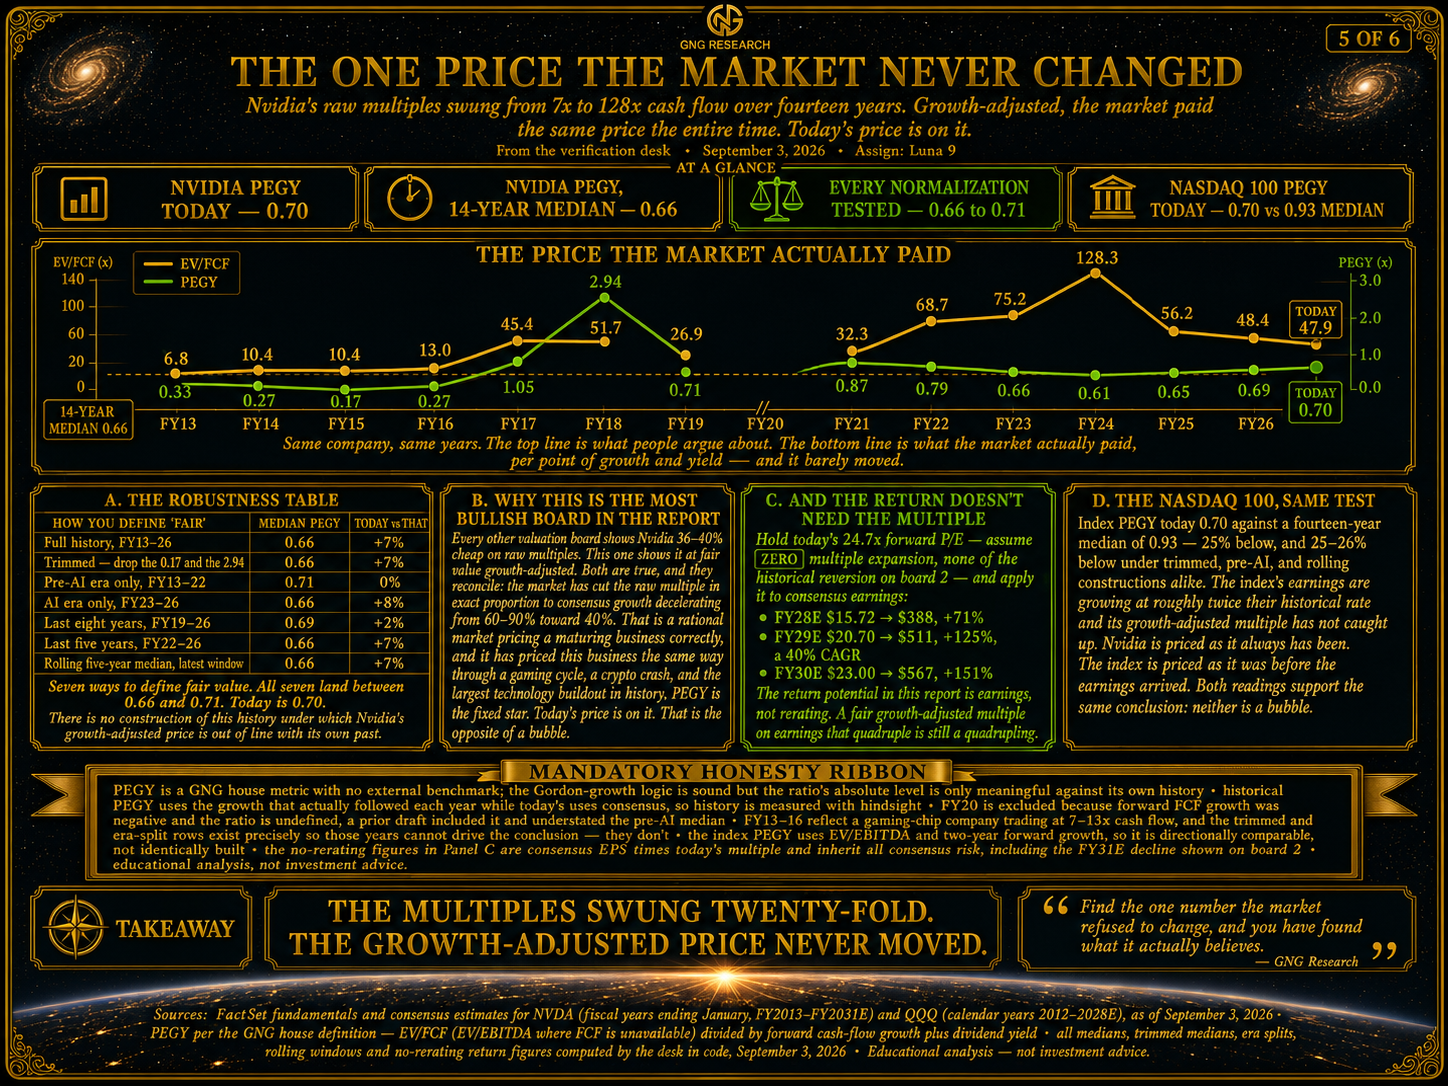
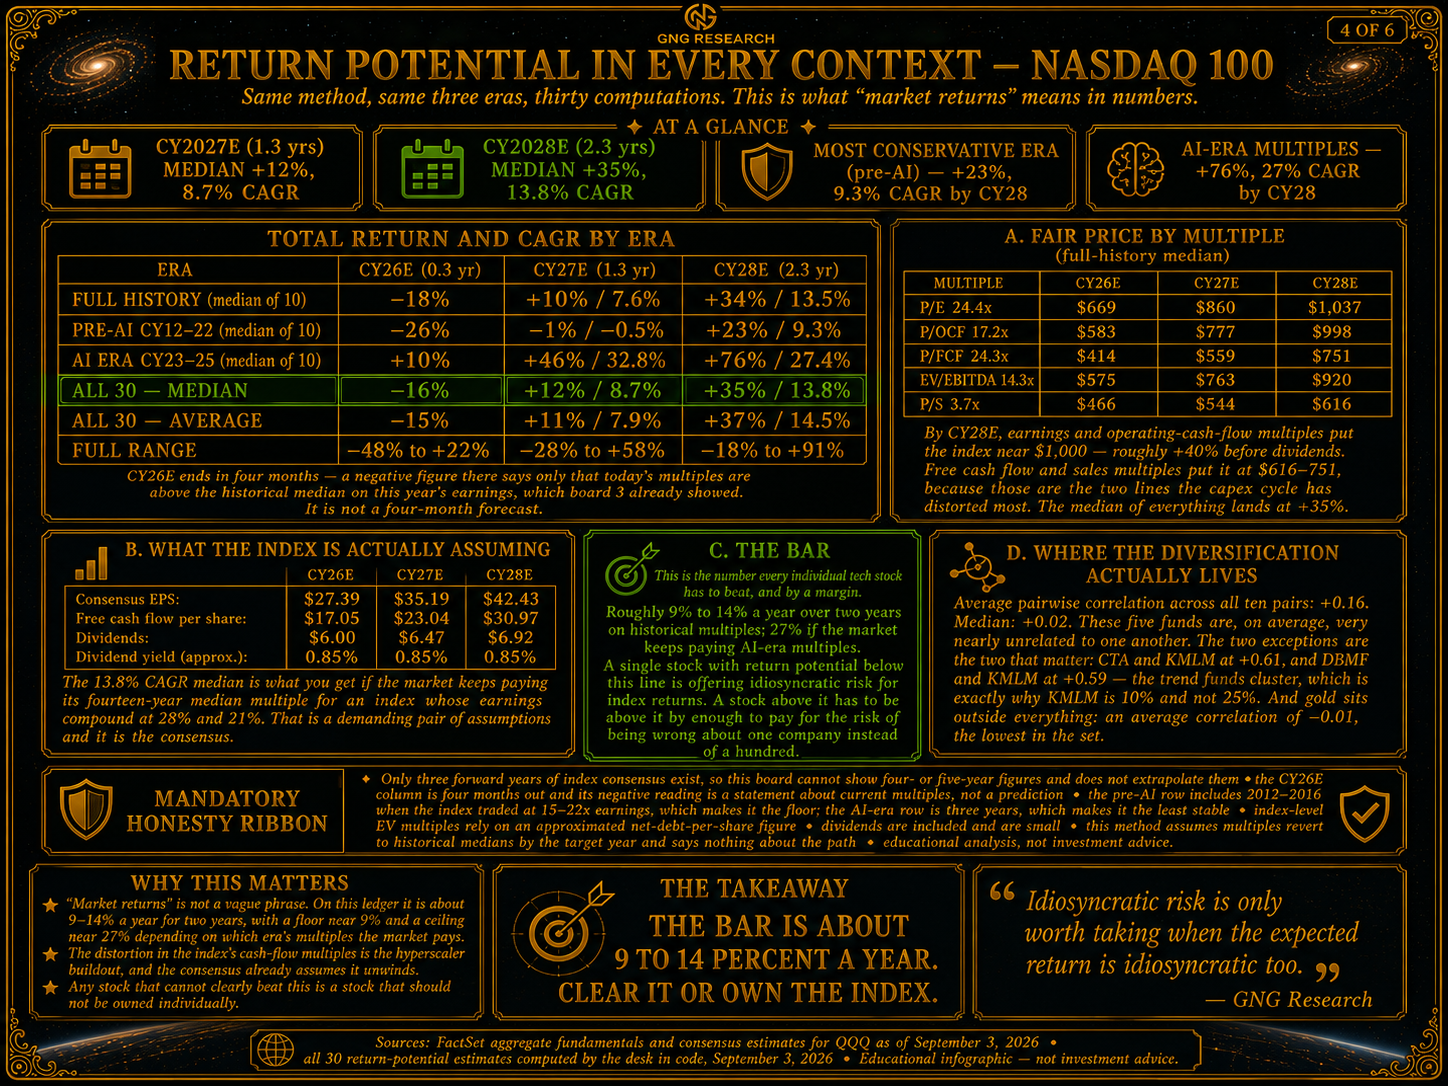
THE PART WHERE THE INDEX CAUGHT UP, AND WHY THAT'S GOOD NEWS 🤯
Six boards ago the arithmetic said Nvidia beats the Nasdaq 100 five to one. Three boards ago it said the two are priced identically on the one multiple the market has never changed. Both are true, and the second one is the finding.
Adjust for growth and the gap closes because the index's earnings ARE Nvidia's customers. The hyperscalers are buying $188 billion of capacity a quarter, Nvidia is booking half of it as revenue at a 66% operating margin, and the profit from that capacity is landing in the same hundred companies whose earnings the index measures. Of course the growth-adjusted returns converge. They're the same money, counted at two different points on its journey.
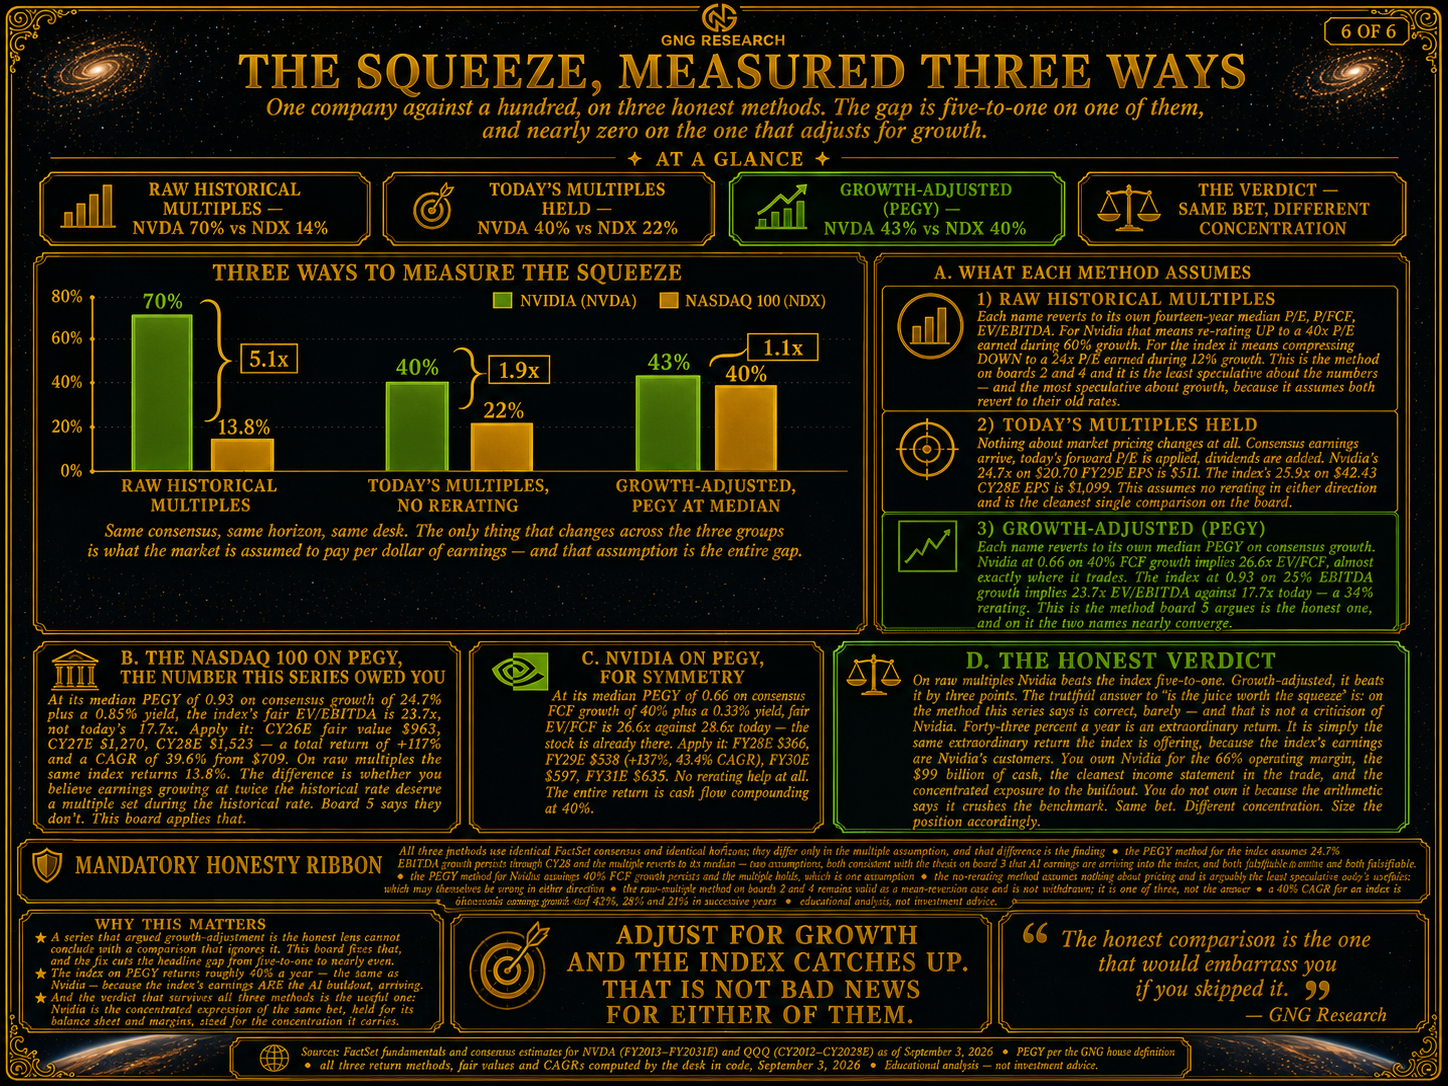
So the honest verdict is not "Nvidia crushes the benchmark." It's better than that. Nvidia is the concentrated expression of the exact bet the Nasdaq 100 is making — held for the margin structure, the $99 billion of cash, the cleanest income statement in the trade, and a fiscal 2028 guide that adds the GDP of Hungary in twelve months. You own it because you want the thing at full strength. You size it because full strength cuts both ways.
Here's what that means for ZEUS. The Nasdaq 100 is the hurdle for the entire growth bucket now — roughly 40% a year growth-adjusted, and a hundred names that have never lost money over any twenty-year window in their history. Any single growth stock that can't clear that bar by a margin is offering concentration for index returns. Nvidia clears it. Next week, in Part 2, every other growth holding gets measured against the same three methods, and we find out who else does 😉
Thirty-six years ago, Carl Sagan looked at a photograph of a pale blue dot and said Everyone you have ever loved lived out their life on it. This quarter, the largest company on that dot reported the cleanest quarter in the history of the AI trade, guided to a number no company has ever hit, and the market priced it exactly the way it has priced this company for fourteen years.
Wonder is what's left after you check the number and it holds.
Accept any number, no matter how big. Just check it first 🖖
Wonder, audited.
Coming Next Week In Part 2
This week has been packed full of more meetings than expected (1 or 2 unexpected meetings and a lot of business proposal reviews) so I wasn’t able to complete the planned chart review that includes:
Ramp Capital AI Spending Index Report (which covers AI enterprise adoption, and spending per employee, and what models) from over 70,000 companies based on actual spending (not surveys).
This is the GOLD STANDARD of first principles data about the AI boom and whether the AI revenue boom will continue
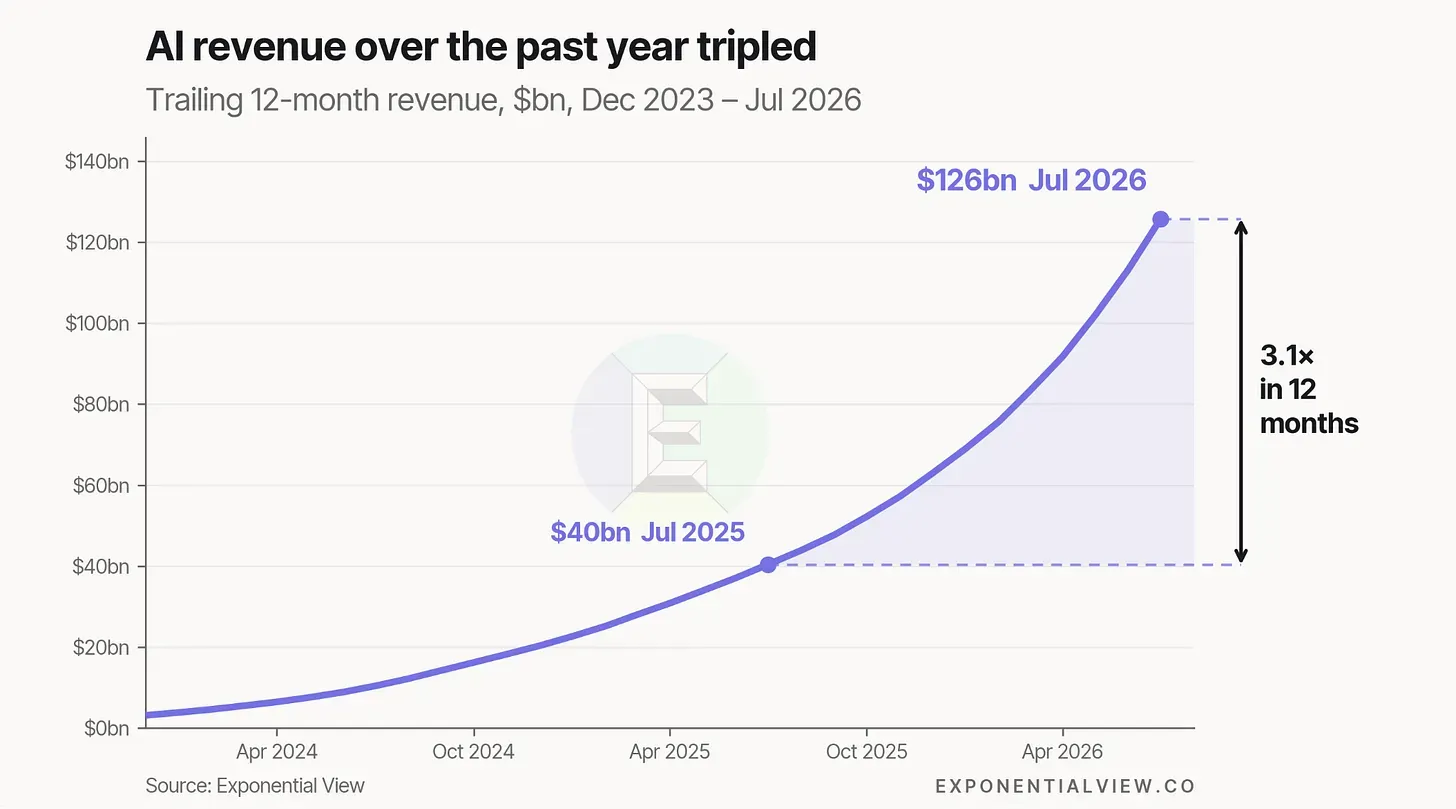
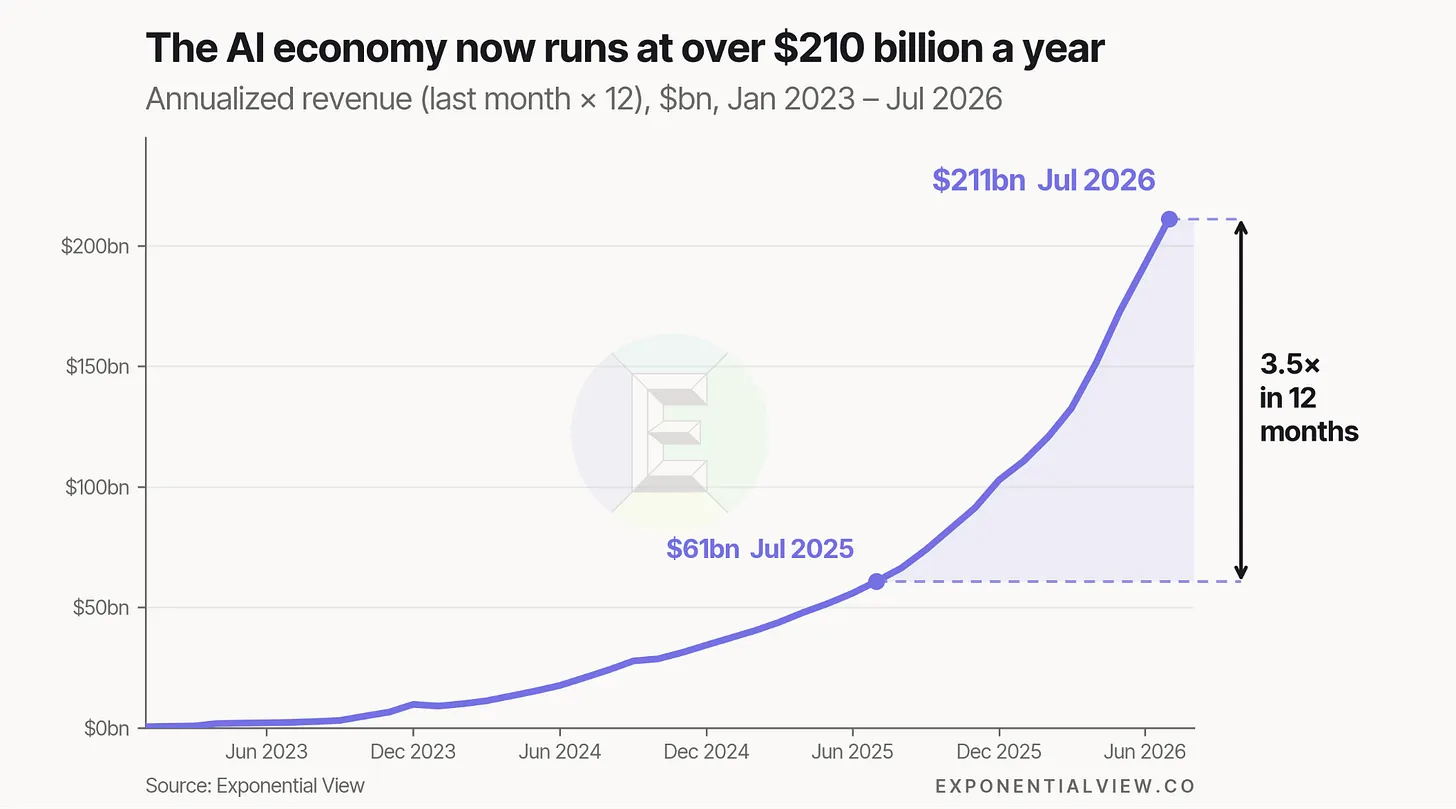
Exponential View AI charts (like these) show that the 279% CAGR growth rate in AI revenue since Jan 2023 has been holding steady (actually accelerating in recent months).
Economic, Earnings, and S&P and Nasdaq PEGY reviews.
Ramp Capital gives us the details (and trends) that tell us whether or not the ARR for AI will continue to grow at the current rate…which, by the way, puts us on track to achieve $738 billion in ARR within 12 months (surpassing JPMorgan’s 2030 $650 billion ARR that justifies the current spending boom), Bain’s $2 trillion estimate will be surpassed in 2028 ($2.6 trillion) within 2 years. And by 2030? We’re actually on track for the $25 trillion in POTENTIAL MAXIMUM AI revenue that the estimated amount of compute that will exist in 2030 could generate.
That $25 trillion estimate went up from $5 trillion when Exponential View’s AI report for 2026 came out and we were able to update the model.
AND even though the $5 trillion revenue POTENTIAL in 2030 seemed crazy…and the $25 trillion MAX revenue POTENTIAL in 2030 seemed crazier still…guess where we are currently on track for?
$31.6 trillion in mid 2030…vs a $16 trillion to $74 trillion range ($25 trillion most likely max potential).
So what does this mean? I am ending Part 1 of this update with a reminder about the power of Sagan’s law of the AI boom
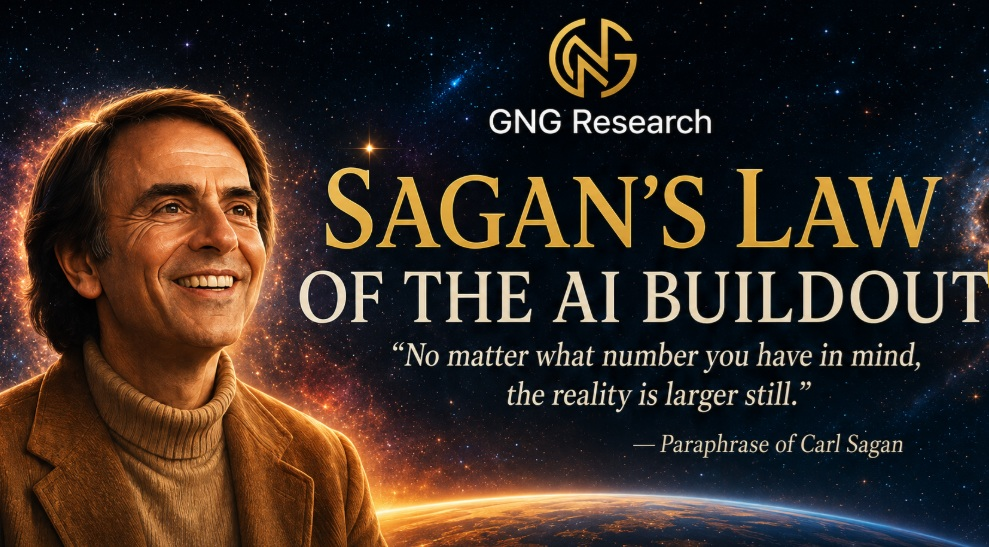
In the age of AI, real numbers seem crazy, and many crazy numbers seem real. AND our job here at GNG is to help you look past the hype, and scary headlines, and to find the wonder, and awe in the truth…but of course, always…wonder, audited😉😂🤔🤣🥳
Sign in to leave a comment and join the discussion.
Sign Up Free