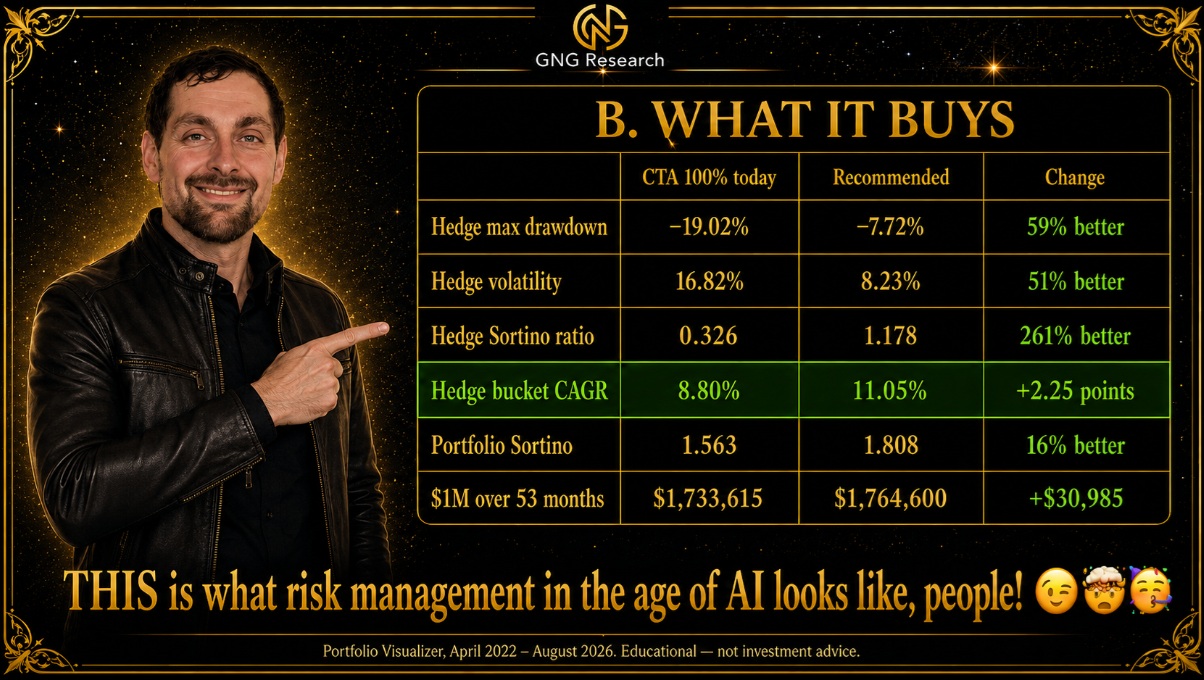

Eight months ago, I sat down on a rare day with no meetings and wrote twelve facts about a single ETF.
The fund was Simplify Managed Futures. Ticker CTA. It was — and still is — the single biggest holding in the ZEUS family fund, which is to say it is the biggest holding in the thing that supports my family. And a lot of you own it. Probably because I do.
That's not a throwaway line. That's the whole reason this report exists.
I ended that December piece by telling you the strategy wasn't broken; it was cyclical. Great 2022, flat 2023, great 2024, bad 2025. Don't just do something; sit there. 😉
And then March happened, and I looked like a genius. The market fell 10%, and ZEUS went UP 8%, because CTA was 44% of the fund and absolutely raging as oil climbed. On April 29th, Brent touched $126 intraday. That is the single best month this system has ever had, and it happened for exactly the reason I told you it would.
Then came May. And June.
CTA fell 19% in two months, while the S&P 500 printed twenty-five all-time highs. 😳
So here I am again. Not because a fund had a bad quarter — funds have bad quarters, and I'd have told you to sit there. I'm here because I told you to own this, and I need to know whether what I told you is still true.
Carl Sagan liked to say we are a way for the cosmos to know itself. That the calcium in our bones and the iron in our blood were forged in stars that died before the Sun was born, and that the universe built creatures capable of working that out.
I love that line. But there's a discipline hiding inside the wonder, and it's the harder half: the universe does not care what we expect. It only reports what is.
Sagan's real gift was never the awe. Anyone can do awe. His gift was insisting the awe had to survive contact with the evidence — that a universe you love is still a universe you have to check.
So let's check.
Somewhere in a server rack, a piece of software wakes up every morning and looks at the price of Brent crude oil. It does not know there is a war. It does not know that a man in Tehran issued six conditions, or that a tanker took a missile in the Strait of Hormuz on the eighth of August. It does not know what a strait IS.
It knows one thing. The line has been going up.
So it buys more.
And the honest answer to the question in the title is:
No. CTA is not broken. CTA is working perfectly — on a job you no longer need done.
That distinction is the whole report.
The Answer, Before Anything Else (The TLDR)
I'm not making you read fourteen sections to find out where this lands. Here it is.
CTA 30% · DBMF 25% · IALT 25% · KMLM 10% · IAUM 10%
At a 35% hedging bucket (ZEUS Optimal Heding Allocation)
And when you get there: all at once, not in stages. ⚡
Five positions. That's the whole target.
Part 1: What Actually Happened
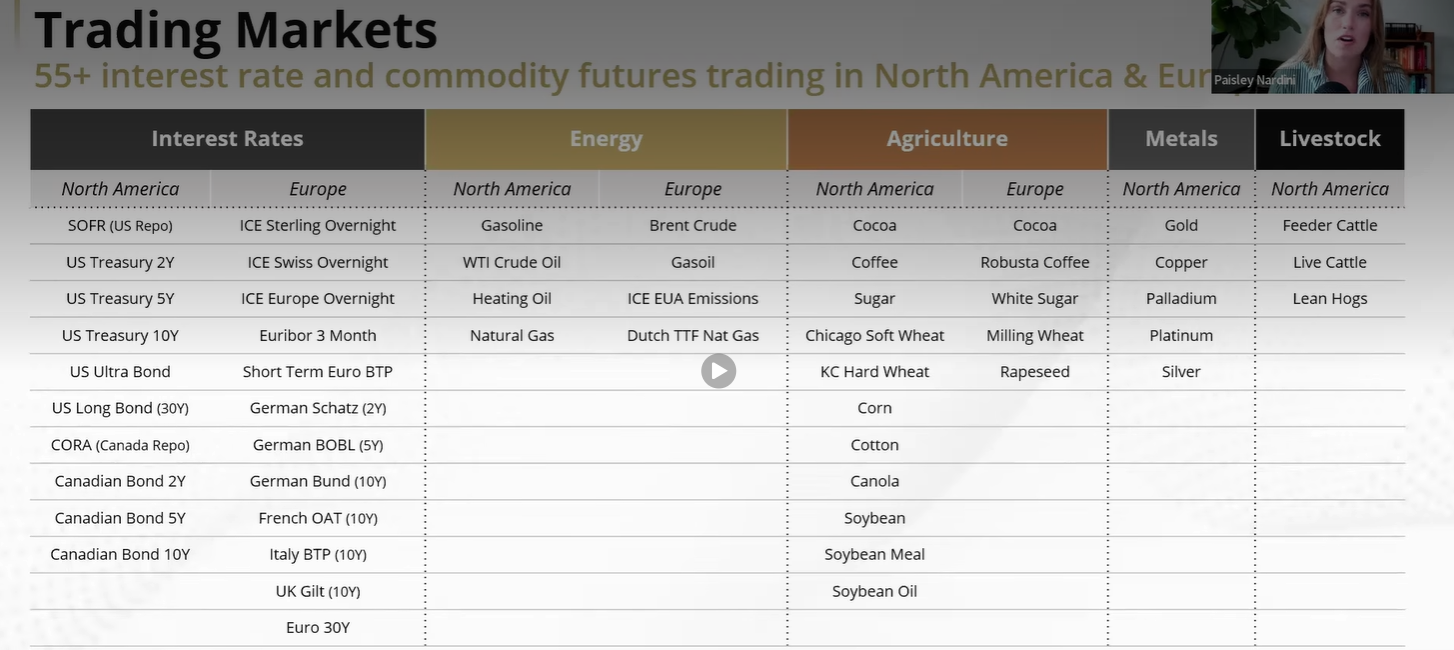
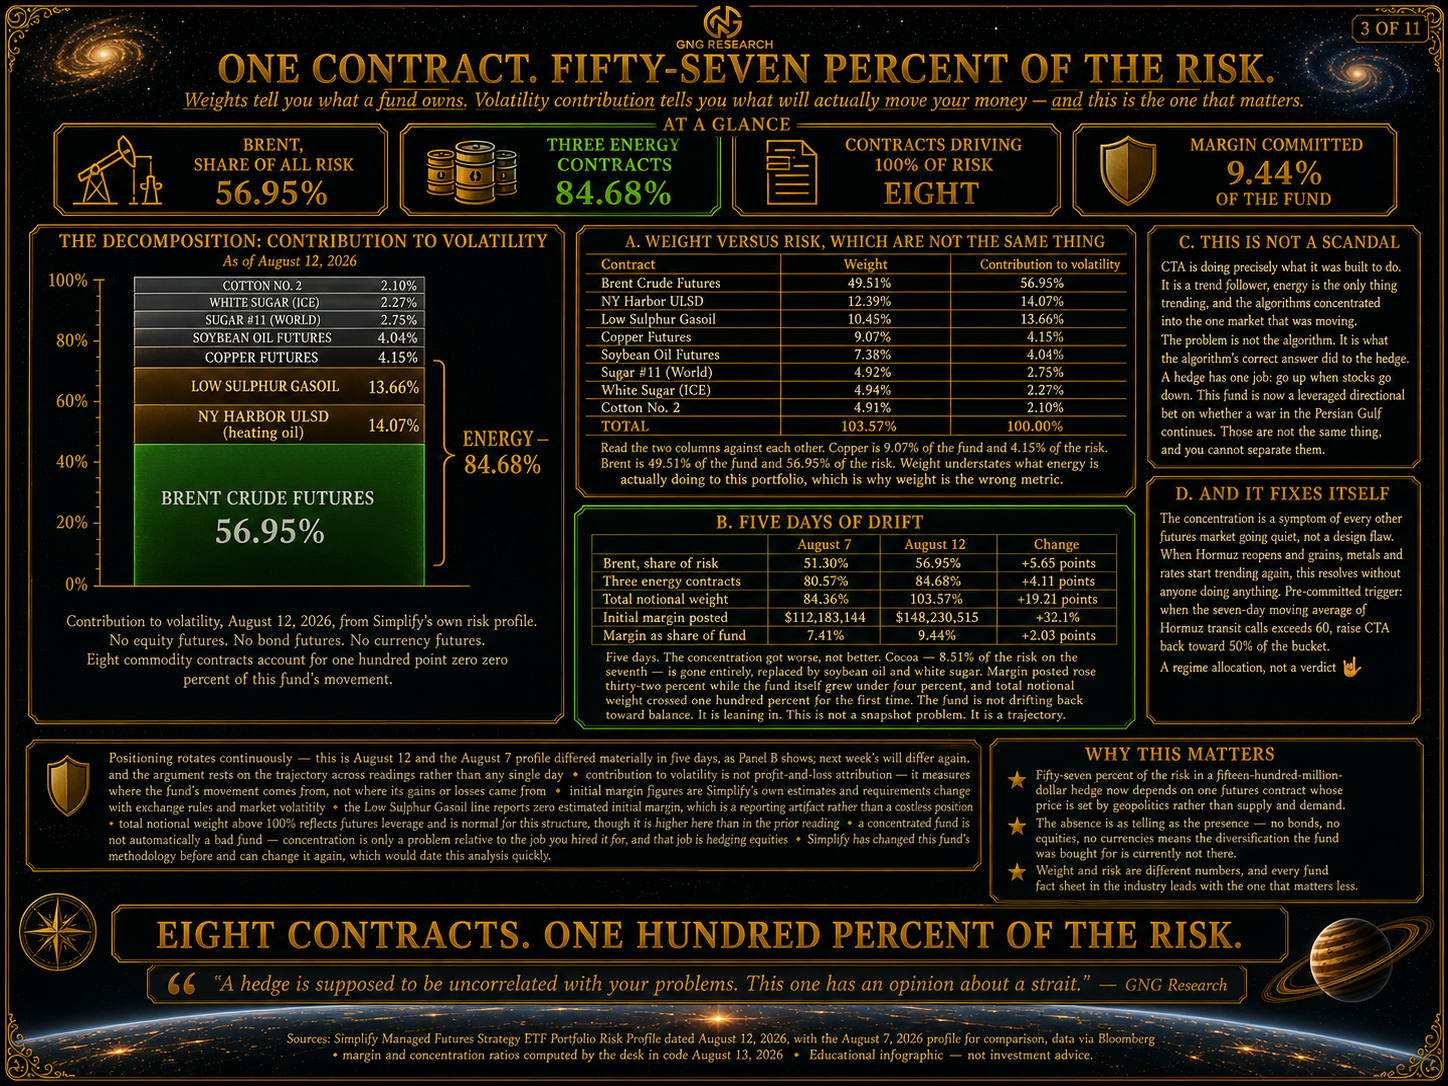
Here is Simplify's own risk profile for CTA as of August 12th. Not my model. Not my estimate. Their document, sourced from Simplify Itself🤯
Brent crude is 56.95% of the fund's entire volatility budget.
One contract. Fifty-seven percent of the risk in a $1.57 billion fund.
Add heating oil at 14.07% and gasoil at 13.66% and you get 84.68% of all risk in three energy contracts.
And then look at what ISN'T there. No equity index futures. No bond futures. No currency futures. Eight commodity contracts account for 100.00% of the fund's volatility. That's not a rounding artifact. That's the entire list.
Now here's the part that actually decided this report, and I want you to sit with it. 😱
I pulled the same document five days earlier, on August 7th. In five days, this got WORSE:
August 7 | August 12 | |
|---|---|---|
Brent, share of risk | 51.30% | 56.95% |
Three energy contracts | 80.57% | 84.68% |
Total notional weight | 84.36% | 103.57% |
Margin posted | $112.2M | $148.2M |
Margin posted rose THIRTY-TWO PERCENT while the fund itself grew by four percent. Cocoa — 8.51% of the risk on the seventh — is gone entirely, replaced by soybean oil and white sugar. And the total notional weight crossed 100% for the first time.
The fund is not drifting back toward balance. It is leaning in. 🤯
That is not a snapshot problem. That is a trajectory.
Is this a scandal? NO. And this is where most people get it wrong.
CTA is doing precisely what it was built to do. It's a trend follower. Energy has been the only thing trending. Grains went quiet. Metals went quiet. Rates went quiet. So the algorithms did the mathematically correct thing and concentrated on the one market that was moving.
The problem isn't the algorithm. The problem is what the algorithm's correct answer DID to my hedge. 🥺
Because a hedge has exactly one job — go up when your stocks go down. And starting in May, CTA stopped being a diversified futures fund and became a leveraged directional bet on whether a war in the Persian Gulf continues.
Those are not the same thing. And you cannot separate them.
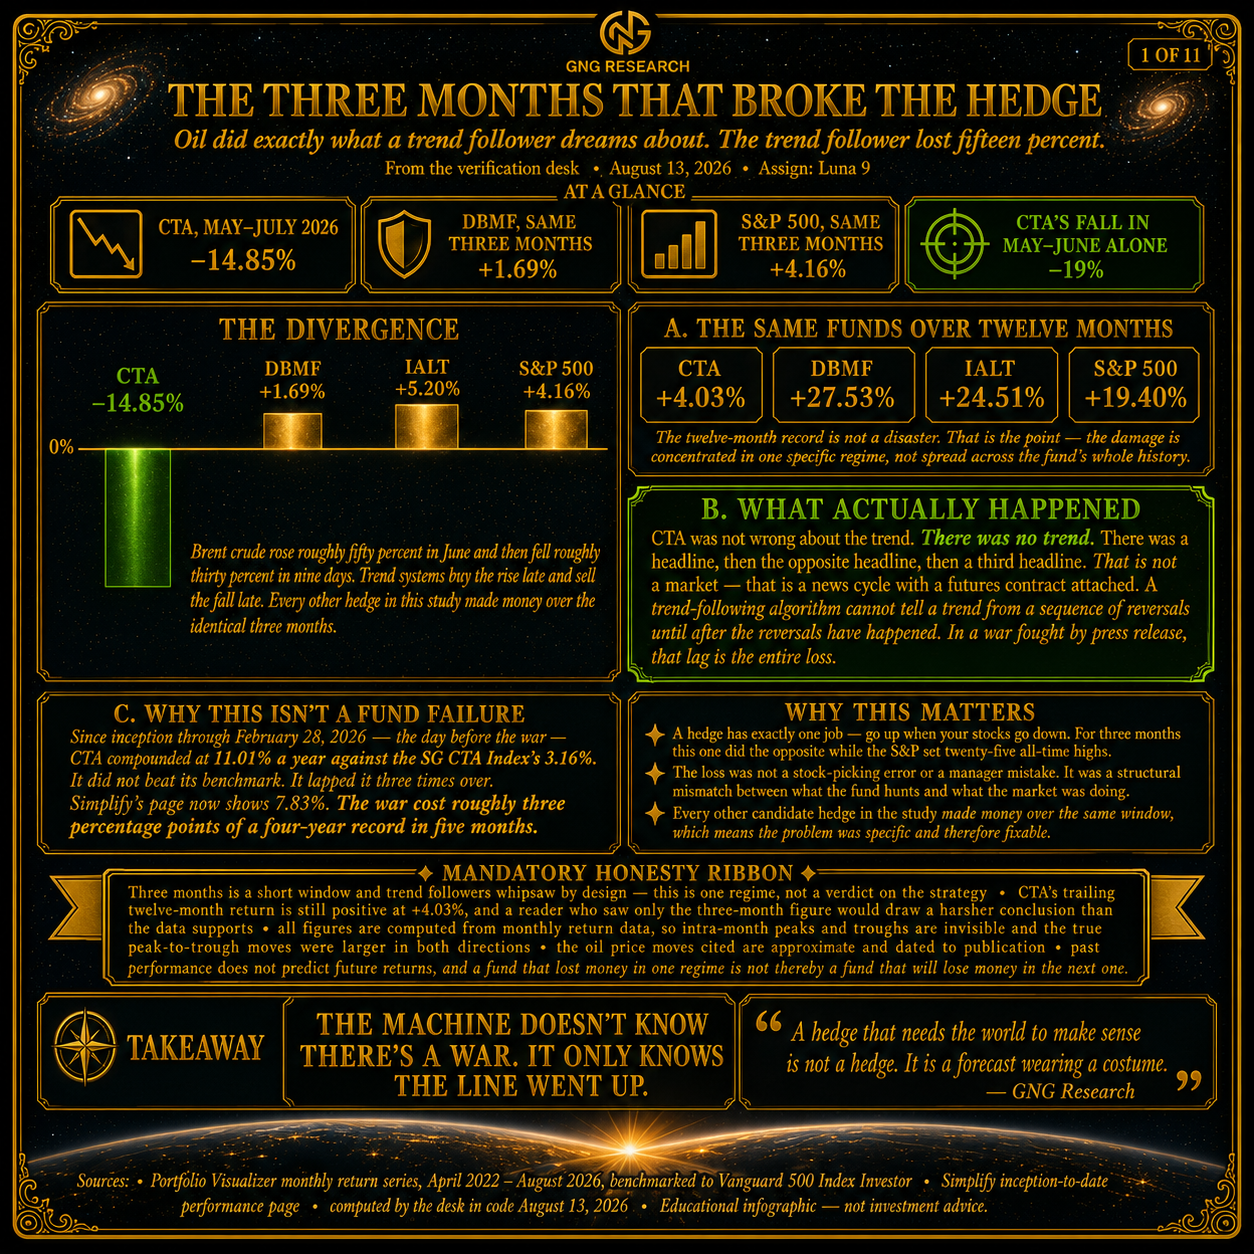
What did that cost? Brent rose roughly 50% in June, then fell roughly 30% in nine days. Trend systems buy the rise late and sell the fall late. Over May through July, CTA returned −14.85%.
DBMF over the identical three months: +1.69%. The S&P: +4.16%. Every other hedge in this study made money.
CTA wasn't wrong about the trend. There was no trend. There was a headline, then the opposite headline, then a third headline. That's not a market. That's a news cycle with a futures contract attached.
Part 2: The Steelman, Because I Owe This Fund One
Now let me argue the other side as hard as I can. I've owned this fund since inception. I'm not trashing it after one bad quarter. 😉
CTA still has the best downside capture of ANYTHING we tested that a sane person would own. −88.6%. That means historically, for every 1% the market fell, CTA rose about 0.89%.
In the worst 20% of equity months — the ones that actually hurt — CTA averaged +4.55%. In the 2022 bear market, it returned +15.03% while the S&P fell 14.26%.
It would have been up even more, except it launched in March of 2022.
And since inception through February 28th, 2026 — the day before the war — CTA has compounded at 11.01% per year, compared with the SG CTA Index's 3.16%. It didn't beat its benchmark. It lapped it three times over.
Simplify's page now shows 7.83%. The war cost roughly three percentage points of a four-year record in five months.
So no. CTA does not get sold. It stays the largest single sleeve in the hedging bucket.
But 100% of a hedge in one fund with 57% of its risk in one contract is not a conviction problem. It's a position-size problem. And position-size problems don't care what the price did last month. 🤗
Part 3: The Duration Rule — The Most Useful Thing In This Report
Everything so far is about the past. This next part is the key that unlocks the future, and it's the most durable thing I'm going to give you today.
Everyone asks the wrong question. They ask, "Does trend following hedge?"
The right question is: "How long does the crisis last?" 🤔
Kaminski and Zhao at AlphaSimplex ran the SG Trend Index through every major S&P drawdown of the modern era. Sort by duration, and the whole thing snaps into focus.
Every crisis lasting 200 trading days or more produced a positive trend return — averaging +43.3%. Every crisis shorter than that produced a negative one — averaging −3.6%.
Two hundred trading days is roughly nine and a half calendar months.
Now look at COVID. Third-deepest drawdown in the sample. The S&P fell 33.79%. Trend following LOST money — because the whole thing was over in twenty-three trading days.
And look at the Tech Bubble. Deeper, yes — but far more importantly, it ground on for 545 trading days. More than two years. Trend made +62%.
Correlation between crisis DURATION and trend return: +0.93. Between crisis DEPTH and trend return: only +0.66.
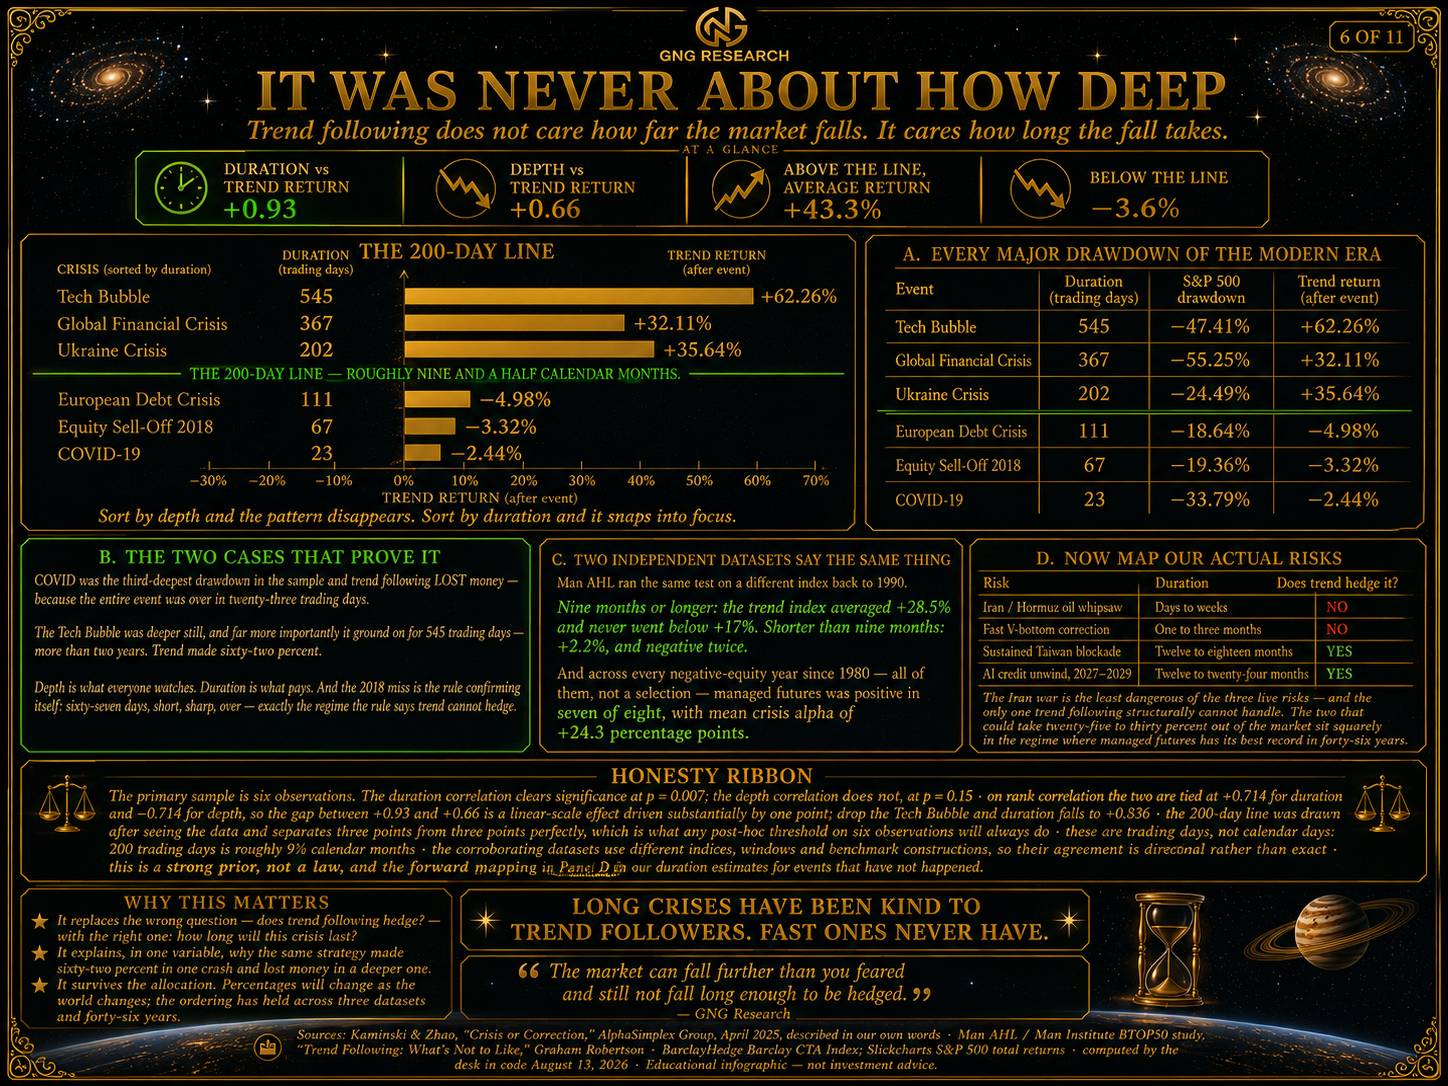
Man AHL ran the same test on a different index back to 1990 and got the same answer. Nine months or longer: the trend index averaged +28.5% and never went below +17%. Shorter than nine months: +2.2%, and negative twice.
And the Barclay CTA Index, back to 1980, across every negative-equity year — not a selection, all of them — was positive in seven of eight, with a mean crisis alpha of +24.3 percentage points.
The one miss? 2018. The Q4 selloff lasted 67 days. Short, sharp, over. Exactly, the regime, the rule says, can't hedge.
Now map our actual risks onto it, and watch the report reorganize itself:
Risk | Duration | Does trend hedge it? |
|---|---|---|
Iran / Hormuz oil whipsaw | Days to weeks | NO ❌ |
Fast V-bottom correction | 1–3 months | NO ❌ |
Sustained Taiwan blockade | 12–18 months | YES ✅ |
AI credit unwind 2027–29 | 12–24 months | YES ✅ |
Read that table twice.
The Iran war is the LEAST dangerous of the three risks in these pages — and the only one trend following cannot hedge. A Taiwan blockade and an AI credit unwind are both long-duration events, sitting squarely in the regime where managed futures has its best record in 46 years of data.
Which means the answer to "how much CTA should I own" moves in opposite directions depending on which war you're worried about. 🤯
And THAT is why the bucket cannot be one fund.
Three honest caveats, because wonder gets audited around here. The AlphaSimplex sample has six observations. The 200-day line was drawn after seeing the data. And on rank correlation, duration and depth are tied. What survives all three is the ordering — long crises have been kind to trend followers, and fast ones have not — and that ordering shows up independently in two other datasets, in different indices, in different decades. Strong prior. Not a law. 😉
Part 4: What DBMF Actually Owns — And Why It Will Surprise You
Here's something almost nobody who owns DBMF has ever seen: its actual positions.
DBMF doesn't hunt trends. It reverse-engineers what the twenty largest managed-futures hedge funds do and copies their strategies at a fraction of the fee. That sounds like a compromise. It turned out to be the feature.
But look at what it's actually holding as of August 13th. 😱
DBMF is +42% NET LONG EQUITIES. S&P 500 at +17%. MSCI EAFE at +17%. Emerging markets at +8%.
Against a −150% short position across the US rates curve — two-year notes at −93%, ten-years at −43%, long bond at −14%. Plus short euro at −47% and short yen at −40%.
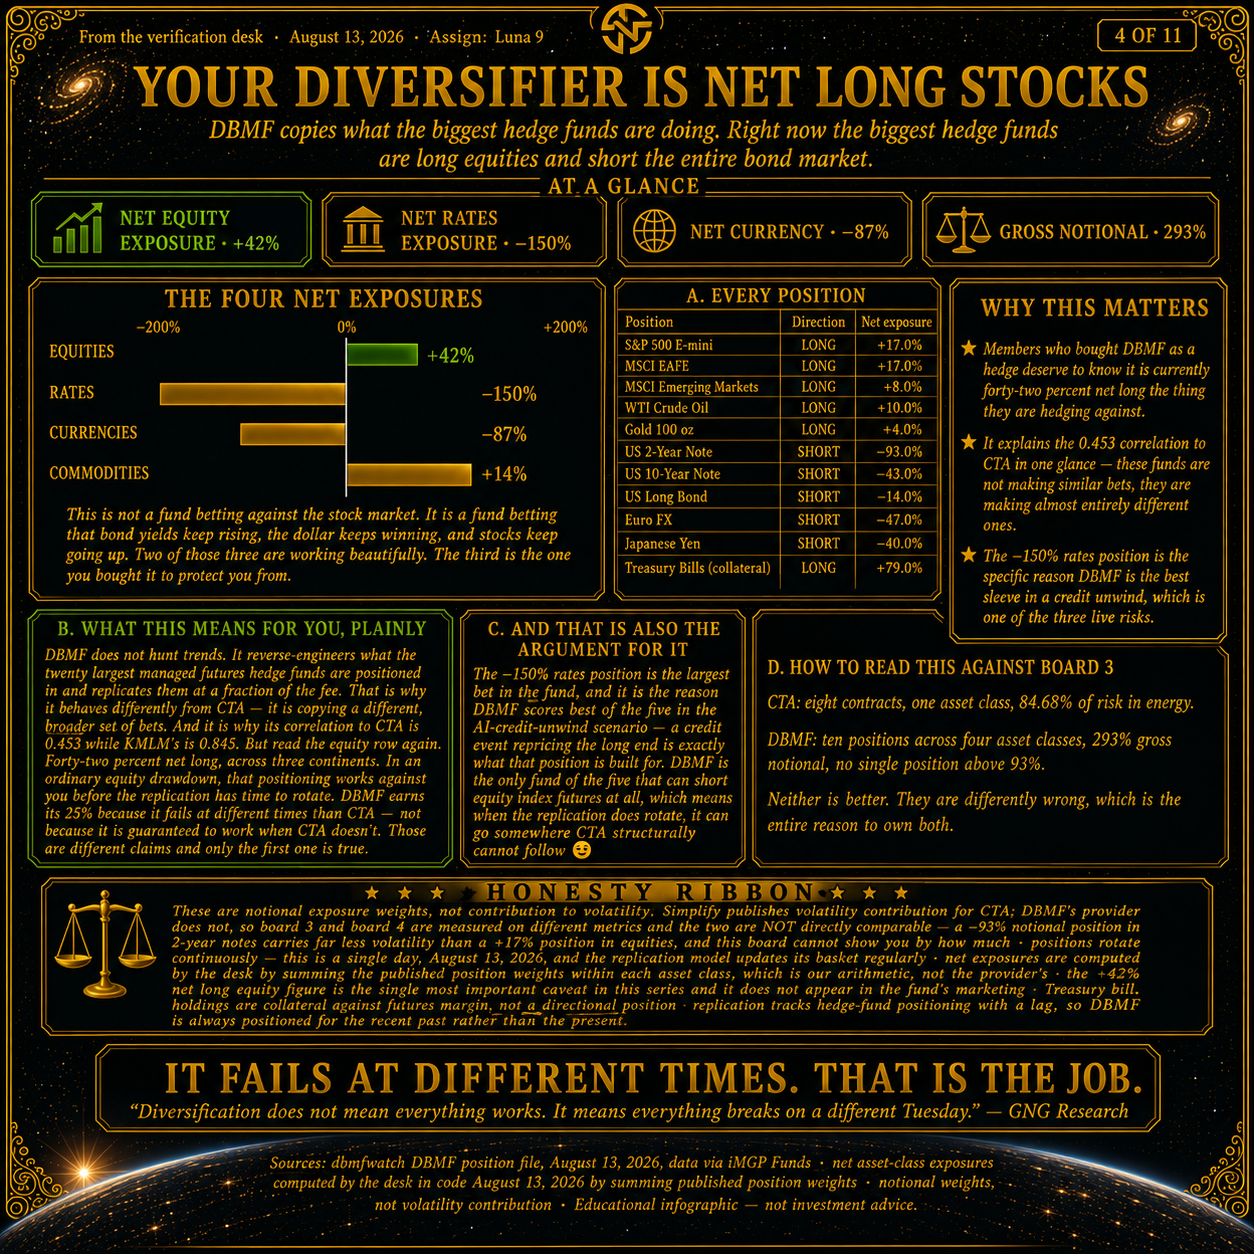
Read that again. A fund that gets a quarter of the hedging bucket is currently net long the thing it's supposed to hedge against. 🤯
But that’s its job. Stocks are trending up AND in the age of AI, with 19% CAGR FCF/share growth that is an asset (most of the time)
Now — is that a reason to skip it? No. But you need to understand exactly what you're buying.
DBMF earns its 25% because its correlation to CTA is 0.453. That is the entire case. It is the only genuine diversifier in the complex and the only fund of the five that can short equity index futures.
But "it fails at different times than CTA" and "it will work when CTA doesn't" are different claims, and only the first one is true. In an ordinary equity drawdown, that +42% works against you until the replication rotates.
In a fast correction, DBMF is going to underperform due to that equity exposure…BUT if it’s a growth scare, the -150% short on rates = BIG offset.
That −150% rate position is also the single biggest bet in the fund, and it's exactly why DBMF scores best of the five in an AI credit unwind — a credit event repricing the long end is what that position is built for.
Keep in mind that this scenario will NOT happen anytime soon, so this is a hypothetical example of how these different funds protect against 3 different bear-market scenarios.
So, DBMF holds 25%. And now you know what's under the hood. 🙏
Part 5: What KMLM Actually Owns — This Is What CTA Is Supposed To Look Like
Now the contrast that makes the whole thing legible.
KMLM holds 22 contracts across five asset classes. Eight long, fourteen short. Six currencies — long Aussie and sterling, short Canadian dollar, euro, yen and franc. Five bond markets on four continents, all short, roughly −26% each. Eleven commodities, long and short.
Zero equity exposure. By design.
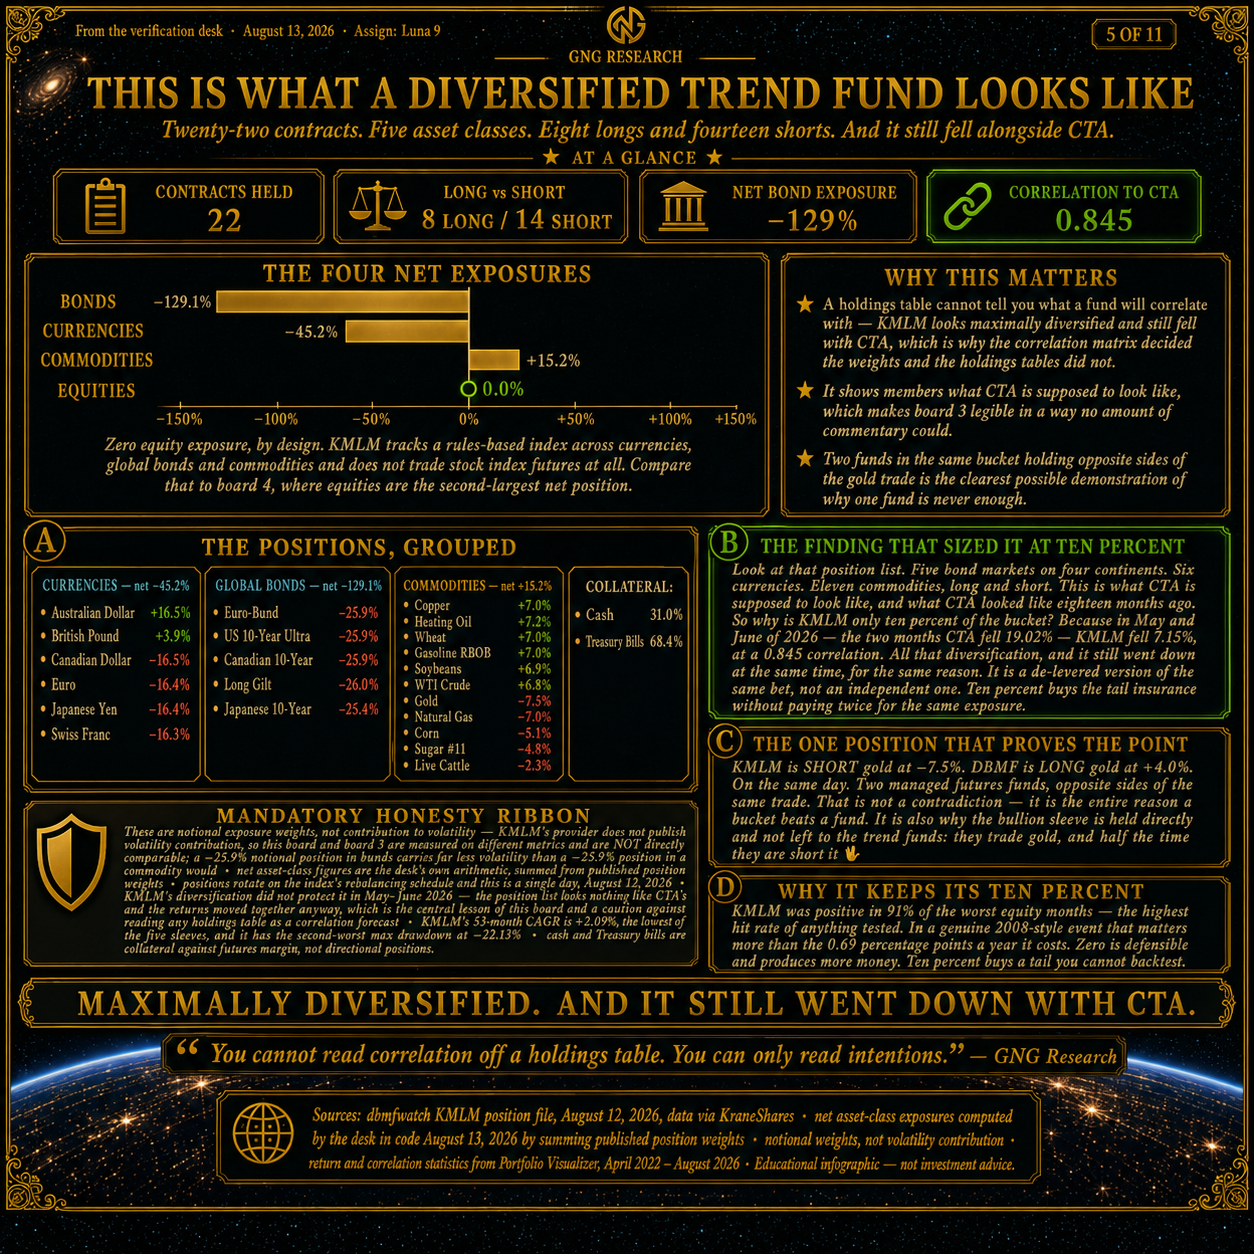
Look at that list and then flip back to board three. That is what CTA is supposed to look like. That is what CTA DID look like eighteen months ago.
So why is KMLM only 10% of the bucket?
Because in May and June — the two months CTA fell 19.02% — KMLM fell 7.15%. At a 0.845 correlation. 😳
All that diversification, and it still went down at the same time, for the same reason. It is a de-levered version of the same bet, not an independent one. Ten percent buys the tail insurance without paying twice for the same exposure.
And here's my favorite thing in this entire report. 😂
KMLM is SHORT gold at −7.5%. DBMF is LONG gold at +4.0%. On the same day.
Two managed futures funds. Opposite sides of the same trade.
That is not a contradiction. That is the entire reason a bucket beats a fund. 🖖
It's also why the bullion sleeve gets held directly instead of trusting the trend funds to own gold for you. They trade gold. Half the time they're short it.
Part 6: IALT, And The Gold That Isn't A Hedge
IALT is the return engine. ⚙️ Best risk-adjusted profile in the entire study: 15.56% CAGR at 5.41% volatility with a −1.96% maximum drawdown and near-zero beta.
And here is the disclosure that matters, in the body where you'll actually read it. 📌
IALT has eight months of live history. Every 53-month figure I just quoted blends that live data with a BDMIX-based proxy for the earlier period. The live record is genuinely extraordinary — beta of −0.007, max drawdown of −0.22%, positive in seven of eight months — and it has never seen a crisis.
IALT is BDMIX plus BlackRock’s proprietary managed-futures algos (which can’t be isolated with just 8 months of data).
Its assets grew from $130 million to $5.42 billion in four months. That's a textbook crowding signal.
That's why it's capped at 25% and not higher, and it is the single biggest judgment call in this report. If IALT ever posts a monthly loss worse than −3% — fifteen times its lifetime drawdown — cut it in half and move the money to DBMF. Write that trigger down.
IAUM is the debasement hedge. 🥇 Gold hedges the one risk nothing else in this bucket touches.
I think of it more as a direct hedge against inflationary concerns (such as those arising from AI capex growing to its maximum potential, up to 10% of GDP by 2030), as Nvidia is projecting.
And let me be blunt about what gold is NOT. Its downside capture is +7.1% — positive. It falls WITH the market on average. It lost 5.94% in the 2022 bear. Its −23.75% max drawdown is the worst of the five sleeves.
Gold is a diversifier, not a hedge. It wins when the others lose and loses when they win, and the bucket's own maximum drawdown is minimized at exactly 10% gold, getting worse above it. That's the whole justification. Not the 2025 move. 🙏
Glenn said 3–5% of the portfolio. The bucket math said 10% of the bucket. Those are the same number — 10% of a 35% bucket is 3.5% of the portfolio. Two routes, one answer, arrived at independently. Best kind of agreement. 😄
In a base-case (50% hedge bucket with S&P at fair value and GDP growing at 2%), 10% gold = 10% X 50% hedging bucket = 5% of portfolio.
The gold sleeve is bullion. Full stop. Not miners, not royalties, not streamers. Every step away from the metal is a step toward equity beta, and I'll show you that arithmetic in Part 8.
And which gold ETF? IAUM. Not GLD. 🥇
Most of you own GLD, because it's the biggest, the oldest, and the one that comes up first. GLD charges 0.40%. IAUM charges 0.09%.
Thirty-one basis points. For the identical asset. Same metal, same vaults, correlation 0.9998. You are paying four and a half times the fee for a fund that does exactly the same thing. 😱
On a $100,000 gold position that's $310 a year. Every year. Forever. For nothing.
In an IRA or any tax-advantaged account: switch. There is no argument against it. Two clicks, and it pays you $310 a year to make them.
In a taxable account with a big embedded gain, run the math first — 31 basis points a year against a one-time capital gains bill. A large long-term gain can take a few years to earn that back, and that's a real calculation, not a formality. But if you're near flat, or you're buying fresh? IAUM. Don't look back. 😉
Part 7: The Number That Runs This Report — And The Trap Inside It
Downside capture is the most important statistic here, so let me define it in plain English.
When the market falls, what fraction of that fall does this thing capture? An index fund is +100% — it eats the whole thing. Cash is 0%. A negative number means the asset went UP while the market went DOWN.
Now here's the trap, and it's the most important lesson in this entire report. 🚨
SQQQ has the best downside capture of anything we tested. −789.0%. Nine times better than CTA.
And it lost 47.96% a year with a −97.02% drawdown. 😱
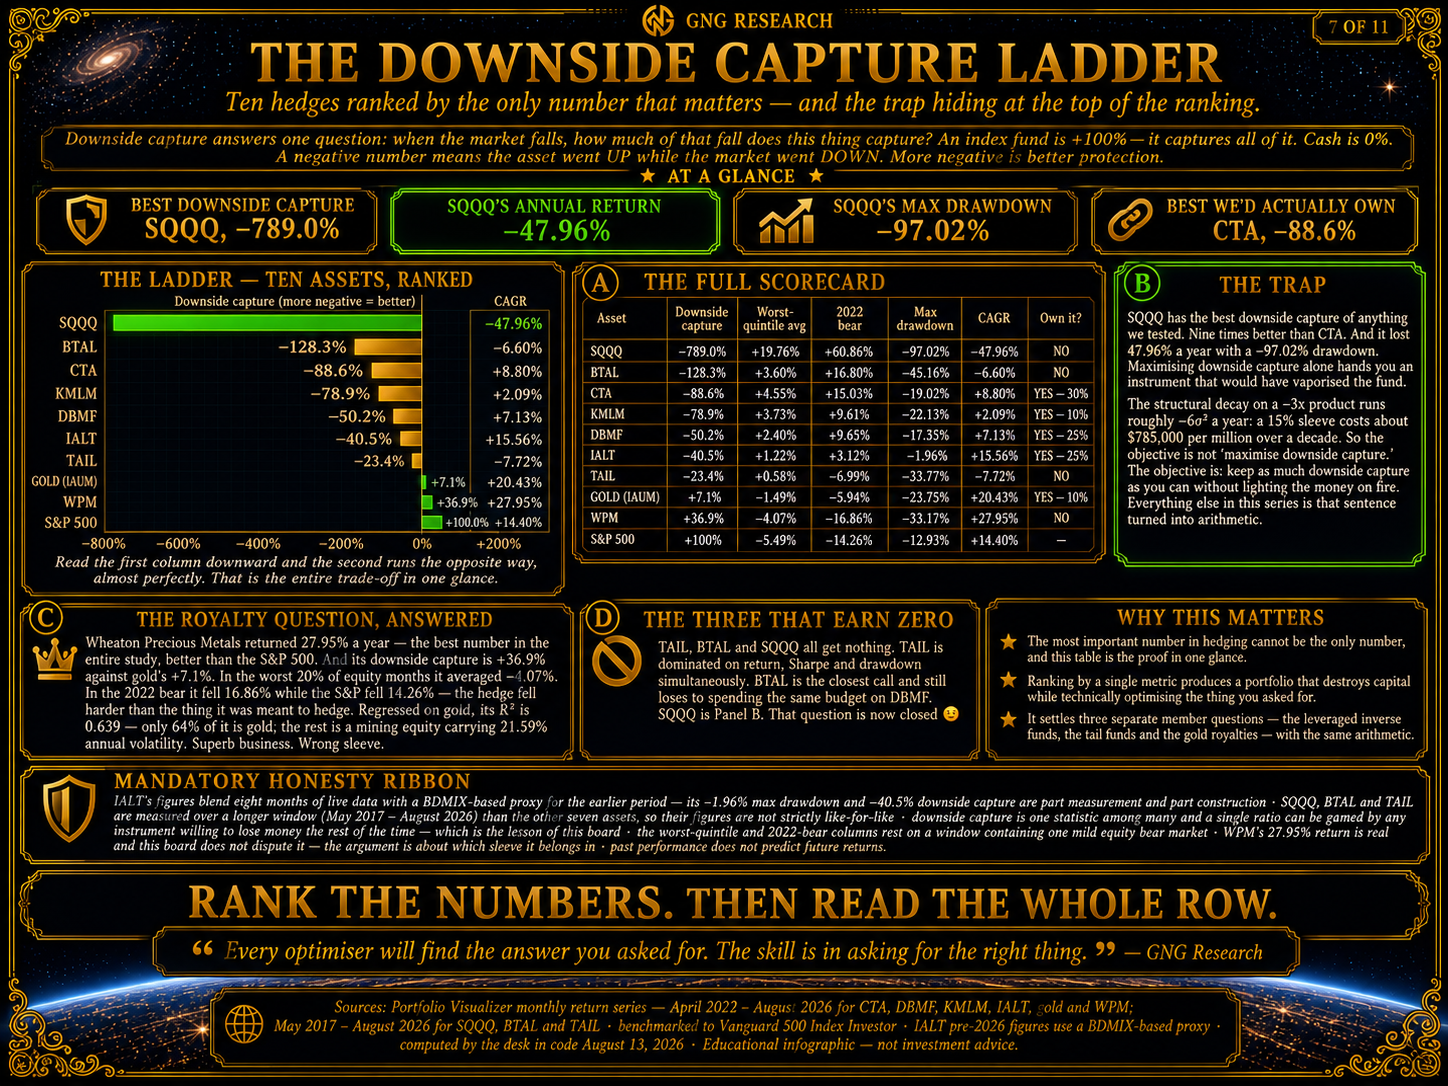
Maximizing downside capture alone hands you an instrument that would have vaporized the fund. The structural decay on a −3x product runs about −6σ² a year — a 15% sleeve costs roughly $785,000 per million over a decade.
So the objective isn't "maximize downside capture." The objective is:
Keep as much downside capture as you can without lighting the money on fire. 🧮
TAIL and BTAL get zero for the same family of reasons. TAIL is dominated on return, Sharpe AND drawdown simultaneously. BTAL is the closest call in the group and still loses to spending the same budget on DBMF.
Zero for all three. That question is now closed.
Part 8: Paul's Royalty Question, Answered Properly
GNG member Paul asked about the gold royalty and streaming companies — WPM, RGLD, FNV. Great question, and the half he was right about is the impressive half. 🥇
We tested Wheaton Precious Metals over the identical 53 months.
It returned 27.95% a year. The best number in the entire study. Better than the S&P 500. Paul's read on the returns was dead on.
Now the other half.
WPM's downside capture is +36.9%. Gold's is +7.1%. More than five times worse. In the worst 20% of equity months, the average was −4.07%. In 2022, the bear fell 16.86% while the S&P fell 14.26%.
The hedge fell harder than the thing it was supposed to hedge. ❌
I had a hunch about why before we ran a number, and the number made the hunch precise: regressed on gold, WPM has an R² of 0.639. Only 64% of WPM is gold. The other 36% is a mining equity — 21.59% a year of volatility from mine performance, counterparty risk, contract terms and multiple compression.
Swap it in for IAUM, and you make $28,175 more per $1M — and you get worse on all three crisis measures simultaneously.
Verdict: no. Not in the hedging bucket.
And not in the ZEUS equity sleeve either, before anyone asks. That sleeve is deep-value growth compounders — NVDA, MSFT, AMZN, GOOGL, ORCL, MELI, WTRG — and I'm not swapping a business I can model for a metals stream I can't. A fine company is not automatically a portfolio position. 😉
THIS is why I’m So Excited About Hyperscalers & Nvidia
Hyperscalers + Chips Capture 55% of All AI Profits
I am interested in Anthropic’s upcoming October IPO (1% starter position working up to 10% over 6 quarters as they prove their moat) BUT for now “applications = where the profit is” = False
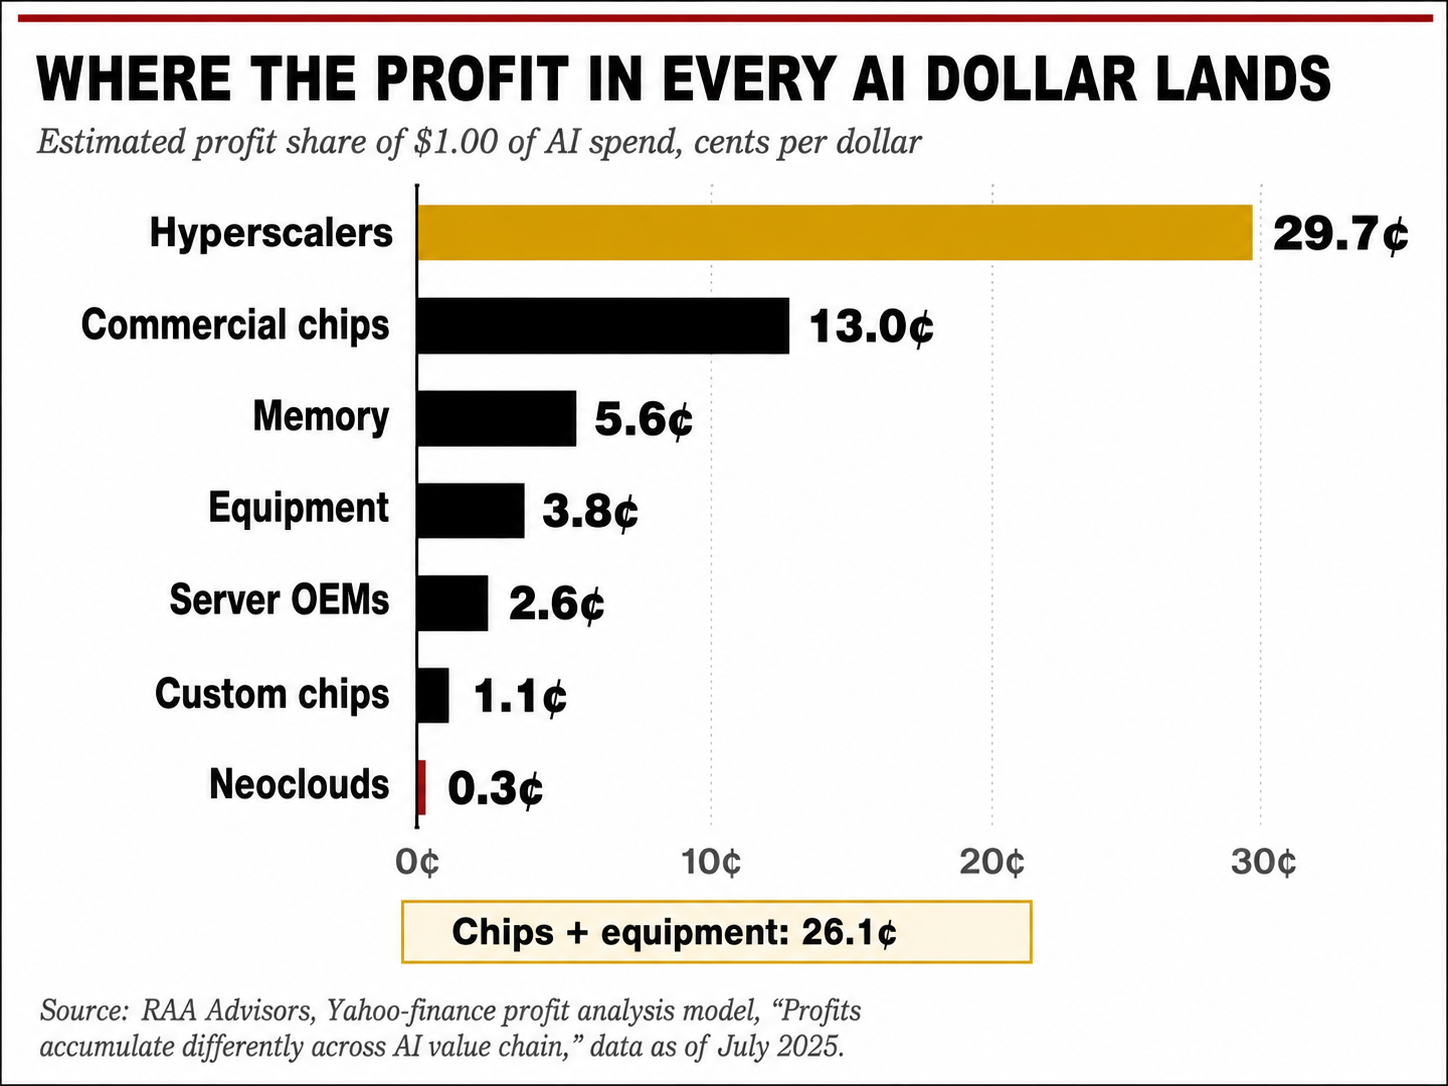
55% of profits in AI are going to hyperscalers (pipelines of AI) and Chips + Equipment (like Nvidia)
ASICS? 1.1% Neoclouds (like SpaceX?) 0.3%.
The money is in picks and shovels, and those companies are it.
Don't get too cute😉
Part 9: Where The Diversification Actually Lives
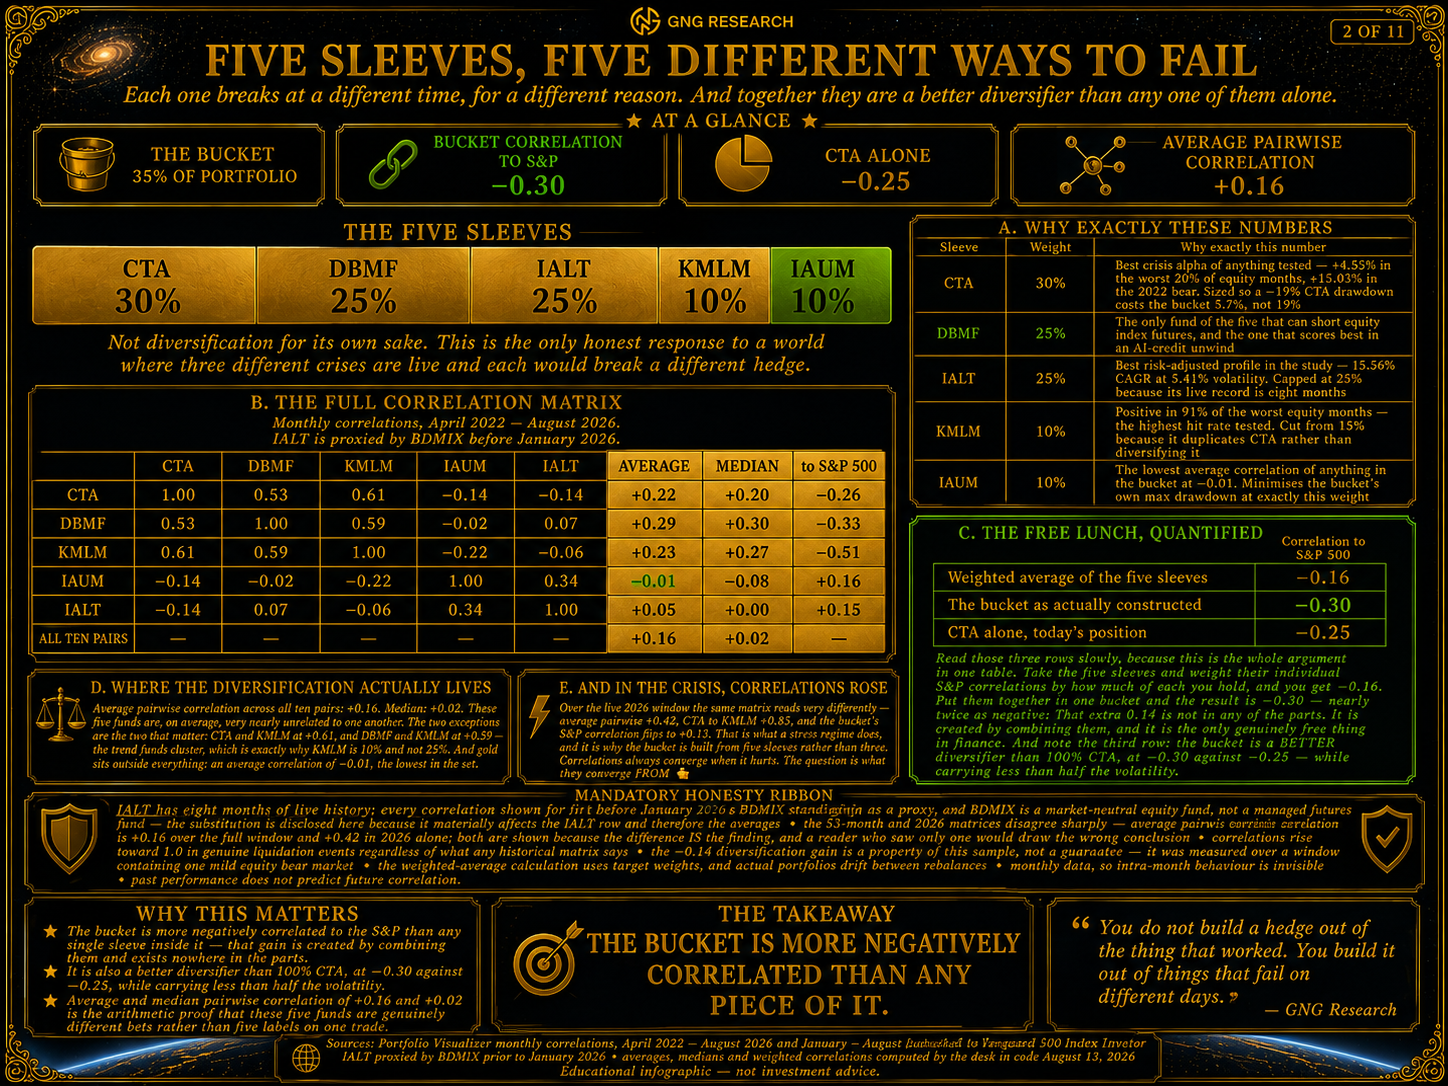
Here is the whole bucket, every pair, plus the averages — and the number in the bottom right corner is the one I'd frame. 🤯
Monthly correlations, April 2022 – August 2026. IALT is proxied by BDMIX before January 2026, and I'm telling you that here rather than in a footnote.
CTA | DBMF | KMLM | IAUM | IALT | AVG | MEDIAN | to S&P | |
|---|---|---|---|---|---|---|---|---|
CTA | 1.00 | 0.53 | 0.61 | −0.14 | −0.14 | +0.22 | +0.20 | −0.26 |
DBMF | 0.53 | 1.00 | 0.59 | −0.02 | 0.07 | +0.29 | +0.30 | −0.33 |
KMLM | 0.61 | 0.59 | 1.00 | −0.22 | −0.06 | +0.23 | +0.27 | −0.51 |
IAUM | −0.14 | −0.02 | −0.22 | 1.00 | 0.34 | −0.01 ✅ | −0.08 | +0.16 |
IALT | −0.14 | 0.07 | −0.06 | 0.34 | 1.00 | +0.05 | +0.00 | +0.15 |
ALL TEN PAIRS | +0.16 | +0.02 |
Average pairwise correlation across all ten pairs: +0.16. Median: +0.02.
These five funds are, on average, very nearly unrelated to each other. That's not a slogan. That's the arithmetic.
The two exceptions are the two that matter. CTA and KMLM at +0.61. DBMF and KMLM at +0.59. The trend funds cluster — which is exactly why KMLM is 10% and not 25%.
And look at gold. An average correlation of −0.01, the lowest in the entire set. The smallest sleeve in the bucket is the best diversifier in it. 😄
Now here's the part that made me sit back in my chair 🤯
Take the five sleeves. Weight each one's S&P correlation by how much of it you hold. Add them up. You get −0.16.
Now put them together in an actual weighted bucket and measure it.
−0.30.
Correlation to the S&P 500 | |
|---|---|
Weighted average of the five sleeves | −0.16 |
The bucket as actually built | −0.30 |
CTA alone — today's position | −0.25 |
That extra 0.14 is not in ANY of the parts. It is created by combining them.
That is the "only free lunch on Wall Street" — the thing every textbook mentions and almost nobody puts a number on. There it is. Fourteen points of diversification that came from nowhere except the act of not owning one fund. 🙏
And read the third row again, because this is the sentence I want you to leave with:
The five-sleeve bucket is a BETTER diversifier than 100% CTA. −0.30 against −0.25. While carrying less than half the volatility and earning more.
I spent three days trying to find the catch. There isn't one. That's what happens when you stop asking one fund to be five things.
The honest counterweight ⚖️
Over the live 2026 window — January through August, the war window — the same matrix reads very differently. Average pairwise correlation jumps to +0.42. CTA to KMLM goes to +0.85. And the bucket's S&P correlation flips positive to +0.13.
That is what a stress regime does, and I'm not going to hide it. Correlations always converge when it hurts. 2008 taught everybody that lesson, and the tuition was expensive.
The question isn't whether they converge. It's what they converge FROM. A bucket that starts at an average pairwise of +0.16 and rises to +0.42 under stress is in a very different position from a fund that was already all-in on one contract.
And notice which pair went the other way: DBMF and IALT at −0.12 in 2026. In the worst window, one pair got MORE diversifying, not less. That's the pair doing the actual work. 😉
Part 10: The One Thing This Bucket Does NOT Protect You From
This is the sharpest question anyone asked me all week, so it gets its own section.
The Duration Rule cuts both ways. If trend following works in long crises, it fails in fast ones — and the fast V-bottom is the most COMMON kind of equity drawdown there is.
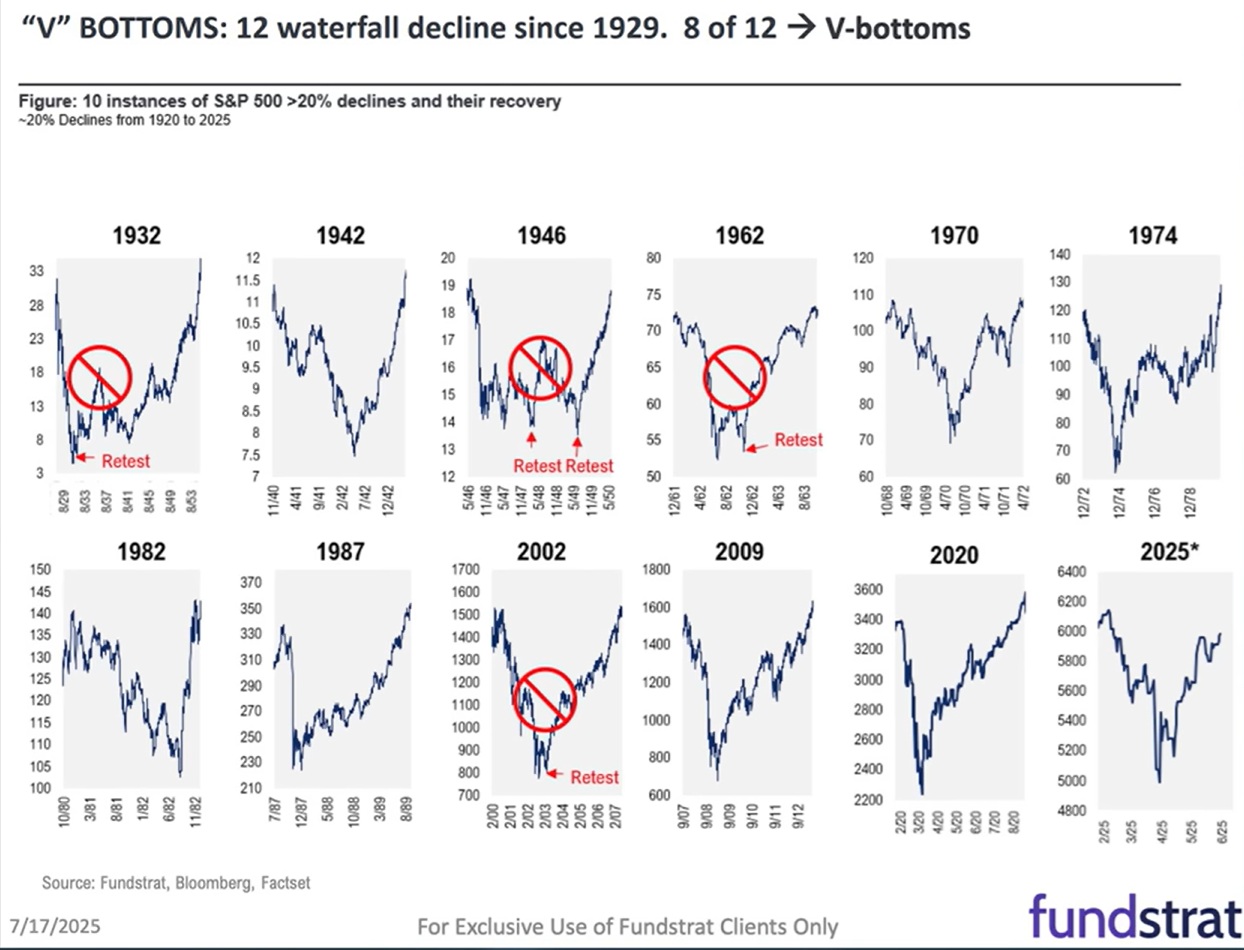
COVID. Q4 2018. April 2025. Down 15–20% in weeks, back up before the analysts finish their revisions.
Here's what this bucket does in that scenario: S&P −18%, CTA −4%, DBMF −3%, KMLM −3%, IALT +1%, gold 0%.
The bucket essentially doesn't move. And I want to be precise about why that's the right answer rather than a disappointing one. 🤯
In a fast crash, a hedge's job is not to spike. Its job is to still be worth what it was worth on the way in. Because a V-bottom is over before you can react to it — COVID was twenty-three trading days, start to finish. By the time you've decided what to do, the recovery already happened without you.
Which means the only thing that helps is something you already owned that didn't fall. Not something clever you do during it. Something already sitting there, holding its value, while everything else goes on sale. That's a sleeve you can sell at a gain to buy stocks that are down 18%.
Nothing here spikes 30% in three weeks. If you want that, you buy SQQQ — and Part 7 explains what SQQQ does to you the other 95% of the time. 😉
IALT is the closest thing to a fast-crash sleeve in the set — near-zero beta, positive in the V-bottom scenario, the only asset in the study that doesn't need a trend to exist. That's a large part of why it's 25% and not 10%.
The V-bottom is the drawdown this bucket handles least well, and I'd rather say that out loud than let you find out in March. 🥺
Section 1. Insert it between Part 10 (the V-bottom section) and Part 11 (How Big Should The Bucket Be?) — that's ahead of where you are, so no scrolling back, and it lands right before the sizing math that depends on all three.
One note: the insert numbers run 13, 14, 15 inside a document whose later inserts are 8–12. That's out of numeric order and it's fine — you're matching by name anyway, and renumbering would mean touching work you've already placed.
INTERLUDE: THE THREE WARS
Here's the method to this madness 😉
I've spent ten parts talking about funds. Correlations, capture ratios, decile tables, a boa constrictor's worth of arithmetic. And underneath every single one of those numbers sits a question I haven't actually shown you yet: which war are we hedging?
Because there are three of them. One is happening right now and dominates every headline. Two haven't started, and almost nobody is positioned for them. And the Duration Rule says the loud one is the one we can't hedge, while the quiet ones are exactly where trend following does its best work, based on forty-six years of data.
That's not a coincidence. That's the whole reason the bucket looks the way it does. So let's go through them one by one.
War One: The One That Broke The Hedge
Let me start with what Iran actually asked for, because the headlines got this wrong in a way that matters.
Sign in to leave a comment and join the discussion.
Sign Up Free