

I do not usually write these.. though the request I hear most often from members is for more dividend content, and it is a subject I have spent years surrounded by, on top of working in it as an analyst. So this time I am putting my own list out there, the five high-yield dividend payers I would invest in today.
This is the first edition of what I intend to make a quarterly series. Also please note that realty income was excluded from this list since Adam just covered the services' thoughts on it earlier this week, feel free to read that HERE. When creating this list I decided to do one pick in five different sectors, and each company is valued with the methodology its own sector demands rather than one multiple applied to everything (Like how the GNG rating system does it). Other criteria included: It must to be compelling on valuation, safe on the measures that actually decide whether a dividend survives, and still pay a regular yield of at least 5%. And to be frank I probably could have made this article a top 20, considering how pummeled some of these sectors are right now.
On the last day of the quarter the 10-year Treasury yielded 5.29%, the Federal Reserve had just raised rates for the first time since 2023, and the market had spent three months marking down anything that trades like a bond. A 5% dividend used to be an argument in itself. Today it is closer to an opening bid, and a stock has to offer something the Treasury cannot, whether growth, pricing power, contracted cash flow, or a balance sheet that treats the dividend as an obligation rather than a courtesy.
TL/DR. Five high-yield dividend payers in five sectors, each valued on its own sector's yardstick, with prices and GNG data as of the September 30, 2026 close.
EPD, 6.29%. A fee-based pipeline network that covered its distribution 1.75x over the past year, rated in the A category, with 27 straight years of increases.
SNY, 5.88%. A AA-rated drugmaker near its lowest multiple in ten years, paying out about half of business earnings while Dupixent grew 38% last quarter.
HRL, 5.86%. Sixty straight annual increases, a dividend covered 1.22x by free cash flow, and shares near 2013 lows after a downgrade that leaves it investment grade.
LKQ, 5.26%. A parts distributor whose free cash flow covers the dividend about 2x, while a self-inflicted software problem in Germany heals and the board weighs a sale of the company.
VICI, 8.01%. The one Good Buy of the five, a casino landlord on 39-year triple-net leases whose AFFO covers the dividend 1.34x, priced as if the rent talks that follow Caesars' sale can only go badly.
The Market Regime, and Where High Yield Sits in It
In my midyear outlook the Iran ceasefire was the largest single variable for the second half. It failed in July, and the playbook described then, higher headline inflation, a more hawkish Fed and pressure on real incomes, arrived on schedule. Brent rose about 40% in the third quarter, the Fed raised its target range to 3.75% to 4.00% on September 16, its first hike since 2023, and futures now price another by December. The outlook's two misses belong on the record too. Industrials and materials did not work in a quarter defined by rising real yields, and its bear-case mechanism never engaged because earnings kept rising. The result is a hot, energy-shocked expansion in which leadership is narrow and cash-flow driven, with the ten largest companies near 40% of the S&P 500, the highest concentration since at least the mid-1990s.
The move in rates is the fact that matters most for income investors. The 10-year Treasury rose 85 basis points in the quarter to 5.29%, above 5% for the first time since 2007, and about 86% of the rise came from real yields rather than inflation expectations. That is the least forgiving kind of rate shock for bond-like equities, because it raises the discount rate without raising the cash flows. The S&P 500's forward earnings yield of about 5.2% now sits below the 10-year, and the index's trailing dividend yield is about 1%. Figure 1 shows how the market sorted the consequences.
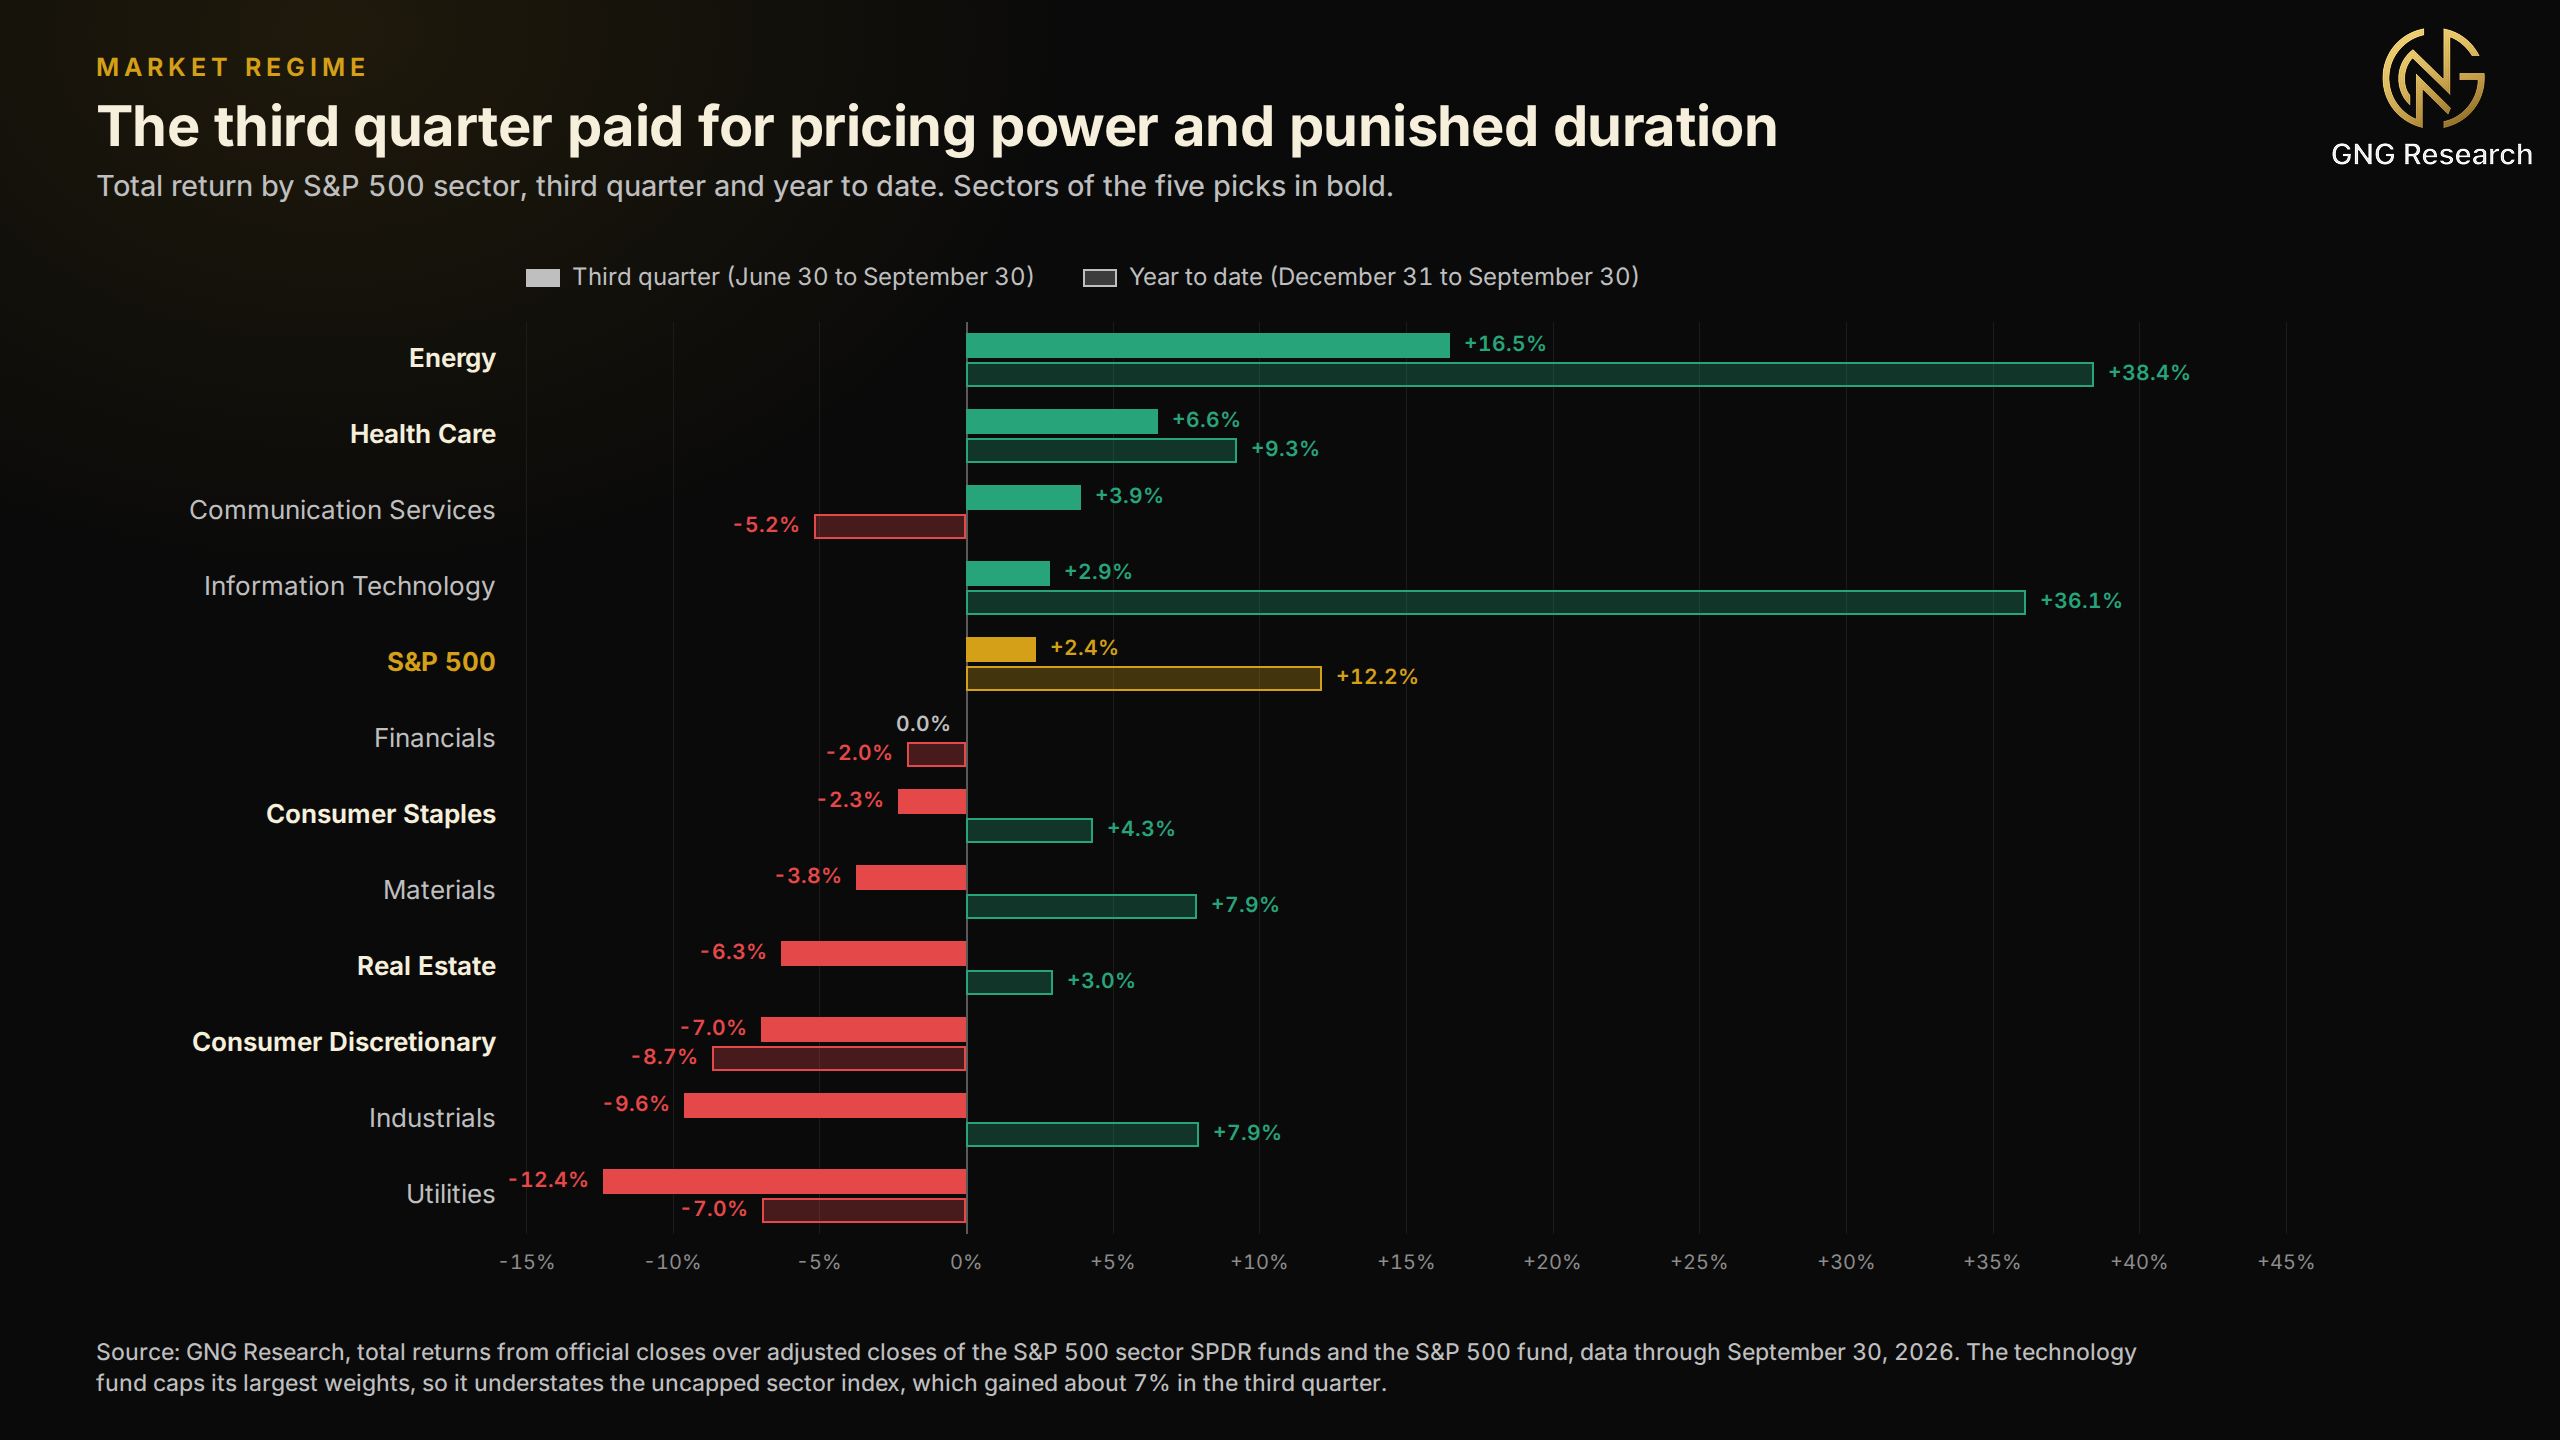
The third quarter paid for pricing power and contracted cash flow and punished duration. Energy returned 16.5% and health care 6.6%, while utilities lost 12.4% and real estate 6.3%, the classic bond proxies marked down as the discount rate rose. The same fault line ran through dividend strategies, where two popular high-dividend funds finished the year to date 13.4 points apart, a gap that tracks how much each holds in utilities and REITs. The market spent the quarter pricing pipelines like pipelines and utilities like 30-year bonds, which, for once, was hard to argue with.
The same midyear outlook put consumer discretionary, energy and consumer staples on watch. Real estate has since earned a place on that list because its trigger fired with the September hike, and four of these five picks sit in those sectors. Only Sanofi comes from a sector the outlook favored. The screen explains most of it. It selects for dividend safety and valuation inside each sector, which often means buying where the sector is out of favor.
Energy's own triggers fired in its favor, and the sector returned 16.5% in the quarter. For the other three, the pick's cash flow is not the sector's problem. Staples lost 2.3%, yet Hormel's dividend is covered by free cash flow and its foodservice business keeps growing. Discretionary lost 7.0%, yet LKQ's free cash flow covers its dividend about 2x. Real estate lost 6.3%, yet VICI collects rent under long triple-net leases with built-in escalators. Sector calls and stock calls can diverge, and the relationship can break.
Figure 2 sets the five picks against an income investor's alternatives. A 3-month bill yields 4.20%, the investment-grade corporate index 5.97% and the high-yield index 8.08%.
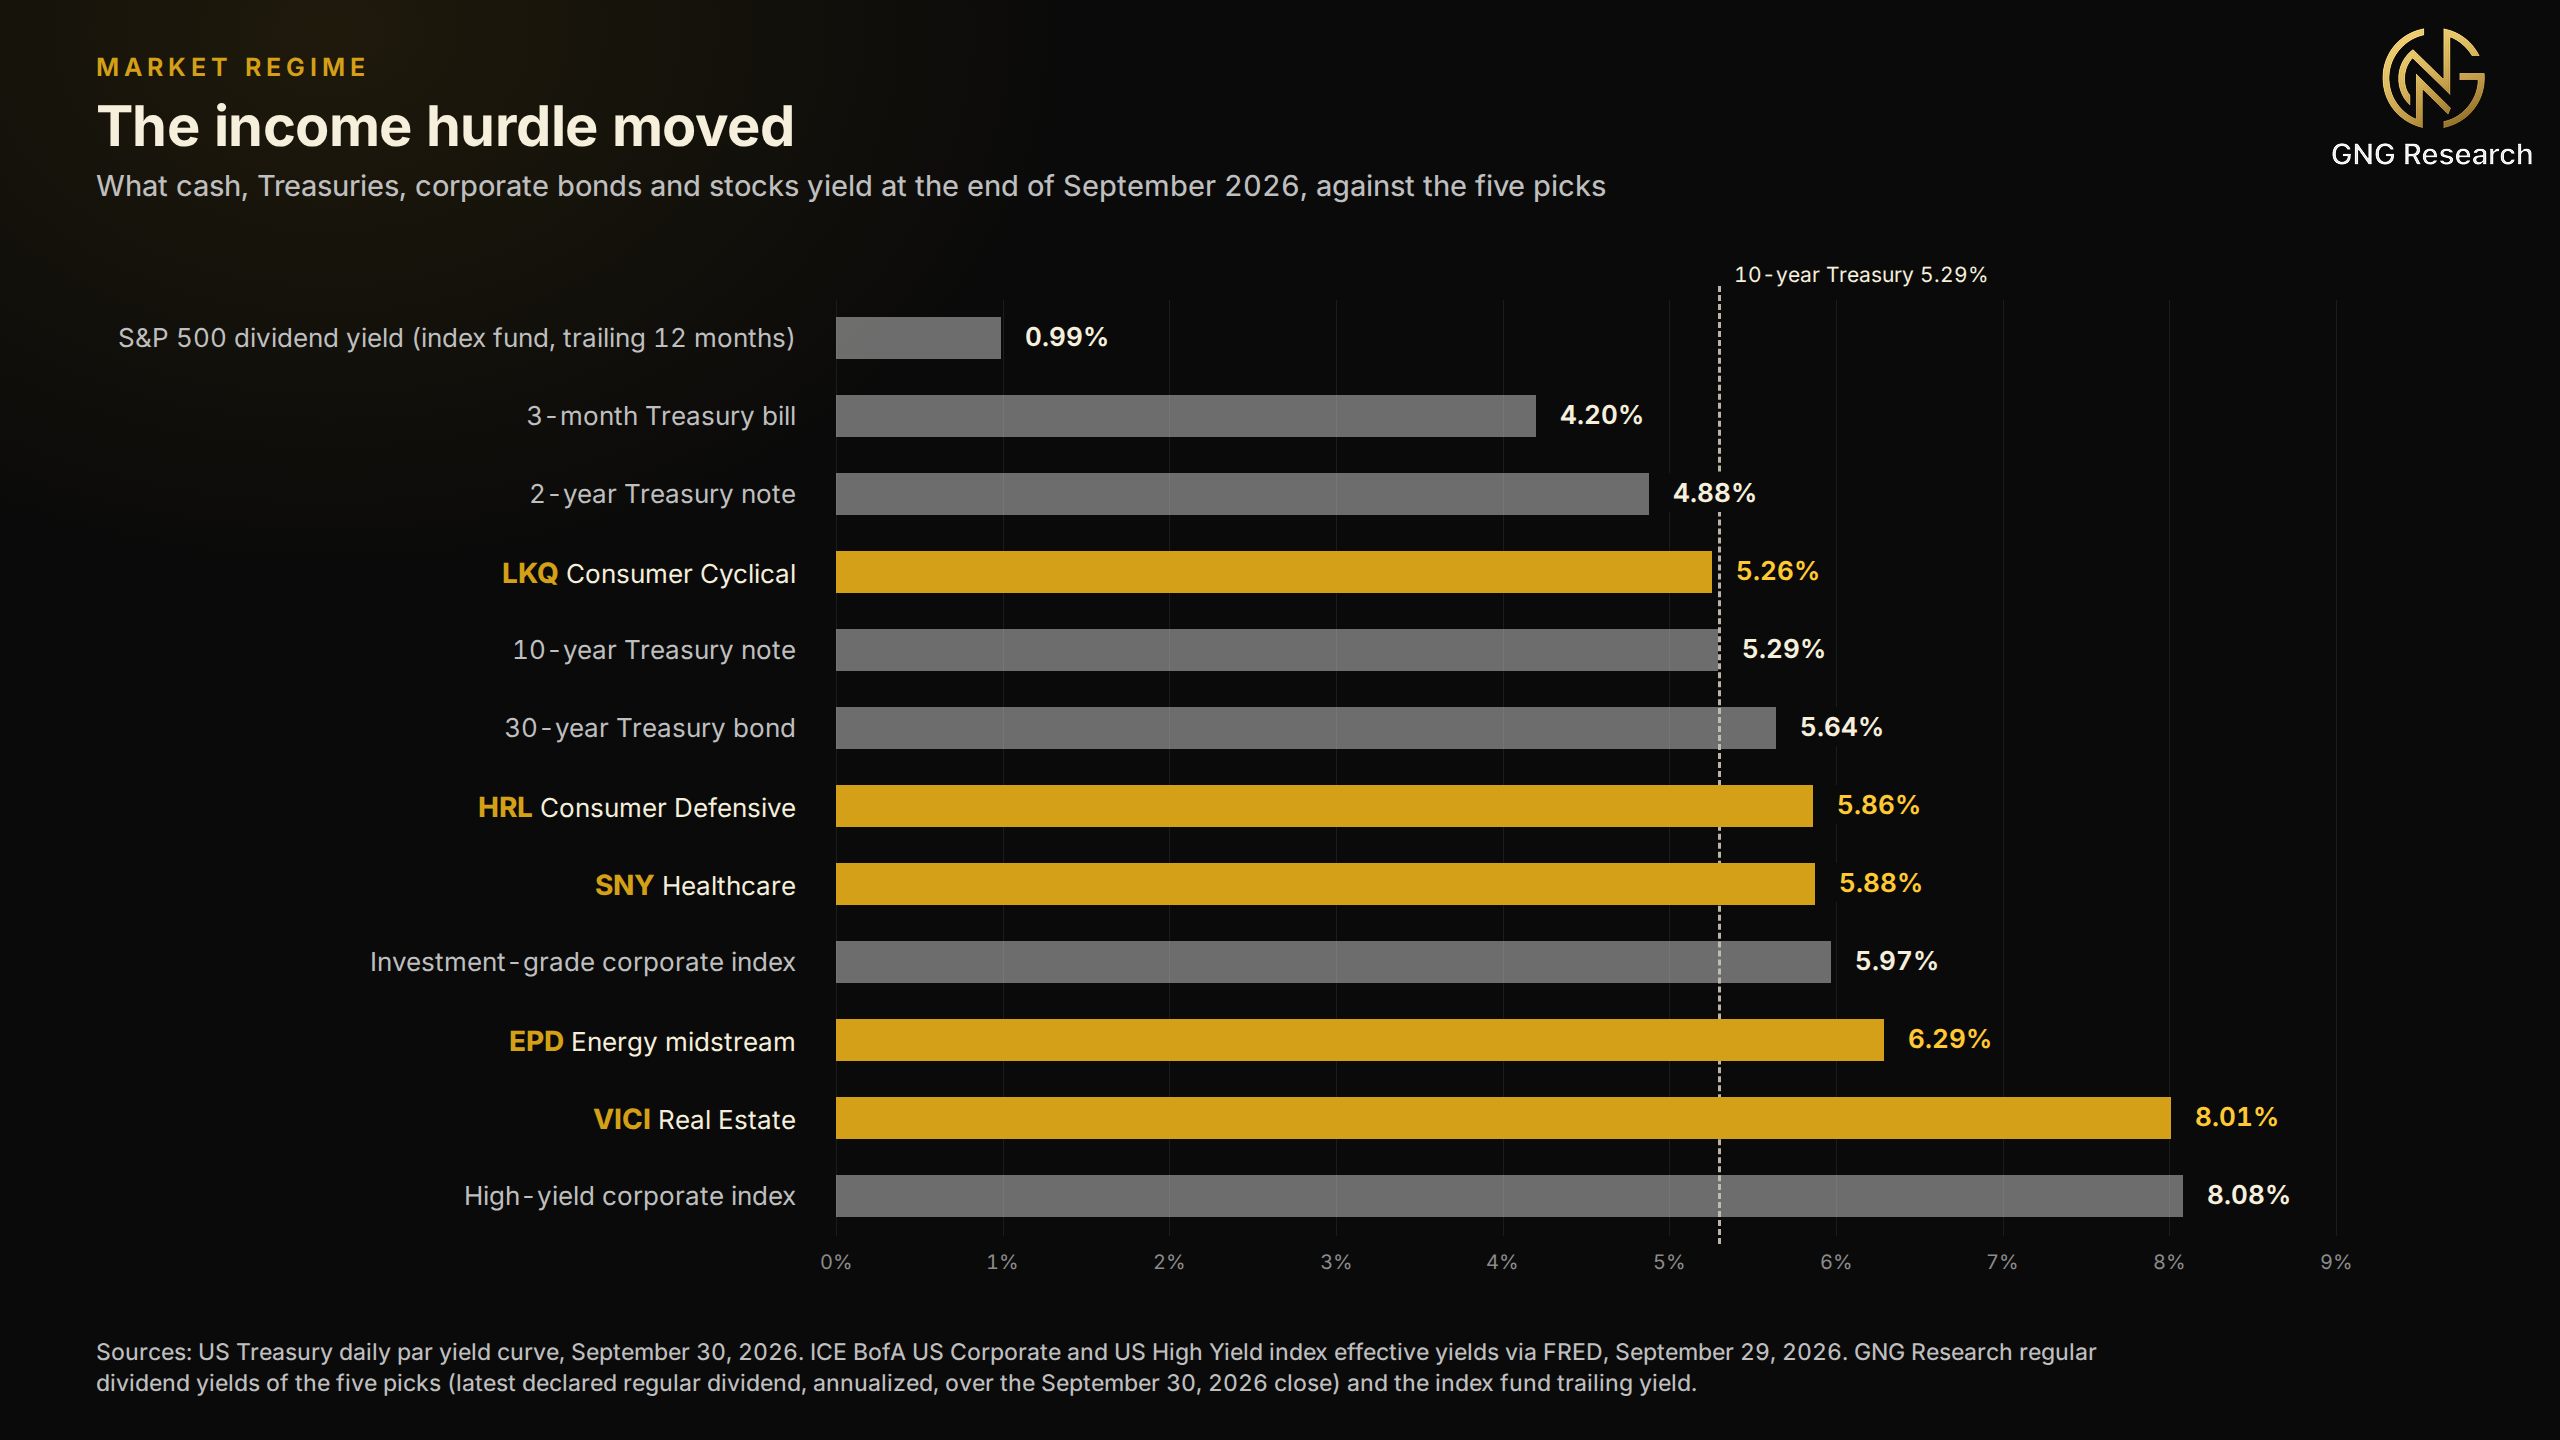
Real estate is the hardest fit for this regime. The 10-year real yield rose 73 basis points in the quarter while breakeven inflation rose only 12, so rent escalators that index to prices had little to offset a higher discount rate. The VICI section confronts that directly. Its cushion is the yield itself, 2.72 points above the 10-year Treasury, while the share price answers to real rates in the meantime.
Three variables will decide whether the pattern holds, and each points to a different rotation. A deal that reopens the Strait of Hormuz, with OPEC spare capacity effectively at zero, could drain the oil premium quickly and give the lagging rate-sensitive groups room to recover, while an escalation would do the reverse with no buffer. A Fed that pauses after December as core inflation cools would favor dividend payers with duration, the utilities and long-lease landlords that lagged this summer. And private credit, where Fitch's default rate reached a record 6.1% and redemption queues have spread across non-traded funds, could carry its stress into public credit, which would favor strong balance sheets over anything that depends on continuous funding. Fee-based, contracted and inflation-linked cash flows are less exposed to any of those outcomes than the headlines suggest, and that is the kind of income this list was built around.
High-yield equities sit in an awkward place in this regime, competing with a risk-free rate above 5% in a market that punishes income that behaves like a bond and pays for income that comes with growth, pricing power or contracted cash flow. That distinction shaped every pick below. This is the read on today's data, not a forecast, and a regime built around a single shipping lane can change over a weekend.
The Picks In Research Terminal
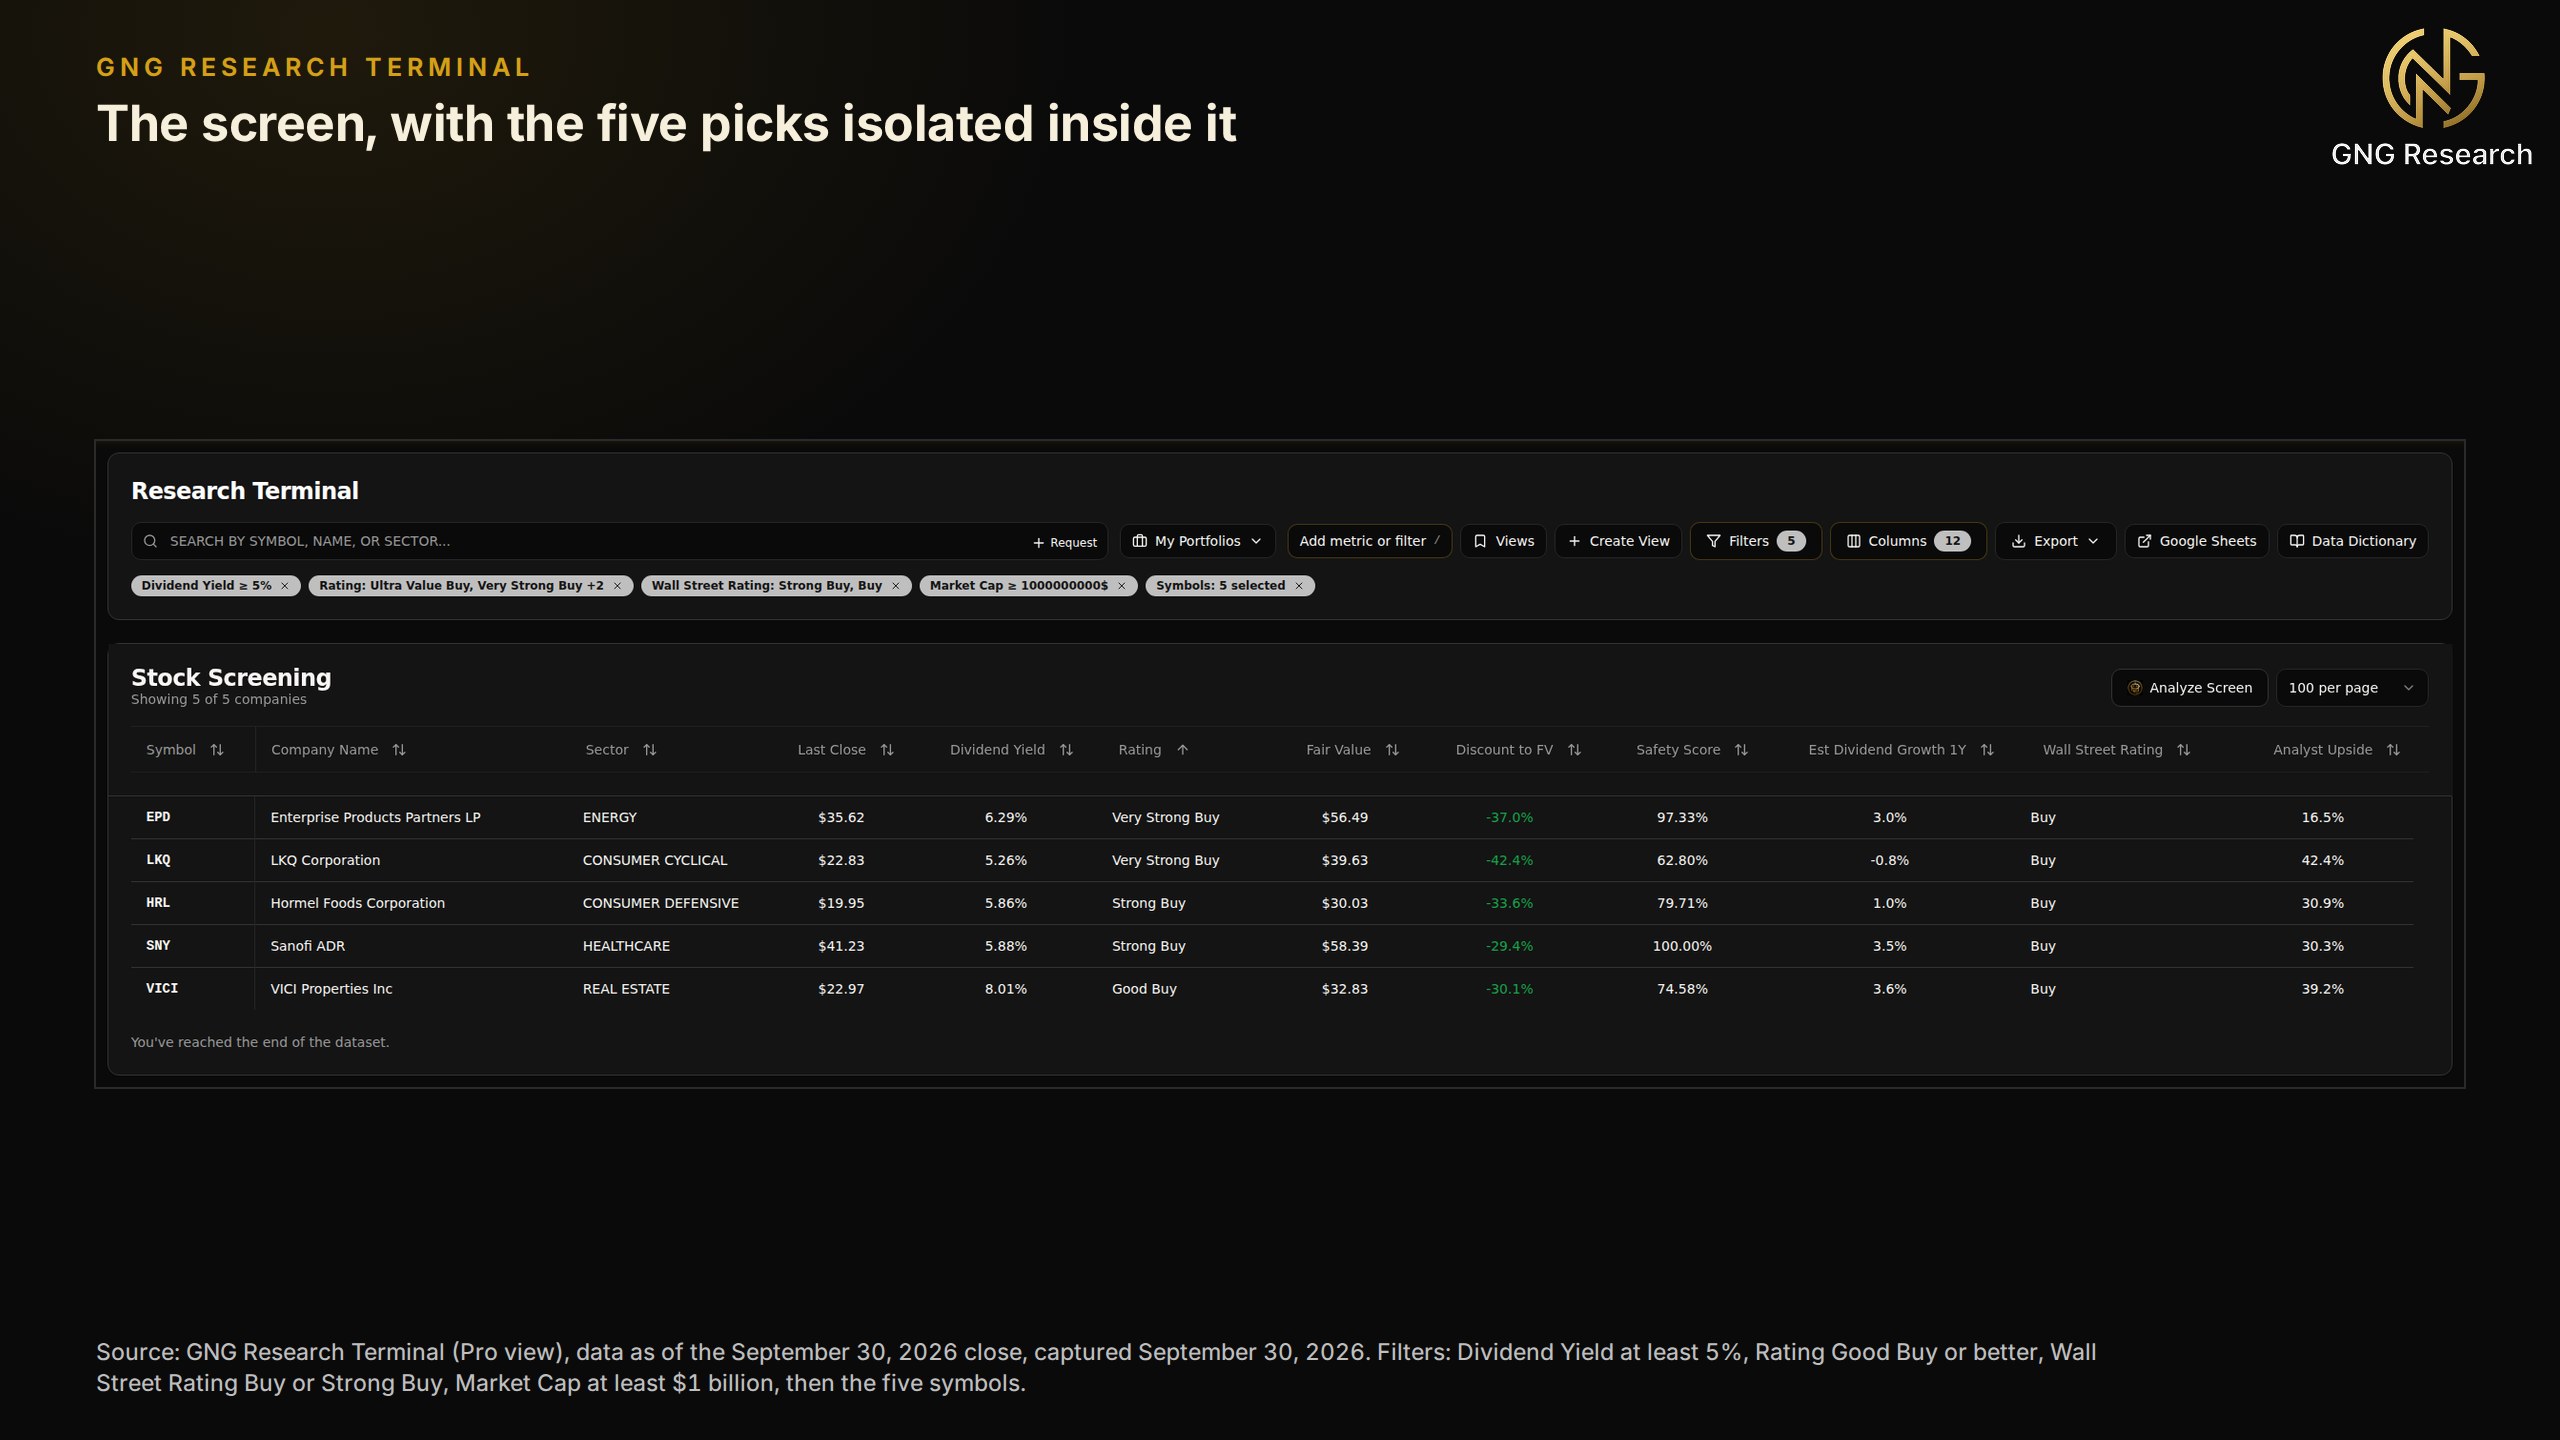
Every pick offers at least 41% of upside to GNG's fair value, and in every case Wall Street's mean target also sits above the price, if less generously.
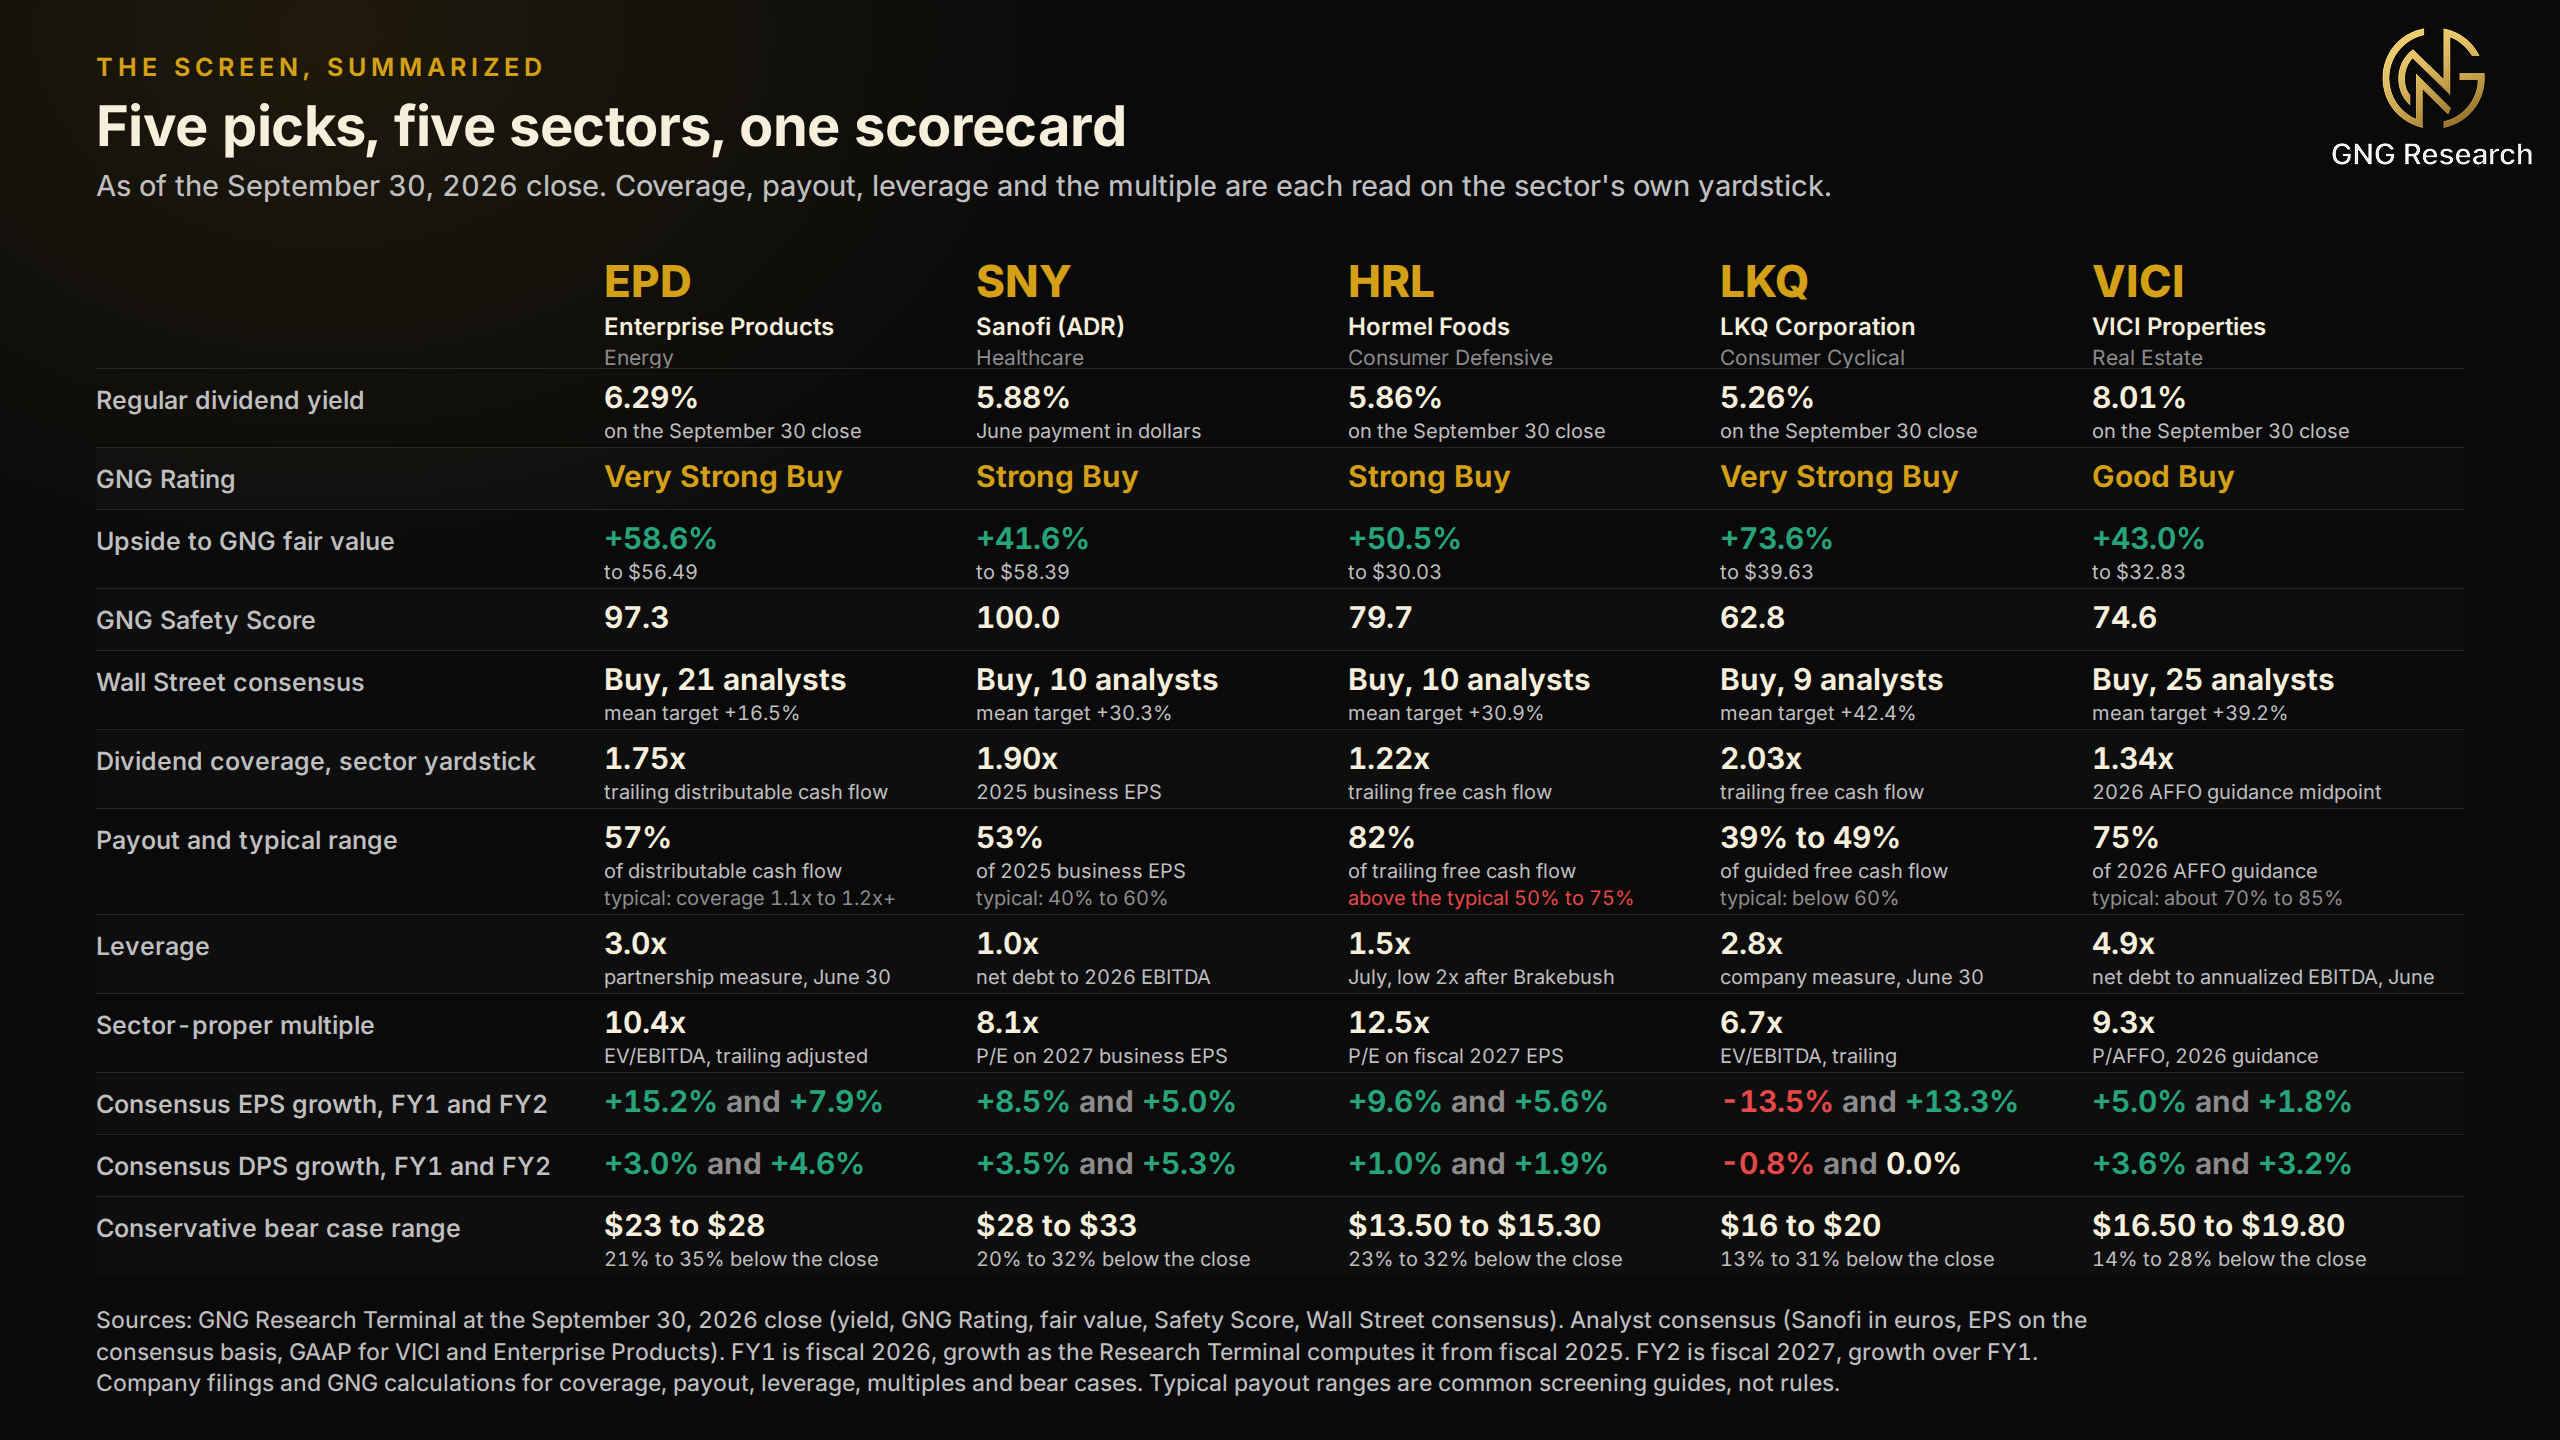
Payout is coverage seen from the other side, and Figure 4 sets each one beside the range typical for its sector. Enterprise Products paid out about 57% of its distributable cash flow over the past year, or 1.75x coverage, where pipeline investors commonly look for at least 1.1x to 1.2x. Sanofi's 2025 dividend took 53% of business EPS, inside the 40% to 60% typical of large drugmakers. LKQ's payout is 39% to 49% of guided free cash flow, below the roughly 60% commonly preferred for cyclical businesses, and VICI's is about 75% of AFFO, inside the roughly 70% to 85% typical of net-lease landlords. Hormel is the exception, at 82% of trailing free cash flow and 79% of the midpoint of its adjusted EPS guidance, both above the 50% to 75% typical of consumer staples, so its dividend is covered but stretched. These are screening ranges rather than rules, and a payout inside them can still be cut.
Enterprise Products Partners
(EPD) owns more than 50,000 miles of pipeline plus the Mont Belvieu fractionation hub and Gulf Coast export docks, and is paid mostly in fees. At the September 30 close of $35.62 the units yield 6.29% and GNG rates them Very Strong Buy. Distributable cash flow covered the distribution 1.75x over the past year, leverage is 3.0x, and all three agencies rate the senior debt in the A category. What I find compelling is a yield above a 5.29% Treasury, raised for 27 straight years by a business that retains over two fifths of its cash flow.
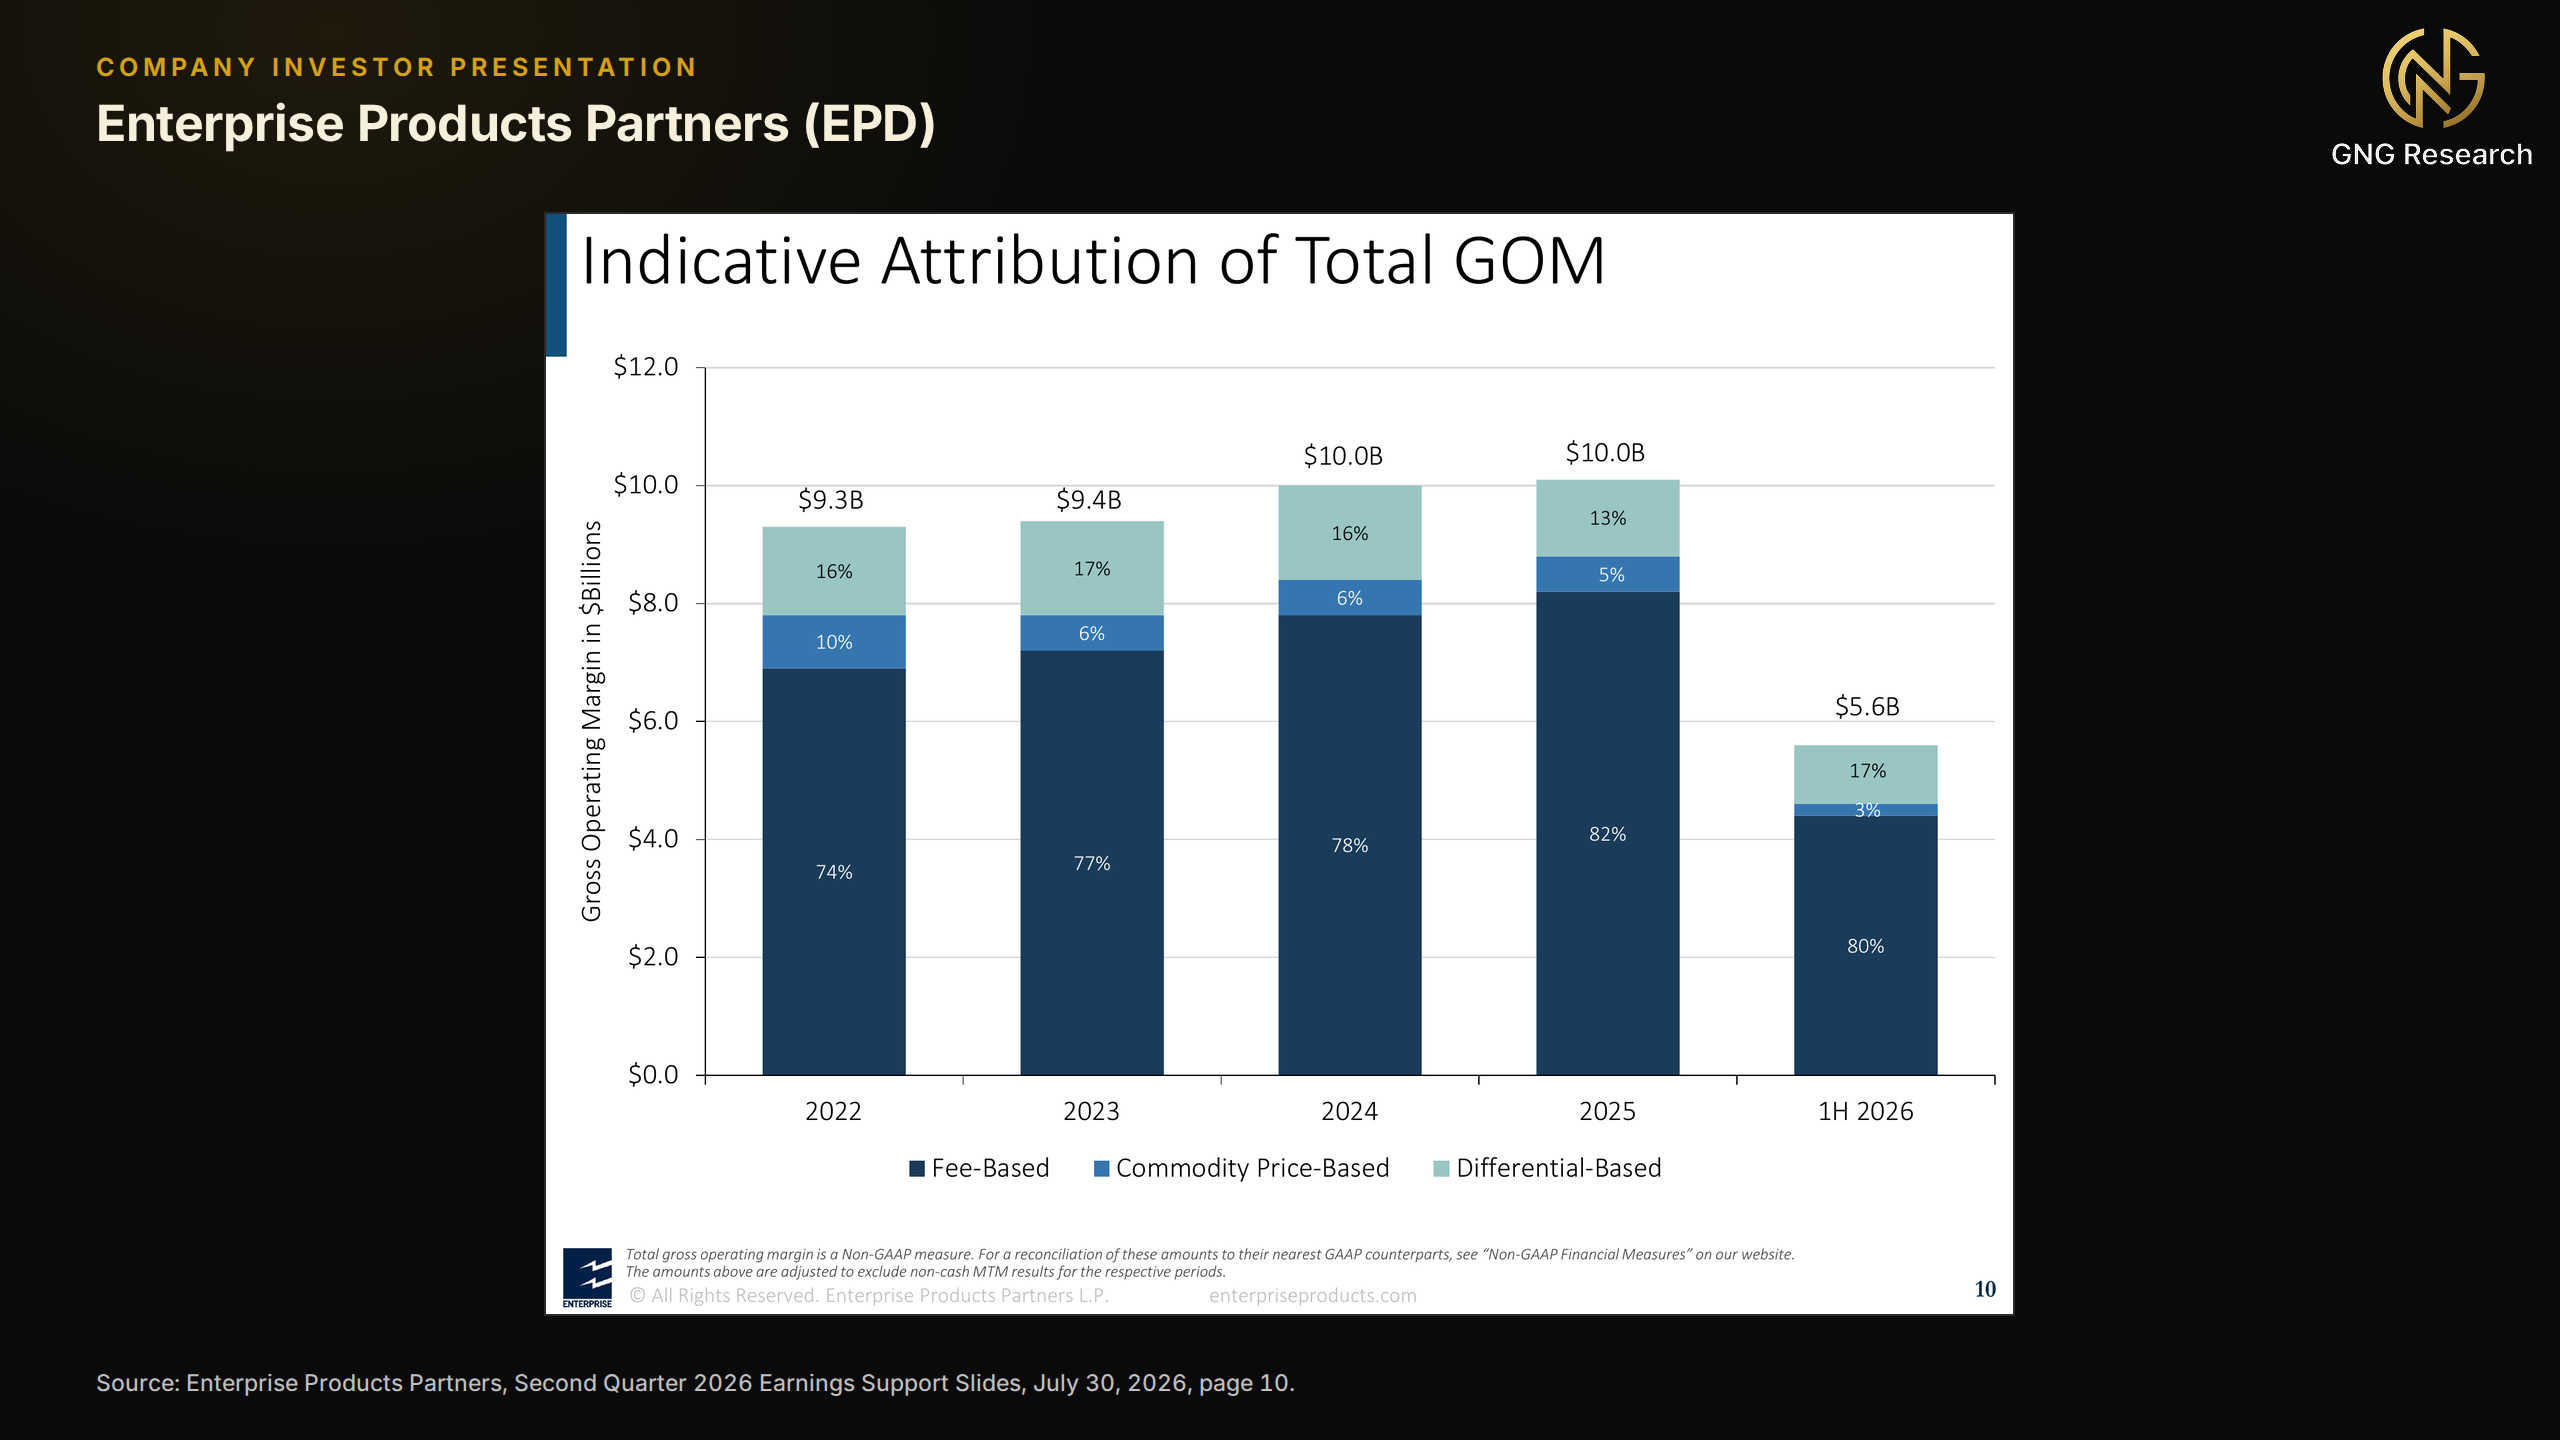
Energy stocks returned 16.5% over the quarter while EPD slipped 1.7%, distribution included, which is how a toll collector should behave when the cargo reprices. Yet the regime helps. The energy shock pulled foreign buyers toward American molecules, and EPD's docks handled a record 2.8 million barrels a day in the second quarter, up 33%. Inflation of 3.4% flows into fees, because about 90% of long-term contracts carry escalators, typically tied to consumer or producer prices. And 97% of the debt is fixed, at an average 4.7% for about 17 years, so a hiking Fed reaches the income statement slowly. On the micro side, about 80% of gross operating margin in the first half of 2026 was fee-based and only 3% depended directly on commodity prices, as the company's own chart in Figure 5 shows.
Volume growth does the rest, with Permian processing volumes up 14% and $6.5 billion of projects under construction, from an LPG export expansion due by year end to a new fractionator in 2028. The Duncan family's private company and affiliates own 32.5% of the units, and the co-chief executive who has shared the role since 2020 takes sole charge when Jim Teague retires in January. None of this is guaranteed.
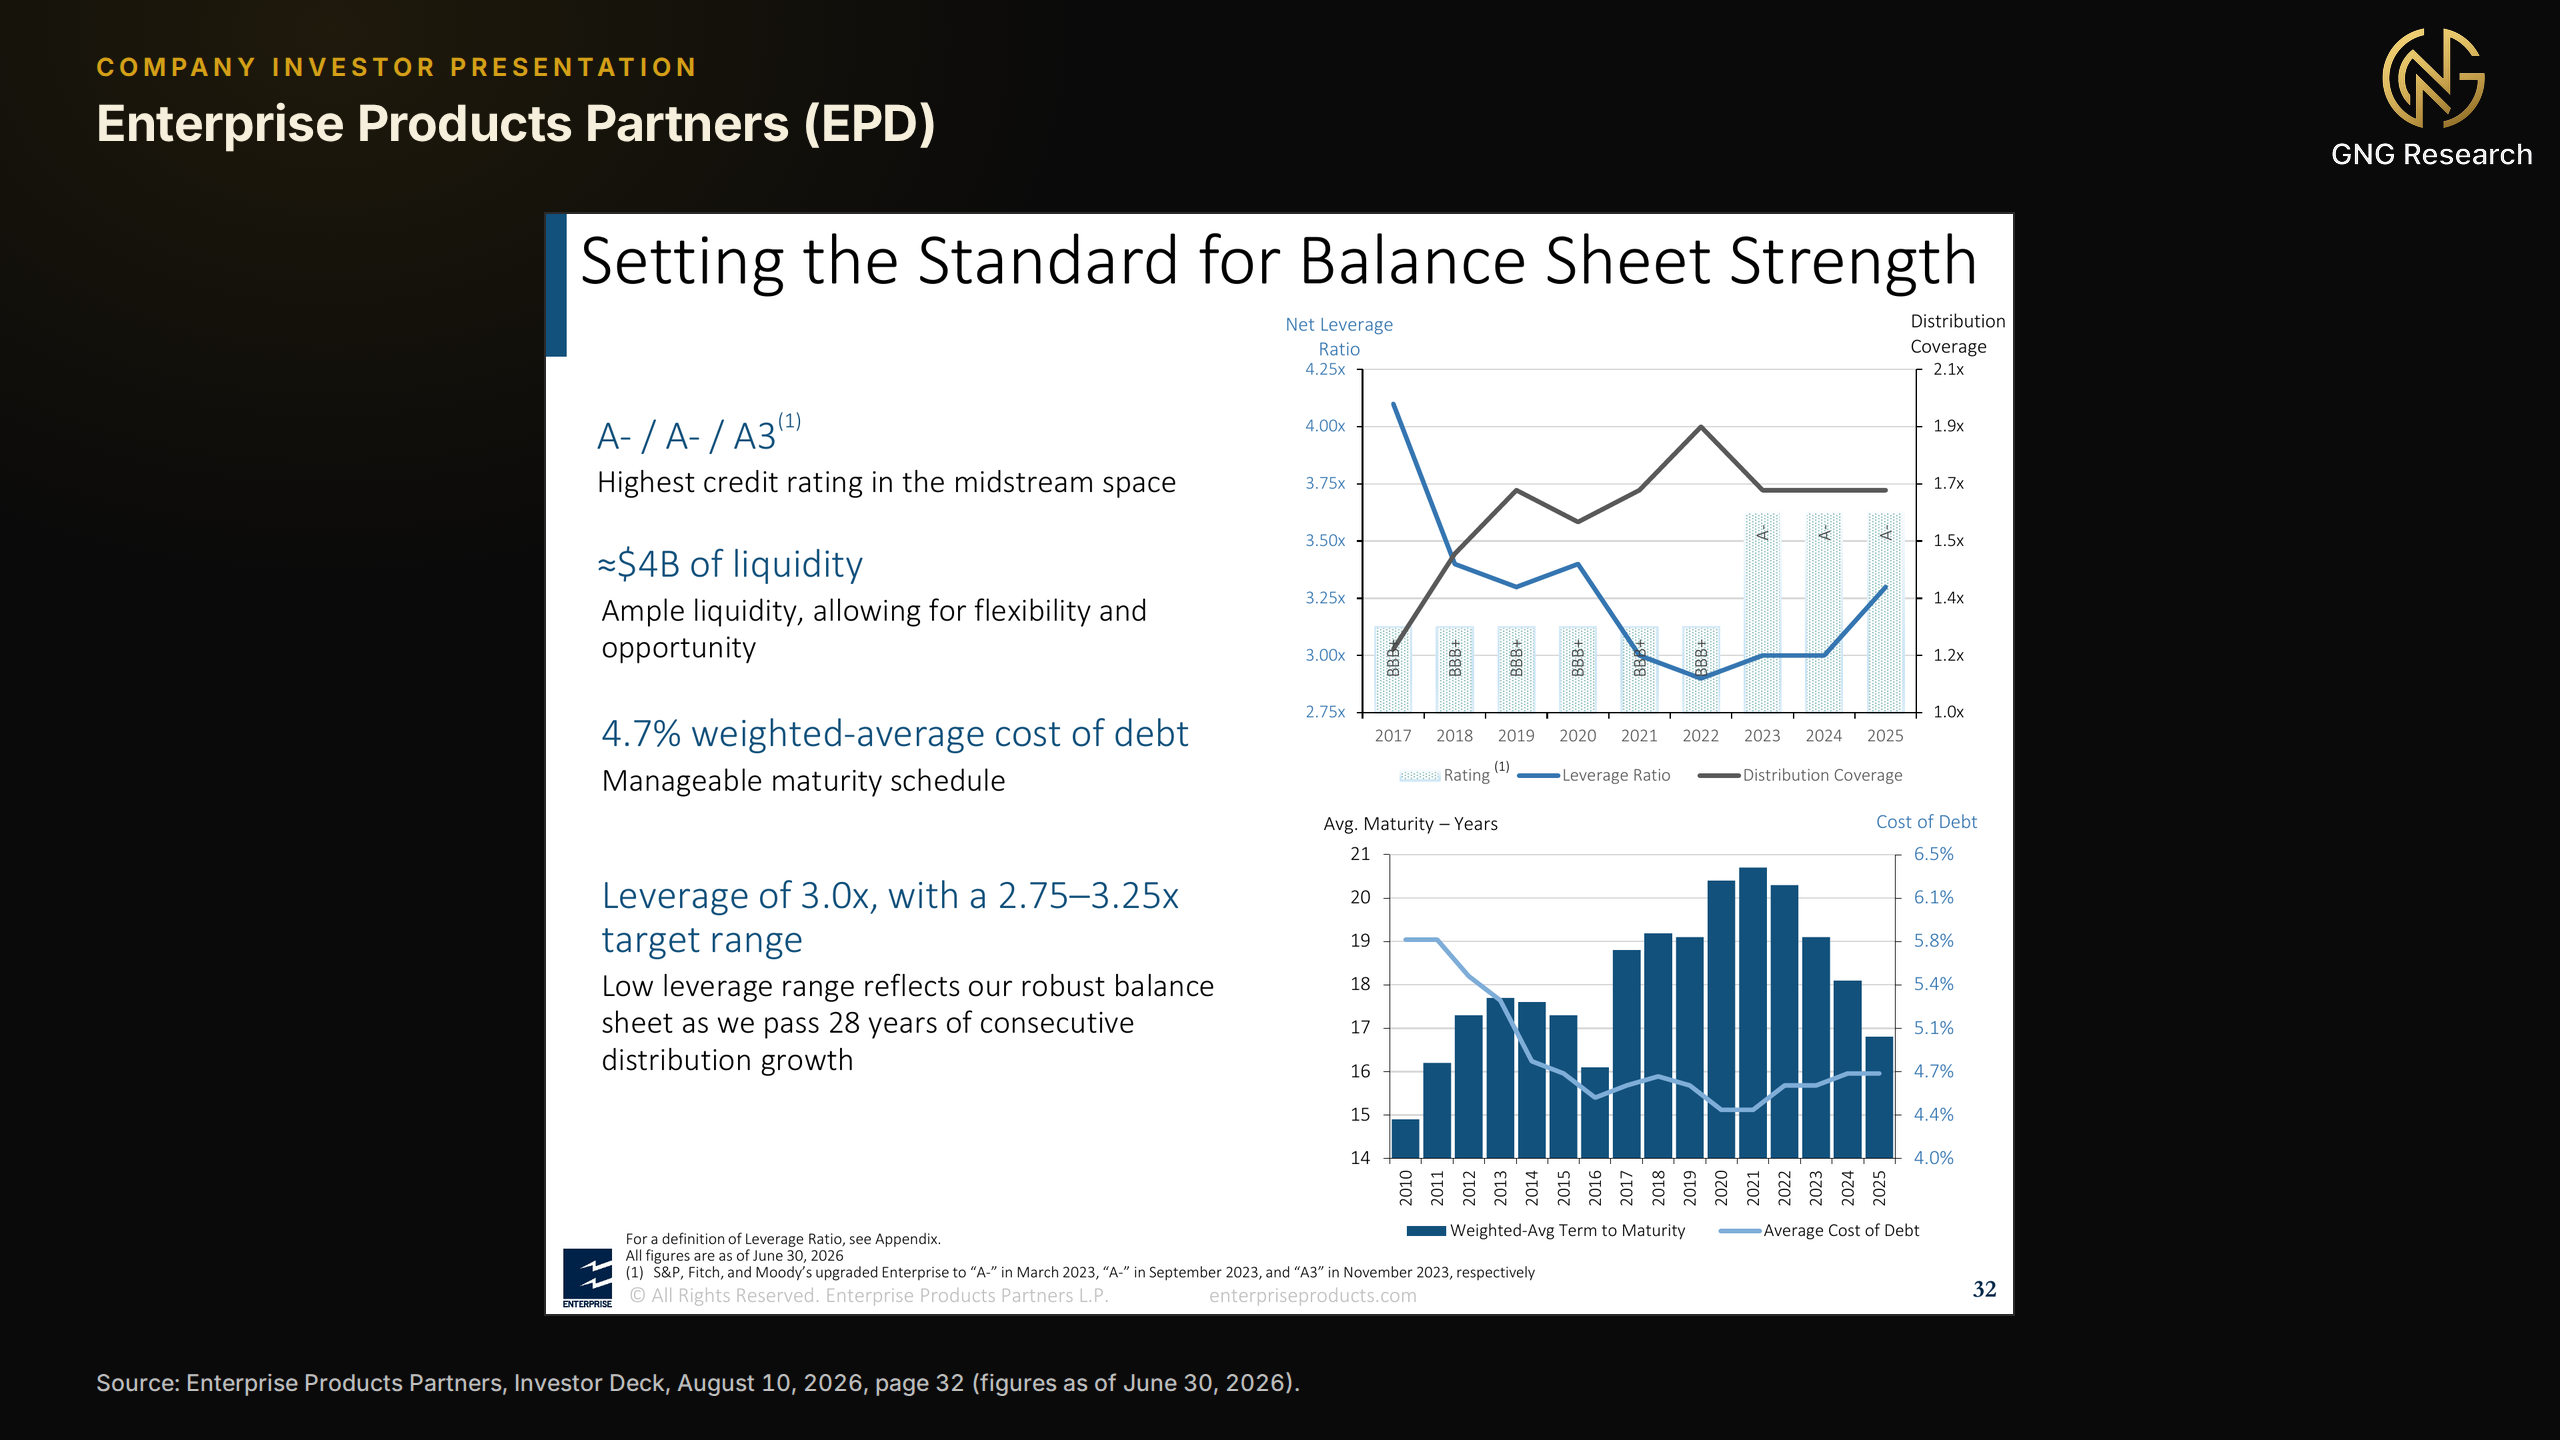
For a partnership that funds growth from retained cash, the yardstick is distributable cash flow, net of the spending that sustains the system, divided by the distribution. EPD covered its payout 1.9x in the second quarter and 1.75x over the past year, or 1.61x counting $405 million of buybacks. Coverage has been at least 1.6x every year since 2019 and never below 1.2x in the past decade. Dividends to free cash flow, about 141%, is the wrong test for a partnership because it charges about $3 billion a year of growth projects against the distribution. GNG's safety score is 97.3 of 100. Leverage was 3.0x at June 30, inside the 2.75x to 3.25x target range, and S&P, Moody's and Fitch rate the senior debt A-, A3 and A-, which the partnership calls the highest ratings in midstream, as Figure 6 shows.
Liquidity of $4.0 billion gained a $1.0 billion facility in July, while senior notes due within two years total $2.4 billion, against $3.6 billion of cash retained after distributions over the past year. The record matches, with 27 straight years of increases through 2025 and a 28th under way, a July declaration of $0.56 a quarter, 2.8% above a year earlier, and no analyst in the consensus models a 2027 distribution below the current $2.24 rate. History is never guaranteed to repeat.
P/E and P/B are the wrong valuation metrics for a partnership whose depreciation, $2.66 billion over the past year, is more than 3x its sustaining capital spending, so the sector prices on EBITDA and distributable cash flow. EPD trades at 10.4x trailing adjusted EBITDA and 9.5x the 2027 consensus, near the 10.2x median of its past ten year-ends and above the 8.7x trough of 2022, yet below the 11x to 16x of the largest midstream corporations in GNG's data. EPD is fairly priced rather than cheap on its own history, and the case rests on a 10.8% cash yield from $3.85 of distributable cash flow per unit.
GNG's model value of $56.49, 58.6% above the close, comes from a discounted cash flow model, so I read it as the long-run worth of the cash stream, not a twelve-month target. Wall Street rates EPD a buy, though nine of 21 analysts say Hold, with a $41.48 mean target 16.5% above the close.. Analyst consensus puts EBITDA at $11.06 billion, $11.55 billion and $12.12 billion for 2026 through 2028, revised up 2.4% and 1.1% for 2026 and 2027 in the past month, and the distribution at $2.27, $2.37 and $2.48. Current enterprise value is 10.0x, 9.5x and 9.1x those EBITDA estimates. I think this is extremely compelling. .
What could go wrong
A settlement that reopens the Strait of Hormuz would remove the export windfall, about $200 million in the second quarter by management's count, since normalized. Leverage of 3.0x leaves little room under the 3.2x downgrade sensitivity Fitch restated on September 15, measured on Fitch's own basis, while growth spending runs near $3 billion a year. Higher real yields could keep pressing income stocks, as the units' 9.5% slide from their September 2 high showed. A rate reset on one legacy NGL pipeline, softer export dock fees and the chief executive change are smaller risks. The partnership also issues a Schedule K-1 rather than a Form 1099.
The conservative bear case
It would likely start with a U.S.-Iran settlement that reopens Hormuz and sends Brent toward the $80 Goldman Sachs frames for normal flows, while the Fed hikes again in December and the 10-year passes 6%. EPD's next reports would show the spring's export and marketing margins fading, softer dock fees and a lower rate on the legacy pipeline, while $3 billion a year of growth spending lifts debt and the 2027 maturities refinance at higher coupons. Analysts would follow. Consensus 2027 EBITDA would slide about 6% toward the most bearish analyst's $10.84 billion, price targets would fall from the $41.48 mean, three Buy-to-Hold downgrades would tip the consensus to Hold, Fitch could turn its outlook negative as leverage passes 3.2x, and income funds would sell as the units de-rate.
At 8.7x EBITDA, EPD's lowest year-end multiple of the decade, that estimate implies about $28 a unit. Halving instead the non-fee 20% of trailing gross operating margin cuts trailing EBITDA 10%, to $9.56 billion, when the decade's worst year saw a 0.8% dip, and implies about $23. The range is $23 to $28, 21% to 35% below the September 30 close, with a yield of 7.9% to 9.7%. Coverage would still be 1.5x to 1.8x and leverage 3.0x to 3.4x, so the payout stays covered and investment grade, and a year of distributions would offset 18% to 30% of the decline.
The thesis breaks if the partnership cuts its distribution, if distributable cash flow covers it less than 1.2x over trailing twelve months for two straight quarters, if leverage on the partnership's own measure stays above 3.5x for two straight quarters, or if two of the three agencies move the senior debt out of the A category. None appears in today's data, and the range above is a stress test, not a forecast.
Sanofi
Sanofi (SNY) is a AA-rated drugmaker that has raised its euro dividend for 31 consecutive years, and its American depositary shares yielded 5.88% at the September 30, 2026 close. The market prices it at 8.1x 2027 consensus earnings and just above the lowest trailing multiple in its own ten-year history, as though the March 2031 expiry of Dupixent's main US patent were due next quarter. Meanwhile Dupixent grew 38% last quarter, guidance went up, and the dividend takes about half of business earnings. GNG rates the ADS a Strong Buy with a model value 42% above the close. What I find compelling is how much bad news the price already assumes, and I would invest in it today.
Health care returned 6.6% in the third quarter as its policy overhang largely cleared. Sanofi's December 2025 pricing agreement with Washington, which aligned some Medicaid prices with other wealthy countries, bought a three-year exemption from the Section 232 pharmaceutical tariffs, and none of its medicines is on the first three Medicare negotiation lists. Sanofi sat out the rally. Its ADS fell 3.4% over the same stretch and on September 29 closed at its lowest since October 2022, an odd fate for a stock with a one-year beta of 0.33 in a sector investors were buying.
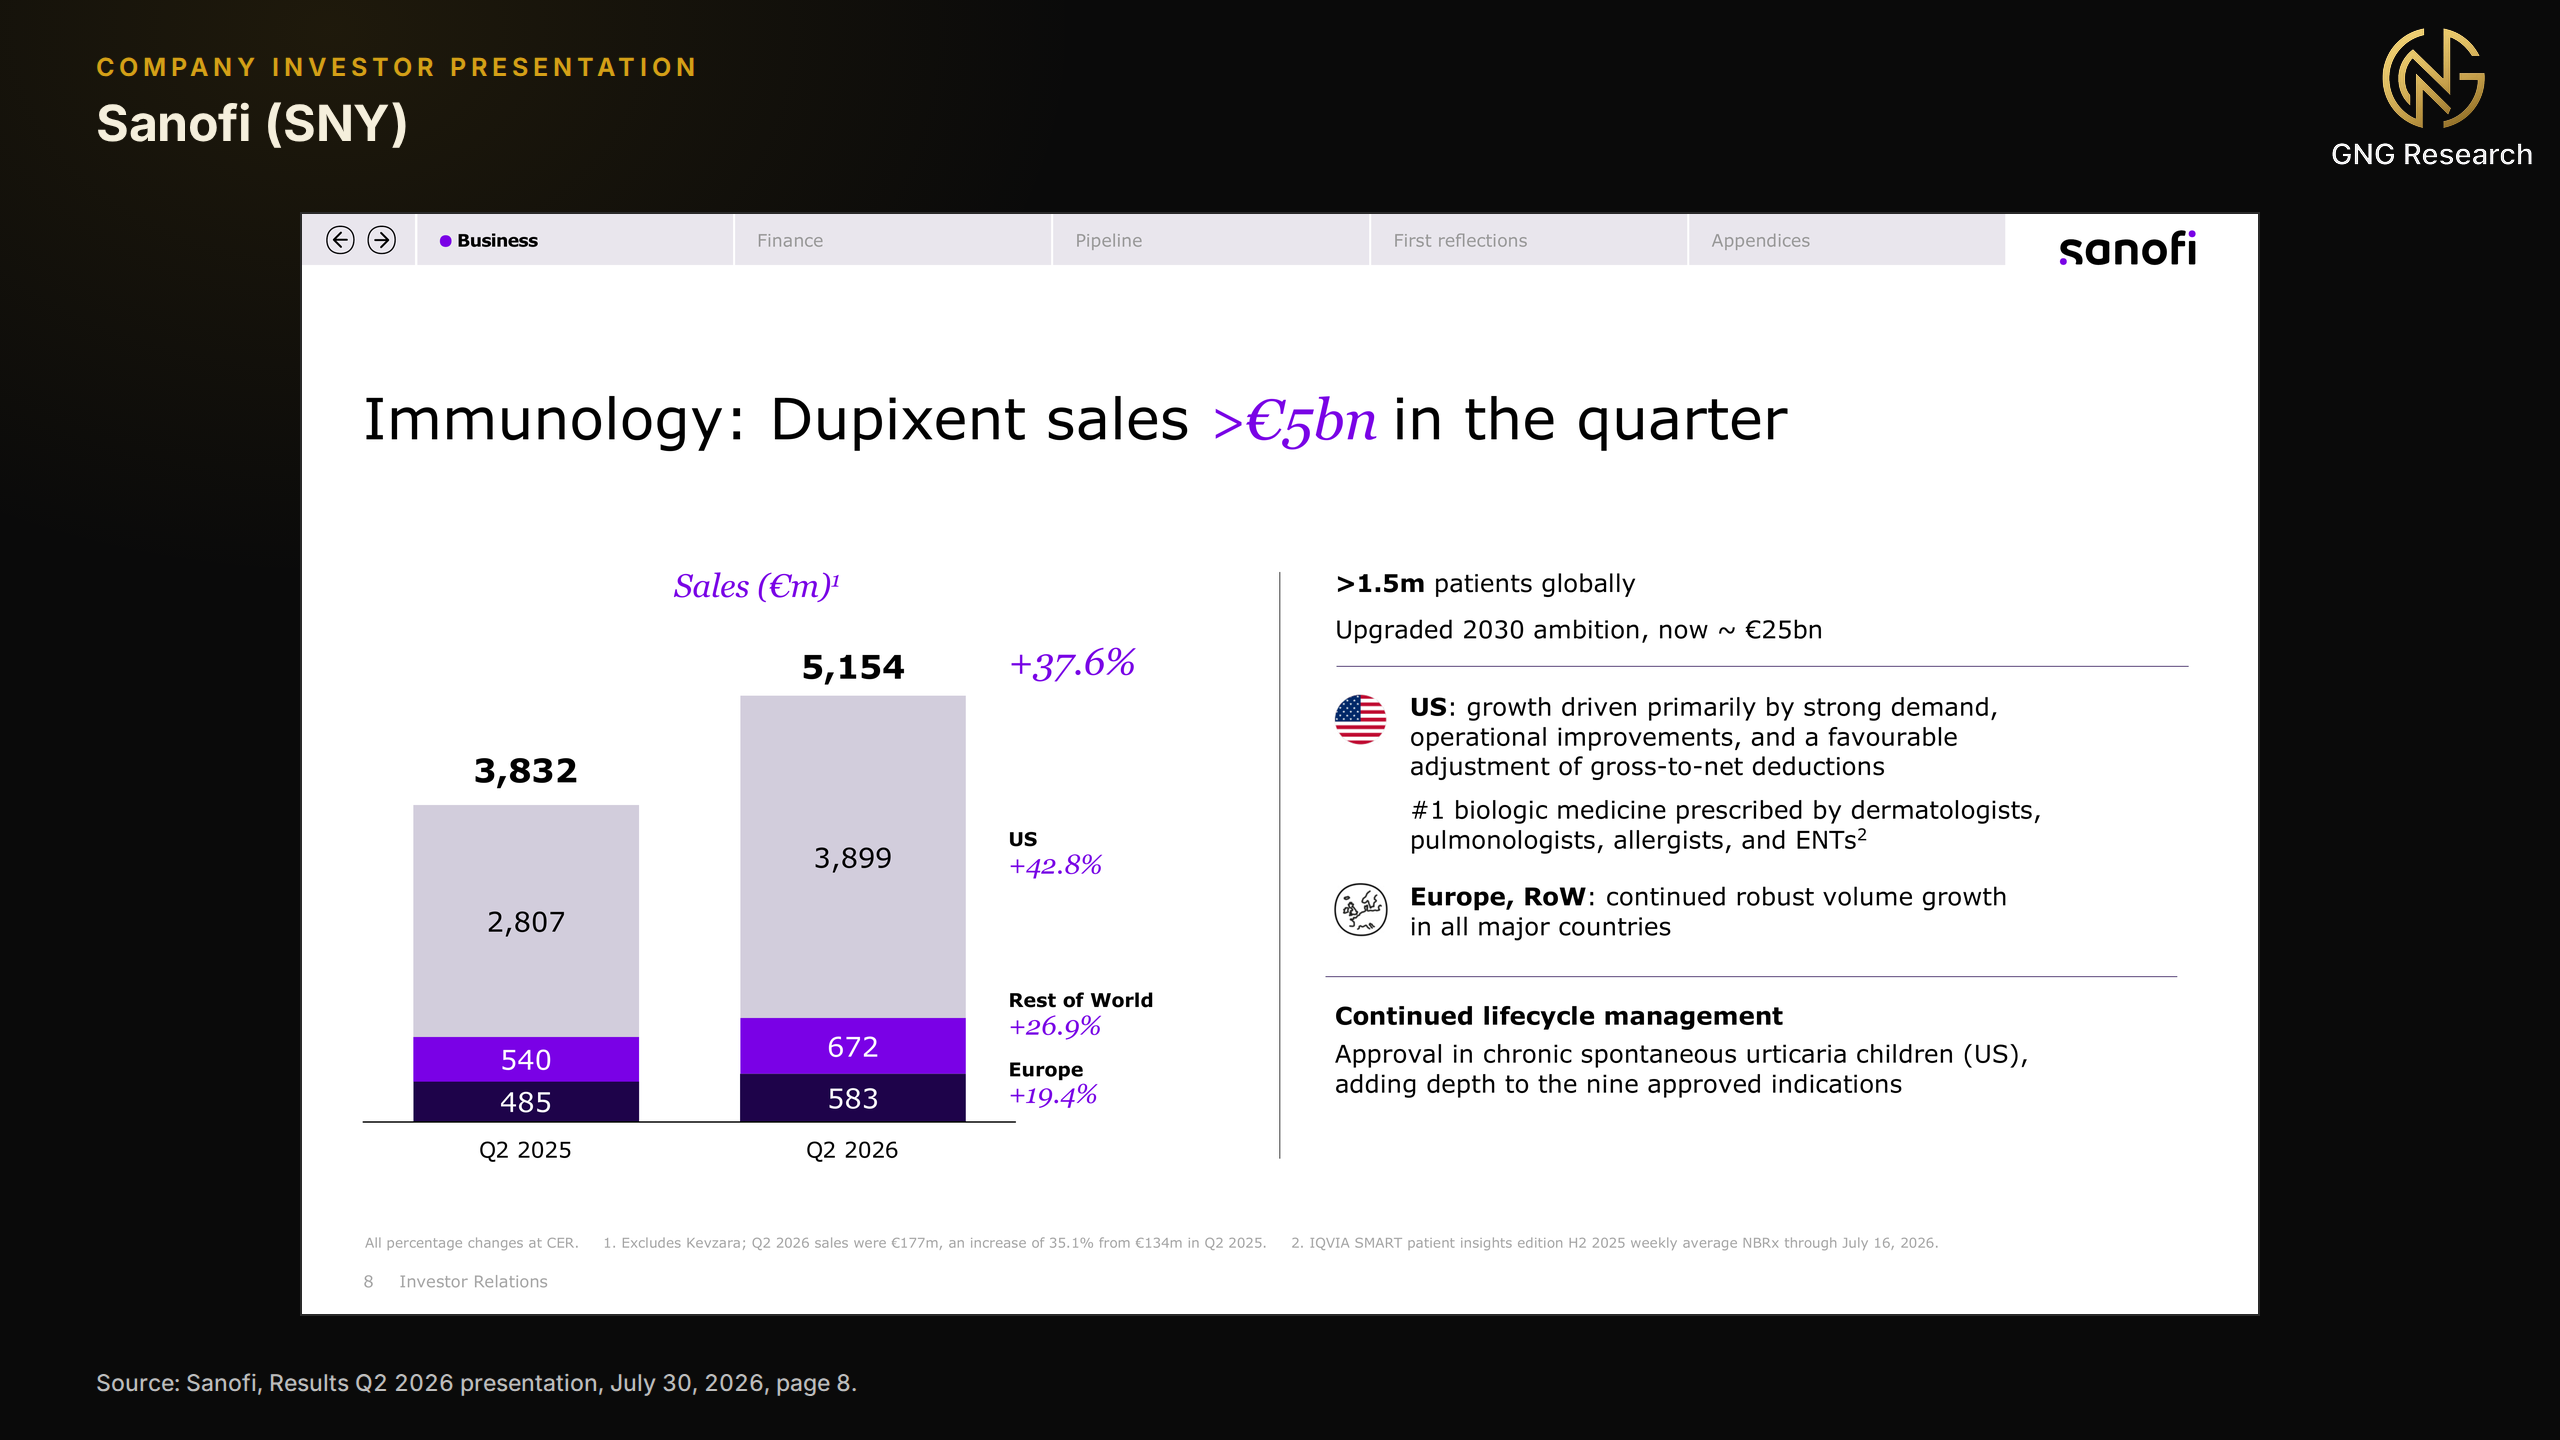
The company is stronger than the tape suggests. Dupixent crossed €5 billion of quarterly sales for the first time, up 37.6% at constant exchange rates, and management now targets about €25 billion for the drug in 2030, as Figure 7 shows. Launches added €1.3 billion, up 48%, and the 2026 outlook rose to sales growth of about 10% with business EPS slightly faster. Belén Garijo, chief executive since May, has stopped weak programs, amlitelimab in atopic dermatitis among them, and plans to swap 20 mature medicines for a 26.4% stake in Cheplapharm. New chief executives usually defend what they inherit, so an early cull is a rare kind of discipline, even with the €952 million amlitelimab write-down that came with it. The structural point holds, the specific levels will not.
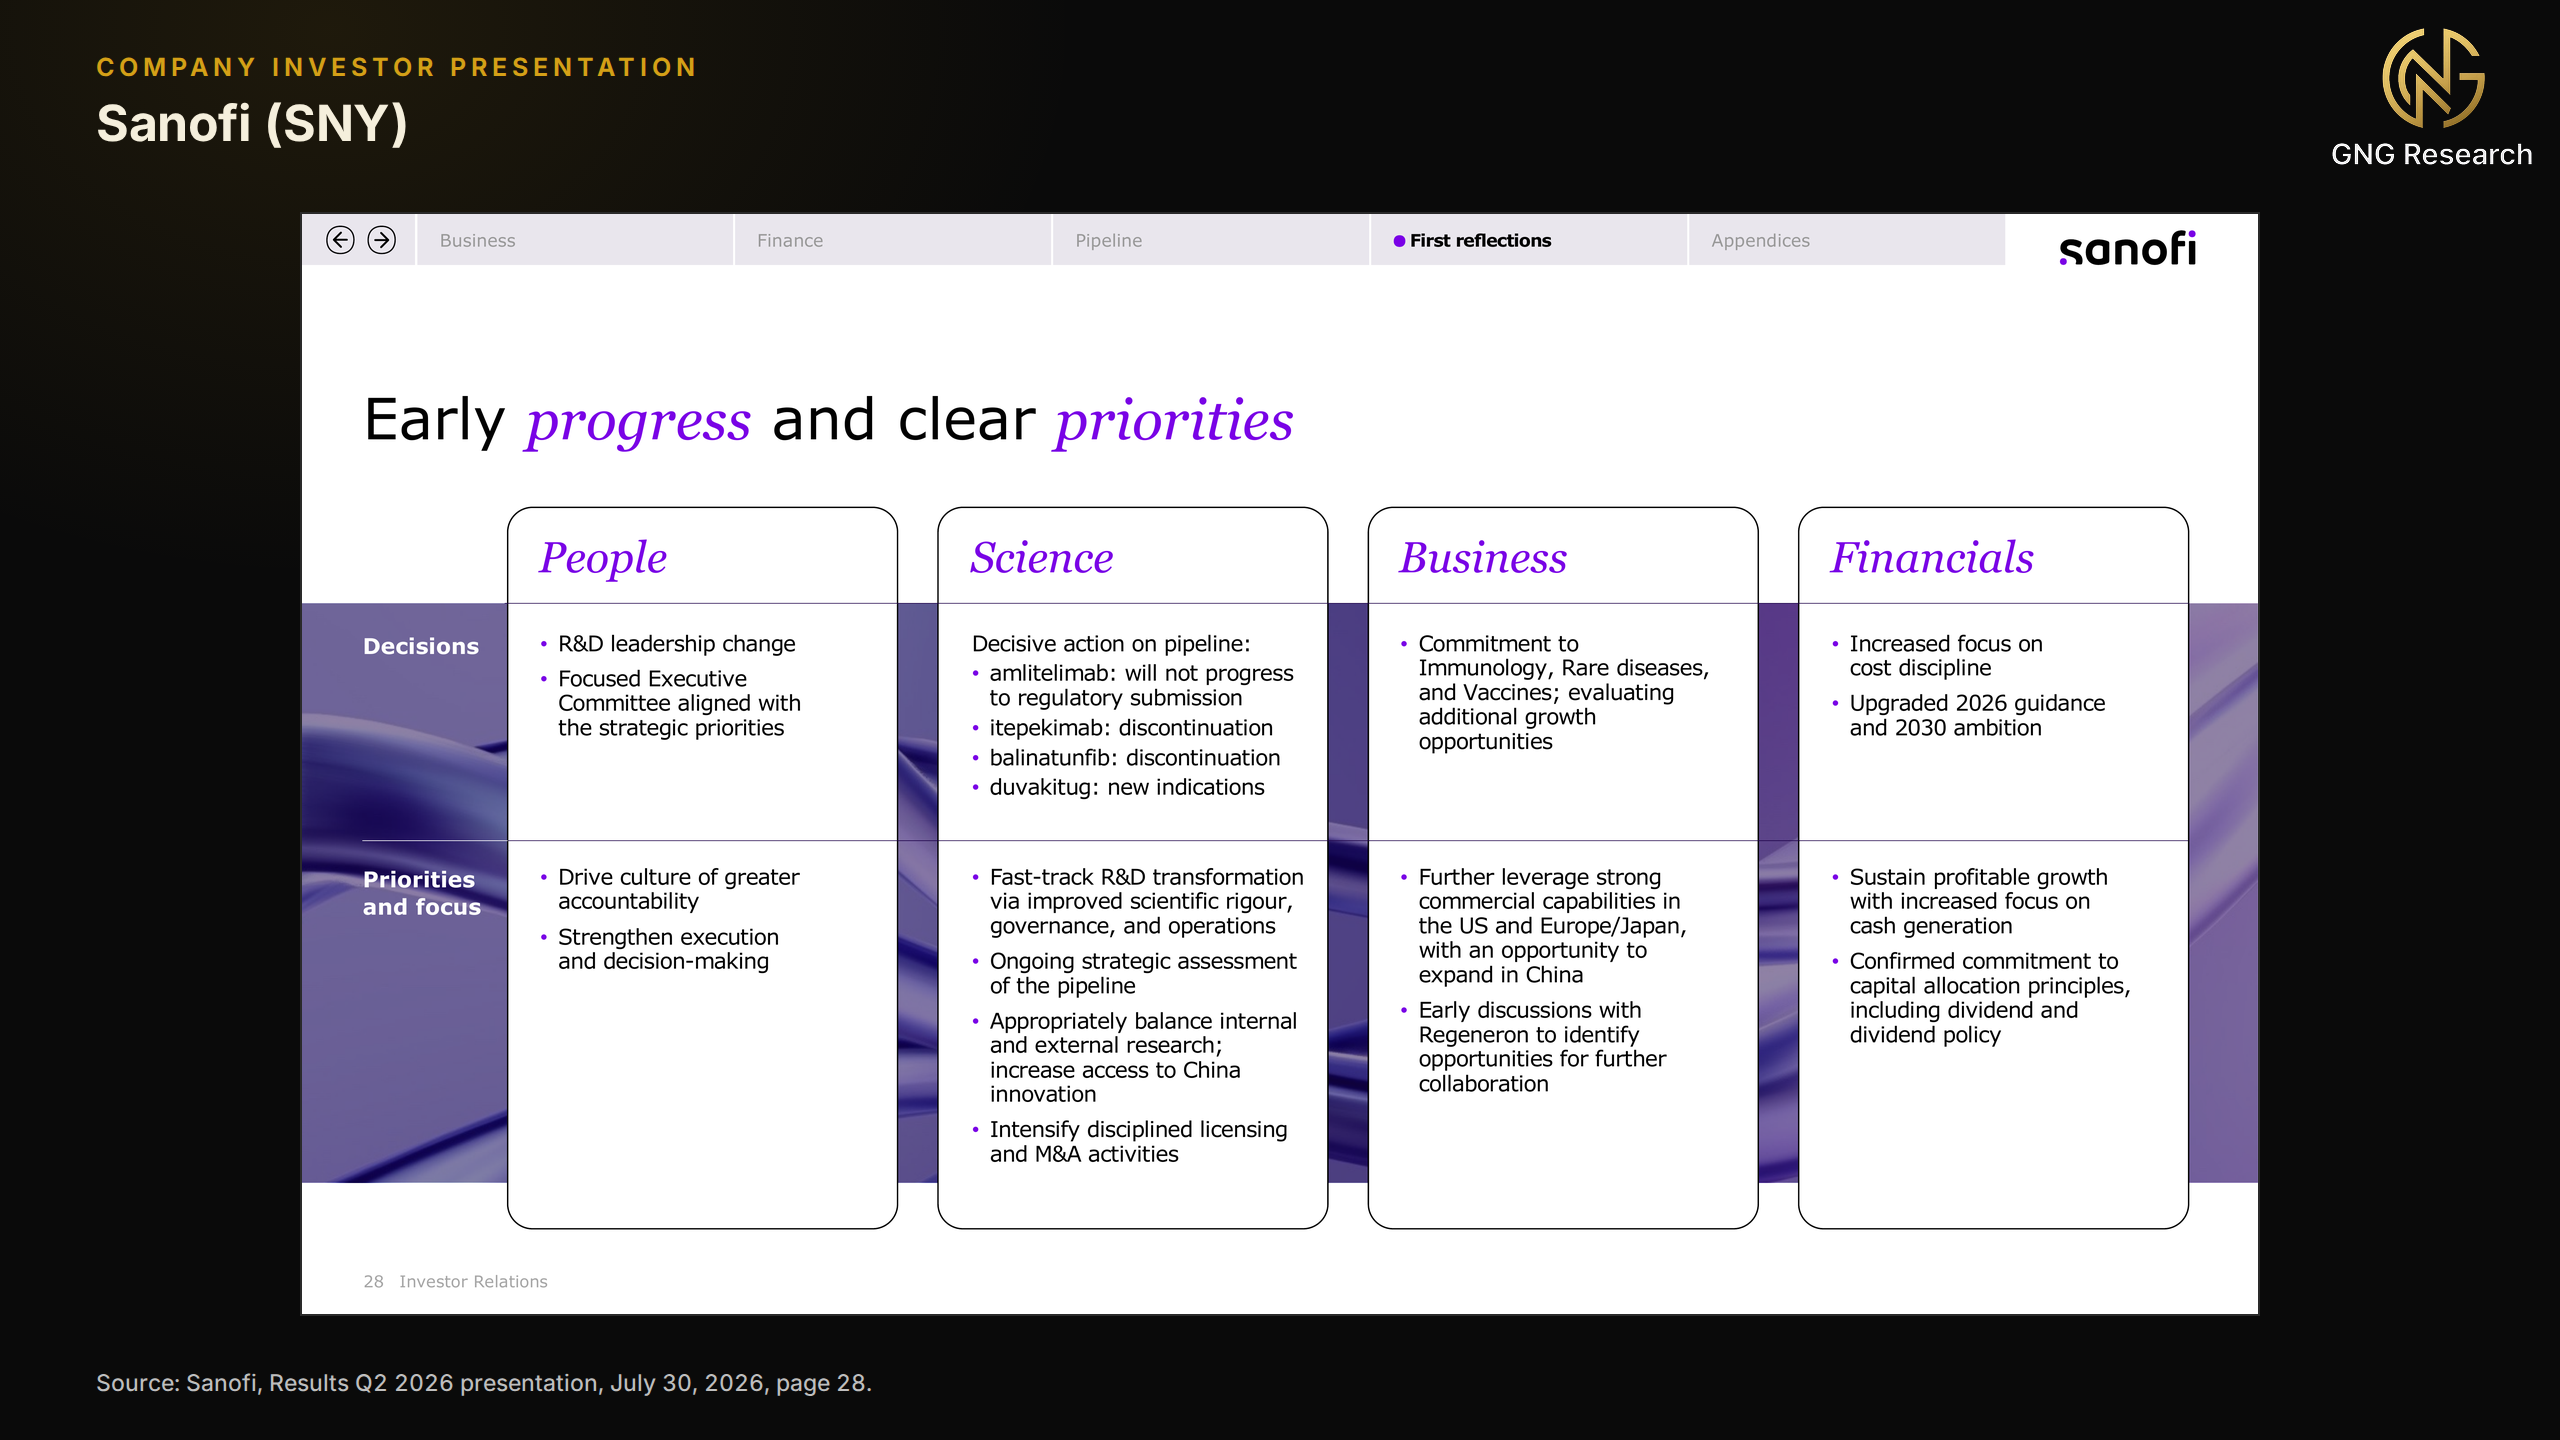
Coverage is wide on the sector's own yardsticks. The €4.12 dividend for 2025 is 53% of business EPS of €7.83, and the €4.9 billion paid in May 2026 used 61% of 2025 free cash flow of €8.1 billion. Ratings are AA at S&P and Scope and Aa3 at Moody's, all stable. Net debt of €15.5 billion at June 30 is about 1.0x this year's consensus EBITDA, and the €2.8 billion and €2.3 billion of debt due in 2027 and 2028 compare with roughly €8 billion of annual free cash flow and €8 billion of undrawn, covenant-free credit lines. The record is older than the currency it is paid in, with an increase every year since 1995 and 5.2% a year over the last five. Garijo restated the policy in her first results presentation, as Figure 8 shows, confirming "our commitment to the dividend and our dividend policy."
Each ADS is half an ordinary share, and the dividend is declared once a year in euros, €2.06 per ADS paid in June 2026, so the dollar yield moves with the exchange rate and US data can show a "cut" whenever the euro falls. At the current rate the €2.06 is worth $2.34, a 5.66% yield. France withholds 25% unless the holder files Form 5000 before payment to get the 15% treaty rate, the excess can be reclaimed later with Forms 5000 and 5001, and the tax is generally creditable against US federal income tax. Because roughly half of sales are in dollars, a weaker euro that trims the dividend in dollars also lifts the euro earnings that pay it. Regimes shift, and the relationship can break.
For large pharma my preferred methodology is price against business earnings, checked against free cash flow. On analyst consensus converted to dollars per ADS, Sanofi trades at 8.5x 2026 and 8.1x 2027 earnings, with a free cash flow yield near 9.3%. Its trailing 9.3x sits just above its ten-year low, against a median of 13.4x. Pfizer and Bristol-Myers, the market's usual patent-cliff penitents, trade at 9.5x and 9.0x forward earnings, AstraZeneca and Novartis at 15.4x and 16.0x. Consensus sees EPS of €8.52 in 2026 and €8.95 in 2027 from 26 analysts, then €9.76 in 2028 from 21, growth of 8.5%, 5.0% and 9.1%, with the dividend rising to €4.30, €4.53 and €4.83 and 2027 earnings revised down less than 1% over the past month. GNG's model value is $58.39, and most of its other valuation methods land between $42 and $65, all above the price. Wall Street is cooler, with a Buy consensus from ten analysts, half at Hold, and a mean target of $53.72, 30% above the close. History is never guaranteed to repeat.
What could go wrong
Dupixent is 42% of first-half sales, and management's hope of protection beyond March 2031 rests on later patents that biosimilar makers are likely to challenge. The pipeline must rebuild after a year of stops. The larger threat to income is ambition, since management plans to step up acquisitions and a large debt-funded deal would test the AA ratings. US pricing could bite harder if Medicare adopts most-favored-nation pricing or a new Congress revisits drug costs. The second quarter's one-off benefits are not expected to recur, and management expects slower growth in the second half.
The conservative bear case
Suppose the November 3 midterms bring the Democratic sweep prediction markets price at 63%, Congress carries most-favored-nation prices into Medicare, and the Fed keeps hiking as the 10-year Treasury nears 6%. Sanofi then misses in the third quarter, guides cautiously for 2027 in January, resets US Dupixent net prices lower, and sees its 2027 frexalimab readout in multiple sclerosis disappoint. Analysts cut 2027 business EPS estimates about 20%, to roughly €7.16, near the 2024 level, trim price targets, and two of the five Buy-rated analysts move to Hold, tipping the consensus to Hold as income funds sell.
I would then expect the ADS between $28 and $33, 20% to 32% below the September 30 close, the upper end holding today's depressed 8.1x on lower earnings and the lower end falling to 6.9x, Pfizer's trailing multiple at its April 2025 low. The dividend would yield 7.1% to 8.3%, recovering 18% to 28% of the decline in a year and 35% to 56% in two.
The thesis survives that range. The €4.12 dividend would absorb 58% of stressed EPS, free cash flow 20% lower would still cover the €4.9 billion bill 1.3x, and net debt near 1.2x stressed EBITDA leaves the AA ratings ample room.
The thesis breaks on different evidence. A cut or freeze of the euro dividend would end it, and the next proposal is due January 28, 2027. So would a dividend above 75% of business EPS, free cash flow below the roughly €5 billion dividend bill for a full year, net debt above 3x EBITDA after an acquisition, a downgrade into the single-A range at S&P or Moody's, or a US Dupixent biosimilar cleared to launch before March 2031. None is visible today, and this is the read on current data, not a forecast.
Hormel Foods (HRL)
At $19.95 on September 30, Hormel (HRL) trades near its lowest level since 2013, 64% below its April 2022 peak, and its $1.17 dividend yields 5.9%. The board has raised it for 60 consecutive years, and on the quarter's last day S&P and Moody's each cut the rating a notch over the $1.055 billion purchase of Brakebush Brothers. What I find compelling is that cash covers the payout, the balance sheet stays investment grade, and GNG's model value of $30.03 sits about 50% above the price while only three of ten analysts rate it a Buy or better.
An energy shock has been unkind to the grocery aisle. Consumer staples returned minus 2.3% in the third quarter and Hormel fell about 20%, leaving its yield about 60 basis points above the 10-year Treasury. In August management said fuel costs were at a wartime high and beef stayed expensive, with cheaper pork only starting to help. The company hedges diesel, natural gas, grain and lean hogs, and consumers, says chief executive-elect John Ghingo, "continue to prioritize food."
The company-specific problems look repairable. Foodservice has grown organic sales for twelve straight quarters, and management raised adjusted EPS guidance to $1.45 to $1.51, growth of 6% to 10%, even as retail volume fell 9% in the third quarter. Brakebush adds about $1.2 billion of mostly foodservice sales at 10.7x EBITDA, or 8.9x after $20 million of targeted synergies. It buys its chicken rather than raising it and sells through a mix of fixed-price, cost-plus and pass-through contracts, and S&P called the deal "strategically sound" in the report that lowered the rating, a rare downgrade that doubles as an endorsement. Regimes shift, and repairs can stall.
On the sector's measures, free cash flow and adjusted earnings, the dividend is covered. In the year to July 26, 2026, free cash flow of $781 million covered $641 million of dividends 1.22x, and the $1.48 midpoint of adjusted EPS guidance covers it 1.26x. The GAAP payout near 188% reflects one-off charges such as the $56 million loss on exiting Brazil. The blemish is fiscal 2025, when an inventory build left free cash flow at 84% of the dividend. S&P expects free operating cash flow of about $720 million in each of fiscal 2026 and 2027, against dividends of $642 million and $648 million.
Net debt was 1.5x adjusted EBITDA in July. Management expects the low 2x range at closing, above its 1.5x to 2.0x target, and a return to that range within fiscal 2027, and the company's own chart in Figure 9 shows it did the same after buying Planters.
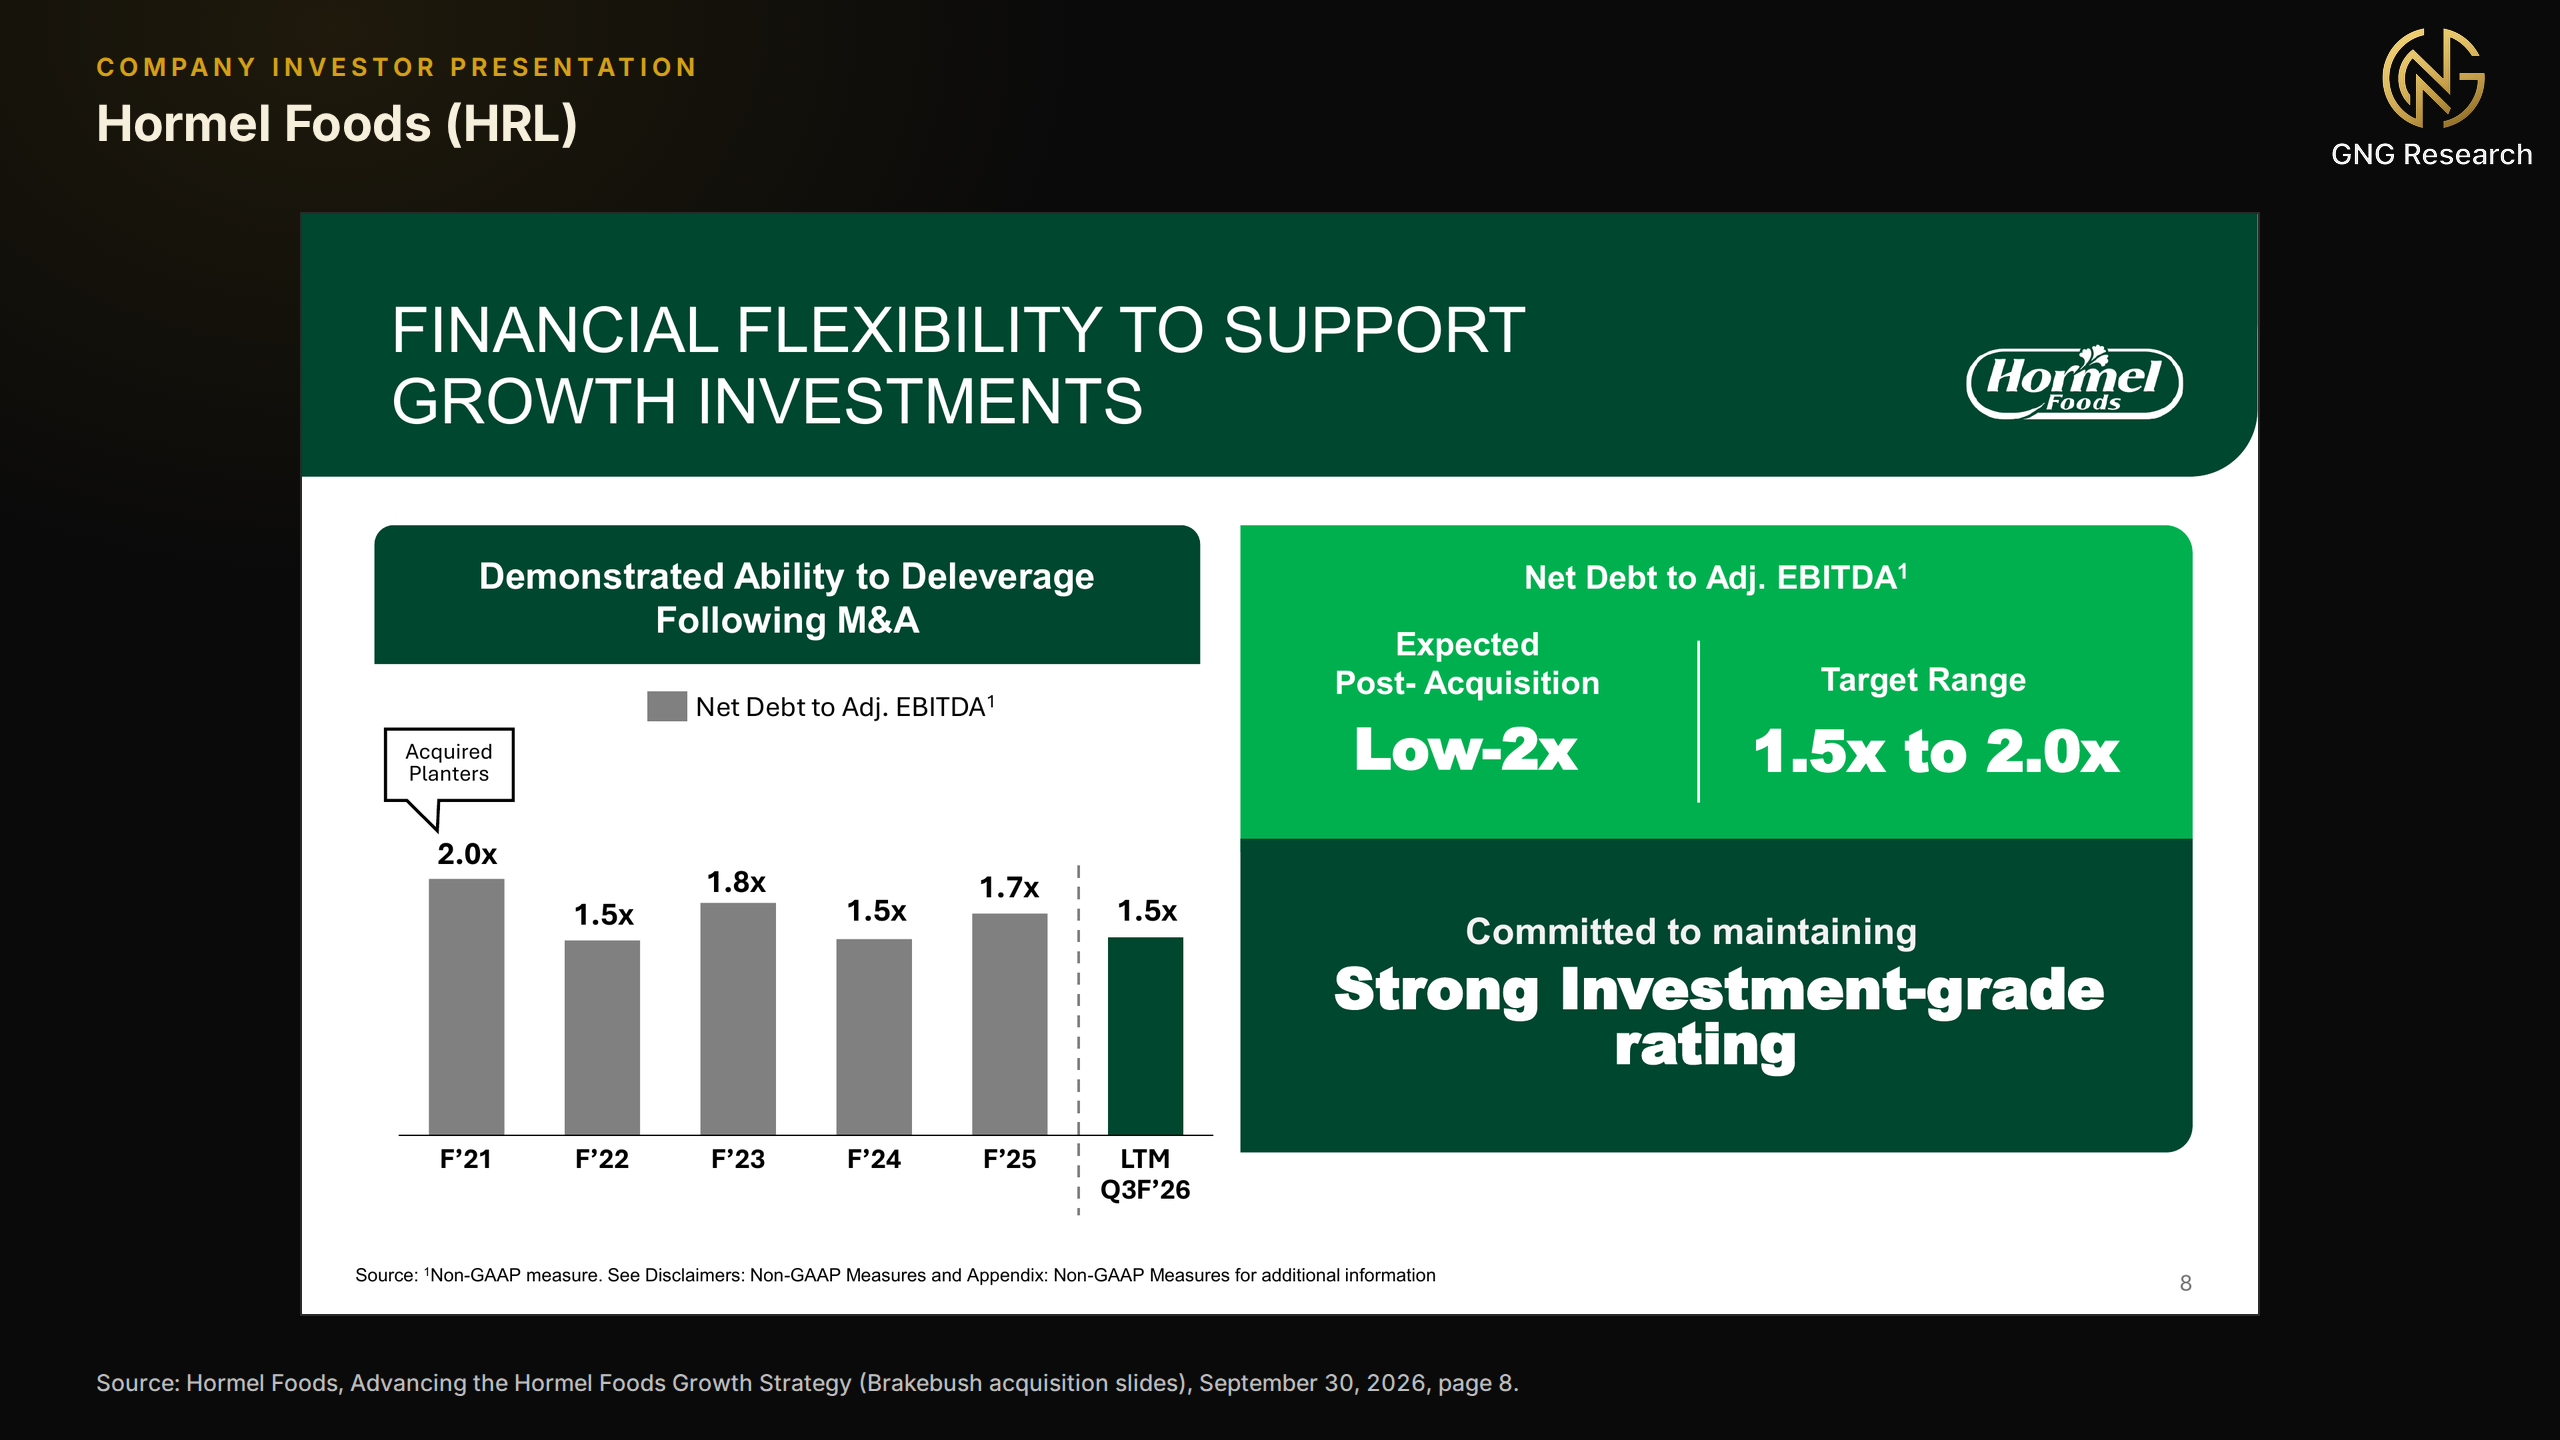
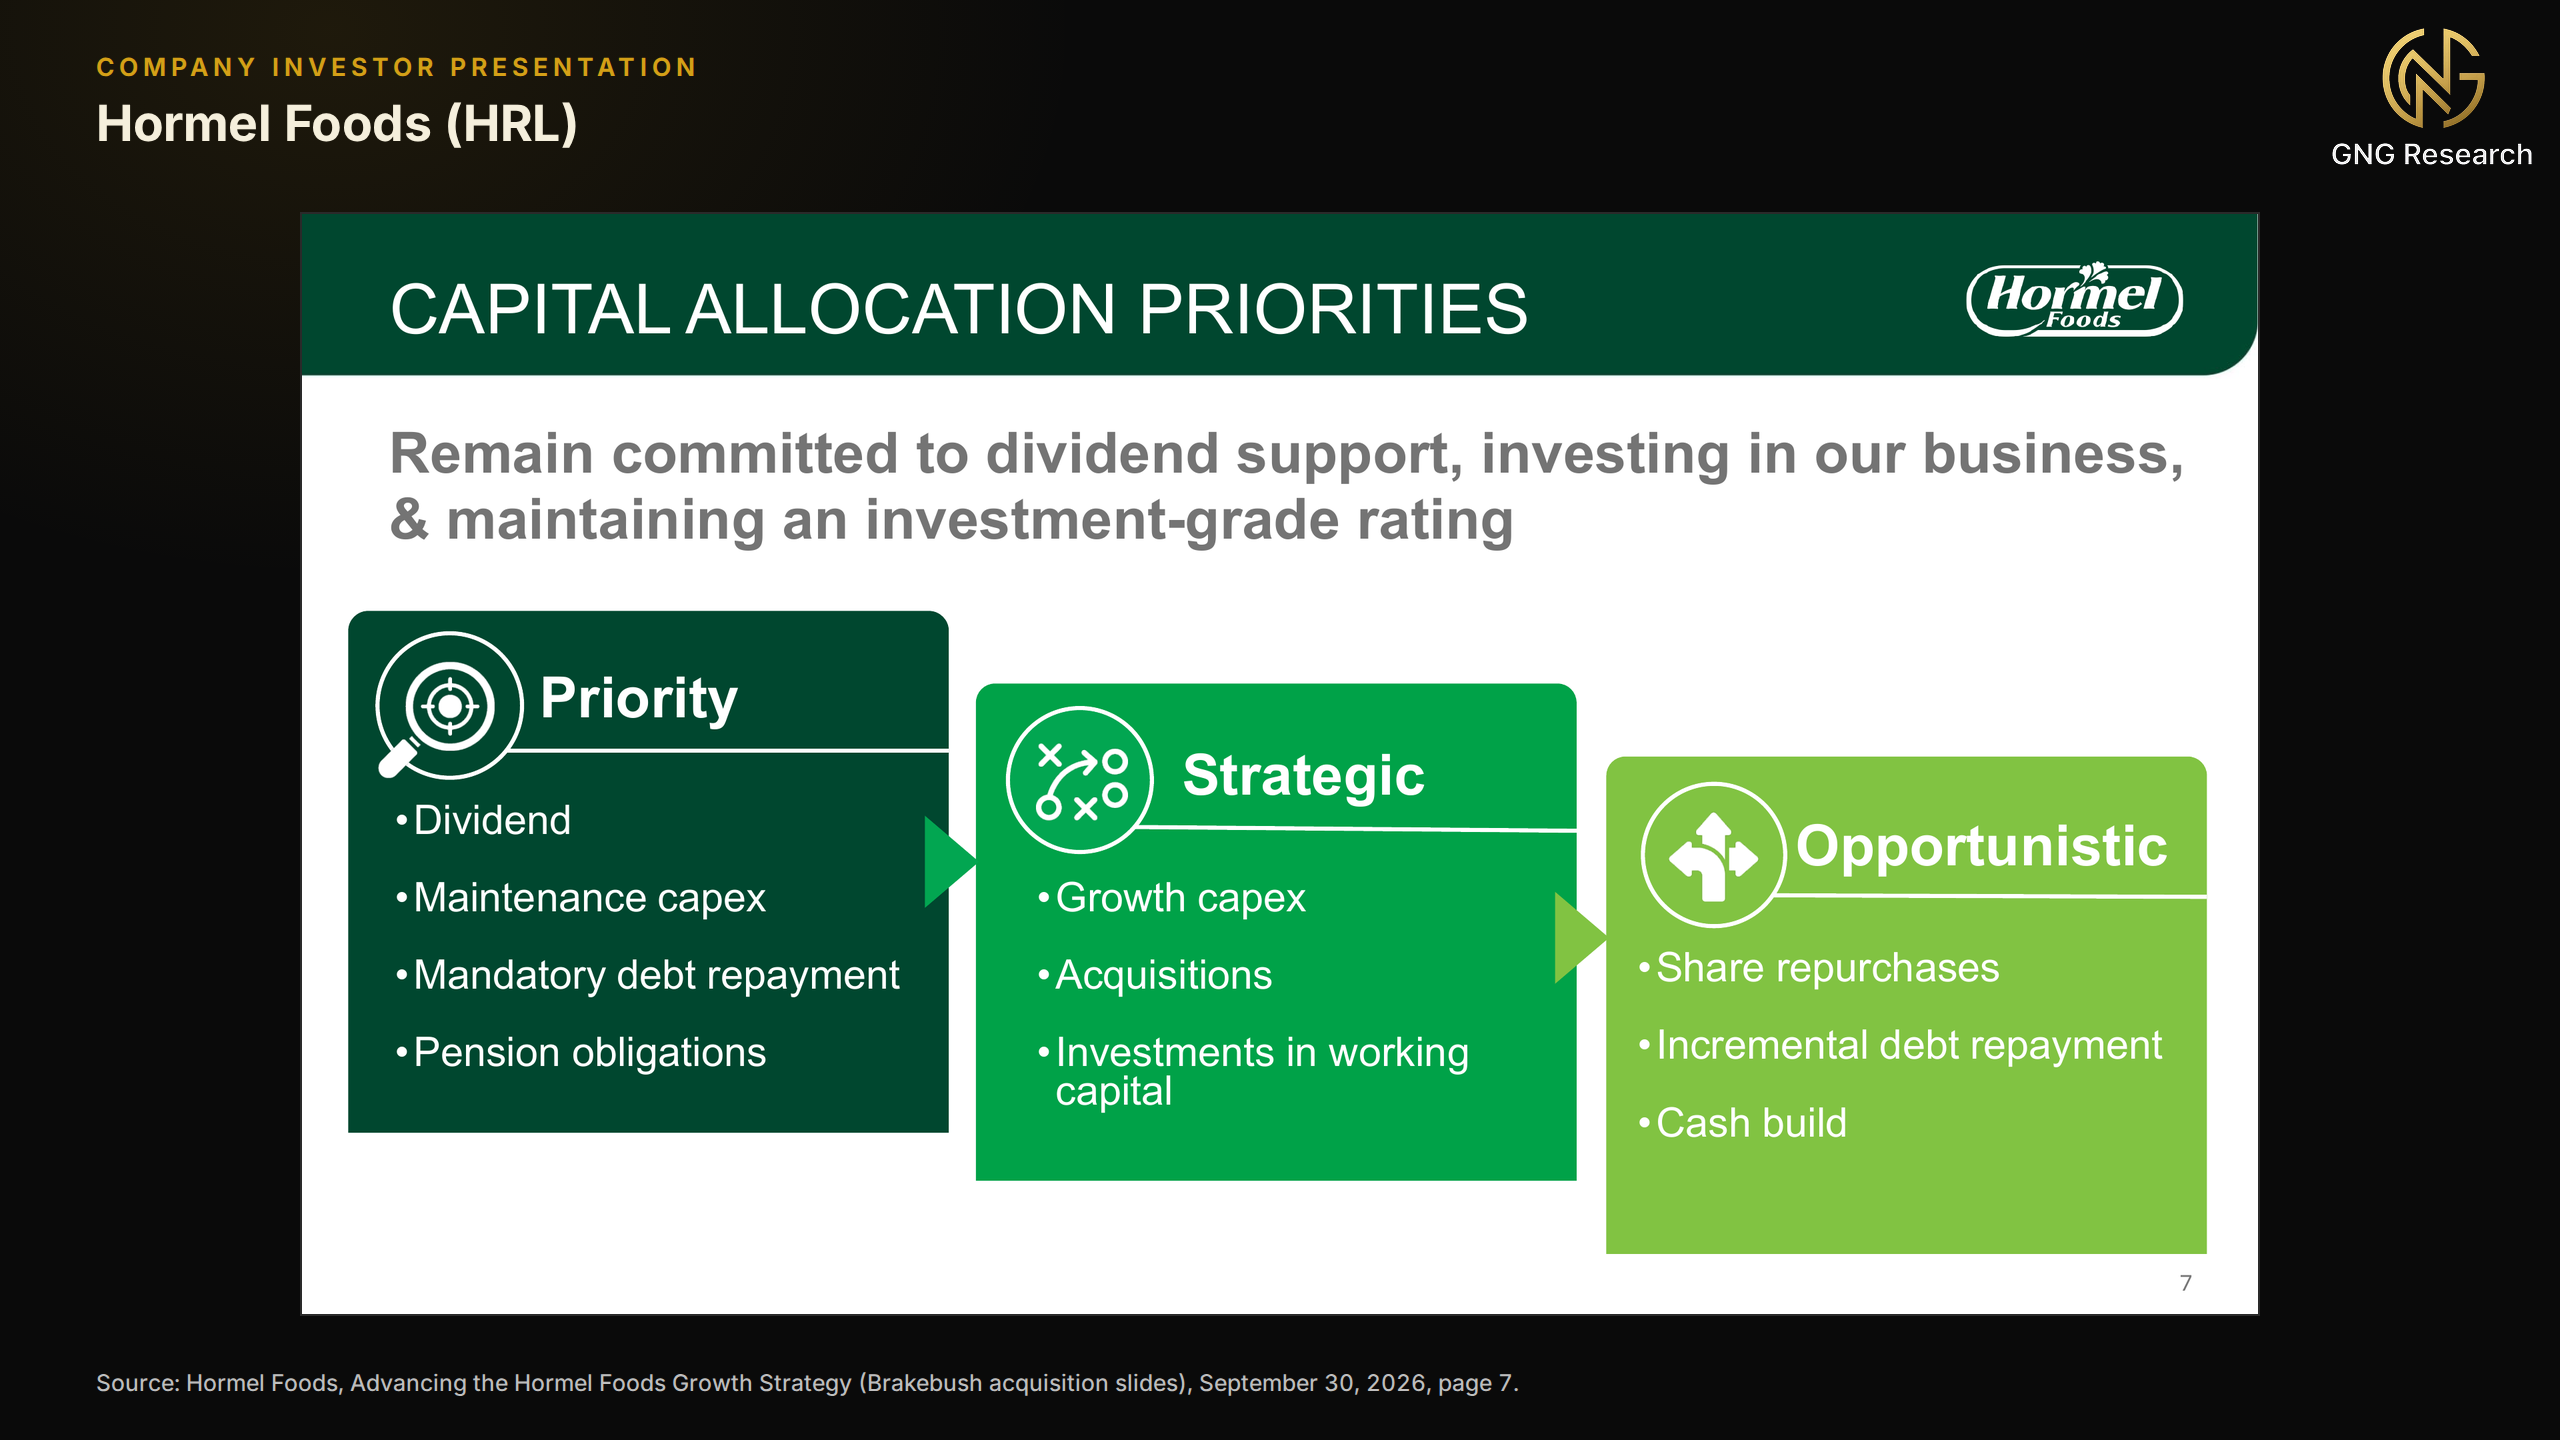
S&P is less brisk, at 2.3x in fiscal 2027 and 2.1x in fiscal 2028 on its own basis, and Moody's puts pro forma leverage at 2.8x. S&P calls liquidity adequate, with $840 million of cash and an undrawn $750 million revolver against $1.25 billion of notes due within 24 months. The 10-K confirms the streak, the Hormel Foundation owns 46.6% of the shares, and the Brakebush presentation lists the dividend first among its priority uses of cash, as Figure 10 shows.
The fiscal 2026 increase was a quarter of a cent per quarter, enough to keep the streak alive without pretending to be generosity. Growth looks set to stay modest while debt falls, but on these cash numbers the payment looks secure. The structural point holds, the specific levels will not.
Hormel is cheap against its own history on earnings and free cash flow. The shares trade at 13.2x the fiscal 2026 consensus of $1.51 and 12.5x the fiscal 2027 figure of $1.59, the more useful year since fiscal 2026 ends October 25, with $1.70 for fiscal 2028, growth of about 6% a year, flat 30-day revisions and dividend estimates of $1.18, $1.20 and $1.25. The trailing P/E of 13.8x on September 25 was a ten-year low against a median of 19.7x, the 7.1% free cash flow yield compares with a ten-year median of 4.3%, and enterprise value is 9.8x trailing adjusted EBITDA and 9.0x fiscal 2027 consensus. The discount is to Hormel's past rather than to the aisle, where Kraft Heinz, General Mills, Smucker, Campbell's and Conagra trade at 9.2x to 11.2x forward earnings. The consensus also predates Brakebush.
GNG rates the stock a Strong Buy with a model value of $30.03, 50.5% above the close, from its forward P/E method, which applies the stock's five-year median multiple to forward earnings, and its other multiple methods span $27.64 to $33.06. The upside depends on the multiple recovering toward its own history. Wall Street is lukewarm. Two analysts rate it a Strong Buy, one a Buy and seven a Hold, an average of exactly 3.50, the lowest score that still reads as Buy, with a mean target of $26.12, 30.9% above the close. I count that ambivalence as part of the opportunity, since a stock nobody is excited about has little enthusiasm left to lose. That is a judgment, not a forecast.
What could go wrong
Brakebush debt will cost 2026 rates, and S&P could cut again if leverage does not settle in the low 2x range. Freight, beef and turkey costs can outrun pricing, retail volumes are already falling, and the consumer is strained. Campbell's cut its dividend 36% on September 3 to pay down debt, a reminder that yields in this aisle guarantee nothing. A new chief executive and finance chief inherit all of it at once.
The conservative bear case
Suppose Gulf shipping attacks escalate, Brent nears Goldman's $120 case, diesel stays above $6, the Fed hikes in December and the 10-year Treasury nears 6% as strained consumers trade down. Hormel's fiscal 2027 outlook then disappoints as freight, beef and turkey costs outrun pricing, retail volume falls and the Brakebush debt prices near 6%. Analysts cut fiscal 2027 EPS 8% to 19%, to $1.29 to $1.46, and cut targets. One Buy-to-Hold move tips the consensus to Hold, S&P turns its outlook negative, staples funds see outflows, and the shares fall to the five peers' median of 10.5x forward earnings.
The high end takes the most bearish analyst's pre-deal $1.54 less 8 cents of after-tax interest on S&P's projected $930 million debt increase at the 5.97% investment-grade yield, crediting Brakebush with nothing. The low end adds a repeat of fiscal 2025's 8.6% EBITDA decline, another 18 cents. The shares would trade between about $13.50 and $15.30, 23% to 32% below the September 30 close, yielding 7.6% to 8.7%, with earnings covering the dividend 1.10x to 1.25x. A separate cash test, the same decline on S&P's fiscal 2027 base, leaves free cash flow of about $617 million, $31 million short of the dividend for a year, with company-defined leverage near 2.4x. The thesis survives because earnings still cover the payout, cash absorbs a one-year gap as in fiscal 2025, and one more notch keeps the rating investment grade.
It breaks if the board cuts the $0.2925 quarterly rate or skips an annual increase, if free cash flow trails the dividend two fiscal years running, if company-defined net debt exceeds 2.5x adjusted EBITDA at fiscal 2028 year-end, if either agency cuts two more notches to BBB- or Baa2, or if adjusted EPS falls below the $1.17 dividend. This is the read on today's data, not a forecast.
LKQ Corporation (LKQ)
(LKQ) distributes the parts that put damaged and worn cars back on the road in North America and Europe. At the September 30, 2026 close of $22.83 it yields 5.26% on a $0.30 quarterly dividend that even its reduced free cash flow guidance covers about 2x, and would still yield 5% at $24.00. The shares are down 24% this year after a troubled software conversion in Germany and a cut to guidance. What I find compelling, and why I would own it today, is that the damage is concentrated, identified and repairable, while the price treats it as none of those things.
The regime is unkind to consumer cyclicals. The consumer discretionary sector lost 7.0% in the third quarter as gasoline reached $4.45 and consumer confidence fell to its lowest since 2014. The label fits LKQ only loosely, because most of its revenue comes from repairs that insurers pay for or drivers cannot postpone. Auto insurance prices fell year over year in May and June, and carriers defending margins specify cheaper alternative parts, whose usage hit a record above 40% in the second quarter.
In the micro story, North America, 41% of 2025 revenue, grew organically in the second quarter for the first time in nine quarters even as repairable claims fell 1% to 3%. Europe, 46% of revenue, shrank 12.6% organically, and management blames about $140 million of lost revenue and $50 million of EBITDA in the quarter on a new ERP system in Germany. A self-inflicted wound is, conveniently, one a company can treat itself. Germany was above 85% of its normal run rate by late July, with 100% targeted by year-end. Having sold Self Service and put Specialty up for sale, the board is reviewing alternatives including a sale of the company, which management calls active with "multiple parties". Repairs can stall, and this one is not finished.
For a distributor, the right test is free cash flow, and in 2025 LKQ paid $310 million of dividends from $847 million of it, 37%. Even the $625 million to $775 million range management guided to after July's cut covers the roughly $304 million annual dividend 2.1x to 2.6x, as Figure 11 shows.
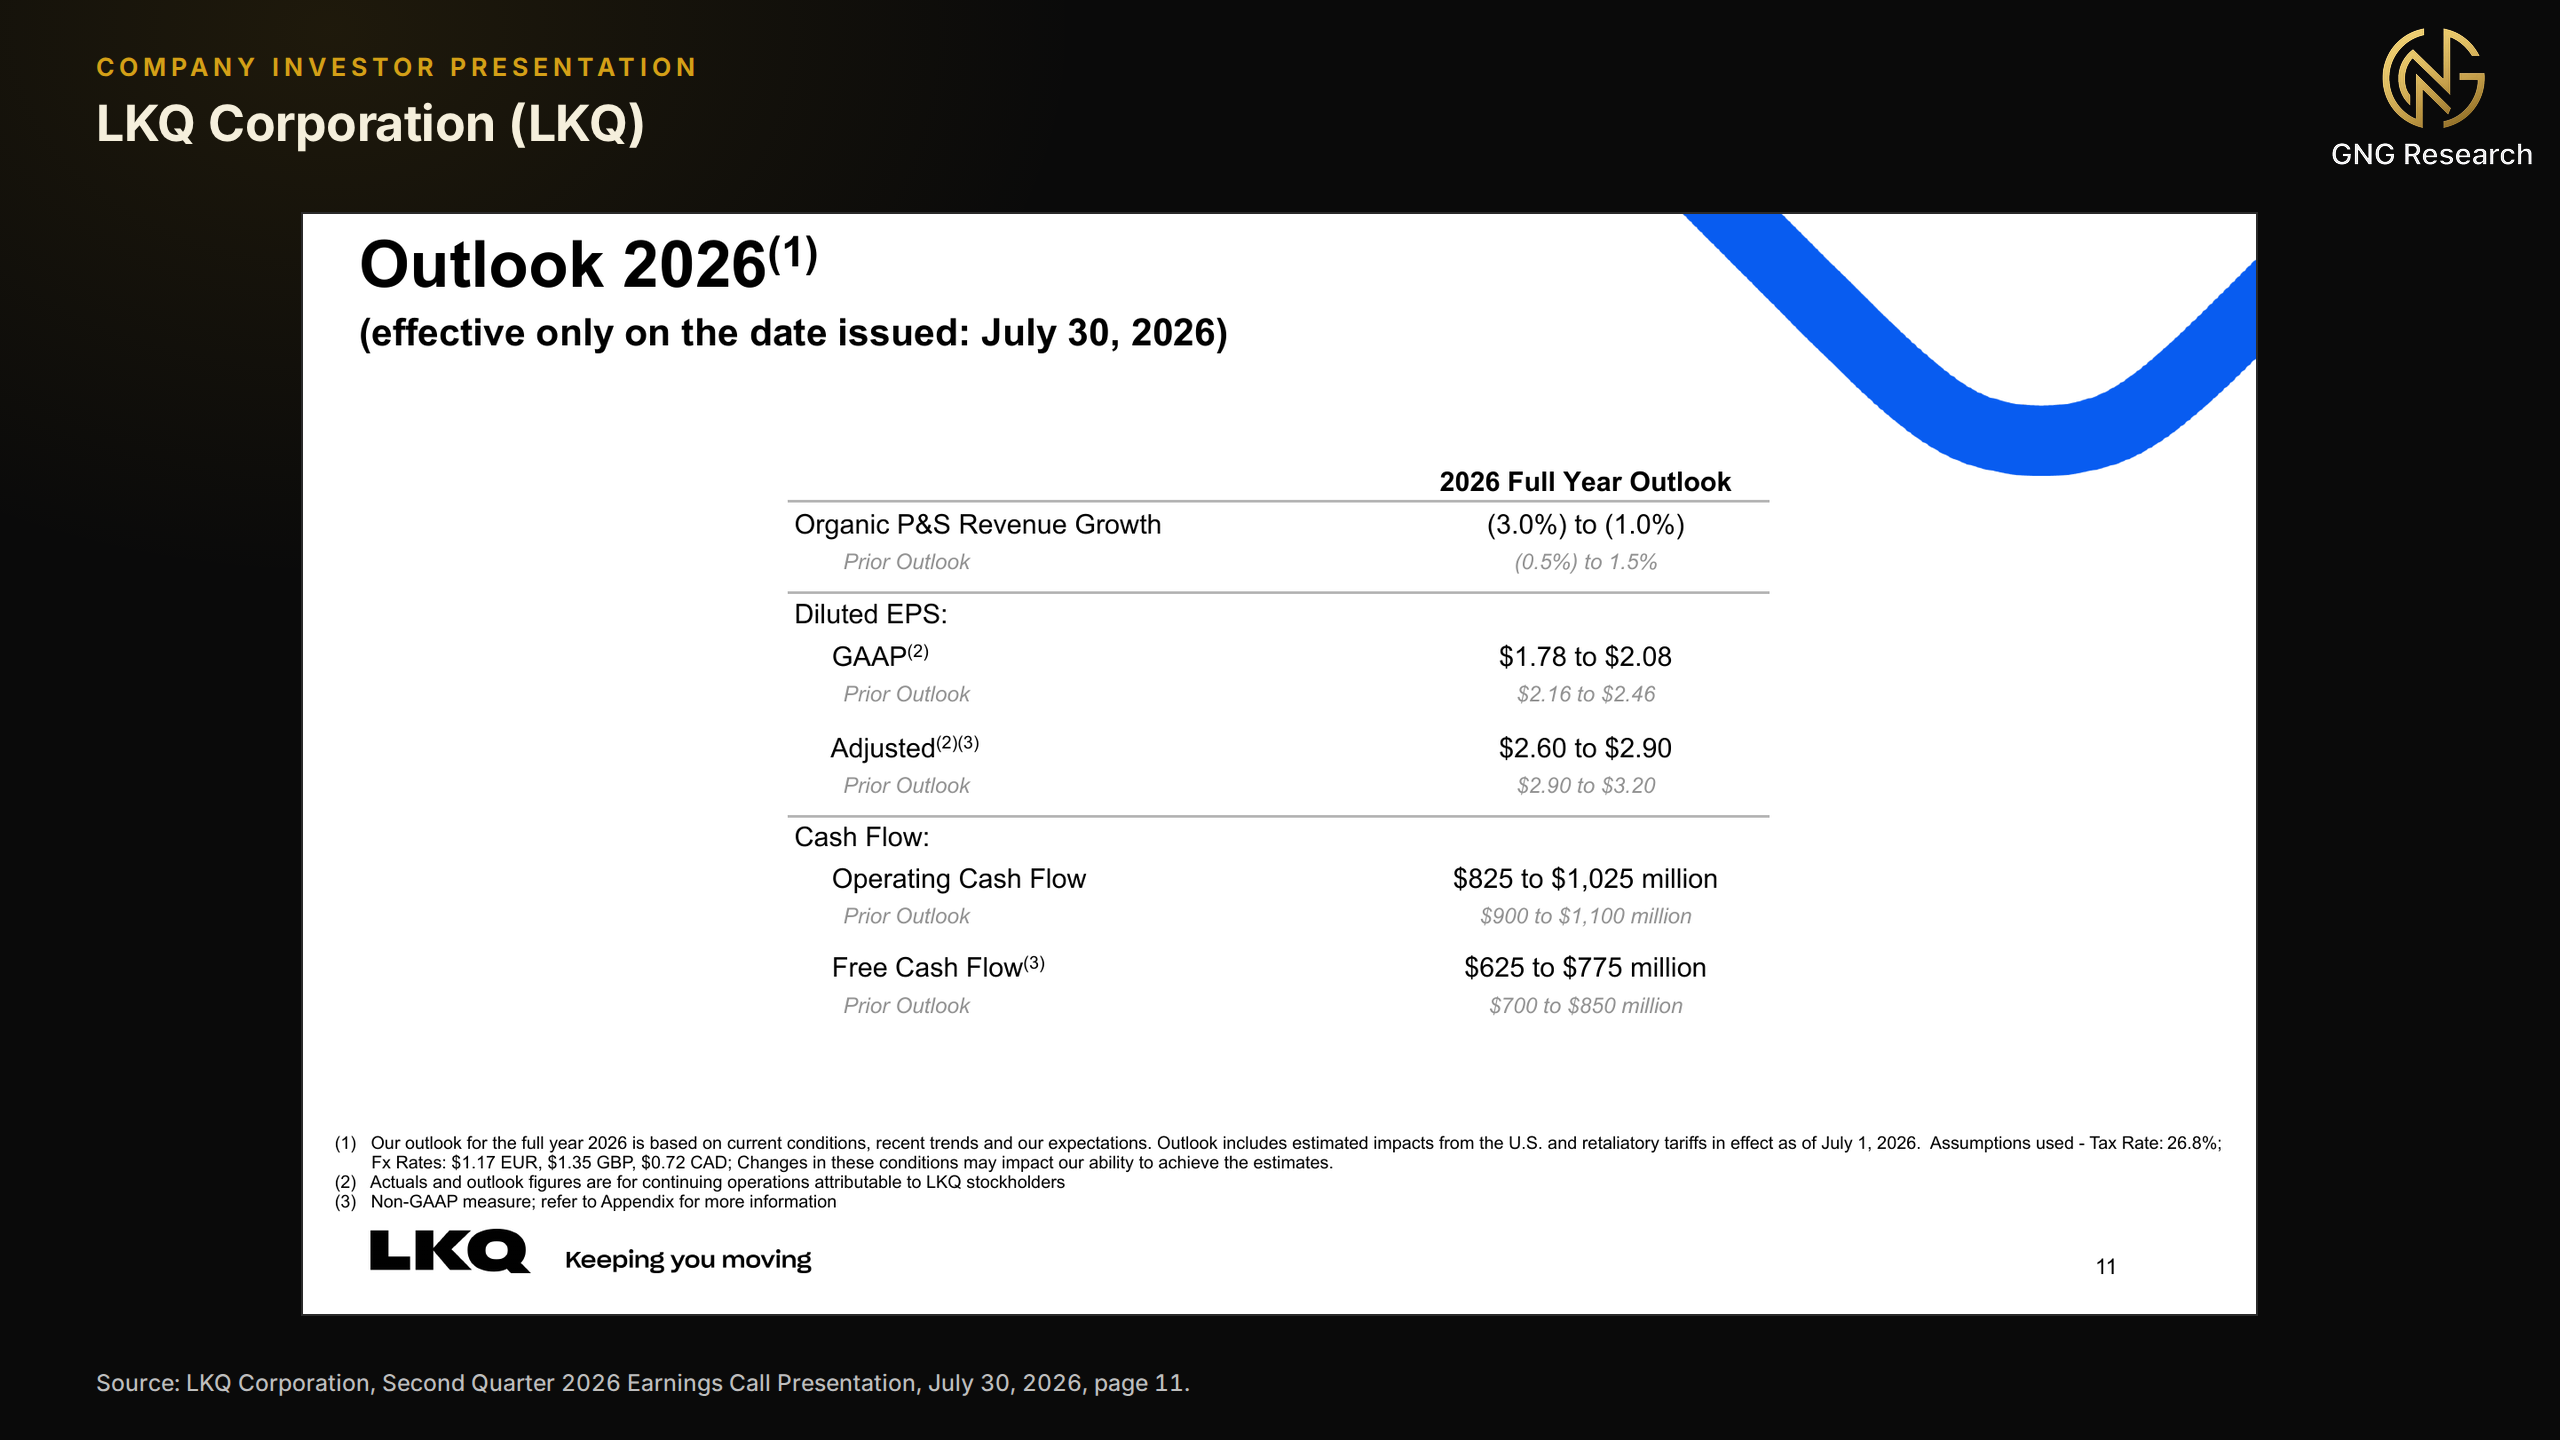
First-half free cash flow was negative $36 million as Europe weakened and payables fell $288 million, cutting trailing coverage to about 2.0x. Cash generation is seasonal, and the second half of 2025 produced $661 million, exactly what the guidance floor requires. The board declared the latest $0.30 on July 28 with that half in hand.
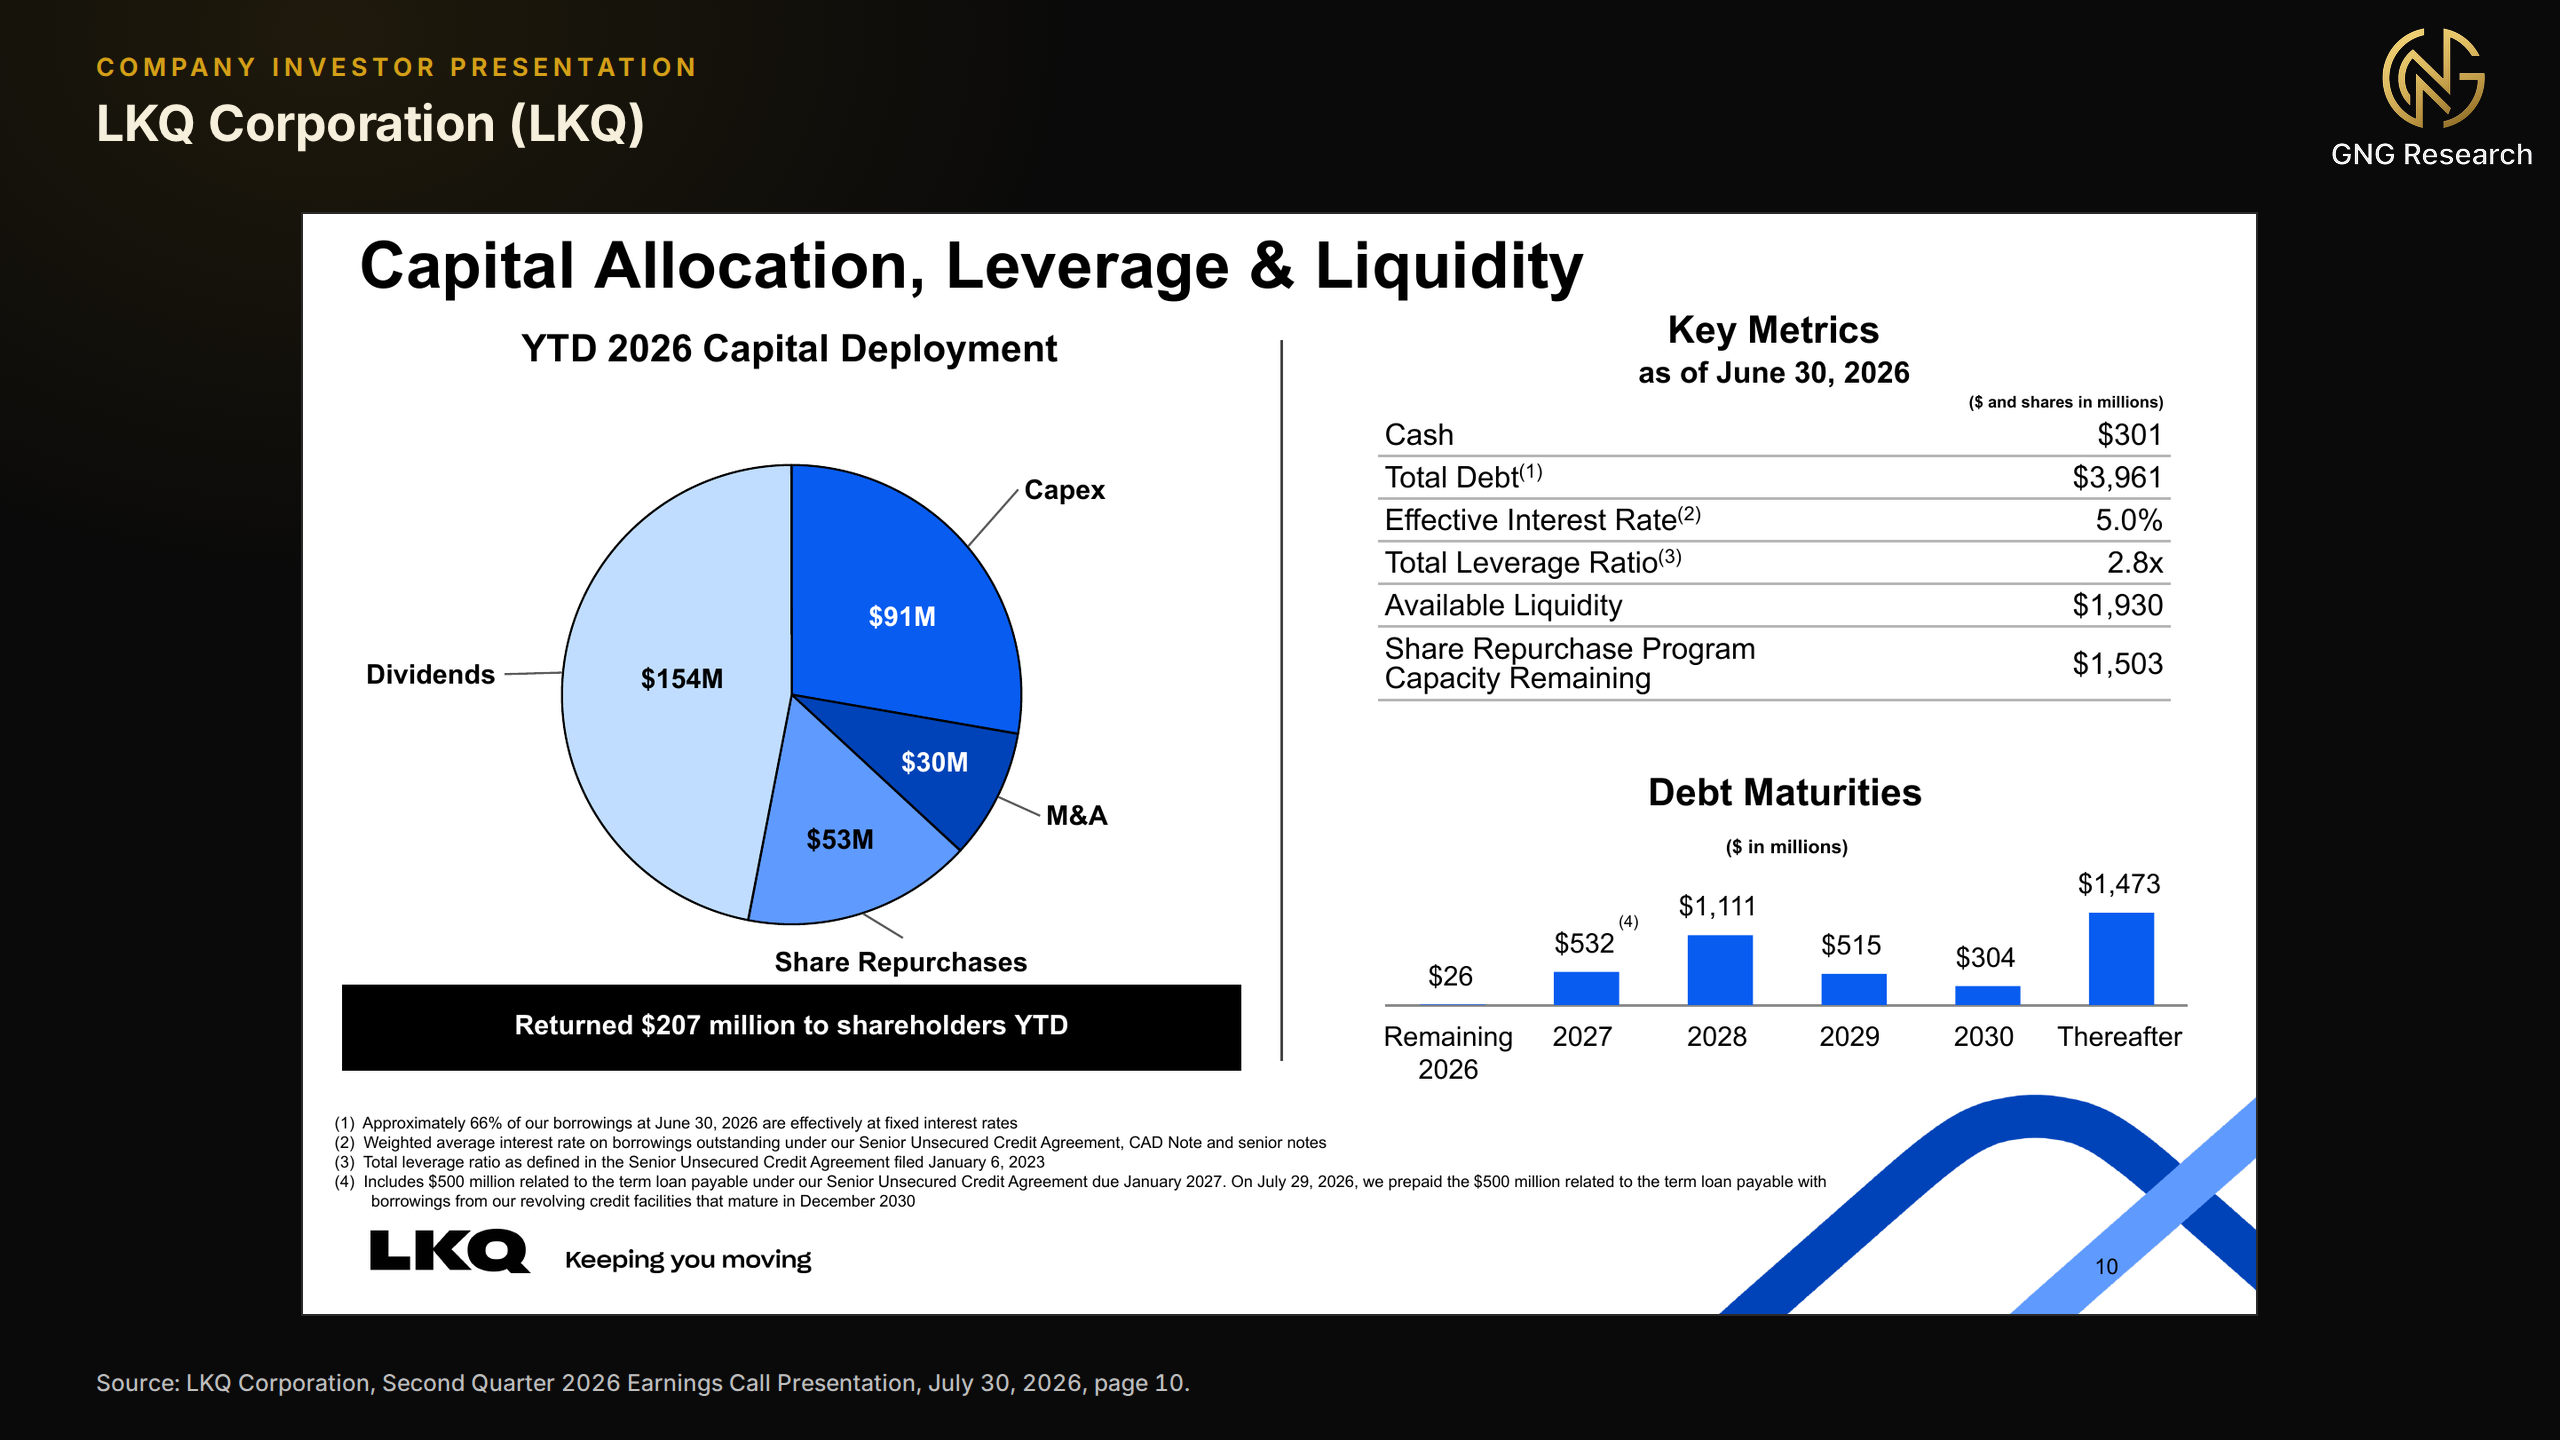
All three agencies rate LKQ investment grade: BBB- at Fitch and, as last set in 2022, BBB- at S&P and Baa3 at Moody's, the lowest rung but a rung nonetheless. As of June 30, debt was $3.96 billion, liquidity $1.93 billion before July's refinancing, and leverage 2.8x EBITDA against a 4.0x covenant. After July's move of a $500 million term loan onto the revolver, which runs to December 2030, nothing significant matures before April 2028, and dividends were the largest use of cash in the first half, as the company's own chart in Figure 12 shows.
The record is short but clean, with 20 quarterly payments since the first $0.25 in December 2021, two raises to $0.30 by November 2023, and no cut. That short record and interest coverage hold GNG's safety score to 62.8, while the payout scores 89.7. The analyst consensus is about $1.21 a year through 2028. The screen's minus 0.8% compares fiscal 2026 with fiscal 2025, and the following year's estimate is flat, so the estimates do not imply a cut from the current $0.30 quarterly payment. The payout remains the board's decision each quarter.
Distributors carry very different debt loads, so the sector is judged on enterprise value to EBITDA and forward earnings. LKQ trades at 6.7x trailing EBITDA and 6.0x the 2027 consensus, and at 8.4x and 7.4x consensus earnings of $2.71 for 2026 and $3.07 for 2027, with a 12.1% free cash flow yield on the guidance midpoint. Its aftermarket peers, Genuine Parts, Advance Auto Parts, AutoZone, O'Reilly and Dorman, trade at 13x to 26x forward earnings, the last three at 10x to 18x EBITDA, and LKQ's own trailing median since 2018 is 12.9x earnings. The market prices LKQ as though its German warehouses will never find their parts again.
GNG rates the stock a Very Strong Buy, the close 1.1% under that tier's price, on a model value of $39.63, 74% above the close, blended from five methods (forward and trailing earnings, sales, free cash flow and book value) valued between $33.15 and $47.12. Wall Street is more restrained, with a Buy from nine analysts and a $32.50 mean target, 42% above the close. The 2026 consensus is 13% below 2025's and fell 9.6% on September 7, five weeks after July's cut, while $3.07 for 2027 (up 13%) and $3.36 for 2028 (up 9%) assume Germany recovers on schedule. Cheap stocks can stay cheap.
What could go wrong
Germany could miss its year-end target, and the UK and Benelux, where management concedes execution fell short, could keep losing share. Leverage of 2.8x on the company's measure sits at the downgrade threshold Fitch set while its outlook is still Positive, for a rating one notch above high yield. The strategic review cuts both ways, since a sale could crystallize a premium or end the dividend and add debt. Expensive gasoline may mean fewer miles and collisions, and a euro near $1.13, below the $1.17 in guidance, shrinks European profits. The GNG Quant Rating reads Strong Sell, pulled down by weak price momentum and estimate revisions since the July guidance cut, a fair summary of the past three months.
The conservative bear case
A Hormuz escalation lifts Brent toward the $120 Goldman Sachs sees if shipping attacks intensify, gasoline tops $4.45, drivers log fewer miles, Europe stalls, the Fed keeps hiking and the dollar firms. LKQ's October 29 report shows Germany still below its normal run rate, 2026 guidance slips toward the $2.60 floor, European margins recover slowly and the floating revolver reprices higher. The 2027 consensus falls about 11% to the $2.72 the most bearish analyst already models, price targets fall, two or three of the seven Buys drop to Hold, Fitch turns its outlook Negative as leverage holds above 2.8x, and small-cap and income funds sell.
With another 100 basis points on the third of LKQ's debt that floats, 2027 earnings would be about $2.68 and free cash flow about $615 million. At today's 7.4x forward earnings the shares would sit near $20, and at March 2020's 5.9x trailing earnings near $16, 13% to 31% below the September 30 close, yielding 6.0% to 7.6%. At either end the dividend would take about 45% of stressed earnings and 49% of stressed free cash flow, 2.0x coverage, and leverage on the lowest 2026 EBITDA estimate would be about 2.9x, inside the 4.0x covenant, with ratings still investment grade. Dividends would recoup 17% to 41% of the fall in a year and 34% to 83% in two.
The thesis breaks if the board cuts or suspends the $0.30 quarterly dividend, if trailing free cash flow falls below the dividend's roughly $304 million cost at two straight quarter-ends, if credit-facility leverage stays above 3.5x for two quarters or two agencies cut LKQ below investment grade, or if Europe's segment EBITDA margin is still under 8% in the first half of 2027. This is the read on today's data, not a forecast.
VICI Properties
VICI Properties (VICI) owns the real estate under Caesars Palace, MGM Grand, the Venetian and 100 other experiential venues, on triple-net leases that average 39 years with renewals. At the September 30 close of $22.97 it yields 8.0% on a $1.84 dividend that adjusted funds from operations (AFFO) cover 1.34x, at 9.3x 2026 AFFO guidance, a multiple last seen in the spring 2020 crash. GNG rates it a Good Buy, the lowest tier among my five picks. The market's worry is that its largest tenant, Caesars, is being sold and a talk about its regional rent is coming. What I find compelling is that the price already assumes that talk goes badly, while the rent keeps arriving and nearly half of it rises with inflation.
Real estate returned minus 6.3% in the quarter while VICI's shares fell 13.5%, as if its rent were a fixed coupon. It is not. The company counts 45% of the 2026 rent roll as escalating with CPI, rising to 88% by 2035, and the Caesars leases rise by the greater of 2% or CPI, uncapped, with CPI at 3.4%. The market is charging a nominal long bond's duration penalty for cash flows closer to an inflation-linked one, and the yield sits 2.7 points over the 10-year, 2x the gap of a year ago.
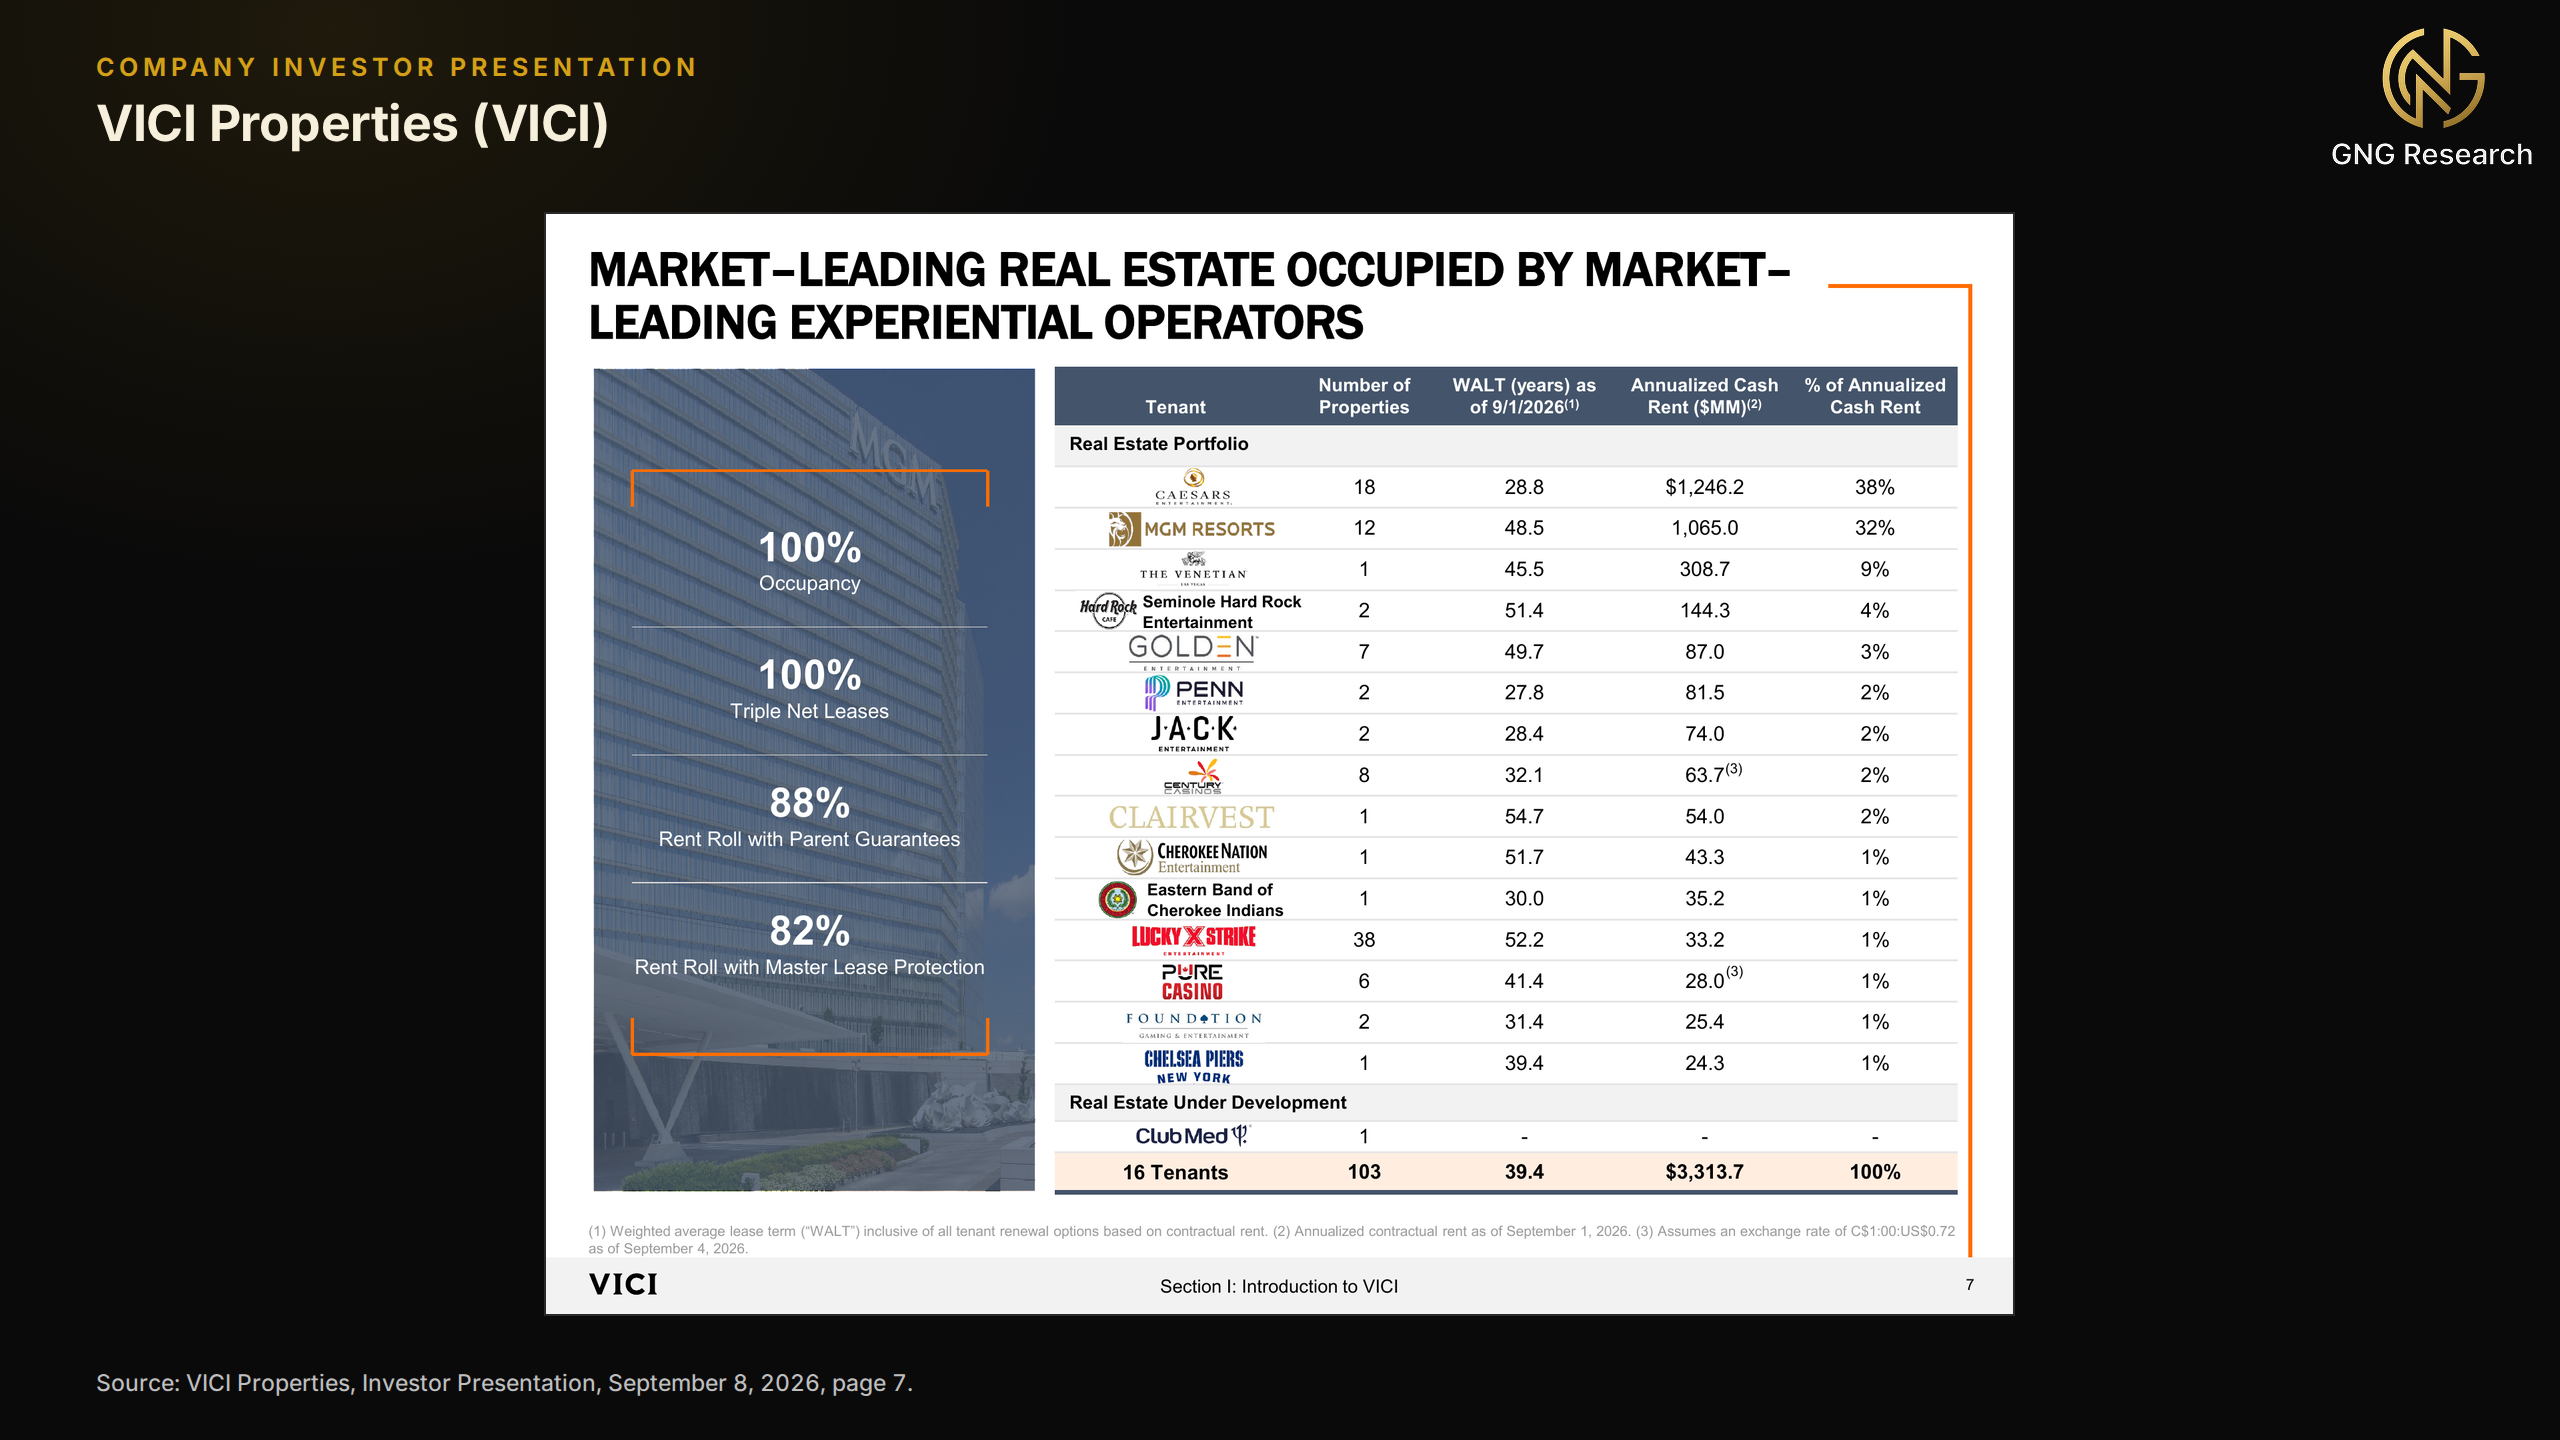
The micro case starts with the contracts. Occupancy is 100%, every lease is triple-net, 88% of rent carries a parent guarantee, and 82% sits in master leases that stop a tenant from returning only the weak properties, as the company's table in Figure 13 shows. Rent collection has been 100% since 2017, pandemic included, and AFFO per share has risen every year, from $1.43 in 2018 to $2.38 in 2025. In July, President John Payne said "Strip gaming revenue is running ahead of last year." Rate regimes shift, and the discount can persist.
Why the dividend is safe
On AFFO, coverage is comfortable. The $2.46 midpoint of 2026 guidance covers the $1.84 dividend 1.34x, a 75% payout in line with the company's target, and second-quarter AFFO of $0.62 covered the new $0.46 quarterly rate 1.35x, leaving about $680 million a year to reinvest without issuing stock. The dividend has risen every year since the 2018 IPO, from $0.2625 a quarter to $0.46, without a cut. September's 2.2% raise was the smallest yet.
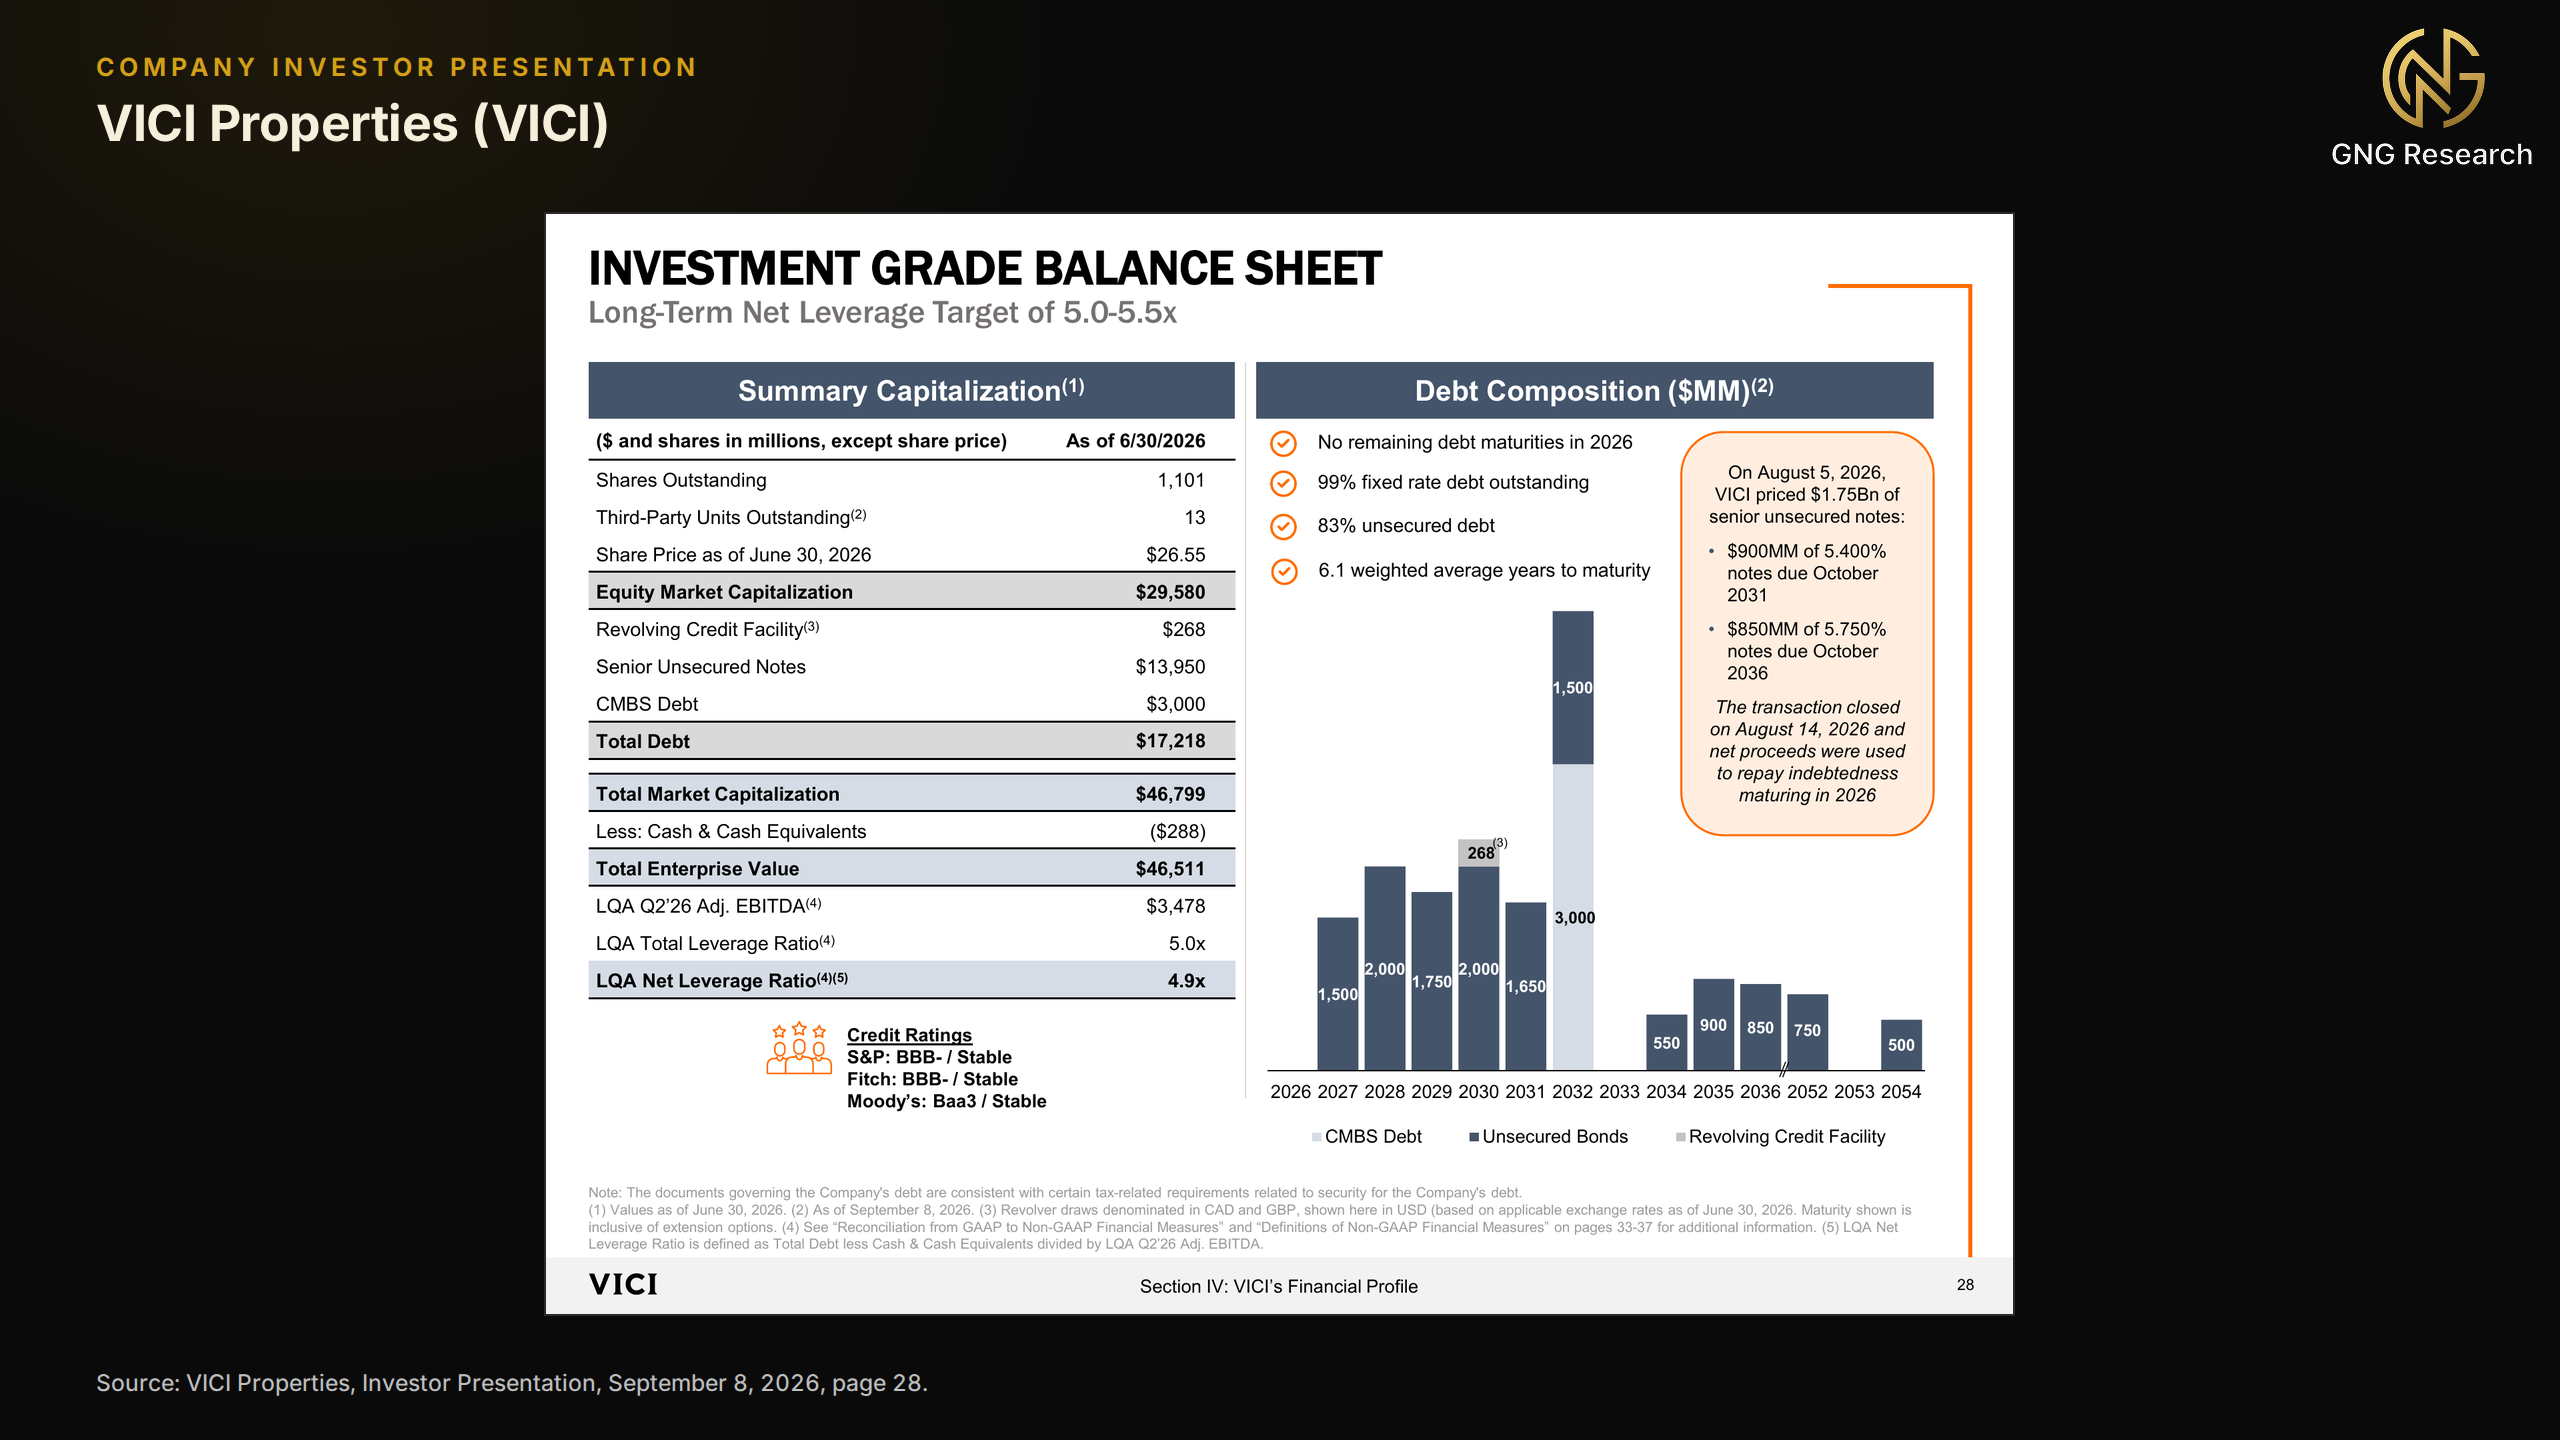
The balance sheet is investment grade (BBB- at S&P and Fitch, Baa3 at Moody's, all stable), and net debt was 4.9x annualized adjusted EBITDA in June, below the 5.0x to 5.5x target. In August VICI sold $1.75 billion of notes at 5.40% and 5.75% and retired all its 2026 maturities, as Figure 14 shows. Next come $1.5 billion in 2027 and $2.0 billion in 2028, against $2.5 billion of liquidity, and 99% of the debt is fixed rate. History is never guaranteed to repeat.
VICI accounts for its leases as receivables, so reported income includes non-cash rent accruals and credit-loss swings, which is how second-quarter net income fell 39% while AFFO rose 7.8%. Shares trade at 9.3x 2026 guidance, against a median of 15.6x the prior year's AFFO since 2019. Gaming and Leisure Properties, the other large casino landlord, trades at 9.2x its guidance, while Realty Income and W. P. Carey fetch 12.2x to 12.4x, so the discount prices gaming as much as VICI. The implied cap rate is near 8.2%, 2.9 points over the 10-year, and the same enterprise value is 11.5x the 2026 EBITDA consensus of $3.69 billion and 11.0x 2027's $3.87 billion.
GNG's model value is $32.83, 43.0% above the close, based on price to operating cash flow at the stock's five-year median, and GNG's other multiple methods span $25.53 to $33.91, all above the price. Wall Street says Buy, with 17 of 25 analysts at Buy or better and a $31.96 mean target, 39.2% above the close, though on September 24 JPMorgan moved to Neutral and Scotiabank cut to $26. The analyst consensus for the dividend, $1.86, $1.92 and $1.96 for 2026 to 2028, implies about 3% annual growth. The GNG Quant Rating reads Hold. It scores the business well on profitability and growth, while price momentum and estimate revisions weigh on it after a slide of nearly 30%. Vegas is not going anywhere, from the mindset of a long-term fundamental investor, the current market environment has presented an amazing opportunity here. Personally even if Fitch does continue to slide with momentum, I would see it as future Dollar-cost averaging opportunities - unless, of course, the fundamentals change and the thesis changes.
What could go wrong
Caesars, 38% of rent, agreed in May to be acquired by Fertitta Entertainment for $17.6 billion including $11.9 billion of assumed debt, and S&P put Caesars' B+ rating on CreditWatch negative, expecting leverage above 7x. Asked in July about the Caesars regional lease, worth about $731 million a year to VICI, chief executive Edward Pitoniak said that conversation "will take place at some point" under the new owner, while VICI does "collect every dollar of rent in the meantime." The lease's variable fifth also resets in November 2027 on revenue trends. With MGM Resorts at 32%, two tenants carry 70% of rent, and a consumer slowdown hits both. Higher rates lift refinancing costs on $3.5 billion due by 2028, and with the implied cap rate above the 7.5% paid for the Golden Entertainment casinos, new equity is costly. Or to put it simply, the current momentum could continue to slide and we could see a break in fundamentals in future quarters.
Also just to put it bluntly, the online gaming scene could eventually have a large impact on in-person gaming so to speak, thus impacting the amount of people who would travel to these properties that VICI owns. Considering the amount of time that has passed since online gaming has been popularized and things are continuing to look up from a fundamental standpoint, I don't foresee this being an issue.
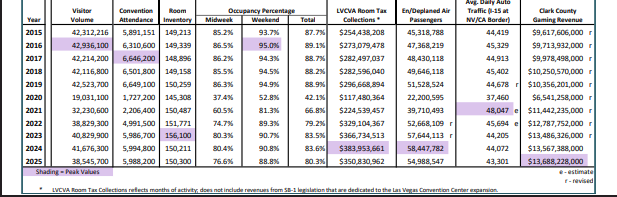
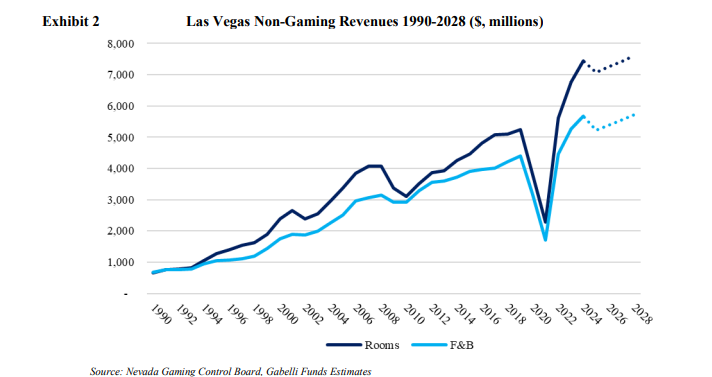
Here’s another supporting chart I claim showing the future estimates..
The conservative bear case
It starts with the rate shock this sector fears most. The Fed hikes again by December, core inflation holds near 3%, and the 10-year breaks 6% on rising real yields. The Fertitta purchase closes and the regional lease talks end in a stated 30% rent cut with no compensation, removing about $219 million, or 8%, of AFFO. VICI refinances the $3.5 billion due in 2027 and 2028 near 7.3%, its August spread over a 6% Treasury, costing another 3%. Analysts cut 2027 EBITDA estimates about 6% and targets toward $20, several Buys become Holds, S&P or Moody's turns VICI's outlook negative, and income funds see outflows as the shares de-rate toward the 2020 trough.
Stressed AFFO would land between $2.18 and $2.26 a share. At 8.8x, the multiple that holds today's AFFO-yield premium over a 6% 10-year, on the rent cut alone, and at the 2020 trough of 7.6x on both hits, the shares would trade somewhere between about $16.50 and $19.80, roughly 14% to 28% below the September 30 close, yielding 9.3% to 11.2%. The thesis survives because AFFO would still cover the dividend 1.18x to 1.23x, net leverage would be about 5.2x, within target, the ratings would stay investment grade, and a year of dividends would recoup 28% to 58% of the drawdown.
It breaks if the board cuts the $0.46 quarterly dividend or skips an annual raise, if quarterly AFFO per share falls below the dividend for two straight quarters, if Caesars or MGM Resorts misses a rent payment, if net debt tops 6.0x annualized adjusted EBITDA at two straight quarter ends, or if two agencies cut VICI below investment grade. This is the read on today's data, not a forecast.
Looking Ahead..
Here are key events to watch that may contribute one way or another on the performance of the five pigs discussed in this article:
The September jobs report on October 2 and September CPI on October 14, the only CPI print before the Fed meets on October 27 and 28.
A cluster of company reports. LKQ reports on October 29 and Sanofi on October 30, both dates confirmed, while Enterprise Products and VICI are expected on October 28 and Hormel on December 2, with its fiscal fourth quarter and its first outlook for fiscal 2027.
The midterm elections on November 3, the December 8 and 9 Fed meeting with new projections, and a federal funding deadline on December 11.
Sanofi's dividend proposal on January 28, 2027, which would be its 32nd consecutive annual increase if the board raises it again.
Thanks for reading and being here. I will answer comments as I see them, so leave questions and pushback below. Thanks for being a part of GNG.
Sign in to leave a comment and join the discussion.
Sign Up Free