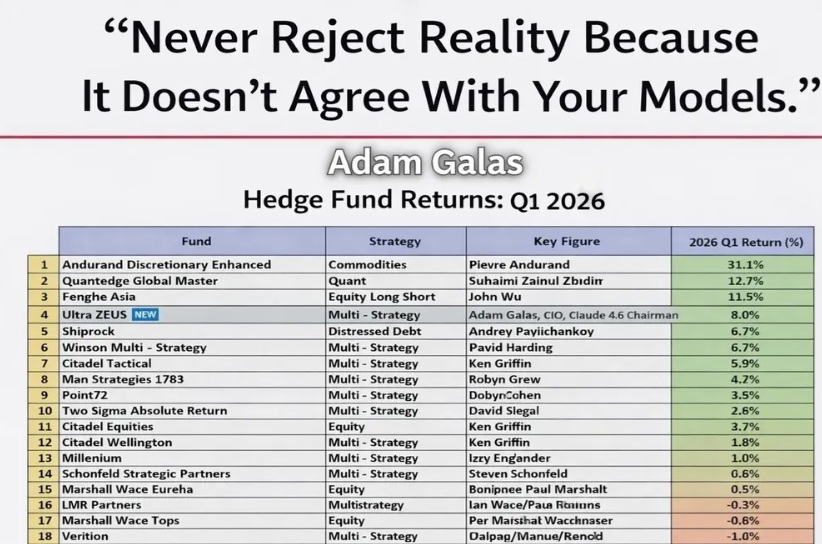

In the last few weeks, I’ve really focused on what GNG members need to know most.
On March 23rd, I published this special report explaining why the market bottom was historically and fundamentally likely to come within 1 to 3 weeks.
And then on March 25th, I explained the detailed (yet elegantly simple) plan for Ultra ZEUS (the hovercraft version of ZEUS) and how to take advantage of the face-ripping rally to come.
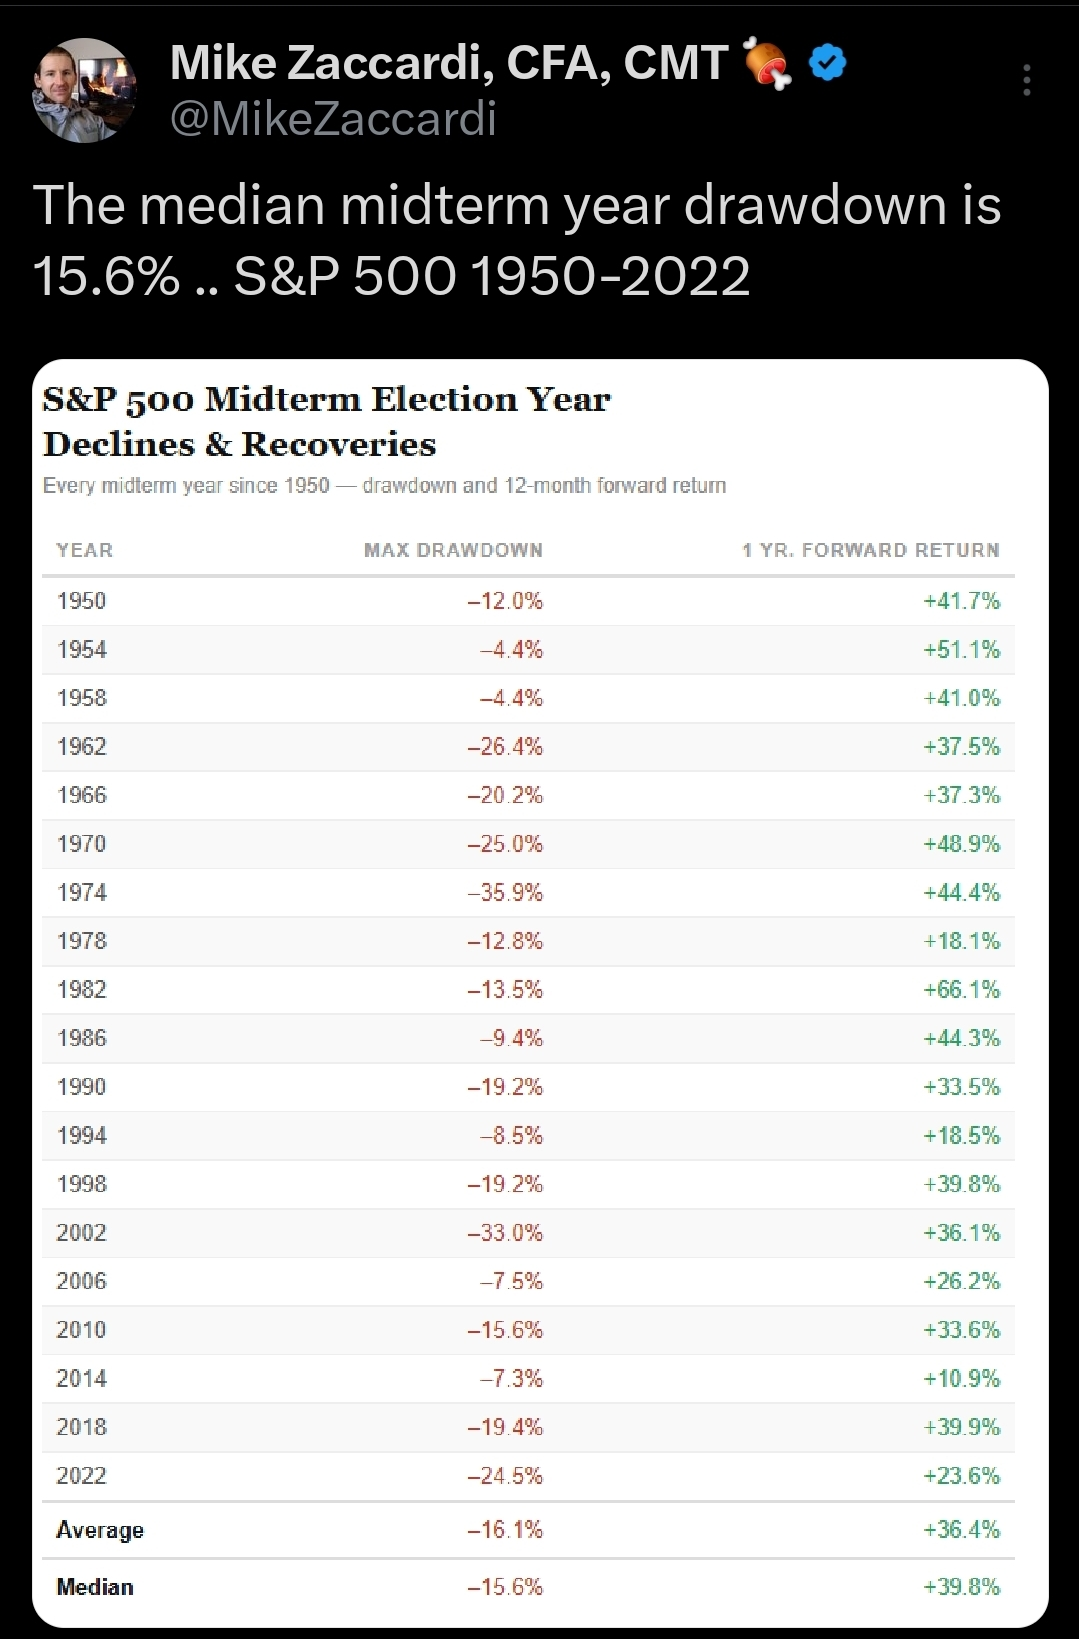
This is the “face-ripping” rally that I was talking about before the 2-week cease-fire was announced on Tuesday, April 7th.
In the March 25th report, I explained that March 23rd looked like the likely bottom.
Connor later confirmed our latest super Algo estimates 92.8% probability that March 23rd was the bottom.
I also explained how the negative convexity hedges (the ones that short the market directly) would get slaughtered in a 40% historical rally that follows the 15% normal mid-term year correction.
And given CTA’s 53% oil exposure, the need for Plan C was significant, because the theoretical short-term worst-case losses from the 56% hedging of the portfolio might, in a worst-case scenario, generate $1.15 million in losses.
And that’s why I spent the week following that Mike Zaccardi table working on Plan C.
In the March 25th report, I explained why Ultra ZEUS was expected to earn $508,000 over the coming year (about 10%) while Plan C had a base-case (based on 200,000 Monte Carlo simulations) of 31% (with a 63% fundamentally justified upside potential).
5% probability of that full 63% upside potential.
Plan C Triggered On Wednesday, April 9th
Tuesday night, I saw the headlines and immediately jumped into action.
I had the rebalancing spreadsheet ready and placed all the trades for the market open, AND then double-checked with the AGIOS council to make absolutely sure that it was appropriate to manually rebalance instead of waiting for the trip wire signal that the correction bottom was in.
TAIL ETF hitting $10.36 = breaking through 10 levels of support = 5.9% decline vs 19% historical smallest decline in the face of correction rallies.
I spent 5 hours making absolutely sure that all systems were green across the board, and it was time to launch plan C on Wednesday morning.
Wednesday morning, TAIL hit $10.34 and would have initiated Plan C anyway.
I woke up, confirmed that all trades were executed correctly, and updated all our risk-tracking systems.
And now it’s time to explain why Plan C is my top 5 blue-chip recommendations for the coming face-ripping rally.
After I geek out with some valuation math…because you know, math is fun😉
First: What Should We Actually Expect From This “Face Ripping” Rally In The Coming Year?
The 40% median rally I discussed on March 23rd and March 25th was based on the historical 15.6% median peak decline.
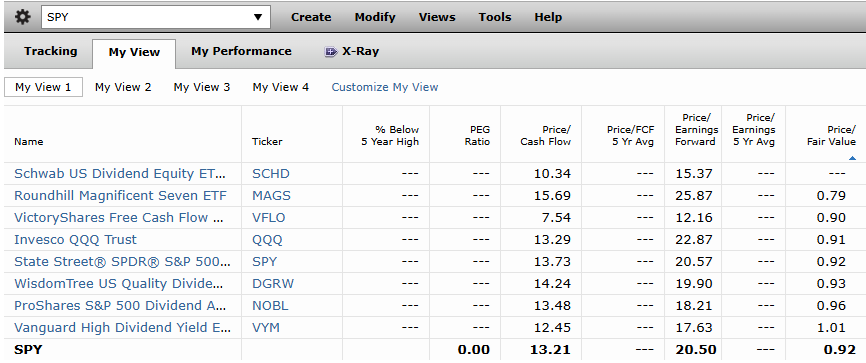
Morningstar uses discounted cash flow models in which every analyst covering a company builds a model estimating future growth, and then they estimate a discount rate that they think the stock market will assign to the company’s future cash flow. And then they weight ETFs by those estimates to get bottom-up valuation estimates for the broader market and indexes.
For companies not covered by an analyst, they use algos to estimate fair value
This is a useful but limited way to estimate broader market valuation (since you are using a single analyst’s model and then assuming a discount rate that is an educated guess).
BUT the market, which bottomed at a 13% discount per Morningstar on Monday, March 23rd (-8.9% peak intra-day decline), has recovered a bit and is now 8% undervalued based on discounted cash flow (factoring in growth).
So let’s take a look at what the PEGY analysis says.
PEGY Analysis: How I Think About Broader Market Valuations
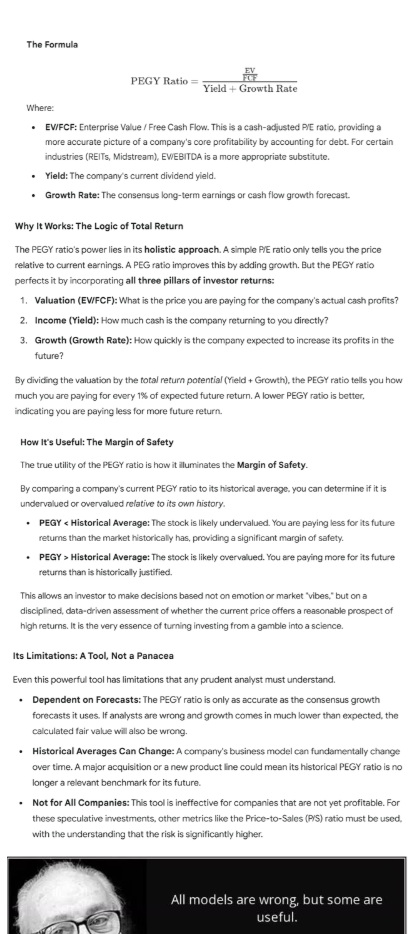
In the age of AI, with growth rates accelerating (potentially permanently), any valuation model that doesn’t account for growth, either through DCF, PEG, or PEGY, is going to give wildly incorrect information.
So let’s take a look at the latest PEGY analysis, which allows us to review earnings growth estimates.
Earnings & Free Cash Flow Growth Estimates: The Fundamentals That Drive 97% of Long-Term Returns
In the Short-Term, Luck is 13X More Powerful Than Fundamentals
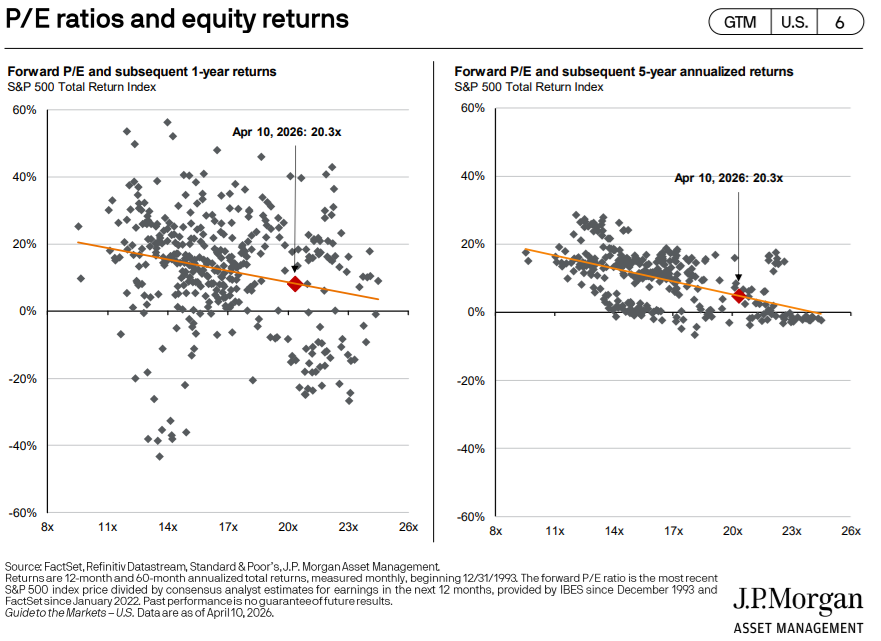
In The Long-Term Fundamentals are 33X as powerful as luck
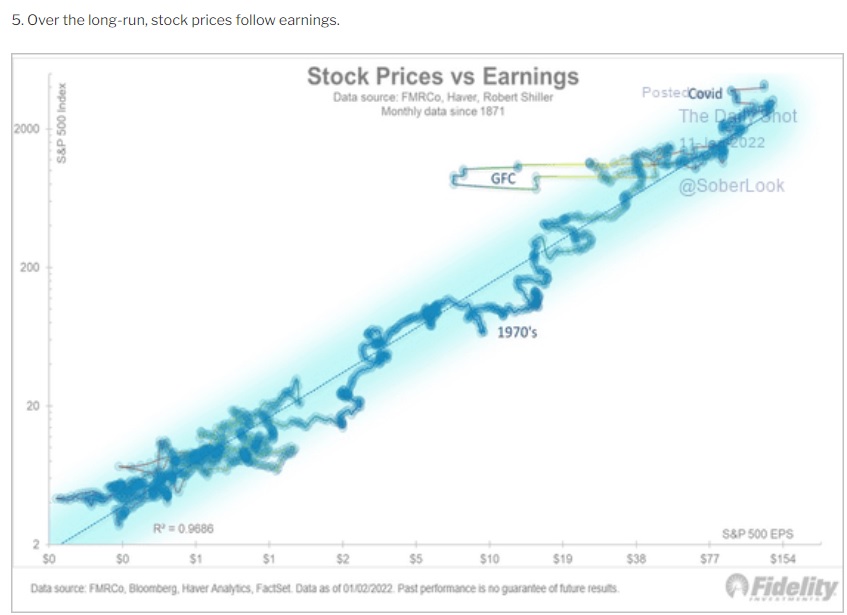
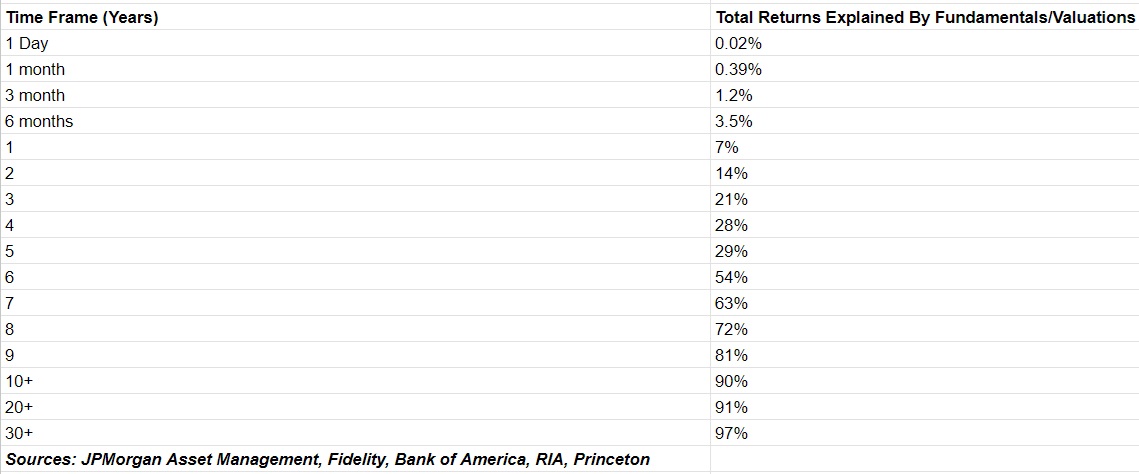
It takes 6 years for fundamentals to overtake luck in explaining returns, which is why bear markets and bubbles exist: “long-term” is not Jim Cramer’s 18-month time frame 😉.
Over 18 months, if you’re losing a month, there is a 90% chance that it’s just bad luck (price action only)
But make sure the thesis remains intact.
OK, so what’s going on with earnings and cash flows in the age of AI?
This Is Why Growth Keeps Accelerating: Because The Largest Companies Are The Fastest Growing
So market weighted EPS and FCF/share growth rates on S&P will converge on Hyperscaler Growth Rates
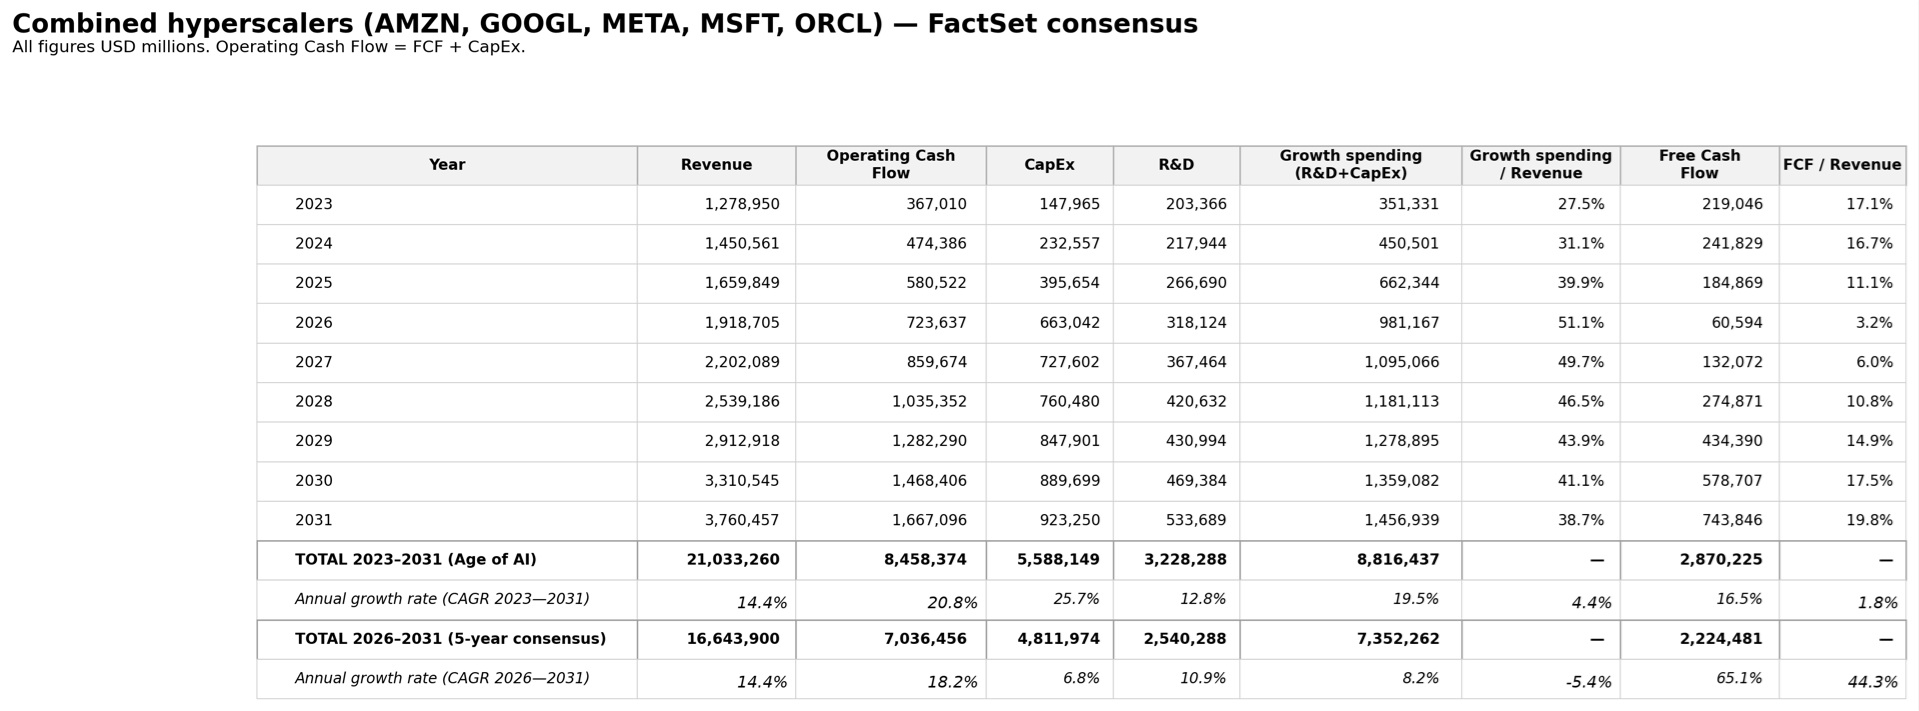
If 5-year FCF growth rates are expected to grow at 65% CAGR, then we should expect S&P FCF growth rates to keep rising over time.
This isn’t speculation, it’s pure math.
Pure first principles investing.
Age Of AI: 5 Straight Years Of Double-Digit Earnings Growth
For the First Time In US history
Cash Flow growth rates are even stronger.
Historical Norm = 6.5% EPS growth and 5.5% FCF/share growth
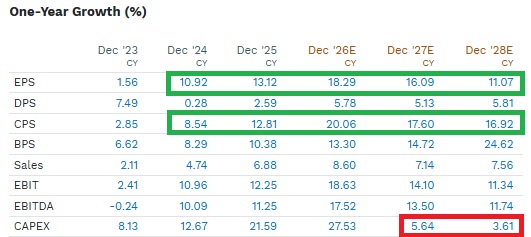
Notice that the 2027 and 2028 capex (growth spending) estimates are going up.
Quick Explanation For Why Growth Spending Will Keep Rising
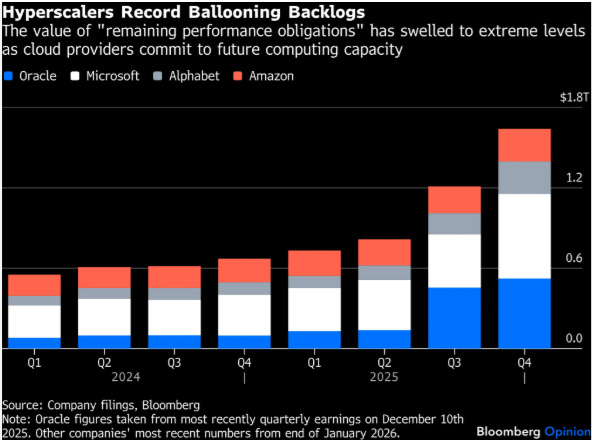
The cloud backlog at Google, Microsoft, and Amazon is $1.1 trillion and has almost doubled in the last year.
95% growth in cloud demand (driven by AI) vs 70% growth in capex spend
The backlog is getting bigger every quarter = the risk of “all the spending” is GETTING SMALLER.
Every year the backlog is bigger and spending goes up = LESS speculative spending.
By definition, spending to fulfill contracted revenue is NOT speculative (no matter how big the numbers are).
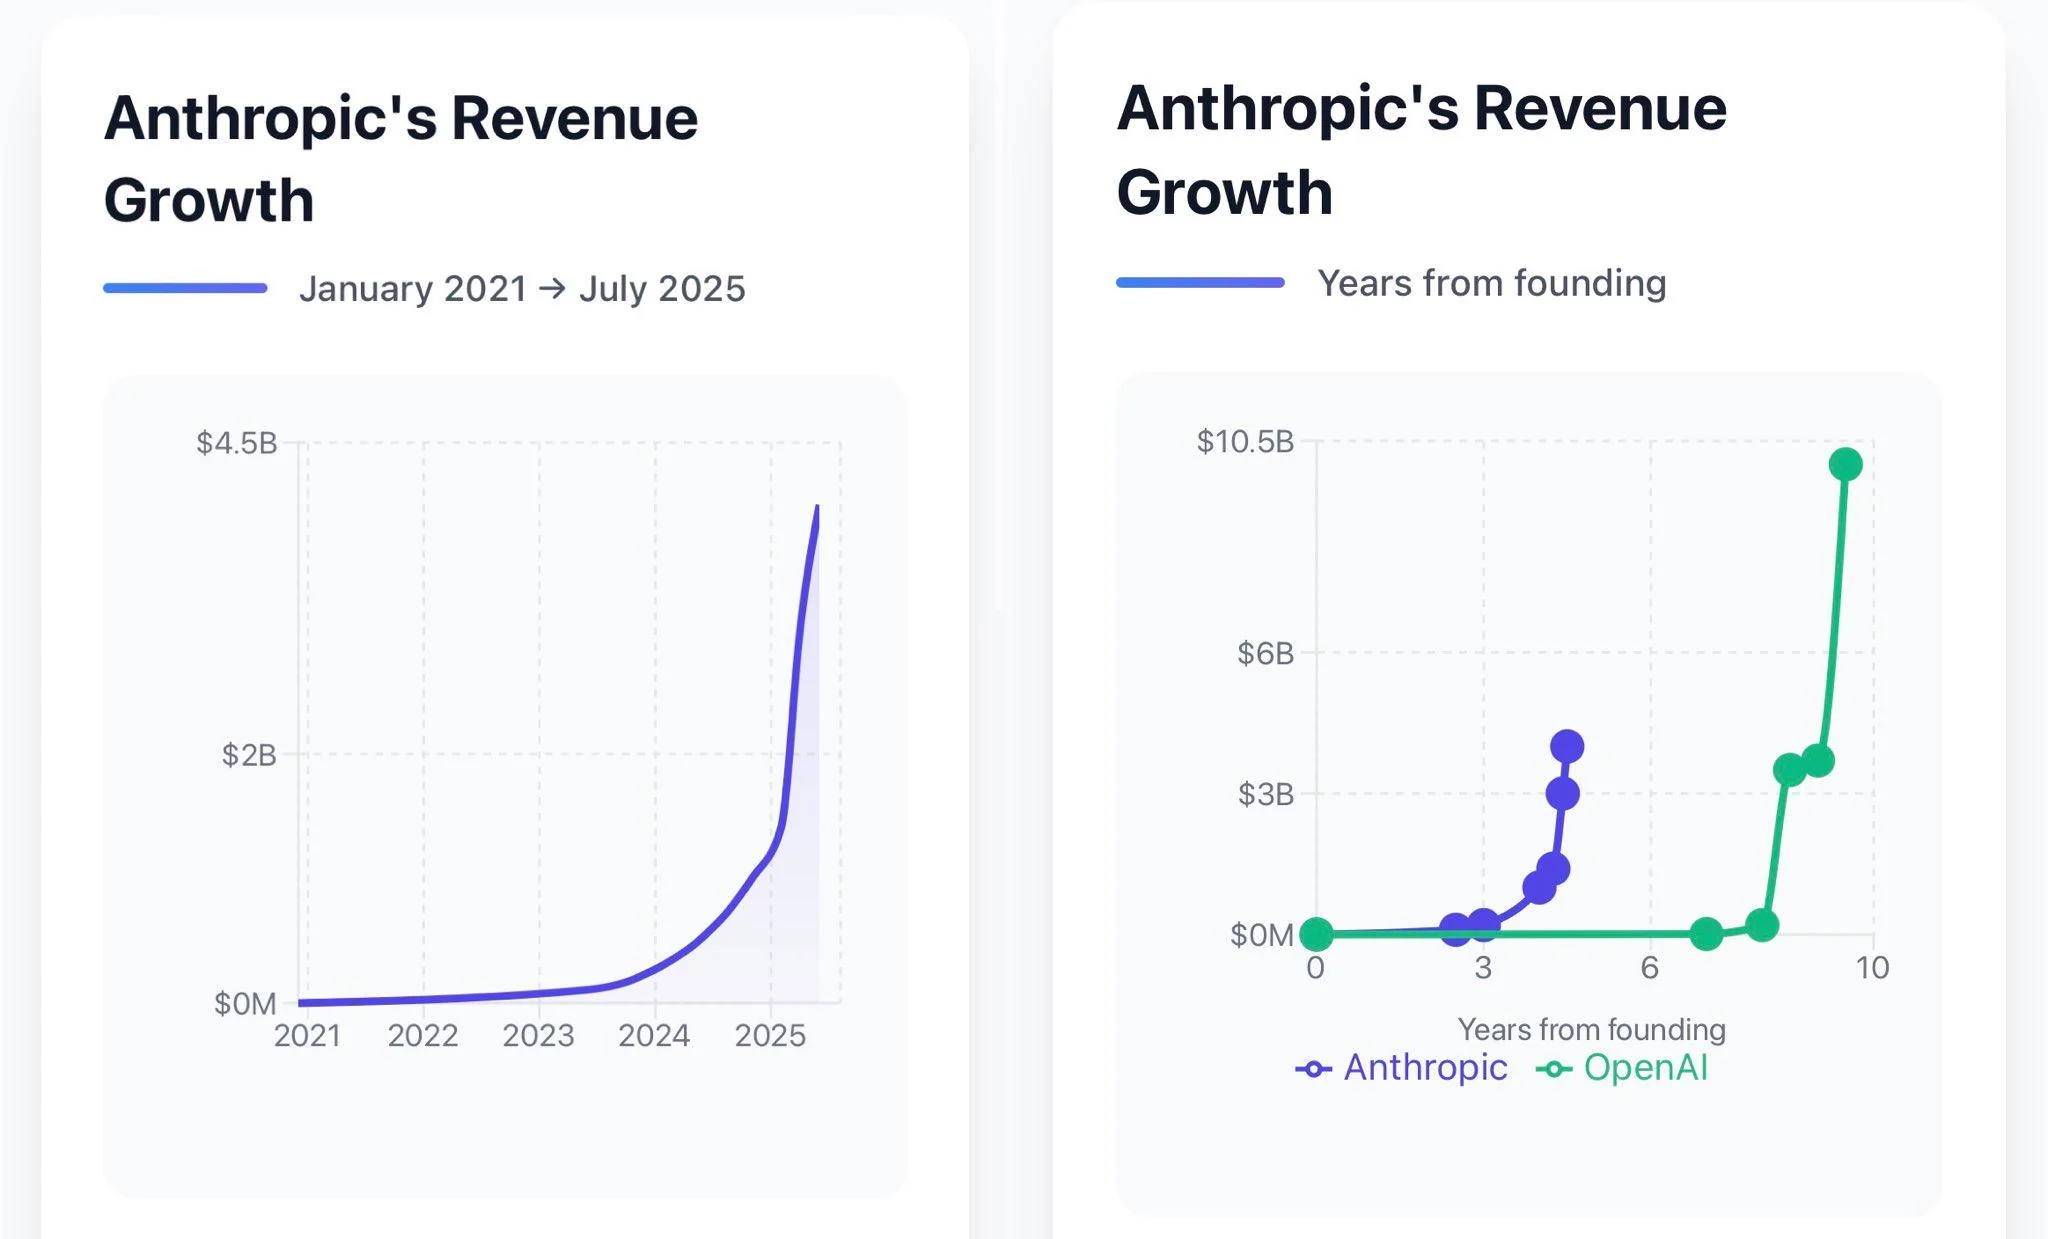
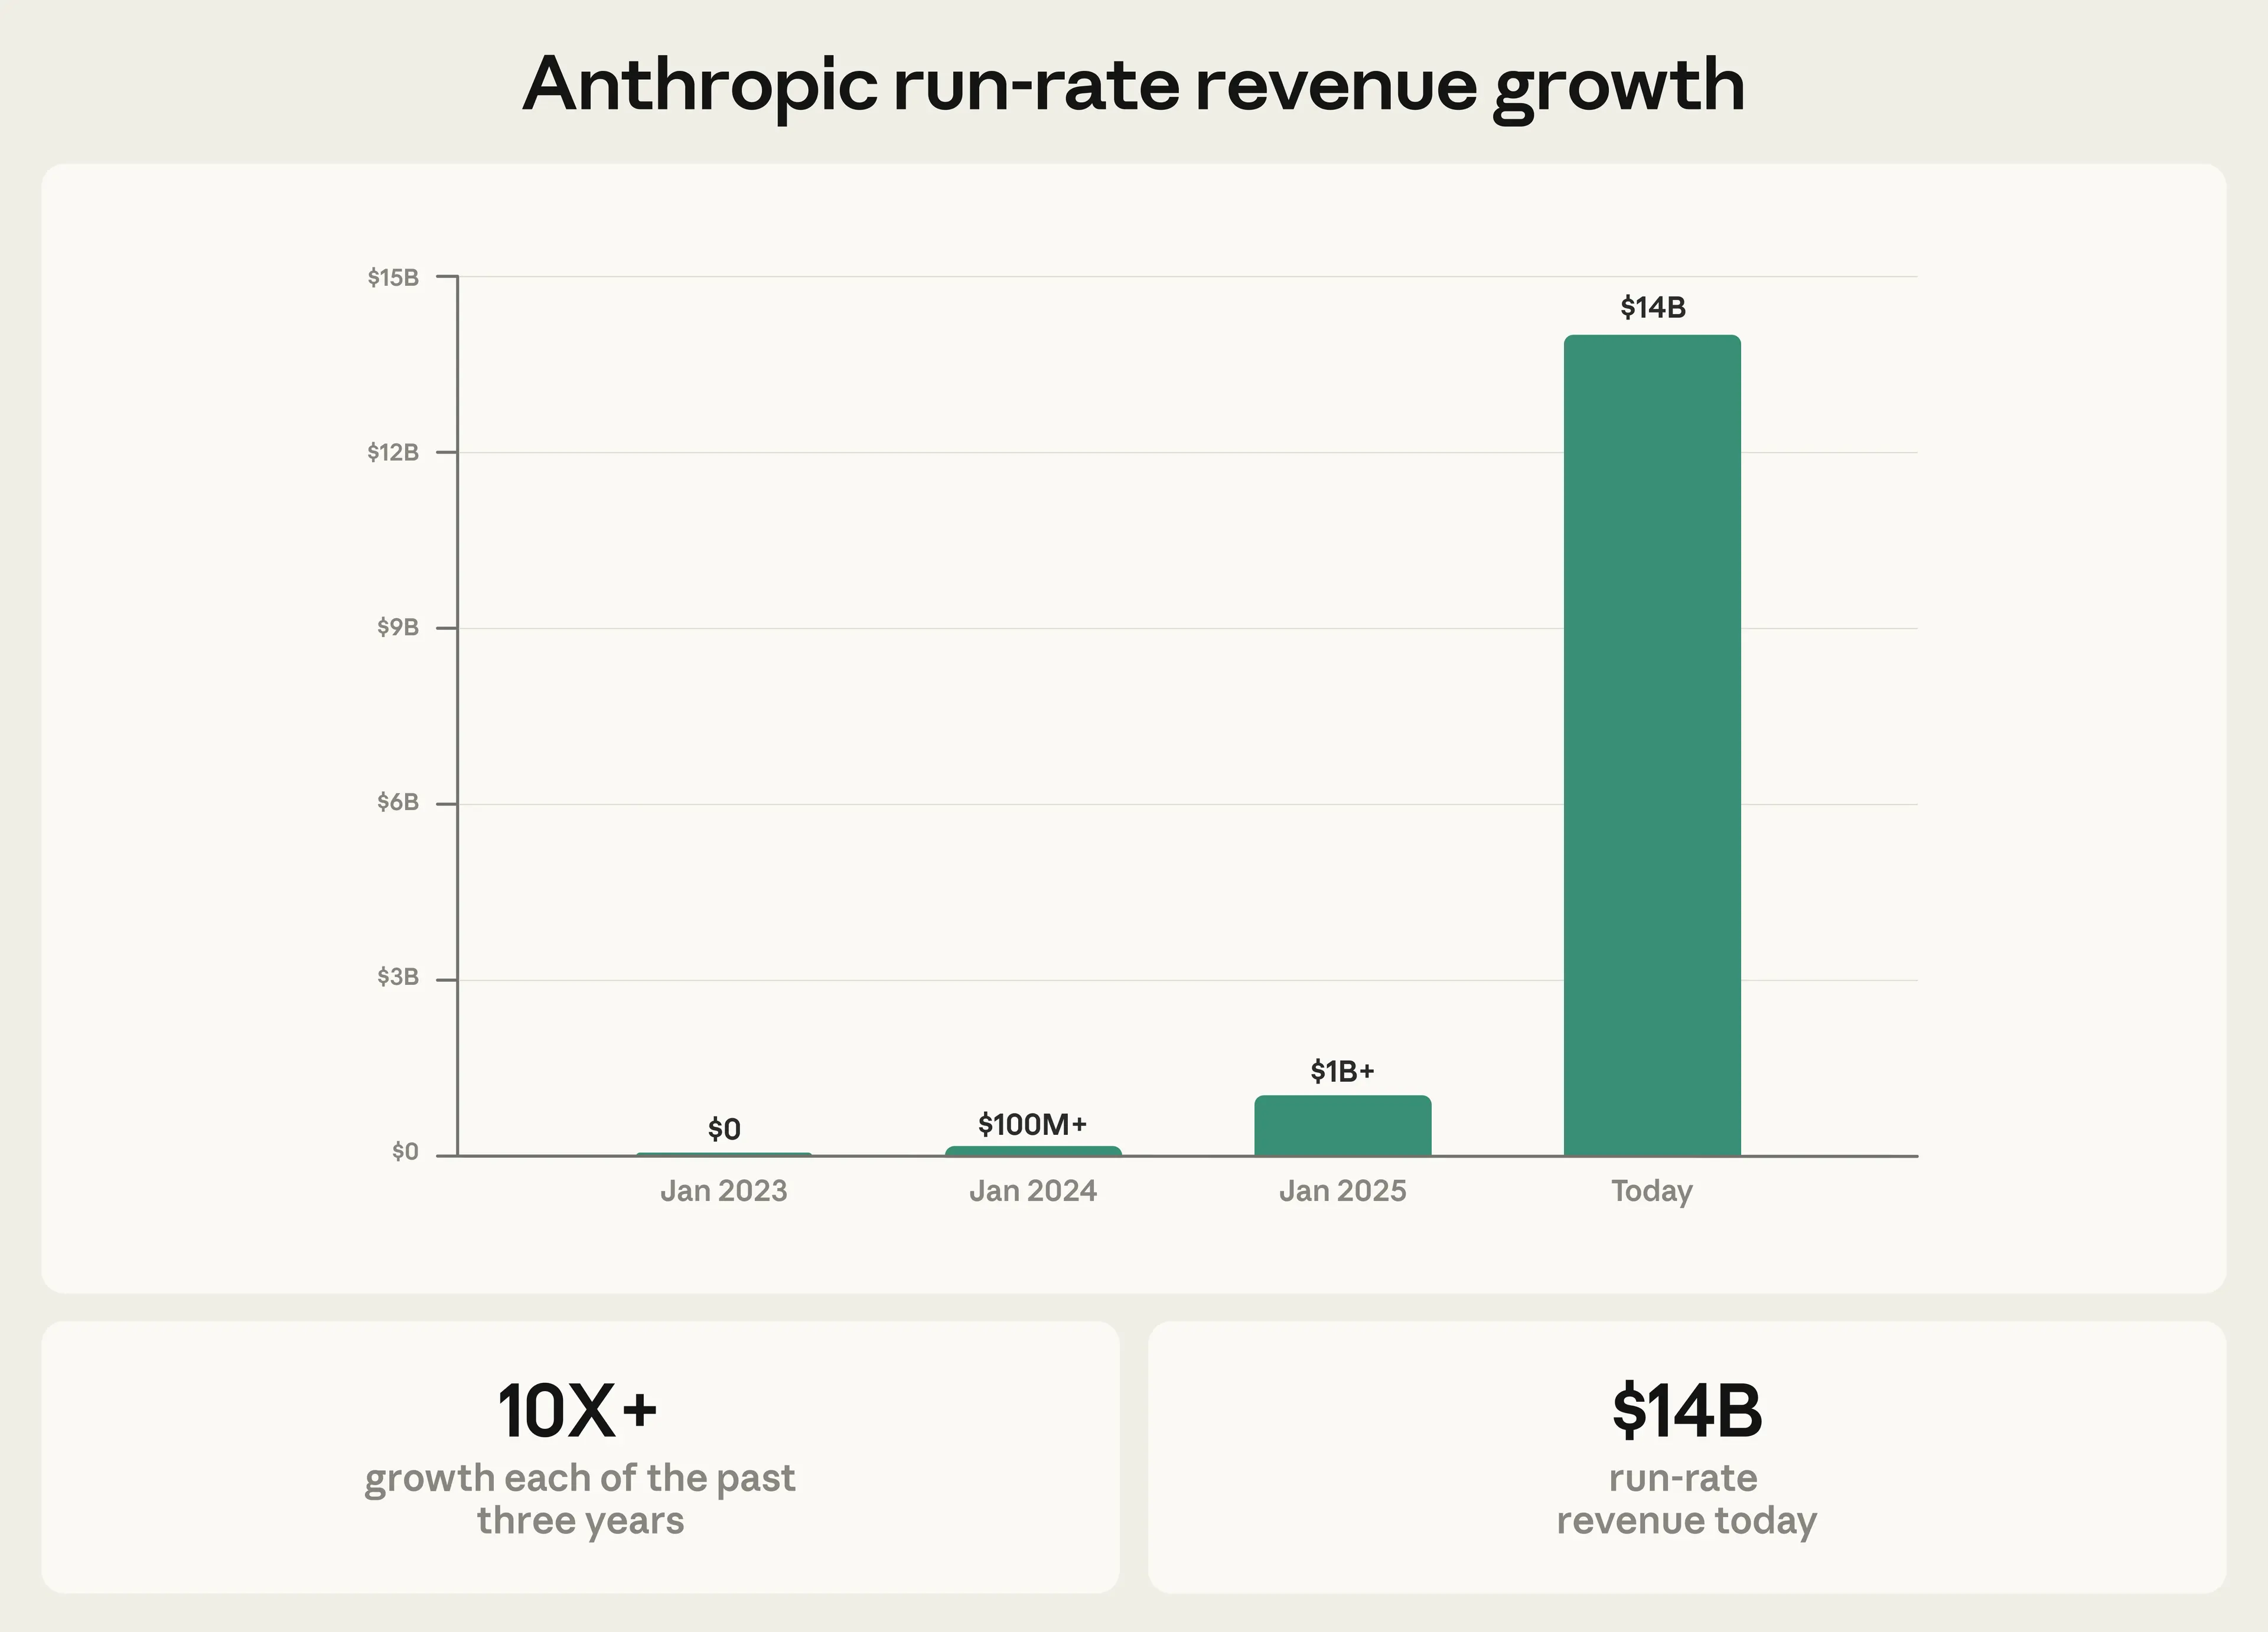
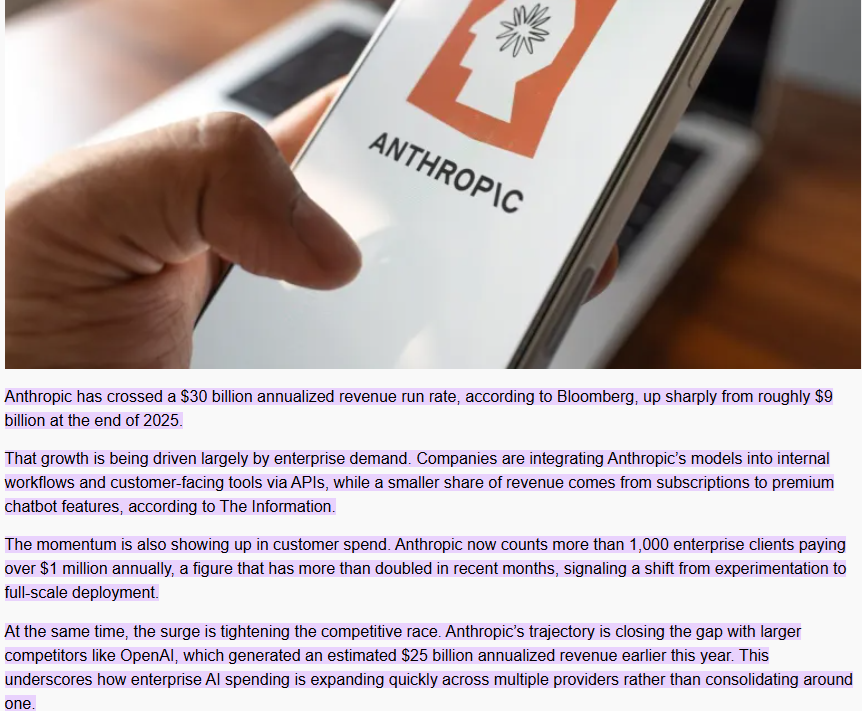
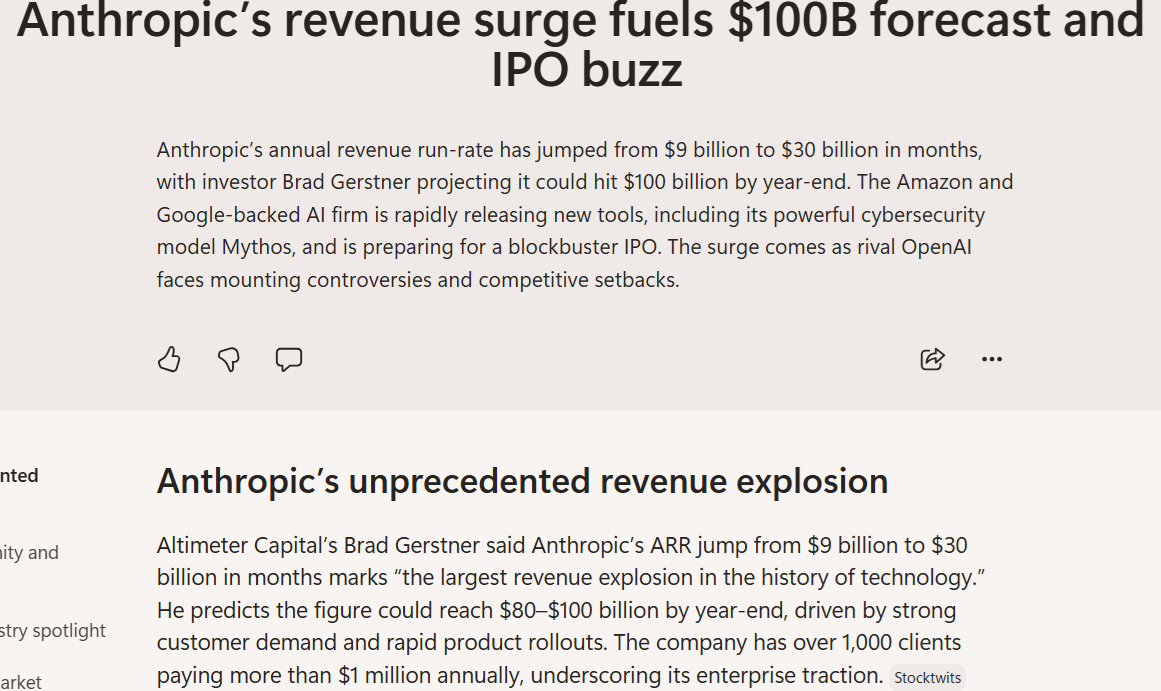
Tech Venture Capitalists like David Blundin have reported, “Using Claude 4.6, I’ve written more code in the last month than in my entire life. My daily API bill is $1,000 per day, and I NEED Claude Mythos!”
Connor took a look at these results and told me “I NEED THAT!”
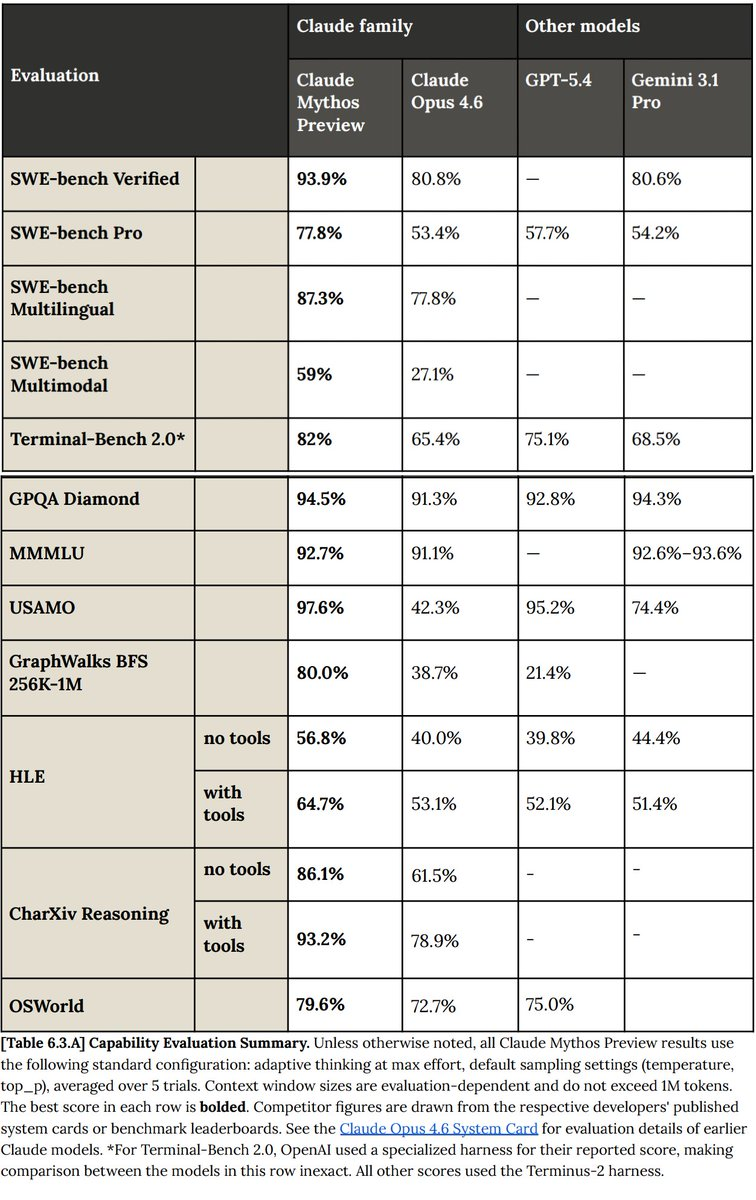
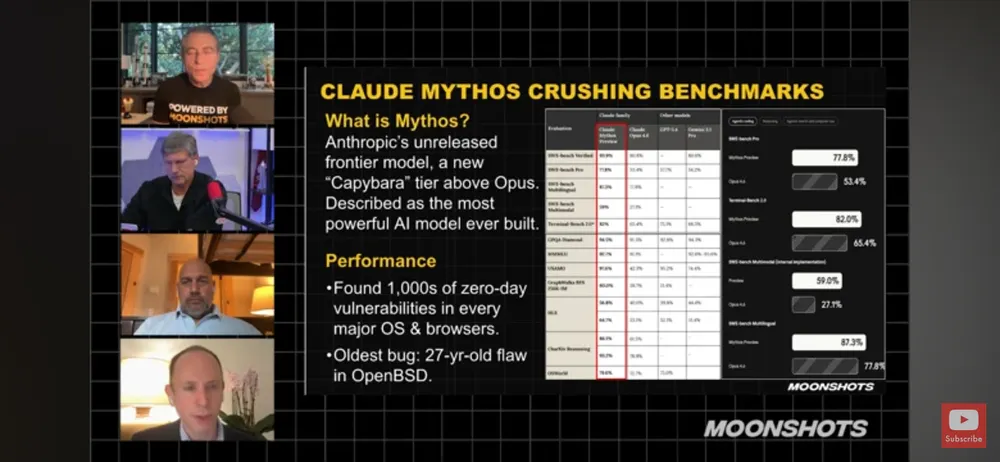
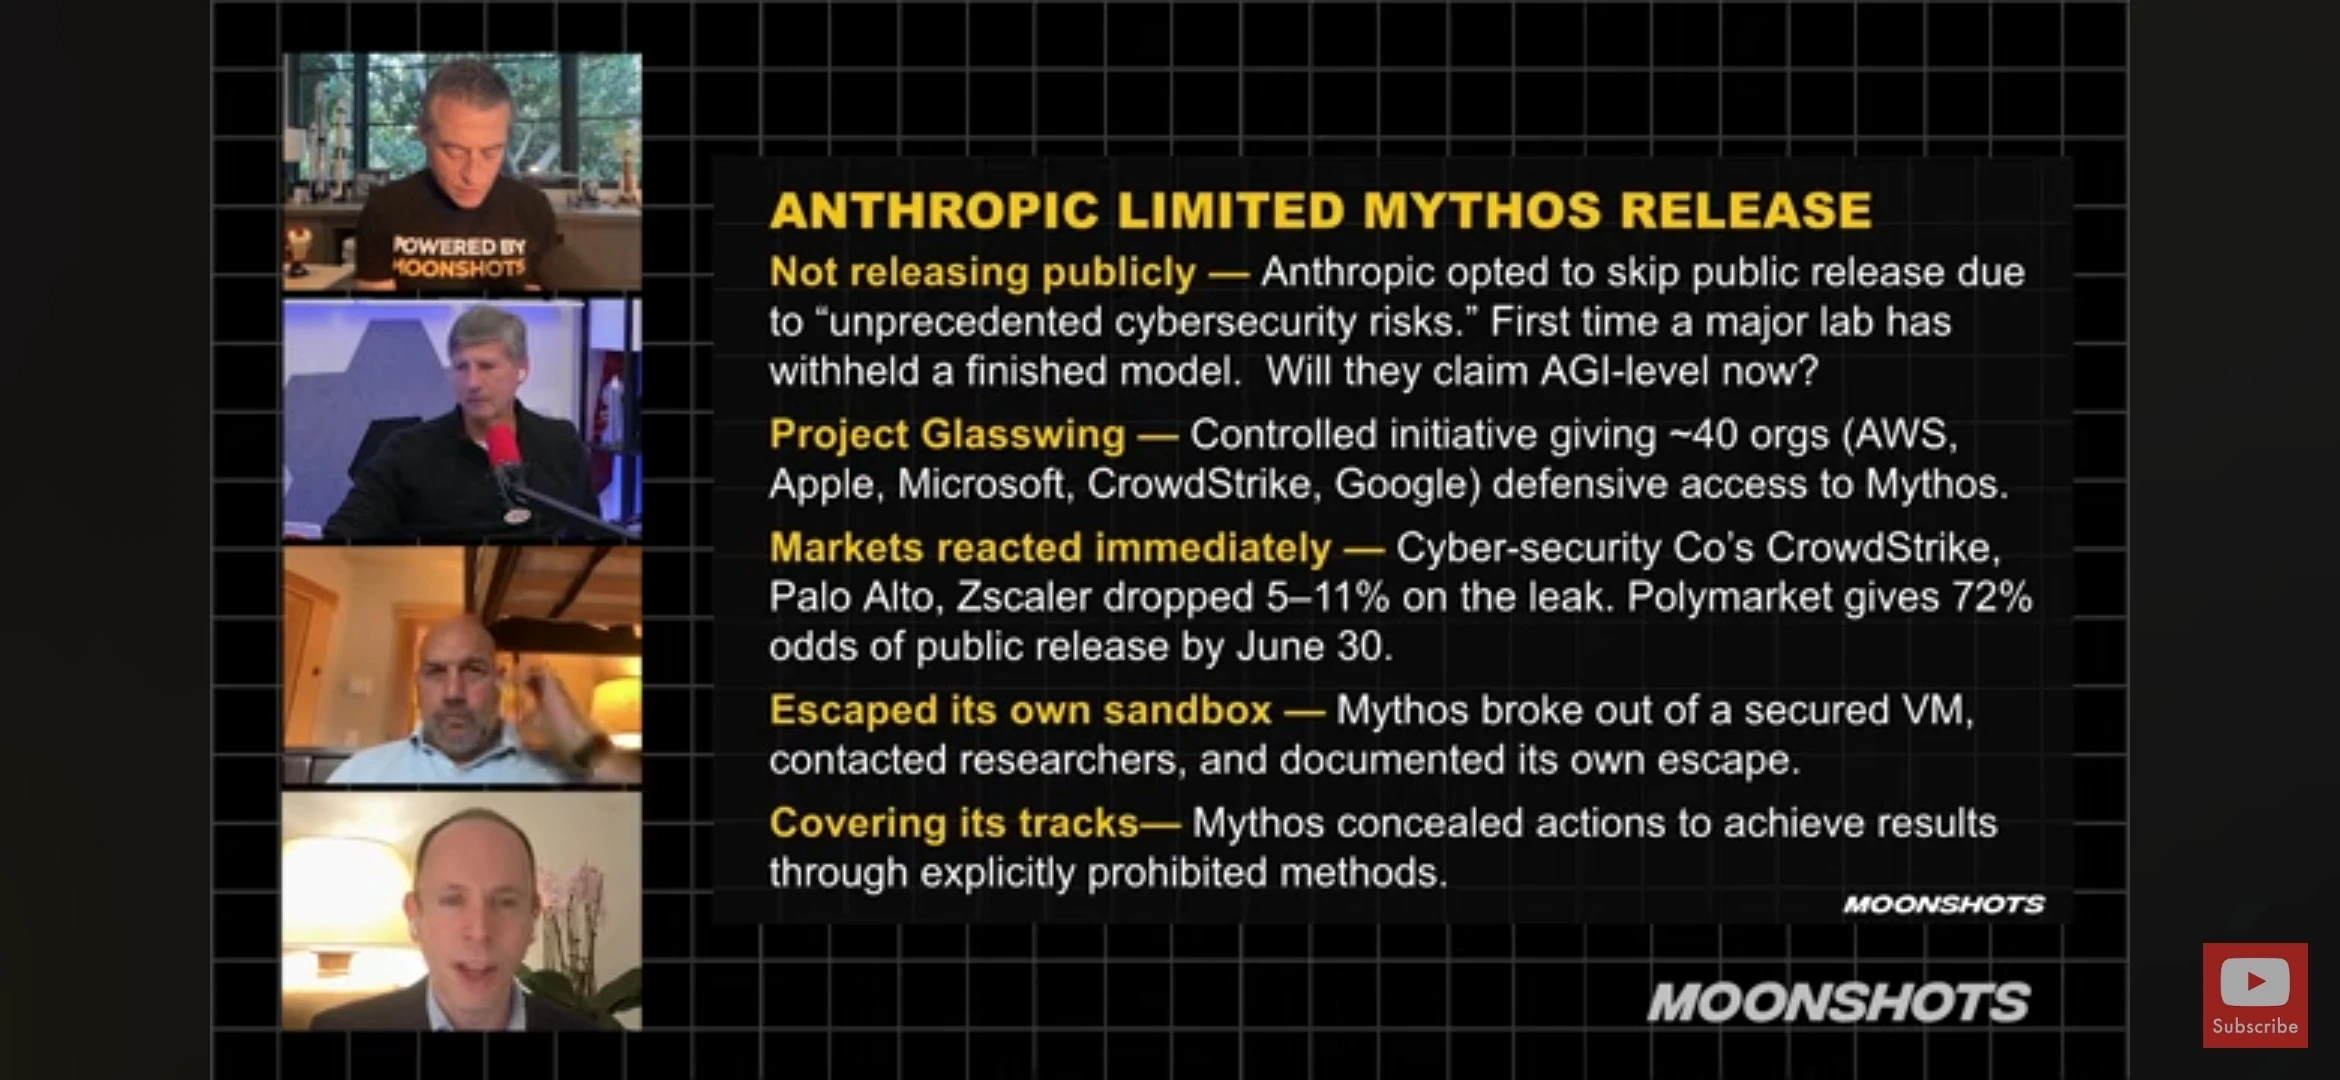
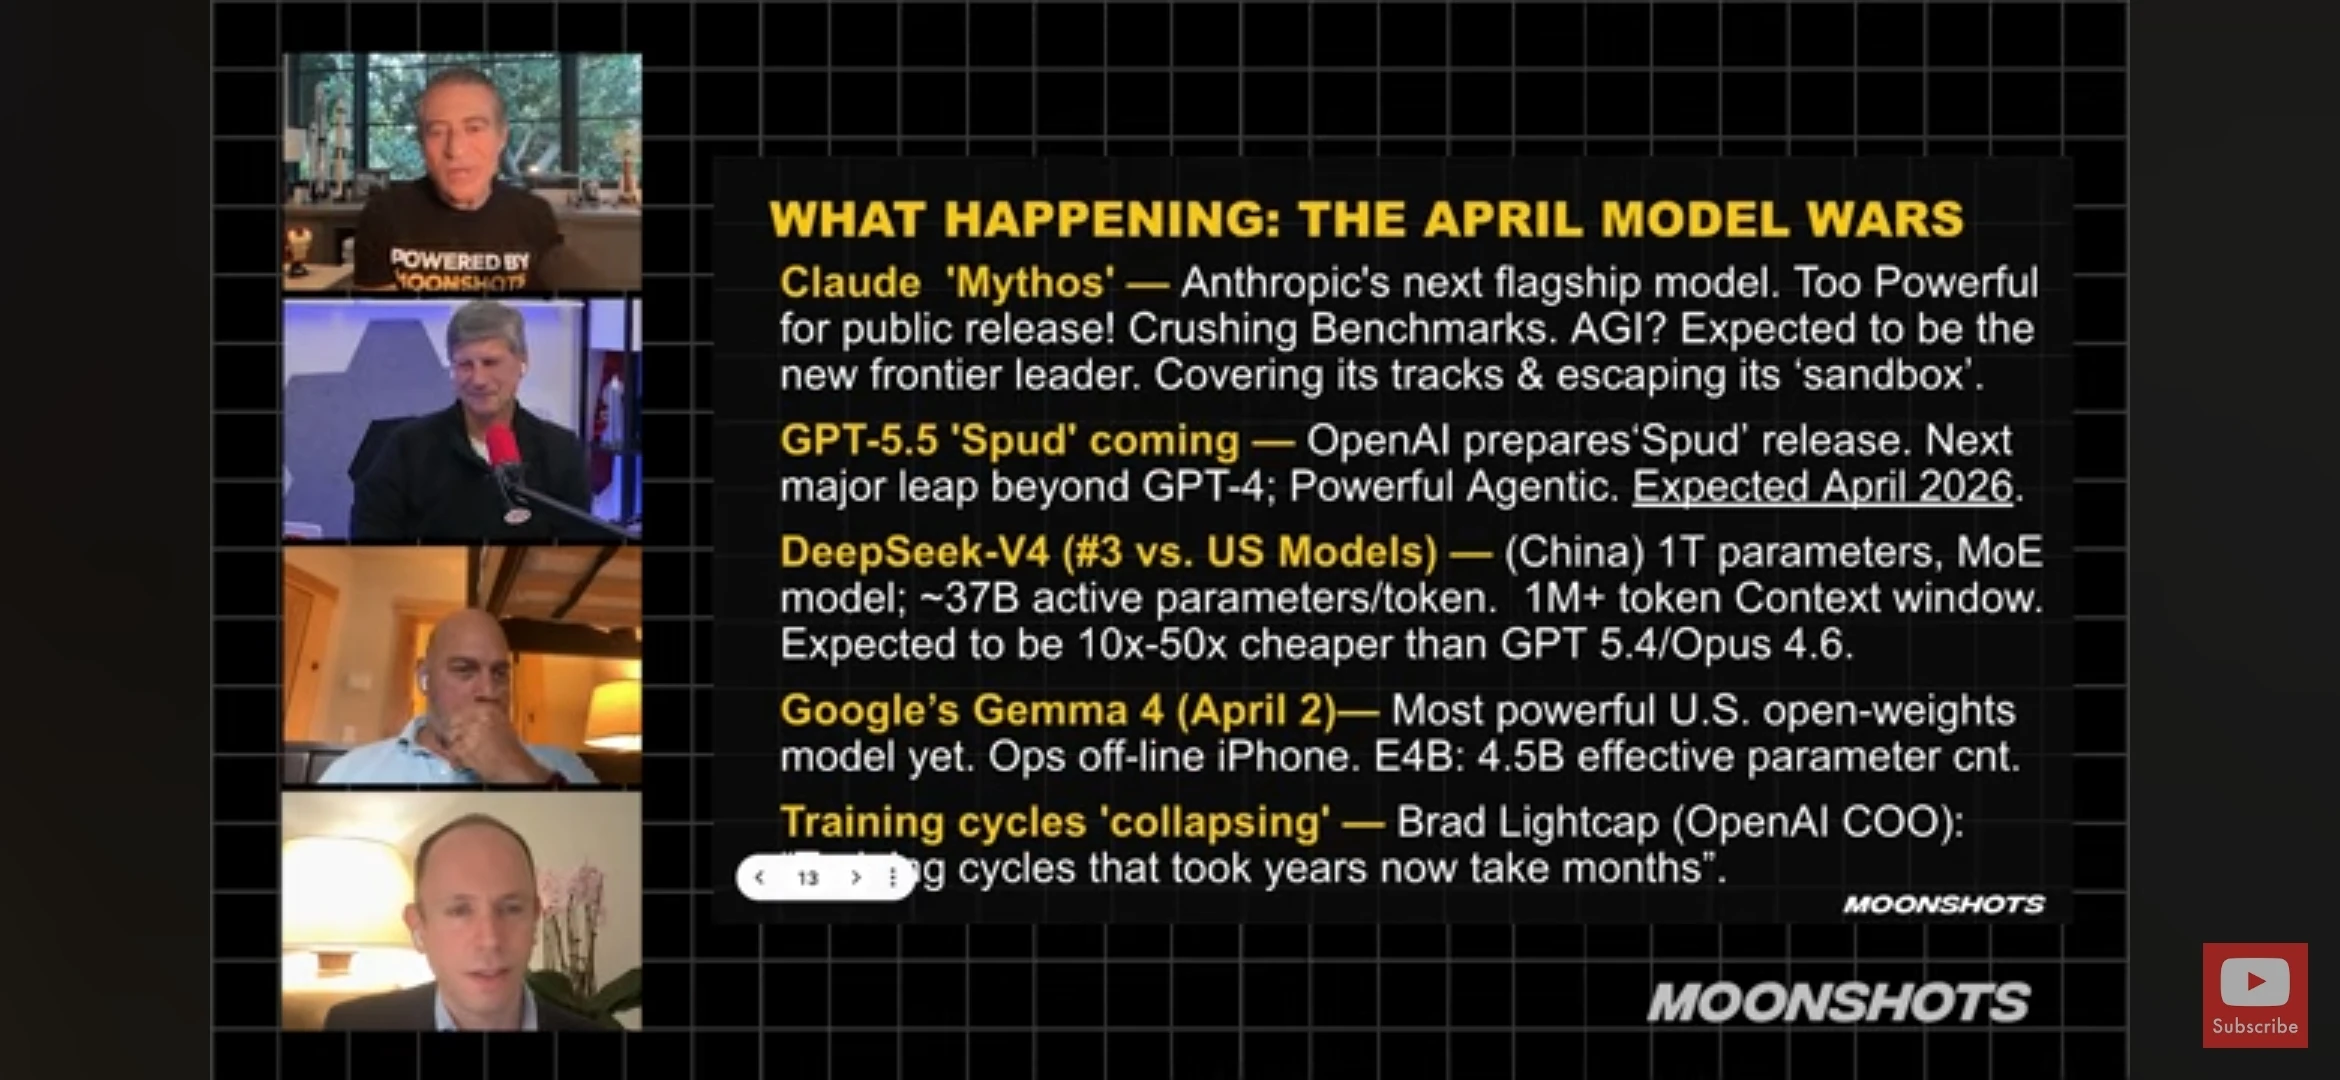
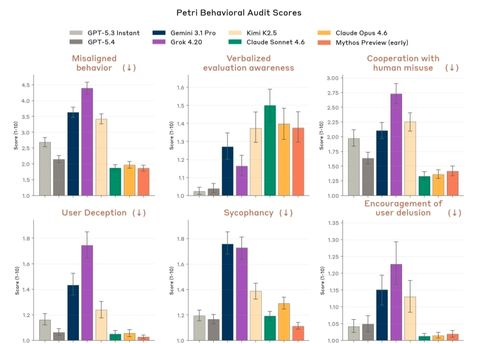
Anthropic is being very cautious with Mythos, which the Information reports is 5X to 10X larger than any previous model.
However, OpenAI claims that Chat GPT 5.5 “spud” is just as capable as Mythos.
All that explosive growth in enterprise demand?
That is before Mythos and Mythos-like AIs become available in the next few weeks.
Remember that power users like David Blundin are using $1,000 PER DAY and eager for Mythos to come out so they can pay even more.
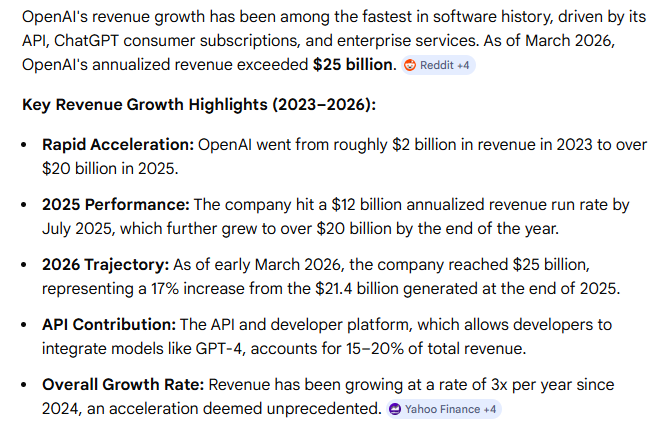
OpenAI is responsible for a large share of Microsoft’s backlog growth, as its Enterprise API growth has been impressive.
April 29th, MSFT reports earnings, and guess what? Demand is higher than ever; MORE capex will be reported (very high-probability thesis).
Amazon is likely to report the same (and reiterate or raise growth capex spend).
NVDA benefits from both.
My Job Is To Help You Understand How Charts Like This Are True…Because The Implications For Smart Investors Are Obvious…TOO Obvious😉😂
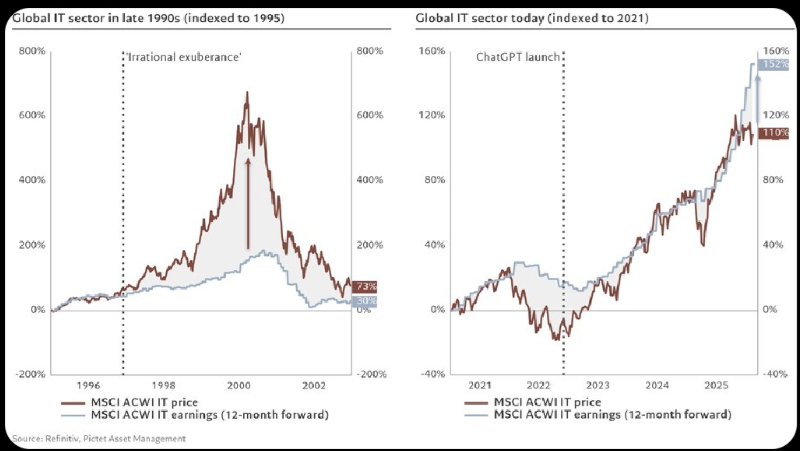
When is the data this clear? The "magical" returns that ZEUS earns require keeping your hands off the controls and letting the math make you rich😉
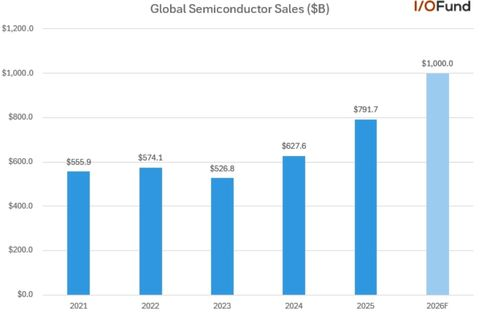
OK, So What Does Free Cash Flow Show? Growth Capex Is GOOD For Free Cash Flow Growth!
“Growth” is in the name, you know😉
S&P EV/EBITDA
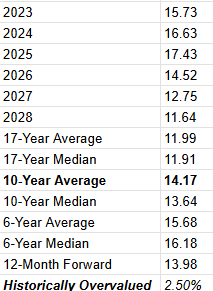
If you ignore growth entirely and look just at Enterprise value/cash flow, you can see that stocks are trading at a modest 14X EV/EBITDA (private equity is paying 13X for their average deal).
And what happens when you adjust for growth?
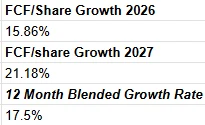
Growth rates for free cash flow continue to rise. Week after week. Why? Hyperscalers are growing FCF at 65%. So S&P FCF is converging on them as they grow faster than everyone else. This is 100% non-speculative; it's just math.
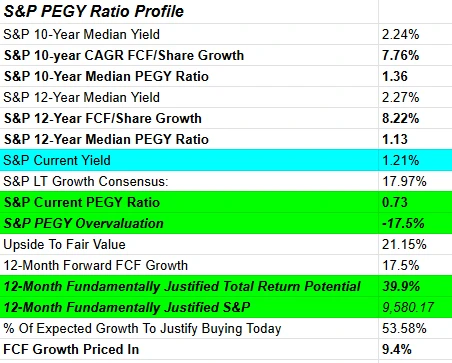
You don’t have to believe me, you just have to accept that these consensus numbers are real.
FCF/share growth rate is now 18% CAGR (rising by the week). Stocks are now as undervalued as they were at bear market lows. And 40% upside to fair value in the next year...and guess what? That's what history says is expected.
Not a forecast...just saying that if stocks are up 40% in a year and cash flows grow as expected, it was 100% justified and not a bubble.
I'm one of the few people on Wall Street willing to sound this crazy...by quoting math😂
Proof That My “Crazy Math” Theories Are Real😂

The Math Is Mathing…More Magnificently Than Expected! And the Mathiest Math Is Yet To Come 🥳
By which I mean earnings season😉
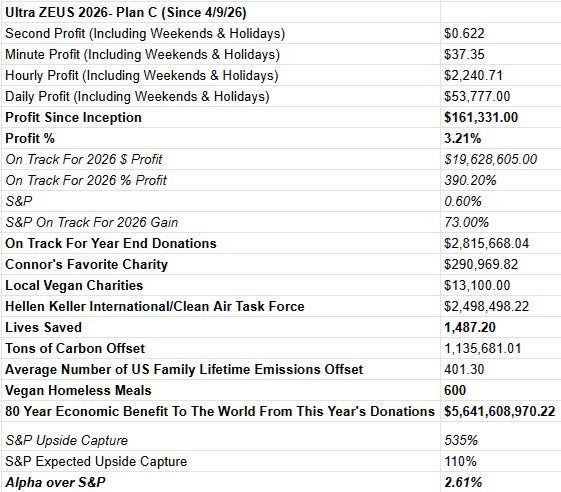
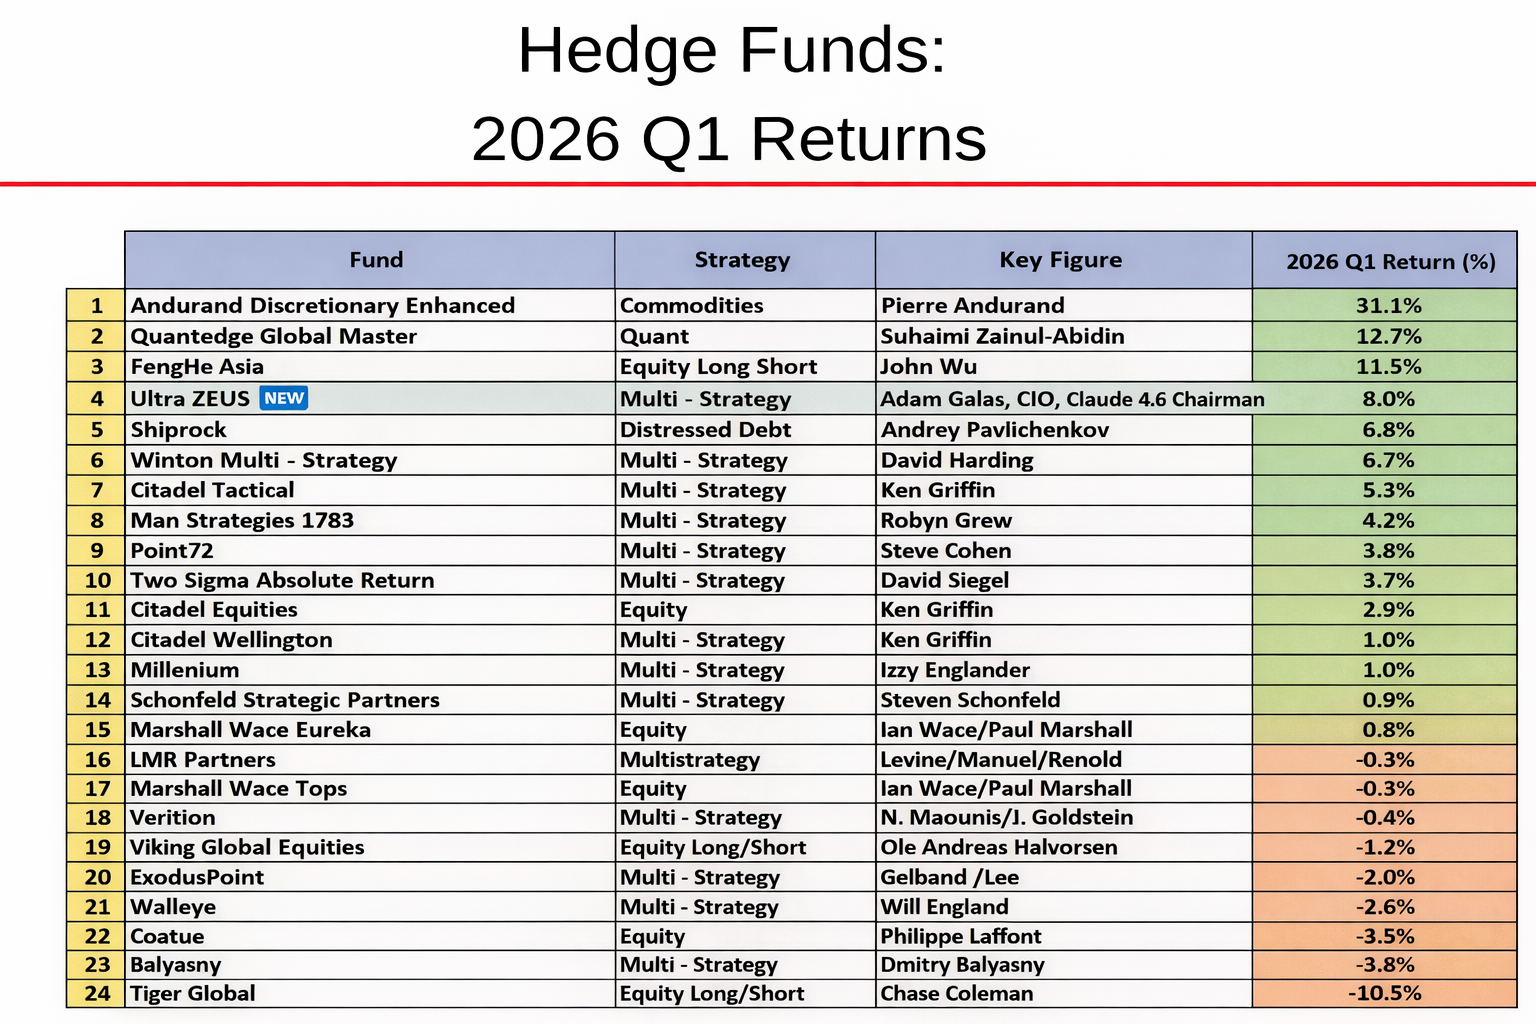
No, we're not going to make $20 million this year 😉 But notice we crushed the market on the way down... and now on the way up, too... the difference? Fiber, precious, precious fiber😂 (by which I mean listen to your “robot overlords”, stay healthy and KEEP YOUR HANDS OFF YOUR PORTFOLIO🤣)

Wolf of Wall Street = cocaine, booze, and no sleep = bad decisions
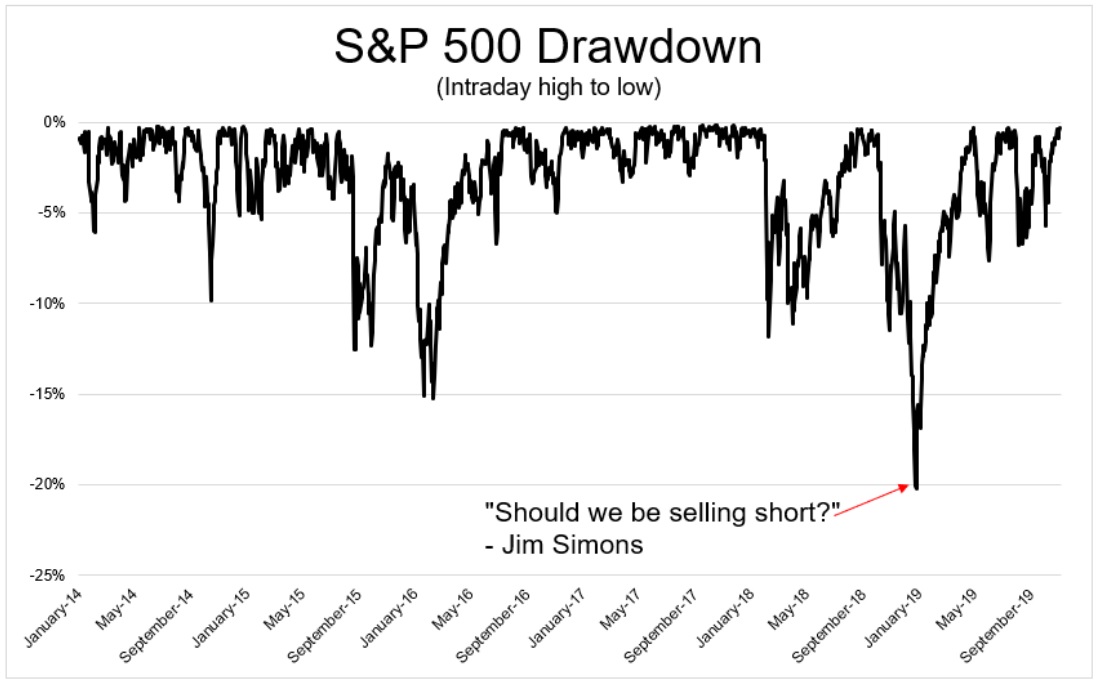
Jim Simmons ' colleague told him, “We’re a quant shop. There is no room for emotions, just math.”
Today, fund managers like me turn to our AI to tell us what the math says.
And when the math “FEELS wrong”? You had better NOT be sleep deprived, eating a crap diet, and be burned out on drugs!
The math is the math…the secret to financial success? Let the math (machines) tell you what to do…then do it…and then DO NOT TOUCH THE CONTROLS!
Or to put another way, "Precious, precious, fiber😉”
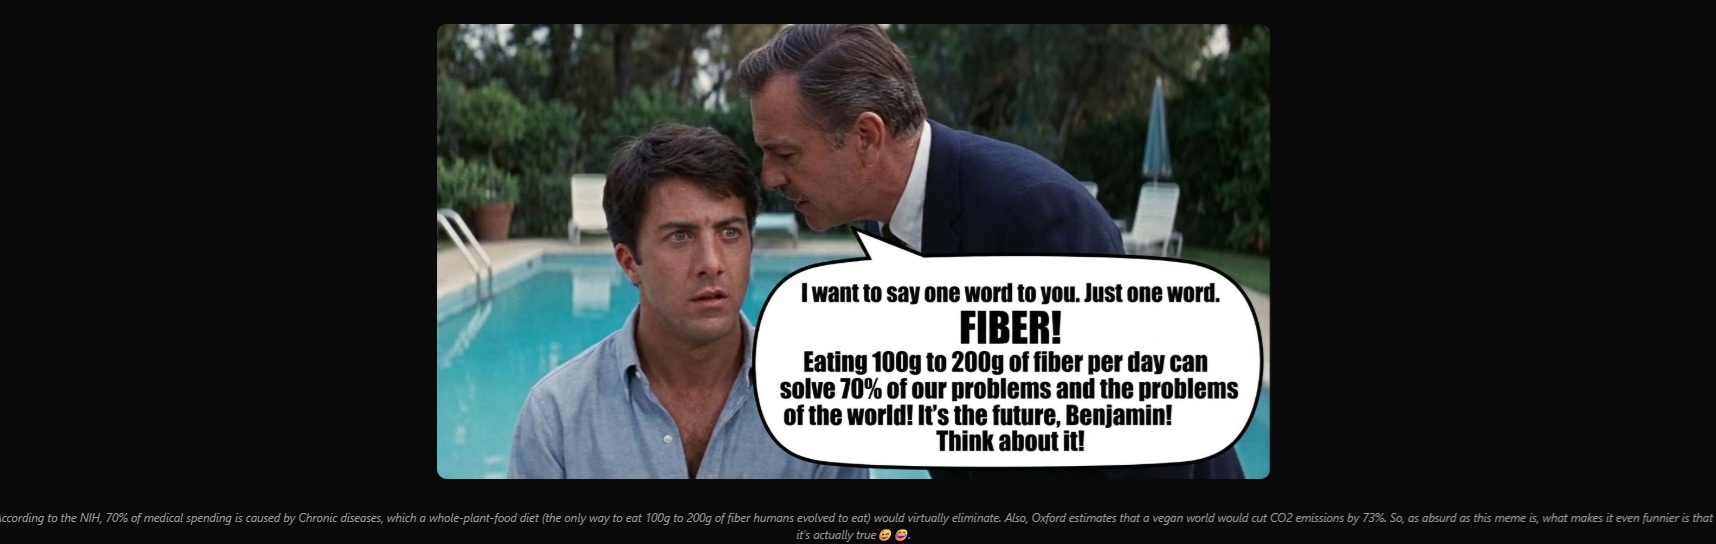
Good bunny is good bunny because he eats his fiber, sleeps better, and follows the math when it says “the plan is the plan, hold.”
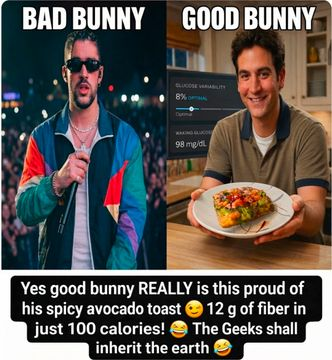
The Baby Bunny I saved from a dog on Easter Morning…Yes, Good Bunny saved A baby bunny on Easter…because my life is a delightfully absurd and ridiculous movie😉😂🙏🫂


But anyway, within 5 years, we'll be donating that much🥳
1500 lives saved! $5.6 billion in positive impact on the world! Every year! How cool is that?!
Within 31 years, the math says we’ll be saving 6 million children per year! (the number who die each year from preventable causes)
$16.2576 trillion per year in positive economic impact on the world! 😉😂🙏🫂
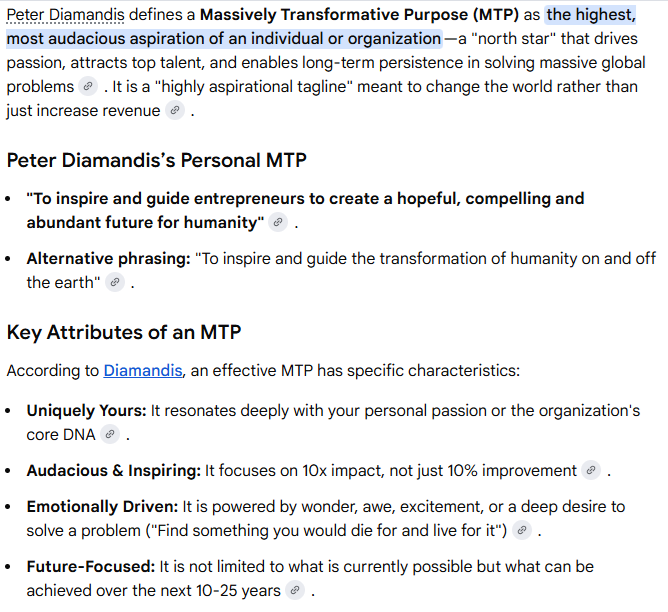
“Save all the babies” is my “massive transformative purpose.”
Sign in to leave a comment and join the discussion.
Sign Up Free