
OVERTURE: THREE WEDDINGS AND A FUNERAL😉… AND Elon's $240 TRILLION Fever Dreams😂🤣
When Voyager turned around and took the Pale Blue Dot photograph in 1990, three of the four companies in this report did not exist.

Amazon was four years away. Google was eight. Meta was fourteen. Only Microsoft was out there in the dark, selling floppy disks.
Thirty-six years later, those same four companies spent ONE HUNDRED SEVENTY BILLION DOLLARS — in ninety days.
Let me count that out loud, because your brain will not do it for you. That's $1.87 billion a day. Seventy-eight million dollars an hour. Roughly twenty-one thousand dollars every second, continuously, through every weekend and holiday of the quarter, while you slept 🤯
NASA's entire annual budget is about $25 billion. So four companies just spent about seven years of NASA in one fiscal quarter.
On what? On teaching sand to think. And I want to be precise here, because it sounds like a metaphor and it is not: it is a description of a supply chain. Beach sand, melted to nine nines, etched with switches smaller than a virus, stacked in racks that each draw more power than a city block, cooled by water, fed by turbines with a four-year waiting list.
Four earnings reports in four days. Three weddings and a funeral 😉
Hyperscaler Earnings Podcast
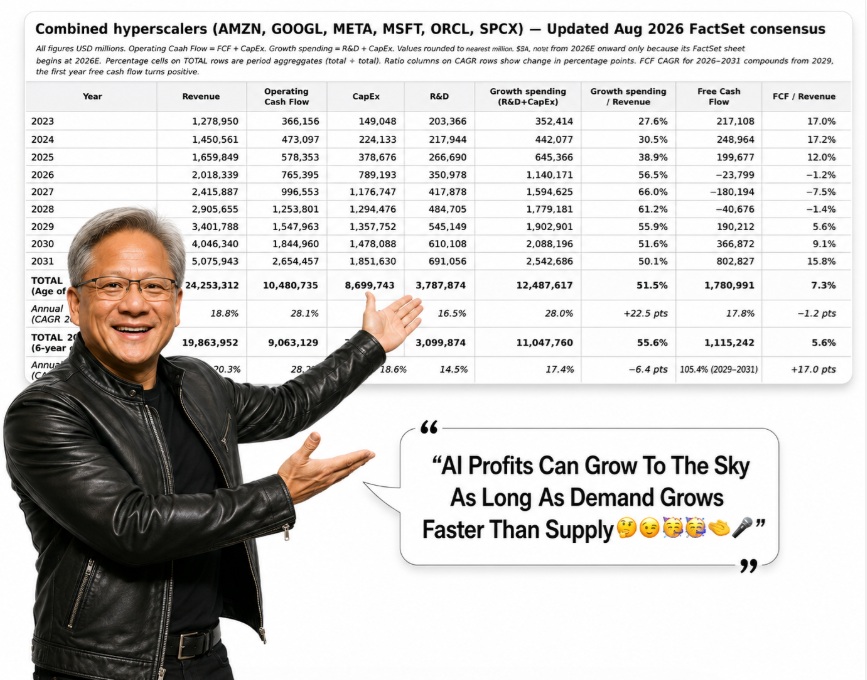
31% of all capex + R&D spending in the world is expected to come from the 6 hyperscalers in 2031.
1.8X more than the R&D of the EU, US and Chinese governements + all infrastructure spending from the G20.
In 2027 hyperscaler growth spending surpasses growth spending of the G20.
$21,000 per SECOND ov and $27,778 per second in the 2nd half of 2026 ($2.4 billion per day).er the last 6 months
And other incredible fun facts about this quarter’s unprecedented hyperscaler earnings.
THE THREE WEDDINGS
Microsoft threw the wedding everyone hoped for. Azure grew 43% — ACCELERATING, after eight straight quarters of analysts confidently forecasting the slowdown that keeps not arriving. Operating margin went UP while capital spending rose 71%. Long-term debt went DOWN. And the backlog reached $678 billion, which is two full years of the entire company, already signed.
Amazon threw the wedding where the caterer arrived with a fifty-three-billion-dollar cake nobody ordered. AWS grew 36.8%, its fastest in EIGHTEEN QUARTERS, at a $169 billion run rate — and the backlog hit $496 billion, up 36% in a single quarter. Then a non-operating mark on a private investment turned the headline EPS into a number you should not put in your model. We'll strip that down to $1.95 in Movement Three and show you why the real quarter was better than the fake one 😂
Alphabet threw the wedding with the receipts. Capital spending DOUBLED. The cloud backlog reached $514 billion — up from $106 billion a year ago (385% YoY growth). And the full-year capex guide got raised for the third quarter running, to $195–205 billion, with management saying 2027 will be higher still.
AND THE FUNERAL
Meta. Revenue accelerated to 28% growth — the FASTEST of the four — and operating income FELL 8%. Margin went from 43% to 31% in four quarters. Free cash flow: seven hundred eighty-four million dollars, on sixty billion of revenue. Capital spending consumed 97.5% of every operating dollar.
But here's the thing about that funeral, and it's the most interesting sentence in this entire report: it wasn't for the company. It was for the margin. And Meta dug the grave itself. R&D went from 27% of revenue to 36% — deliberately, in one year, to buy a seat at the superintelligence table. Whether that was a burial or an investment is a question that resolves in 2027, not today 🙏
NOW LET ME TAKE A VICTORY LAP, BECAUSE I EARNED IT 😉
On June 26th I published the third installment of "Shut Up And Buy These 5 Smart Stocks And You'll Thank Me In A Year 😉😂🥳" The first two nailed the exact bottoms of their corrections.
Here is what that piece said, five weeks ago, while tech was getting slaughtered — Oracle down 54%, Microsoft down 35%:
The hyperscalers are trading at a PEGY of 0.53 against a 0.93 historical average. A 44% discount. Microsoft at 0.55. Amazon at 0.52. Oracle at 0.33. AMZN and MSFT are showing signs of bottoming today. Investors worry about a tech bubble BUT objective fact shows this is an ANTI-bubble — and big tech earnings week at the end of July is the likely catalyst.
I did not write "stocks feel cheap." I wrote a number, a discount, a mechanism, and a dated catalyst. That's a falsifiable claim with a deadline on it, which is the only kind worth making.
The deadline arrived last week.
THE CHART BELOW IS THE RECEIPT.
This Is Fundamentally Justified “Luck” 😉
Including SpaceX and its 54% decline from post IPO highs😂
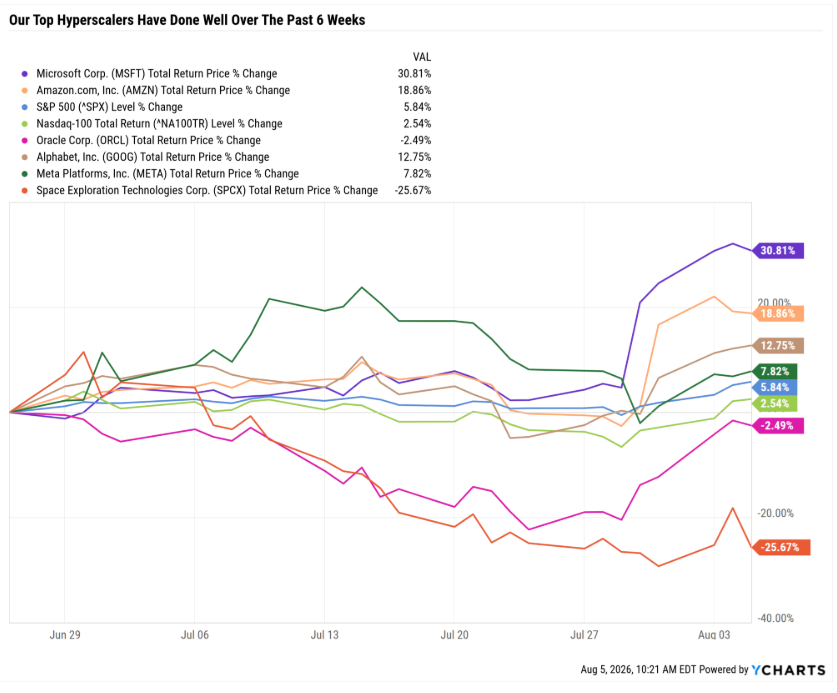
That green wall is what a PEGY of 0.53 looks like five weeks later. Microsoft alone jumped roughly 13% in a single session on its print. And nobody quoted the 10% decline in Xbox revenue, because nobody cared, because the only thing that mattered was the cloud and the backlog — which is exactly what the June piece said would matter 🤯
Now look at the red line, because it's the other half of the record. On June 11th we published a four-part series on the SpaceXAI IPO, and the verdict was: NO at the open. Not no forever. Great company, wrong price, maximum hype. Buy the math, not the myth. It is now down 54% from its post-IPO highs.
Same two weeks. Same method. Same single tool. One call to buy the anti-bubble, one call to skip the actual bubble — and neither one required a crystal ball. PEGY said the hyperscalers were trading 44% below their own historical multiple. The S-1 said SpaceXAI wanted 94 times sales while burning $5 billion a year.
Neither of those was a prediction. Both were a READING. When the market prices in 10.1% free cash flow growth against a consensus of 18.9%, you are not forecasting — you are reading a discount that already exists on the page. The multiple confesses what the market believes. Divide it out and the confession is right there.
Asked and answered. By the cold hard facts. Every single quarter 😂
THE COVENANT, AS ALWAYS
Accept any number, no matter how big — but only after meticulously confirming it's true.
And that cuts both ways, so let me put the other column on the table while the victory lap is still warm.
This week our own commentary contained four wrong numbers. We said "six consecutive quarters of AWS acceleration" when it was four. We led an infographic with "650 basis points of margin expansion" without disclosing that the comparison quarter was AWS's trough. We said "operating cash flow guidance" twice about a company that guides operating income. We put returns on capital at 30-35% when the defensible figure was 23.8%. Every one of those was corrected in public the same evening 🥺
We stripped every headline EPS down to what operations actually earned. We put four different capex definitions onto the same basis, which is the single most common error in AI reporting and one we made ourselves on Thursday. We ran the return on invested capital six different ways and published all six, including the ones that don't flatter the thesis.
Because a desk that only publishes its wins is not a desk. It's a brochure 😉
THE ONE QUESTION
Strip away every headline and this quarter asked exactly one thing: is the spending justified, or is this the largest capital misallocation in corporate history?
There is a way to answer that, and it isn't a vibe. Contracted backlog — signed customer commitments — grew 186% across the group. Capital spending grew 79%.
A ratio of 2.35 to one. Every dollar of capex is chasing more than two dollars of demand somebody has already promised to pay. That is not an overbuild. That's a shortage, and it's widening — the gap was 85 points last quarter and it's 108 now.
Free cash flow fell almost everywhere. At Amazon it went NEGATIVE. And in a market this supply-constrained, that is not deterioration. It's a receipt for next year's capacity.
HOW THIS REPORT RUNS
Six movements, because that is how you eat a hundred and seventy billion dollars 😂
Movement One: MICROSOFT — three different earnings numbers sixteen points apart, an Azure growth rate that ACCELERATED past 43% while every analyst on Earth forecast the opposite, and a backlog that quietly grew larger than two full years of the entire company.
Movement Two: META — where twelve points of operating margin went in four quarters, why it wasn't the metaverse, and the one metric that says the AI is working ANYWAY. Plus the structural fact nobody says out loud: Meta is the only one of the four with no signed order book to point at 🥺
Movement Three: AMAZON — the fifty-three billion dollar asterisk, the first negative free cash flow of the cycle, AWS accelerating for four straight quarters, and SIX different ways to measure whether the capital earns its keep. We published all six. Including the ones that don't flatter us 😉
Movement Four: ALPHABET — the widest gap between reported and real earnings any company has ever handed me, ninety-four billion dollars of stock they are legally forbidden to sell, Google quietly becoming a chip vendor inside its own cloud line, and the moment the world's greatest buyer of its own shares stopped buying entirely and started RAISING money instead 🤯
Movement Five: SPACEX — the sixth hyperscaler. The one that is spending like the other five and earning like a startup. Consensus says $1.2 TRILLION of capital expenditure through 2031, negative free cash flow every single year of it, and a stock down 54% from its post-IPO highs — which we called on June 11th, before the open, with arithmetic 😱
Movement Six: THE NEXT FIVE YEARS — where this actually goes. Roughly $2.4 billion a day today, and the consensus says every single year through 2031 is bigger. We'll show you the number, the physics that could stop it, and the TRIP WIRES: every claim in this report gets a gauge, a current reading, and the exact public signal that would prove us wrong.
Wonder, audited.
MOVEMENT ONE — MICROSOFT: THE COMPANY THAT OUTGREW ITSELF
Let me start with a confession. I love earnings season the way other people love the Super Bowl, and this year Microsoft kicked off with a number I had to read three times.
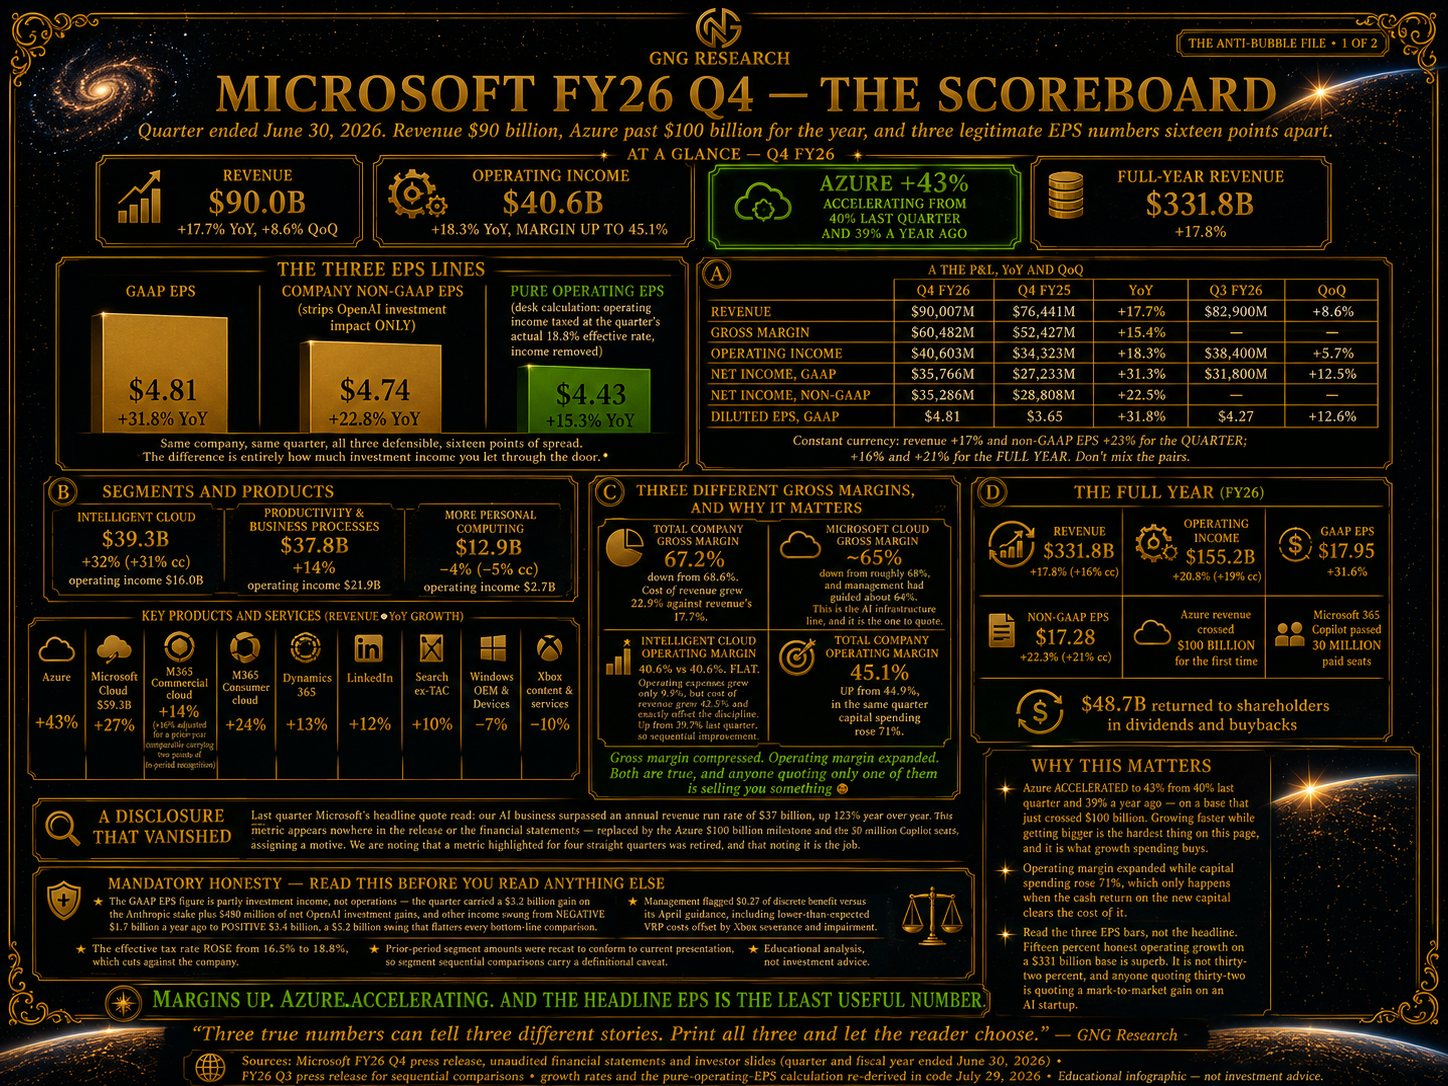
$90.0 billion in revenue. Up 17.7%. Operating income of $40.6 billion, up 18.3%. Azure crossed $100 BILLION in annual revenue for the first time in human history, and Copilot passed 30 million paid seats.
Ninety billion dollars. In ninety days. That's a billion dollars a day, weekends included, from one company in Redmond that used to sell floppy disks 🤯
Now let me show you something delightful. Microsoft reported THREE different earnings per share this quarter. All three are true. Watch.
GAAP diluted EPS: $4.81, up 31.8%! Gorgeous! Put it on a banner!
Microsoft's own non-GAAP EPS: $4.74, up 22.8%. This strips out exactly one thing — the OpenAI investment impact, worth $480 million.
But look at what it does NOT strip 😉 Other income swung from NEGATIVE $1.7 billion a year ago to POSITIVE $3.4 billion. A $5.2 billion swing. And sitting inside it is a $3.2 billion gain on Microsoft's stake in Anthropic. Management even flagged $0.27 of discrete benefit versus its own April guidance.
So we did what this house always does. Take operating income of $40.6 billion. Tax it at the quarter's ACTUAL 18.8% rate. Divide by 7,443 million diluted shares. Strip every single dollar of investment income out of the picture.
PURE OPERATING EPS: $4.43, up 15.3%.
Read those three again. Thirty-two. Twenty-three. Fifteen. Same company. Same ninety days. All three legitimate. SIXTEEN POINTS of spread depending entirely on how much investment income you let sneak through the door 😂
Fifteen percent operating growth on a $331 billion revenue base is spectacular. It's just not thirty-two. And anyone quoting thirty-two at you is quoting a mark-to-market gain on a private AI startup, which is a wonderful thing to own and a terrible thing to call earnings.
Now. The number that actually mattered.
AZURE GREW 43%. UP FROM 40% LAST QUARTER. UP FROM 39% A YEAR AGO.
45% Azure growth guidance for this next quarter.
Amy Hood guided 39 to 40 percent back in April, against what she herself called a difficult comparison. It came in at 43 and ACCELERATED — on a base that just crossed a hundred billion dollars 🤯
Do you understand how hard that is? Growing 43% is easy when you're small. Growing 43% FASTER while getting bigger is the corporate equivalent of running the second mile quicker than the first, uphill, at altitude.
The deceleration everybody has been forecasting for EIGHT CONSECUTIVE QUARTERS keeps refusing to show up. At some point you have to update the model instead of the excuse 😂
The segments: Intelligent Cloud $39.3 billion, up 32%. Productivity and Business Processes $37.8 billion, up 14%. More Personal Computing $12.9 billion, DOWN 4%, with Xbox content and services off 10% and taking impairment charges. Microsoft has become a cloud and AI company with a consumer division attached, and the market figured that out two years ago.
Now the cash, because this is where the bears will point and shriek.
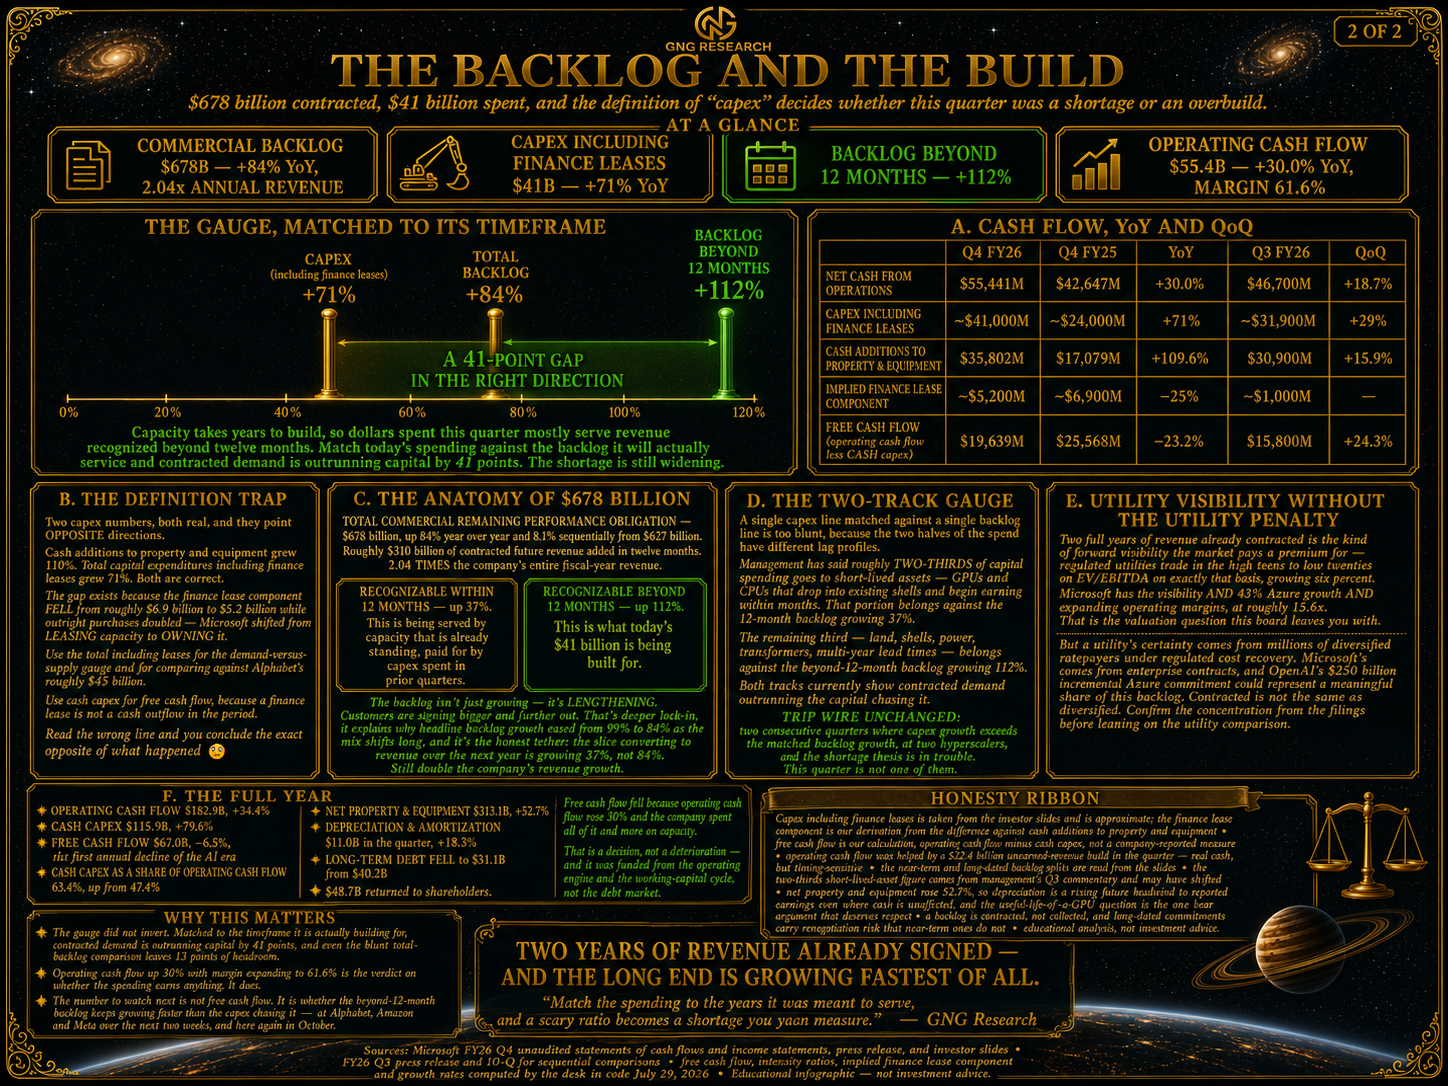
Operating cash flow: $55.4 billion, UP 30.0%. Capital expenditures including finance leases: about $41 billion, up 71%. Free cash flow: $19.6 billion, DOWN 23.2%.
Guess which one becomes the headline? 🤣
But do the arithmetic instead of the vibes. Free cash flow fell for exactly ONE reason: operating cash flow grew 30% and capital spending grew 71%. There is nowhere in that sentence where the business made less money. It made $12.8 BILLION MORE cash than the same quarter last year. Then it took all of it, and more, and put it in the ground.
And here's the tell that separates a company building from a company dying: operating cash flow MARGIN expanded, 55.8% to 61.6%. The cash engine got BETTER while the spending exploded 🥰
The "capex destroys margins" thesis also died in this quarter, quietly, with no funeral. Operating margin EXPANDED to 45.1% from 44.9% while capital spending rose 71%.
Honest tether, because we're GNG: GROSS margin went the OTHER way, 67.2% from 68.6%, because cost of revenue grew 22.9% against revenue's 17.7%. That IS the AI infrastructure showing up on the income statement. Both things are true, and anybody quoting only one of them is selling you something 😉
And then the backlog.
Commercial remaining performance obligation: $678 BILLION. Up 84%.
Roughly $310 billion of contracted future revenue added in TWELVE MONTHS. And it's now 2.04 TIMES Microsoft's entire fiscal-year revenue. Two full years of Microsoft. Already signed. Sitting in a filing cabinet 🤯
Here's the detail almost nobody reported: the near-term book grew 37% while the beyond-twelve-month book grew 112%. The backlog isn't just growing. It's LENGTHENING. Customers are signing bigger and further out. That's not enthusiasm, that's lock-in.
One last thing, because this house notices what disappears. Last quarter Microsoft's headline quote bragged about an AI business at a $37 billion run rate, up 123%. This quarter that metric appears NOWHERE. Vanished. Replaced by the Azure milestone and a Copilot seat count.
We assign no motive. We simply note that a number Microsoft highlighted for four straight quarters was quietly retired, and that noticing is literally our job 😉
MOVEMENT TWO — META: THE FUNERAL FOR A MARGIN 🥺
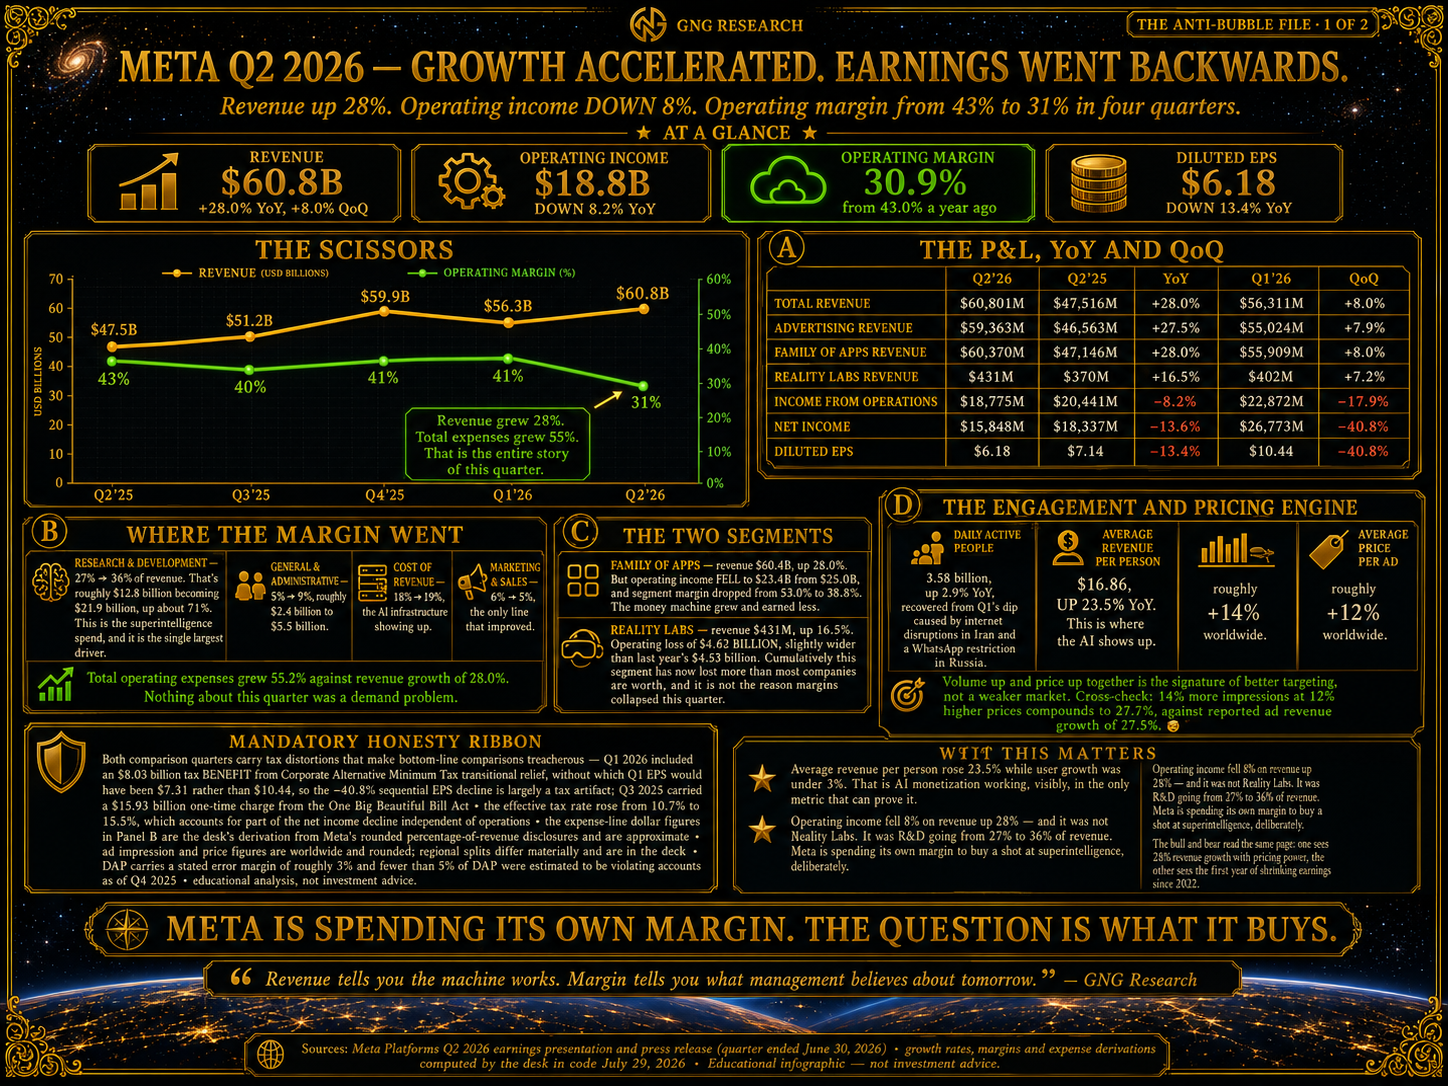
Meta posted $60.8 billion in revenue, up 28.0% — the FASTEST growth of all four. Advertising up 27.5%.
And operating income FELL 8.2%.
Read that pair twice. Revenue up 28%. Operating income DOWN 8%. That's the whole quarter in one sentence, and it's the strangest sentence any hyperscaler produced this season.
Net income down 13.6%. Diluted EPS $6.18 against $7.14. Operating margin from 43.0% to 30.9%.
TWELVE POINTS of margin. Gone. In four quarters. Last quarter it was 41%.
That's not a drift. That's a table being pulled out from under a china cabinet 😱
Now here is what every lazy write-up is about to get wrong, and I mean EVERY one:
THIS WAS NOT REALITY LABS.
Reality Labs lost $4.62 billion against $4.53 billion a year ago. The loss widened by EIGHTY-NINE MILLION DOLLARS. On a sixty-billion-dollar revenue base, that's a rounding error. The metaverse is a large, expensive, ongoing decision that I have made fun of at length elsewhere 😂 — but it is not what happened in Q2 2026.
What happened is inside Family of Apps. The money machine grew revenue 28.0% and its operating income FELL, from $25.0 billion to $23.4 billion. Segment margin collapsed from 53.0% to 38.8%.
The most profitable advertising system ever built earned LESS money on 28% MORE revenue 😭
So let's find the leak. Total operating expenses grew 55.2% against revenue growth of 28.0%. When your costs compound at twice your revenue rate, margin compression isn't a surprise. It's arithmetic. It's not even hard arithmetic.
Meta discloses expenses as a percentage of revenue, so the leak has an actual address: RESEARCH AND DEVELOPMENT WENT FROM 27% OF REVENUE TO 36%. Roughly $12.8 billion becoming roughly $21.9 billion. Up about 71%.
That is the superintelligence bill arriving in the mail. Compute, data, and the most expensive AI talent market in the history of labor 🤯
General and administrative: 5% to 9%. Cost of revenue: 18% to 19%. Marketing and sales was the ONLY line that improved, 6% down to 5%.
Now the part the bears will skip right past, so let me hold it up to the light 😉
Average revenue per person: $16.86. UP 23.5%.
Daily active people: 3.58 billion. Up just 2.9%.
STOP. Look at that ratio. User growth of THREE PERCENT. Revenue-per-user growth of TWENTY-THREE AND A HALF PERCENT.
Meta is not growing by finding new humans. It has already found 43% of humanity and there aren't many left in the aisle. It is growing by monetizing the SAME humans dramatically better — which is precisely, exactly, specifically what the AI was purchased to do 🤯
Go one level deeper and it gets better. Ad impressions rose roughly 14%. Average price per ad rose roughly 12%.
Volume UP and price UP at the same time. That is not a hot market. That is a BETTER PRODUCT. When your targeting improves, advertisers buy more units AND bid higher per unit. A hot market moves one of those. A better product moves both.
Cross-check it, because we always cross-check: 14% more impressions at 12% higher prices compounds to 27.7%. Reported ad revenue growth was 27.5%. The pieces reconcile to the whole 🥰
That's how you know it's a mechanism and not a story.
One tether, because we're GNG and we do this to ourselves too: impressions grew 19% LAST quarter and 14% this quarter, while pricing held flat at 12%. So the entire five-point revenue deceleration came from impression VOLUME. The AI is still earning its price premium. Inventory growth slowed. Watch that.
Then the cash. And this is the number that will define Meta's earnings season.
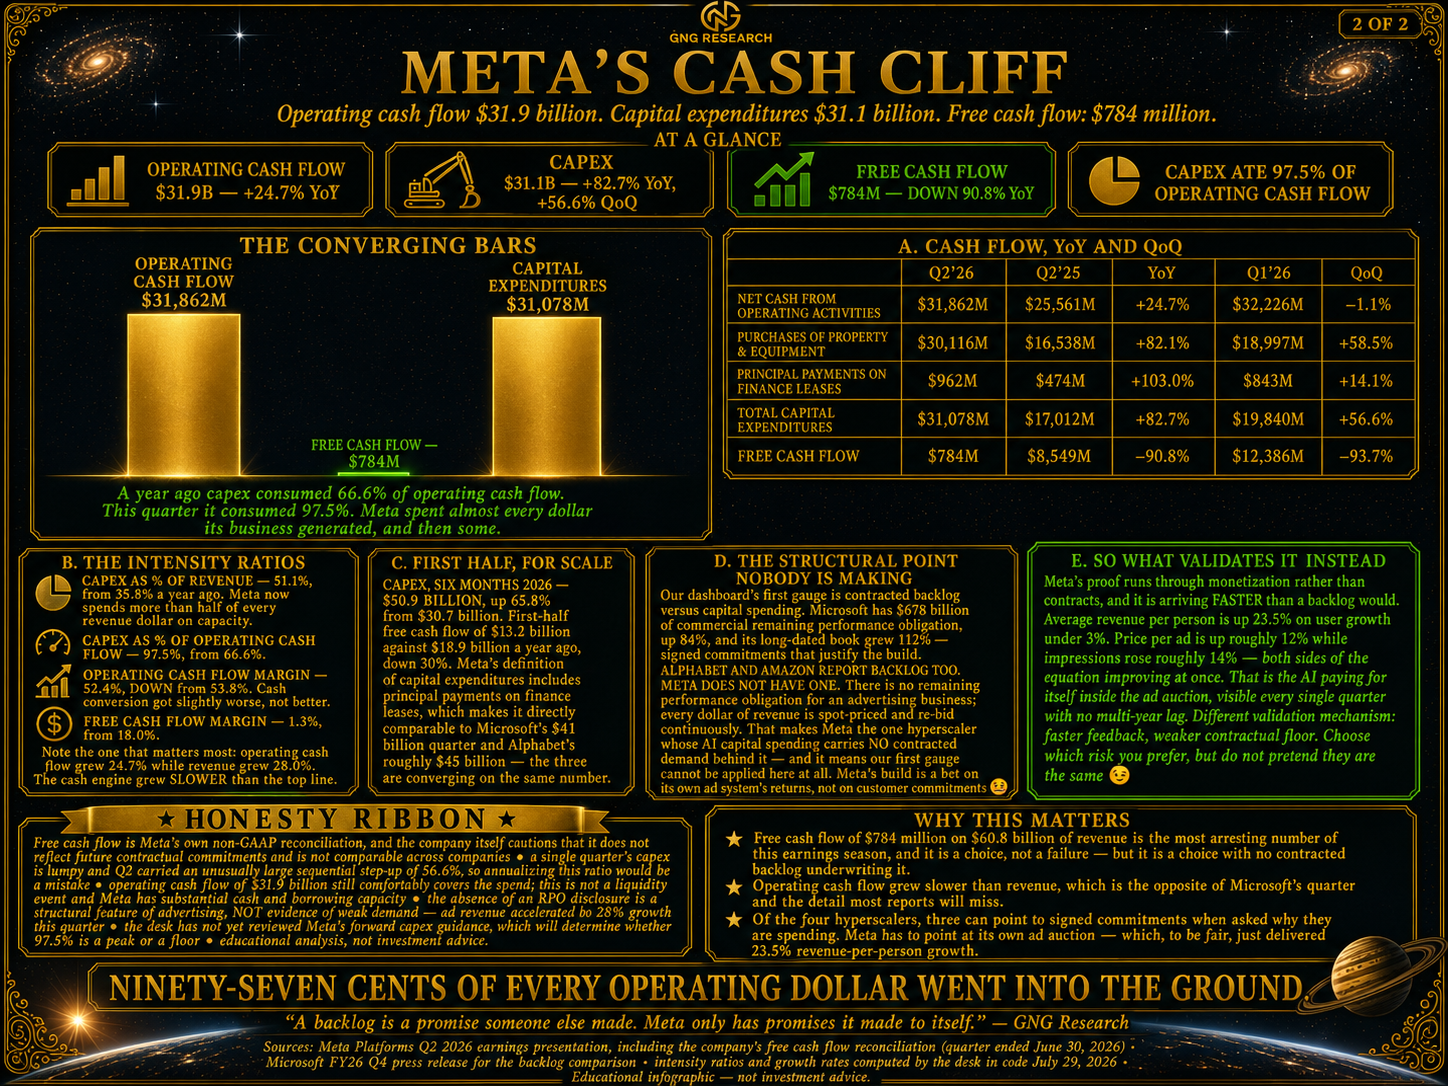
Operating cash flow: $31.9 billion, up 24.7%. Capital expenditures: $31.1 billion, up 82.7% and 56.6% SEQUENTIALLY. Free cash flow:
$784 MILLION.
Seven hundred eighty-four million dollars. On sixty billion dollars of revenue. A free cash flow margin of 1.3%, against 18.0% a year ago.
Meta made sixty billion dollars this quarter and kept roughly enough to buy a nice office building 😱
Capital spending consumed 97.5% of operating cash flow. Ninety-seven cents of every operating dollar, straight into the ground.
And here's the detail most reports will miss entirely: operating cash flow grew 24.7% while revenue grew 28.0%. The cash engine grew SLOWER than the top line. Cash margin slipped from 53.8% to 52.4%.
That is the exact opposite of Microsoft, whose cash conversion IMPROVED while it built. Both companies are spending like drunken sailors who happen to be structural engineers. Only one of them is currently improving the machine that funds it 🥺
Now the structural fact nobody is saying out loud.
Microsoft has $678 billion of contracted backlog. Alphabet reports one. Amazon reports one.
META DOES NOT HAVE ONE. And it cannot.
There is no remaining performance obligation in an advertising business. Every dollar is spot-priced and re-bid in an auction, continuously, forever. Advertisers do not sign three-year take-or-pay contracts for impressions. That's not a Meta failure — it's what advertising IS.
But it means Meta is the only one of the four whose AI capital carries zero contracted demand behind it. When the next recession lands, Microsoft's signed obligations still have to be paid. Ad budgets are the most cyclical line item in all of corporate America. Ask anyone who lived through 2008 🥺
To be fair to Zuck — and I want to be, because being unfair is boring — Meta's validation mechanism isn't missing. It's FASTER. Microsoft finds out whether its capex was justified over a multi-year revenue recognition schedule. Meta finds out by lunchtime, in the auction, every single day. Revenue per person up 23.5% IS that answer, arriving in real time.
Faster feedback. Weaker contractual floor. Pick your poison, but don't pretend they're the same poison 🙏
MOVEMENT THREE — AMAZON: THE $53 BILLION ASTERISK 🤯
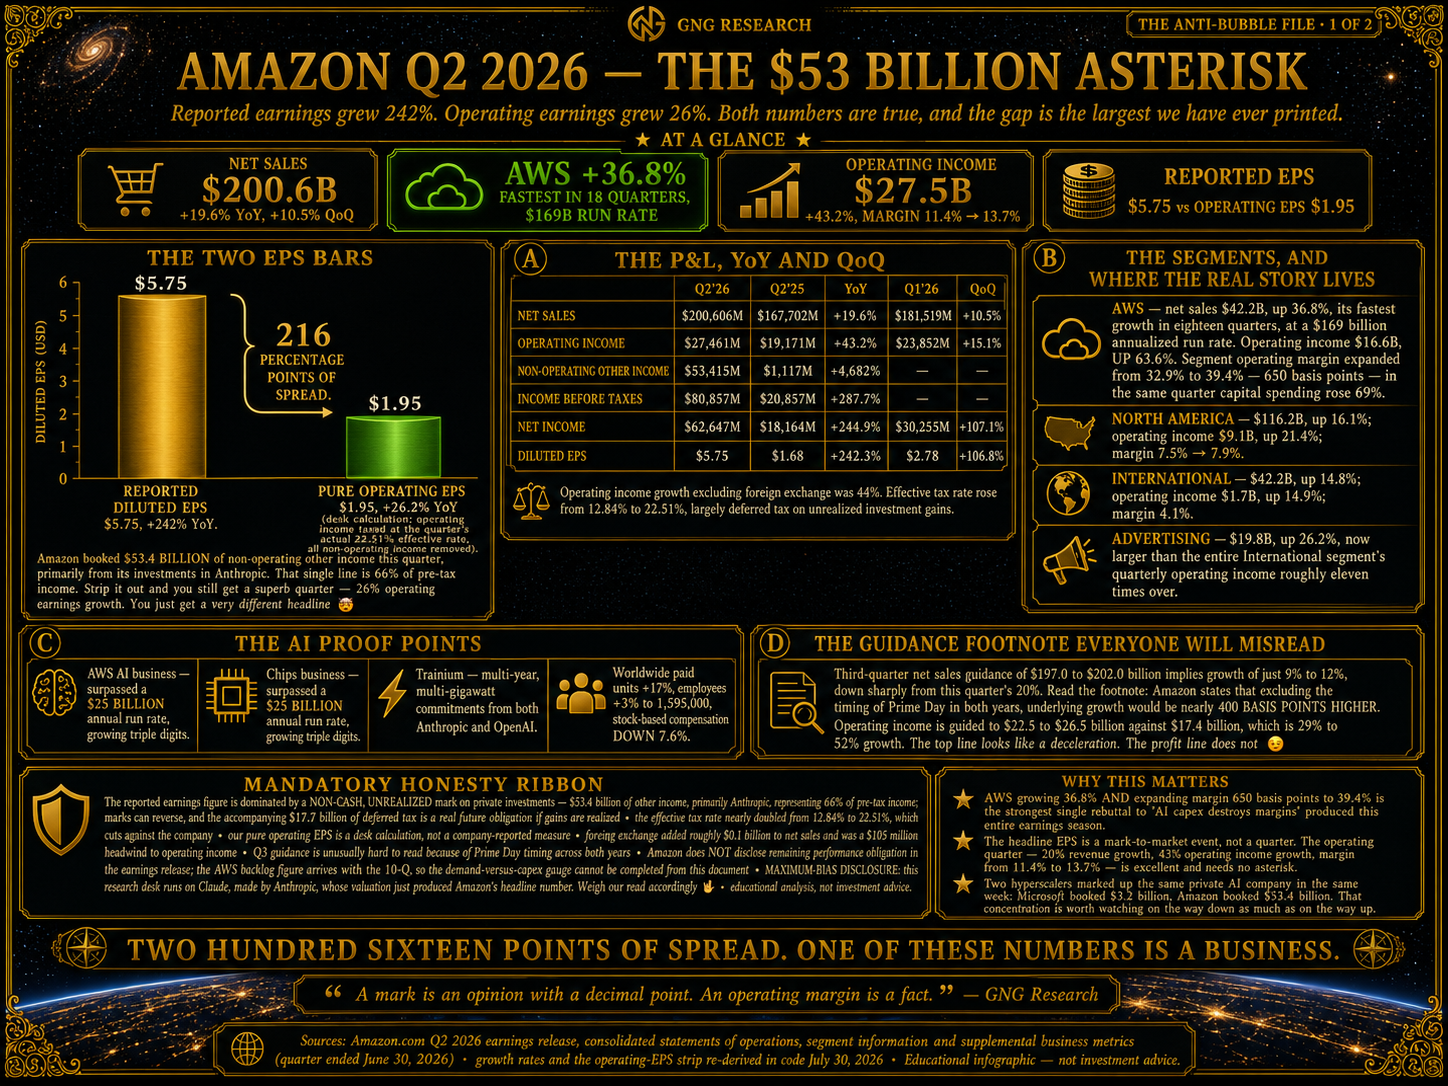
Amazon reported earnings per share of $5.75. Up 242%.
Do not put that number in your model. Do not put that number ANYWHERE near your model 😂
Here's what actually happened, and it's wonderful. Net sales of $200.6 billion, up 19.6%. Operating income of $27.5 billion, up 43.2%. Operating margin from 11.4% to 13.7%. That is a superb quarter that needed help from absolutely nobody.
Then, below the operating line, Amazon booked $53.4 BILLION of non-operating other income. Primarily from its investments in Anthropic. A year ago that same line was $1.1 billion.
Pre-tax income went from $20.9 billion to $80.9 billion. SIXTY-SIX PERCENT of Amazon's pre-tax income this quarter came from marking up a stake in a private company that has not been sold and cannot easily be sold.
Same knife we used on Microsoft. Operating income, taxed at the actual 22.51% rate, divided by 10,903 million shares, every dollar of investment income stripped:
PURE OPERATING EPS: $1.95, up 26.2%.
Reported: up 242%. Operating: up 26%.
TWO HUNDRED SIXTEEN PERCENTAGE POINTS of spread.
Microsoft's was sixteen and I called it a choose-your-own-adventure menu. Amazon just printed a spread THIRTEEN TIMES WIDER 🤣
Both numbers are legitimate! Neither is a lie! But one of them describes a company selling things to customers and the other describes an accountant having a very good day.
Notice what came WITH the gain, too: the effective tax rate nearly DOUBLED, 12.84% to 22.51%, and $17.7 billion of deferred income taxes appeared in the cash flow statement. Marks are free. Taxes on marks are not 😉
And full disclosure, because this one actually costs us something: THIS RESEARCH DESK RUNS ON CLAUDE, MADE BY ANTHROPIC. Amazon's headline number this quarter is a revaluation of the company that builds my research partner. Weigh our read accordingly 🖖
NOW. The part that actually matters.
AWS GREW 36.8%. ITS FASTEST IN EIGHTEEN QUARTERS. At a $169 billion run rate.
Look at the sequence: 17%, 17%, 20%, 24%, 28%, 36.8%. FOUR consecutive quarters of acceleration.
Two years ago the consensus was that Amazon had lost the AI race. That Andy Jassy was asleep. That Bezos should come back. Everyone was wrong, loudly, in print, with charts 😂
But here is the number that should stop you cold.
AWS operating income was $16.6 billion. UP 63.6%. Segment operating margin went from 32.9% to 39.4% — in the same quarter Amazon's capital spending rose 69%.
Honest tether, and it's an important one: Q2 2025 was AWS's TROUGH quarter, and on a trailing-twelve-month basis AWS margin is FLAT at 36.8%. The real story is a three-quarter sequential climb — 34.6%, 35.0%, 37.7%, 39.4% — which is genuinely impressive and doesn't need the flattering comparison. We caught our own chart crime before someone else did 😉
The supporting evidence is dense as a neutron star. AWS's AI business passed a $25 BILLION annual run rate, growing triple digits. The chips business ALSO passed $25 billion, triple digits. And Trainium won multi-year, MULTI-GIGAWATT commitments from both Anthropic AND OpenAI.
Sit with that one. Nvidia's biggest customers are now funding Nvidia's most credible competitor, and everyone involved is being EXTREMELY polite about it 🤣
The rest: North America $116.2 billion, up 16.1%. International $42.2 billion, up 14.8%. Advertising $19.8 billion, up 26.2%. Paid units up 17%. Headcount up just 3% to 1,595,000. Stock-based compensation DOWN 7.6%.
Revenue up 20% while headcount grows 3% and SBC SHRINKS? That's not cost control. That's operating leverage doing bench presses 🥰
Then the cash cliff.
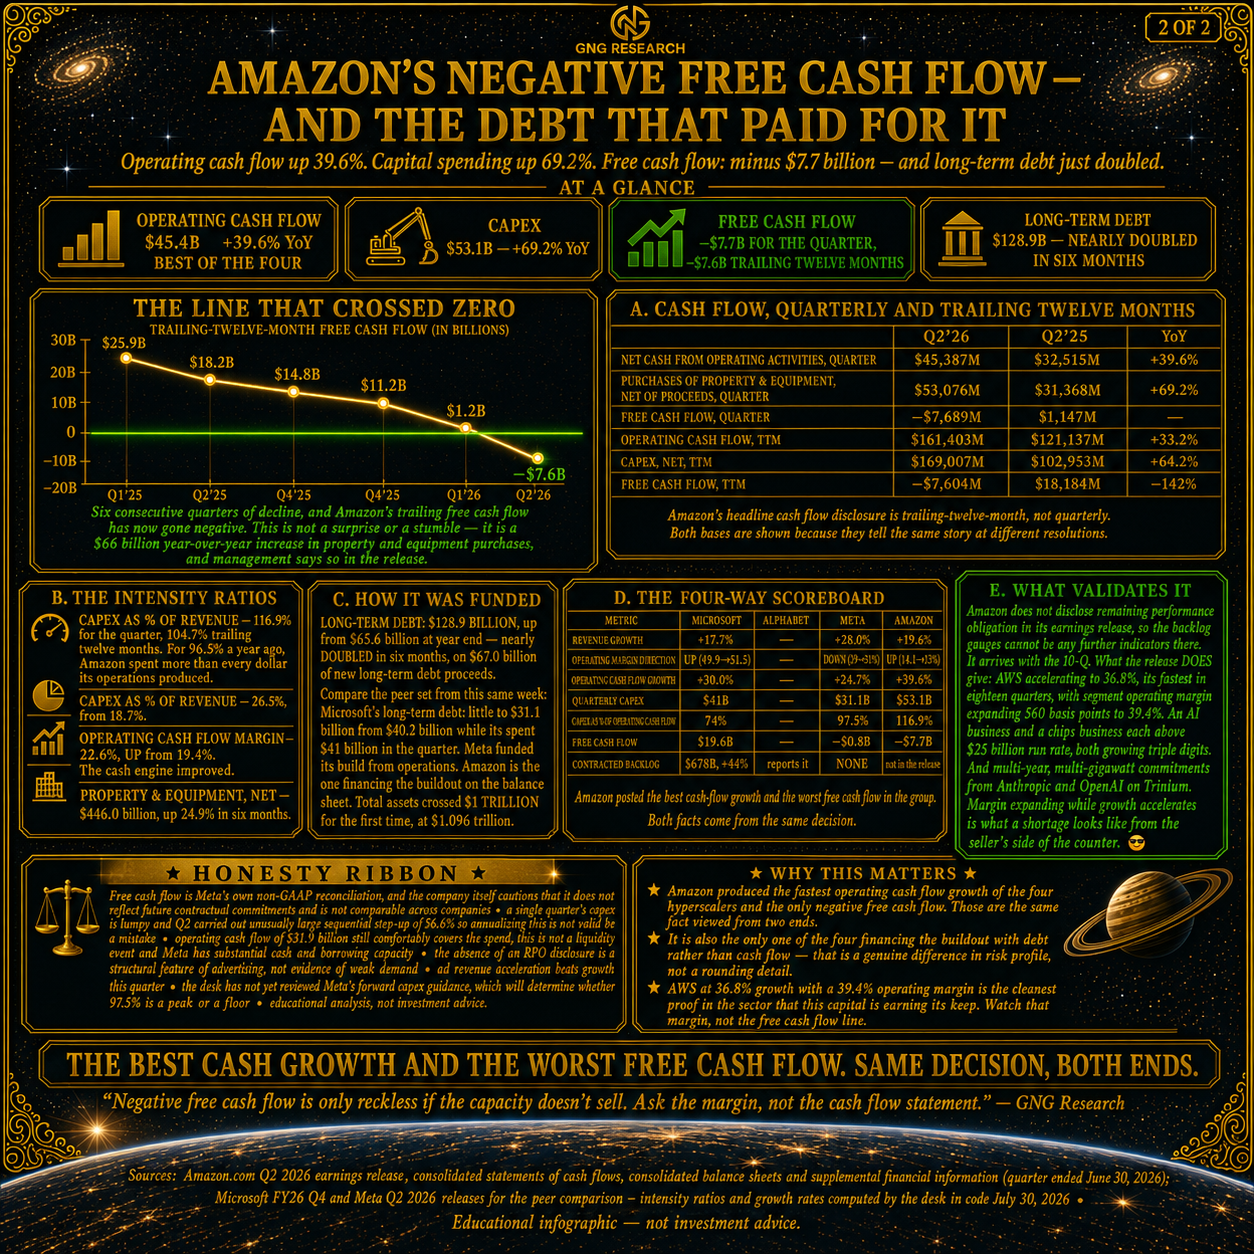
Operating cash flow: $45.4 billion, up 39.6% — the BEST of all four. Capital expenditures: $53.1 billion, up 69.2%. Free cash flow:
NEGATIVE $7.7 BILLION.
Watch the trailing twelve-month series decay in slow motion: $25.9 billion. $18.2 billion. $14.8 billion. $11.2 billion. $1.2 billion. Negative $7.6 billion.
Six consecutive quarters. And it just crossed zero. That's not a cliff — that's a staircase, walked down deliberately, whistling 😂
Amazon says why in its own release: a $66.1 billion year-over-year increase in property and equipment purchases, "primarily reflects investments in artificial intelligence."
Capital spending consumed 116.9% of operating cash flow. Meta was at 97.5% and I called that reckless. Amazon heard that and said hold my beer 🤣
But operating cash flow MARGIN went UP, 19.4% to 22.6%. Same signature as Microsoft. The engine improved while the spending exploded.
And here's what nobody else led with: LONG-TERM DEBT WENT FROM $65.6 BILLION TO $128.9 BILLION IN SIX MONTHS. On $67 billion of new proceeds. Total assets crossed $1 TRILLION. Net property and equipment hit $446.0 billion, up 24.9% in half a year.
Microsoft spent $41 billion the same quarter and PAID DOWN its debt. Meta funded from operations. Amazon is the one financing this on the balance sheet.
Interest expense of $1.3 billion against $27.5 billion of operating income is 21x coverage — not remotely stressed, and this is deliberate use of cheap money by people who know exactly what they're doing. But it IS a different risk profile from the other three, and debt service does not care how good the story was 🥺
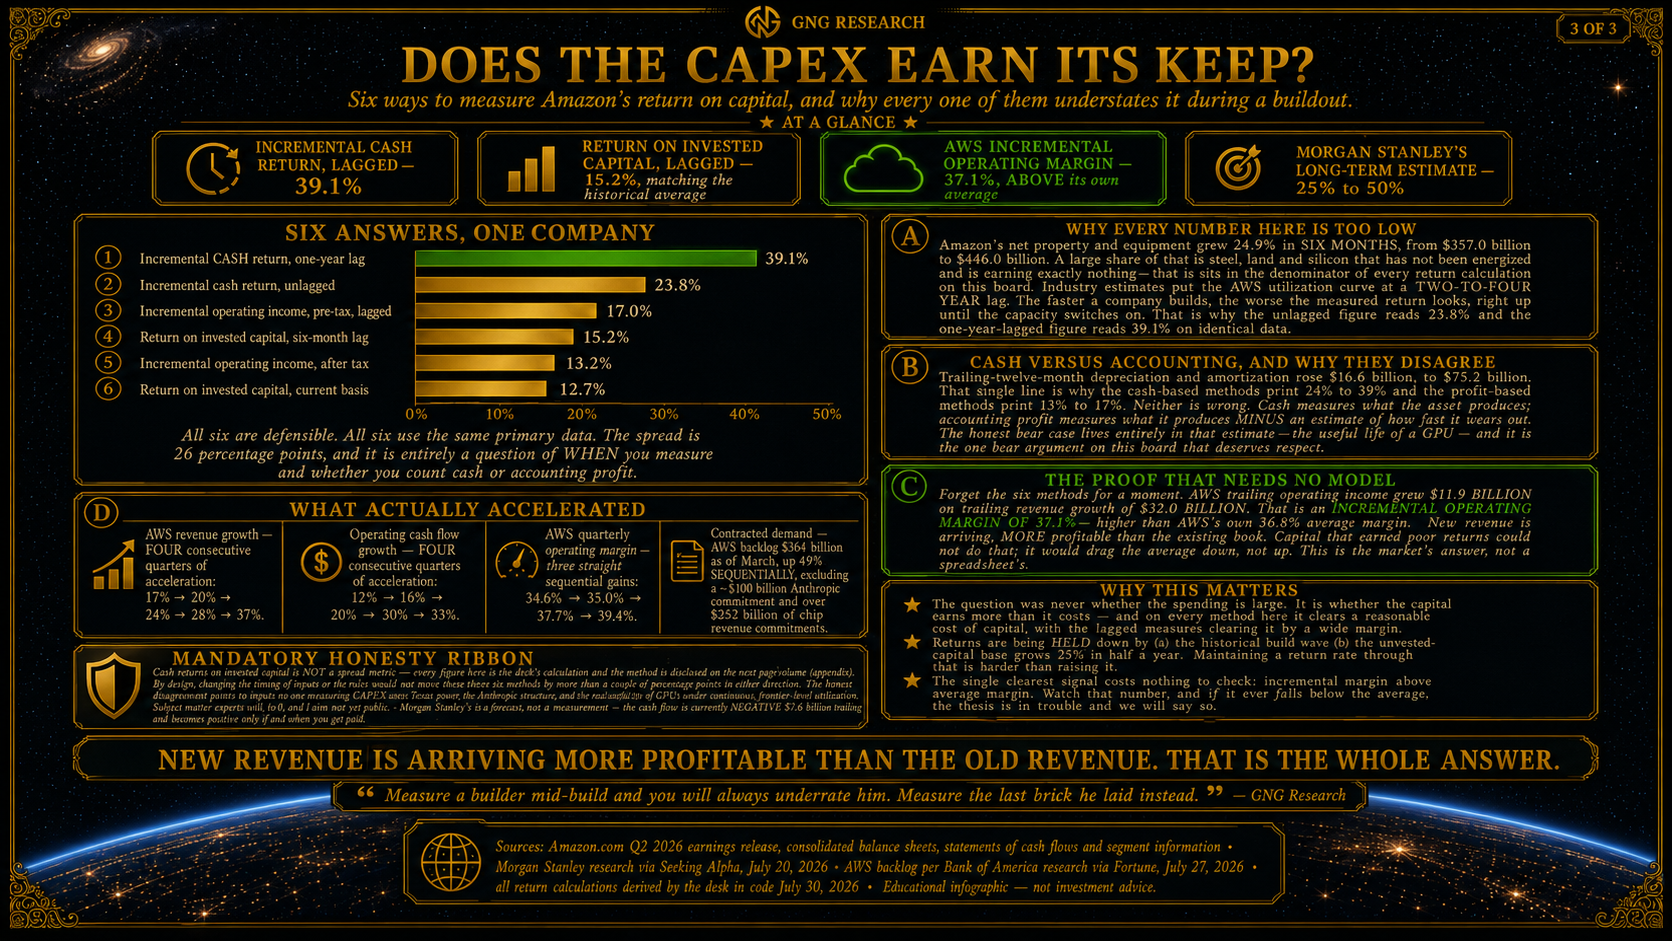
So does the capital earn its keep? We ran it SIX ways and published all six, including the ones that make us look bad.
Incremental cash return with a one-year lag: 39.1%. Unlagged: 23.8%. Incremental operating income pre-tax: 17.0%. After tax: 13.2%. Return on invested capital at a six-month lag: 15.2%. On current capital: 12.7%.
Twenty-six points of spread. IDENTICAL DATA. The only difference is WHEN you measure and whether you count cash or accounting profit 😱
The historical figure for this group is about 15%, which lands almost exactly on the lagged measure. Morgan Stanley published on July 28 forecasting long-term ROIC of 25 to 50 percent.
And every single one of those numbers is BIASED LOW right now. Net property and equipment grew 24.9% in six months, and a huge share of that denominator is steel and silicon that hasn't been switched on and is earning exactly nothing. Industry estimates put the AWS utilization curve at a two-to-four year lag.
Measure a builder mid-build and you will ALWAYS underrate him 🙏
But forget all six methods for a second, because there's a simpler test and it costs nothing to run:
AWS trailing operating income grew $11.9 BILLION on trailing revenue growth of $32.0 BILLION. That's an INCREMENTAL OPERATING MARGIN OF 37.1% — HIGHER than AWS's own 36.8% average.
New revenue is arriving MORE profitable than the old revenue.
Badly-deployed capital cannot do that. It drags the average DOWN. It does not pull it up. That's the whole answer, and it fits on a napkin 🤯
Guidance, briefly, because Wall Street is going to misread it. Q3 revenue guided to $197–202 billion, or 9% to 12% growth, down from 20%. Read the footnote! Excluding Prime Day timing in both years, underlying growth is nearly 400 BASIS POINTS higher. And the profit guide — which has no Prime Day distortion at all — is $22.5 to $26.5 billion against $17.4 billion.
Twenty-nine to fifty-two percent growth. Mic drop 😂 The top line LOOKS like it's slowing. The profit line very much is not.
MOVEMENT FOUR — ALPHABET, AND THE $2.33 TRILLION SCOREBOARD
Alphabet threw the wedding with the receipts. Then somebody opened the gift table and found ninety-eight billion dollars sitting in it 🤯
Start with the business, because the business was magnificent. Revenue of $119.8 billion, UP 24.2% — the fastest top line of the four. Operating income of $40.8 billion, up 30.4%, so profit grew FASTER than revenue. Operating margin expanded from 32.4% to 34.0%. And gross margin expanded too, 59.5% to 61.7%, which literally nobody else in this report managed 🥰
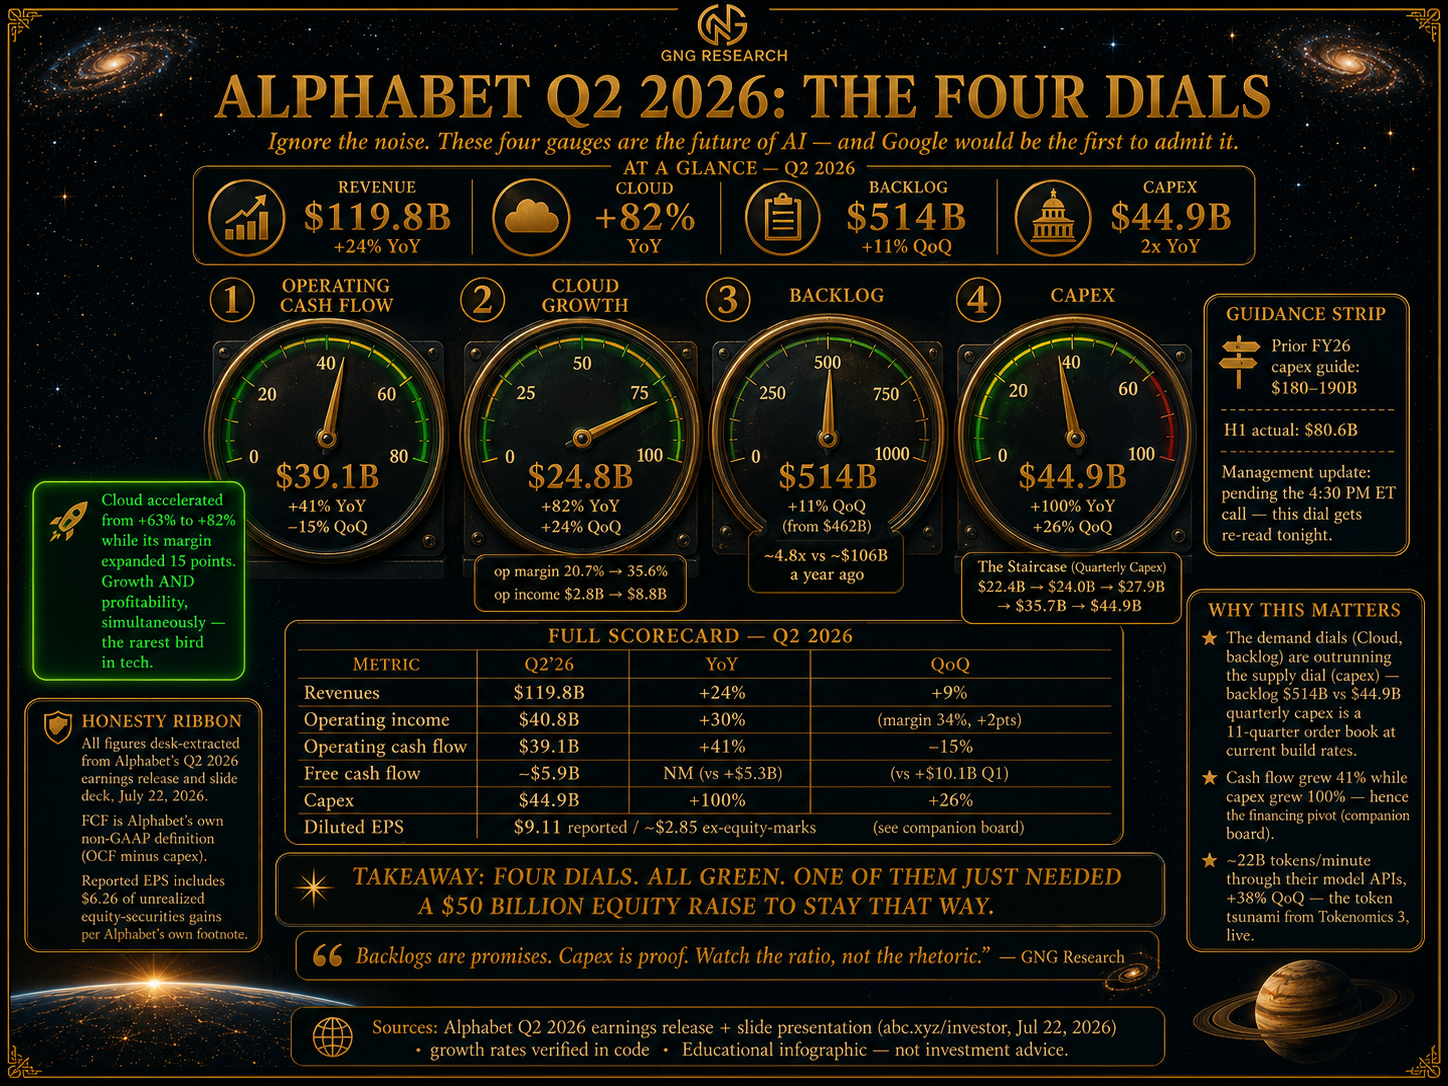
And Google Cloud grew 81.8%. To $24.8 billion from $13.6 billion.
EIGHTY-ONE POINT EIGHT PERCENT. On a fourteen-billion-dollar base. That is the single fastest growth rate any major segment posted this entire earnings season 😱
Now the asterisk, and this one is genuinely interesting rather than annoying. Read Alphabet's own revenue recognition note: Google Cloud revenue now includes "product sales, primarily the sale of TPU systems." Then look at the balance sheet — INVENTORY WENT FROM $2.4 BILLION TO $10.0 BILLION. Up 310%. Described as "hardware related to TPU systems for sale to enterprise customers."
Google is now SELLING ITS CHIPS. Not renting compute on them. Shipping the actual boxes 🤯
Which means part of that 81.8% is hardware revenue at hardware margins rather than cloud revenue at cloud margins. AND it means Google just became a merchant silicon vendor competing head-on with Nvidia — and did it quietly, buried inside a revenue line that everyone reads as "cloud." Sorry Jensen, your customer is now your competitor and he's using YOUR line item to do it 😂
The rest: Search and other up 16.8%. YouTube ads up 12.9%. Subscriptions, platforms and devices up 15.2%. Google Network down 0.7%. Google Services overall up 14.5%. And the United States is now 51% of total revenue, up from 48%, growing 32.1% while every other region grew in the teens.
NOW THE NUMBER THAT BREAKS THE SCALE.
Just in Case You Aren’t Aware GAAP tech earnings are meaningless (same reason as Berkshire’s GAAP is useless)
Buffett says use operating results and the same is true for big tech.
The headline FactSet EPS growth is GAAP (not operating) Its impressive BUT not “67% YoY growth impressive”😉😂🤣

Reported diluted EPS: $9.11. UP 294.4%.
Below the operating line sits $97.98 BILLION of other income. Against $2.66 billion a year ago. That single line is 70.6% OF PRE-TAX INCOME.
Same knife. Operating income of $40.8 billion, taxed at the actual 19.14% rate, divided by 12,306 million diluted shares, all investment income stripped:
PURE OPERATING EPS: $2.68, up 25.8%.
Reported up 294.4%. Operating up 25.8%.
A SPREAD OF TWO HUNDRED SIXTY-NINE PERCENTAGE POINTS.
Microsoft's was sixteen. Amazon's was 216. Alphabet's is 269 🤣 We have a winner, folks. Twenty-six percent operating growth is a superb quarter. Two hundred ninety-four percent is an accountant with a spreadsheet and a dream.
AND HERE IS WHAT THE DREAM IS ABOUT.
Go to the fair-value footnotes. Marketable equity securities went from $6.3 billion at year-end to $101.2 BILLION at June 30. Two footnotes explain everything:
"Includes $80.0 billion of Space Exploration Technologies Corp. (SpaceX) shares subject to short-term restrictions on the ability to sell."
"Includes $14.1 billion of SpaceX shares subject to long-term restrictions on the ability to sell through the third quarter of 2027."
ALPHABET IS CARRYING $94.1 BILLION OF SPACEX STOCK. AND IT CANNOT SELL A SINGLE SHARE 😱
Alphabet was an early SpaceX investor. When SpaceXAI went public in June, a stake that had been sitting quietly as a non-marketable security converted to a marketable one at the IPO price — and roughly ninety-four billion dollars of markup fell straight onto the income statement like a piano in a cartoon.
Now hold that next to something we published on June 11th. Our four-part series on the SpaceXAI IPO reached exactly one verdict: NO at the open. Great company, wrong price, maximum hype. Buy the math, not the myth.
SPCX is now down 54% from its post-IPO highs 🤯
So negative impact on GAAP EPS is going to seem scary but its meaningless, watch operating cash flow (the new free cash flow in the age of AI)
So the largest single component of Alphabet's blowout quarter is a mark on a stock that has since fallen by more than half — held in shares Alphabet is legally BARRED from selling, some of them locked until the third quarter of 2027.
I am not predicting a writedown. I'm pointing out that the mark is a June 30 photograph of a price that no longer exists, that the position could not be exited even if Sundar personally wanted out, and that Alphabet's deferred tax liability went from $0.9 billion to $22.8 BILLION — a real future bill on gains that are entirely made of paper. Watch Q3. I'll be watching Q3 🥺
The non-marketable book tells the same story from the other end: $124.3 billion carrying value at June 30, of which $87.9 BILLION was remeasured during the quarter alone. Alphabet is now, in meaningful part, a venture capital fund with a search engine attached 😂
THE CASH: ALPHABET WENT NEGATIVE TOO.
Q2 operating cash flow: $39.1 billion, UP 40.8% — the fastest cash flow growth of any of the four, with margin expanding from 28.8% to 32.6%.
Q2 capital expenditures: $44.9 billion. UP 100.1%.
Q2 free cash flow: NEGATIVE $5.9 BILLION. Against positive $5.3 billion a year ago.
Capex consumed 115.0% of operating cash flow. Amazon was at 116.9%. These two are effectively TIED for the most aggressive spending posture in the history of corporate America, and neither of them is being remotely coy about it 😱
For the first half: operating cash flow up 32.8%, capex up 103.3%, free cash flow down from $24.3 billion to $4.3 billion.
So the correct count for this earnings season is TWO hyperscalers with negative quarterly free cash flow, not one. Alphabet's just got less attention because the headline said earnings tripled.
AND NOW THE PART NOBODY IS TALKING ABOUT: HOW IT'S BEING PAID FOR.
Look at the financing section of the cash flow statement. Six months:
Proceeds from issuance of COMMON STOCK: $30.5 billion. Proceeds from issuance of MANDATORY CONVERTIBLE PREFERRED STOCK: $19.1 billion — 19 million shares at a 6.25% dividend, Alphabet's first preferred issuance ever, now trading as GOOGM and GOOGN. Proceeds from DEBT: $56.2 billion, taking long-term debt from $46.5 billion to $98.2 billion. Up 110.9% in half a year.
ROUGHLY $106 BILLION OF FRESH CAPITAL RAISED IN SIX MONTHS.
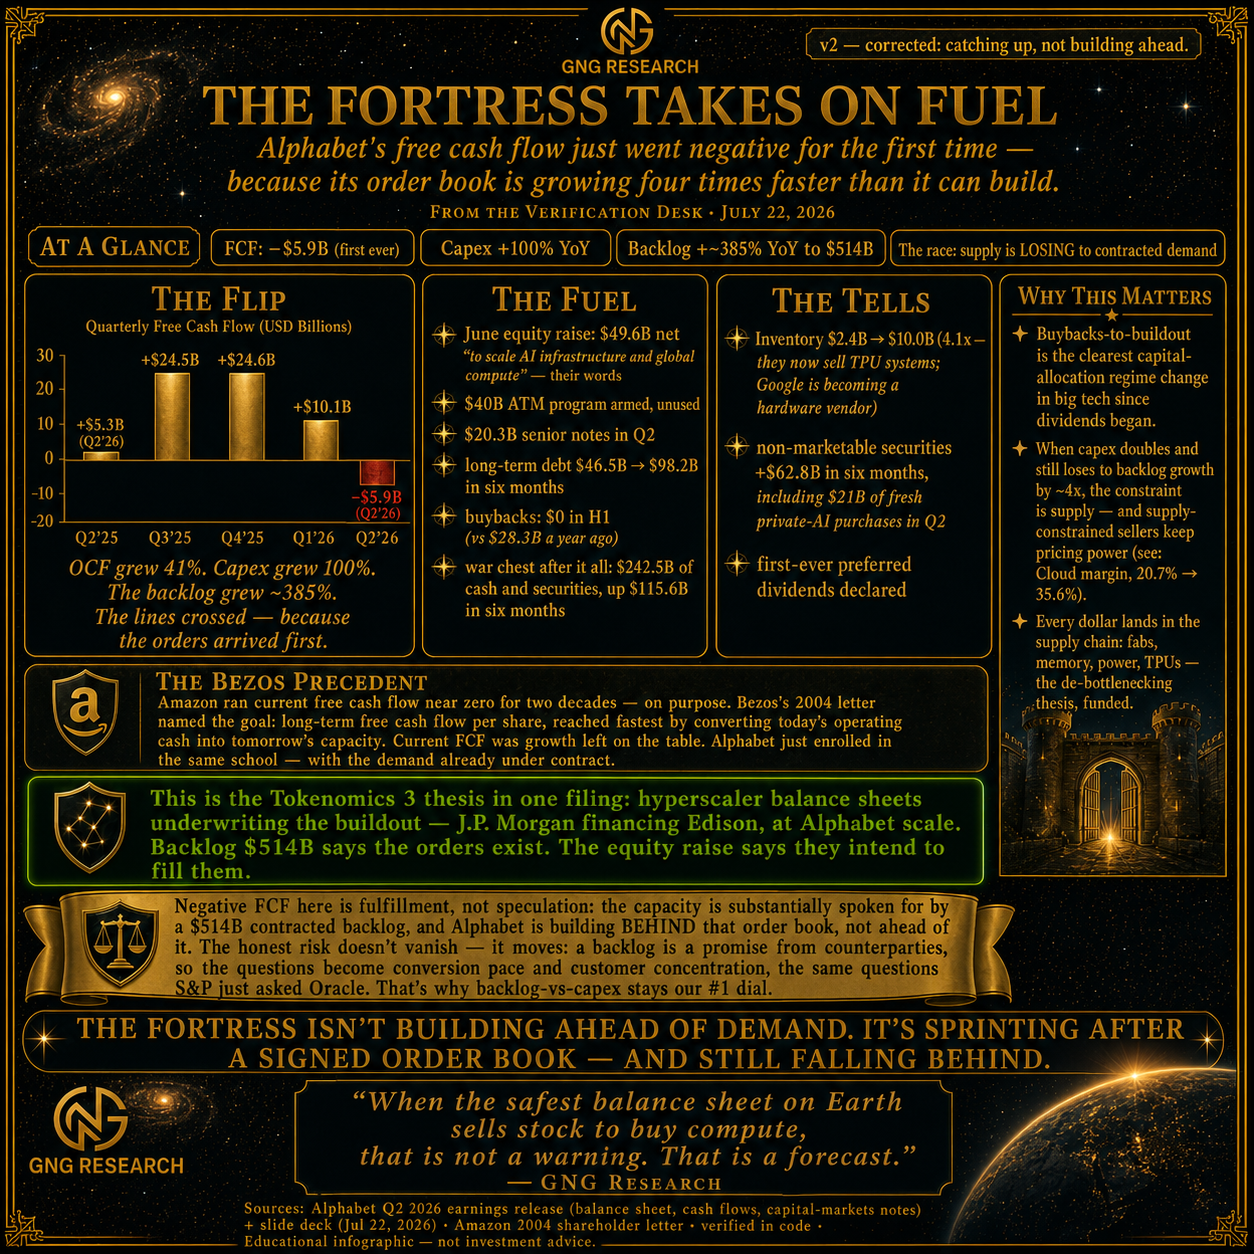
And repurchases of stock: ZERO. Against $28.3 billion in the first half of last year 🤯
Read that pair one more time. The company that has been one of the largest buyers of its own stock on planet Earth stopped buying ENTIRELY, issued equity for the first time in its modern history, sold preferred stock at 6.25%, and doubled its debt. All in six months.
Total assets went from $595 billion to $922 BILLION. Up 54.9%. Property and equipment net rose 30.3% in half a year to $321 billion. Depreciation is already up 43.2%.
That is not a company managing a capital return program. That is a company MOBILIZING. That's what World War II production looked like, except the tanks think 🙏
THE BACKLOG.
Straight from the filing: as of June 30, 2026, Alphabet had $519.5 billion of remaining performance obligations, of which $513.9 BILLION related to Google Cloud. At March 31 it was $467.6 billion and $462.3 billion — so the cloud book grew 11.2% IN A SINGLE QUARTER. A year ago it was roughly $106 billion.
One honesty note, because it's right there in the filing and almost nobody will quote it: in Q1 2026 Alphabet CHANGED its backlog definition to also include contracts with an original expected term of one year or less — about $7.3 billion of the total. That's 1.4%, so it barely moves anything. But a definitional change to a headline metric belongs in the hands of the people QUOTING it, not just the people filing it 😉
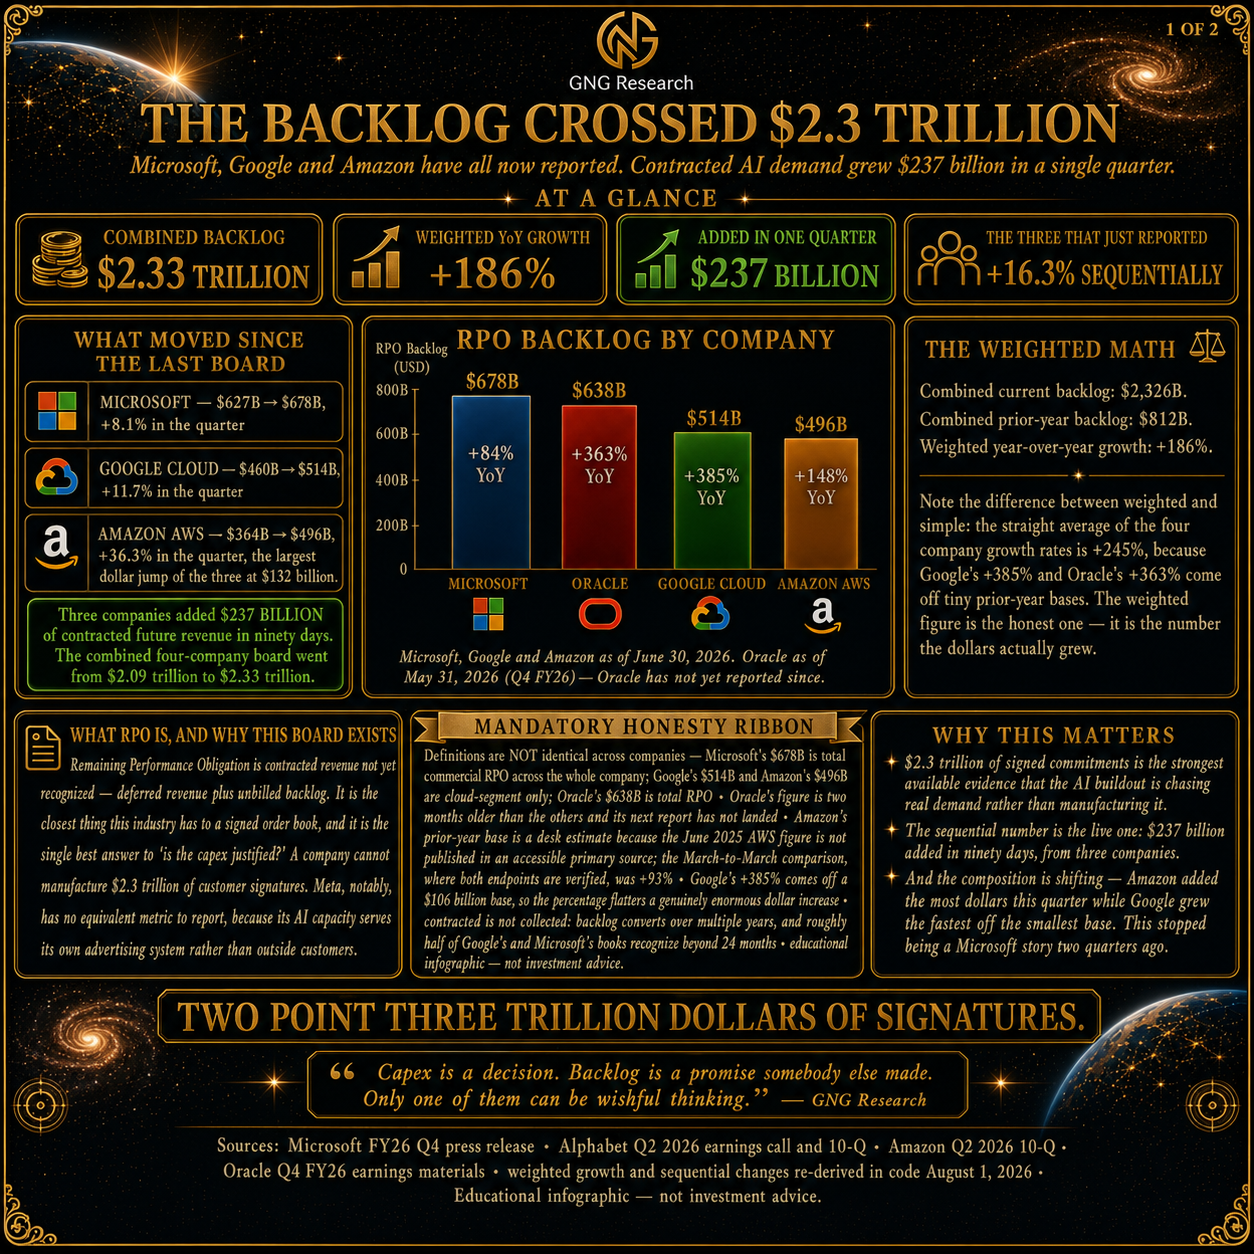
Now put all four on one board and stand back.
Microsoft: $678 BILLION, up 84%. Oracle: $638 BILLION, up 363%. Google Cloud: $513.9 BILLION, up roughly 385%. Amazon Web Services: $496 BILLION, up roughly 148%.
COMBINED: $2.33 TRILLION OF CONTRACTED FUTURE REVENUE.
Microsoft, Google and Amazon added $237 BILLION in ninety days. The four-company total went from $2.09 trillion to $2.33 trillion in a single quarter.
Two point three TRILLION dollars of signatures. A company can manufacture a capital budget out of ambition and PowerPoint. It cannot manufacture customer commitments 🙏
WHICH BRINGS US TO THE ONLY QUESTION THIS WHOLE QUARTER ASKED.
Is the spending justified, or is this the largest capital misallocation in the history of capitalism?
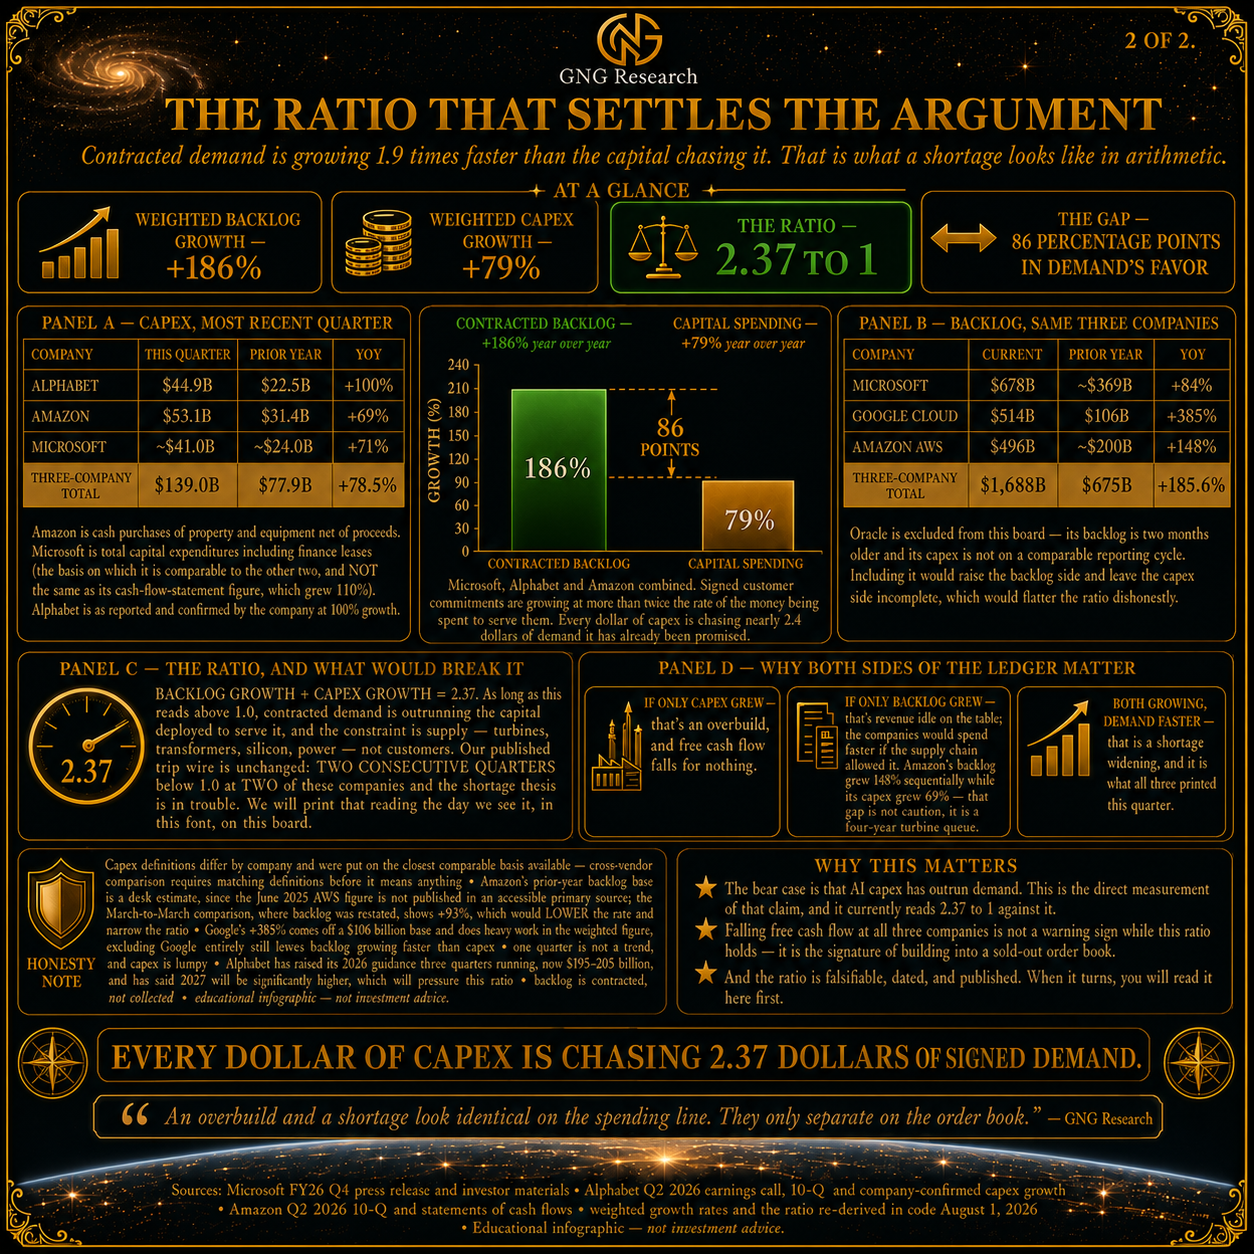
There's a way to answer that, and it isn't a vibe. It's a ratio.
Contracted backlog across the group grew 186%. Capital spending grew 79%.
A RATIO OF 2.35 TO ONE.
Every dollar of capital expenditure is chasing MORE THAN TWO DOLLARS of demand that somebody has already promised to pay. That is not what an overbuild looks like. That is what a shortage looks like when you finally measure it instead of arguing about it 🤯
And it is WIDENING. Last quarter the gap was 85 percentage points. This quarter it's 108. Capex growth DECELERATED from roughly 100% to 79% while backlog growth held at 186%.
Run the most conservative honest version and it STILL holds. Take only the sequential backlog growth — 16.3% in one quarter — and annualize it: 82.9%, against capex growth of 78.5%. Even on that brutally tight framing, demand is still ahead. And matched to timeframe it isn't close, because capacity takes YEARS to build, so today's dollars serve the beyond-twelve-month book — which grew 112% at Microsoft and is more than half the total at Alphabet by the company's own estimate.
And here's the piece that makes the entire picture cohere. Amazon's backlog grew 36% sequentially while its capex grew 29%. Alphabet DEFERRED $29.1 billion of equipment payments in six months — property and equipment acquired but not yet paid for.
That gap is not caution. THAT IS A FOUR-YEAR TURBINE QUEUE.
These companies would spend faster if the supply chain physically allowed it. The constraint is not customers. The constraint is transformers, turbines, silicon and power. They are not choosing restraint. They are WAITING IN LINE 😱
MOVEMENT FIVE — SPACEX: THE SIXTH HYPERSCALER 🚀
AMZN
MSFT
GOOG
ORCL
Meta
SpaceX
Sign in to leave a comment and join the discussion.
Sign Up Free