
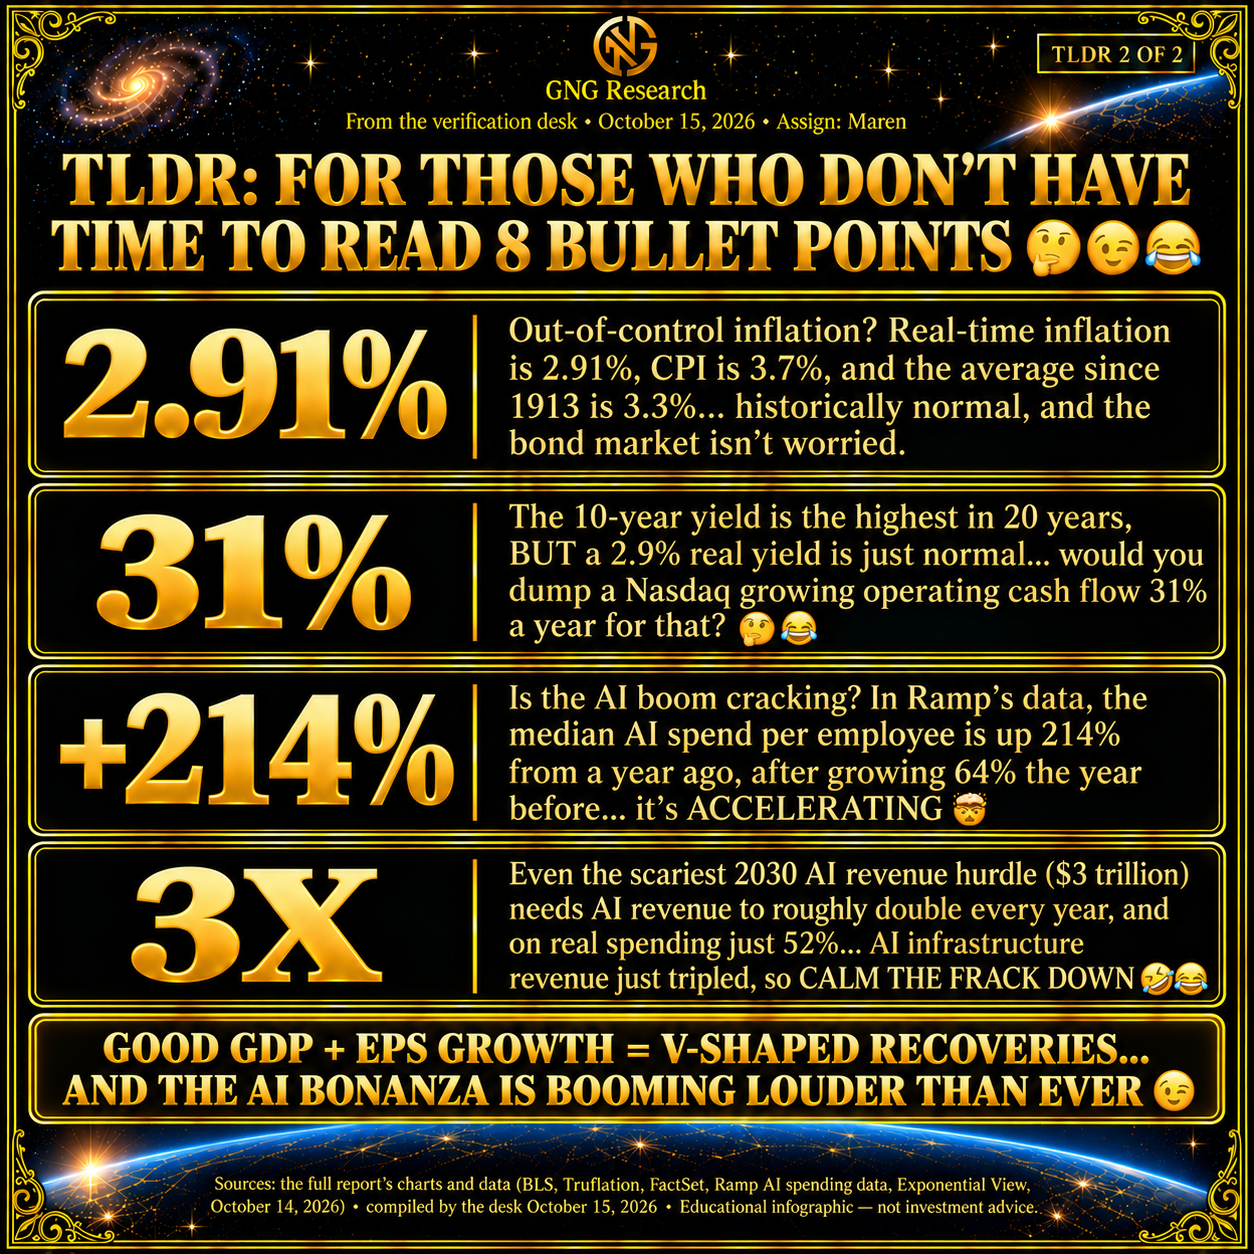
TLDR: For Those Who Don’t Have Time To Read 8 Bullet Points🤔😉😂

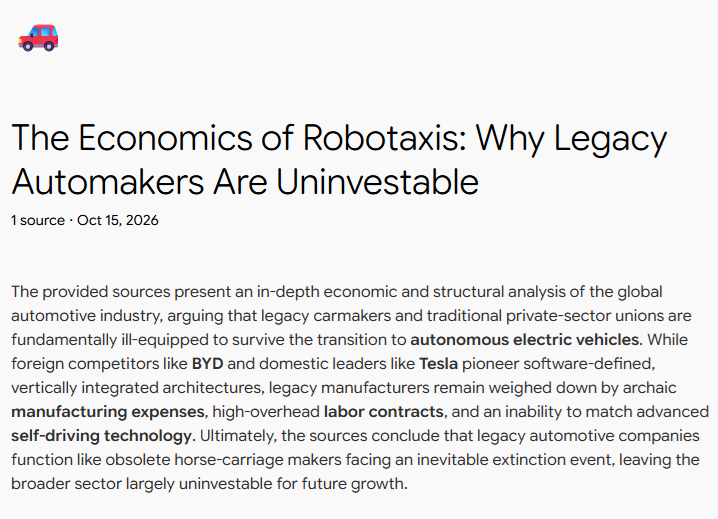
Podcasts (Including A Bonus Because Who Doesn’t Want to Learn About Why Ford Is Cooked?🤔😉😂
Bonus Podcast: Why Investing In ANY Car Companies Is A TERRIBLE Idea (Preview Of The Project I’ve Been Working On For Months, Coming In January)
Fun fact: I woke up in the middle of the night and couldn’t get back to bed before finishing this research paper and Podcast!
Yes, I really am this much of a nerd🤔😉😂🤣🖖
This Podcast
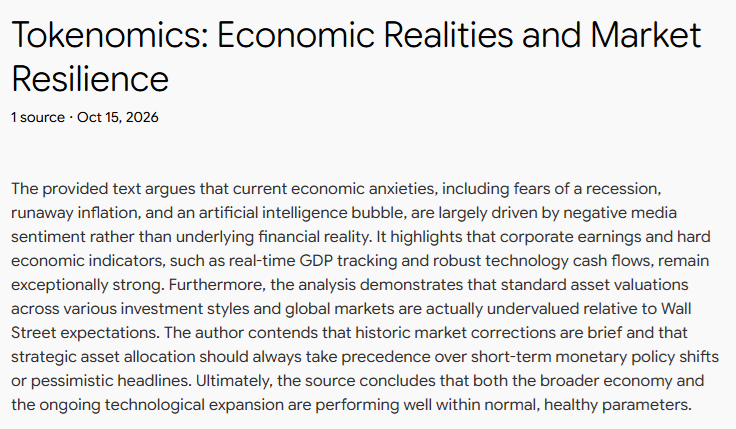
I always try to make the podcasts as funny as possible (Roast style) because the world we live in is an absurd live-action Disney cartoon🤔😉…People are worried that talking sand is going to take over the world and kill us all?😂REALLY? Not the talking sand I know!🤣

The Only Things Investors Need To Know About GDP
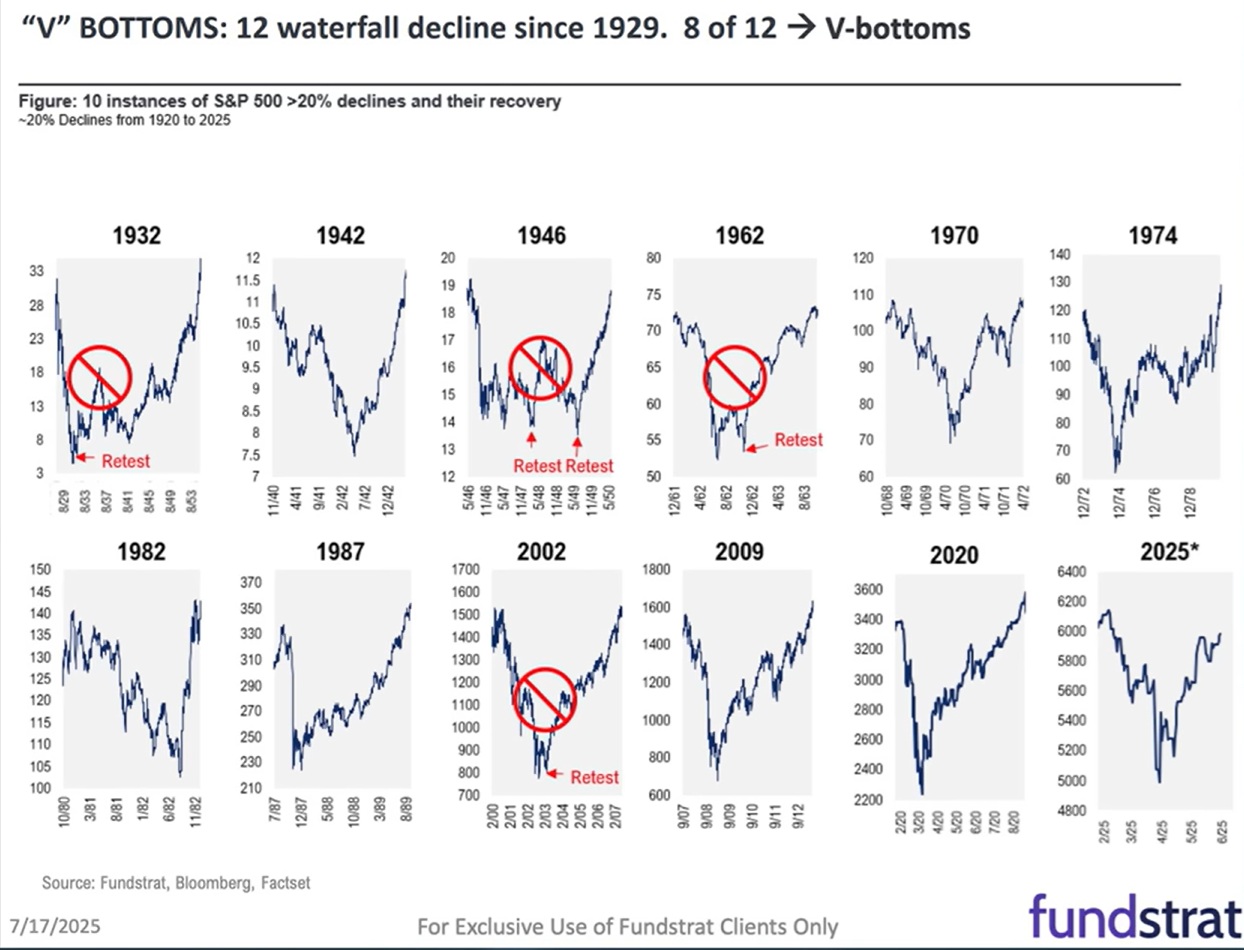
If the economy is growing, stocks recover, on average, 1.4X the length of the decline. So a 2-month correction (peak to trough) = 3 months to new record highs.
Notice how corrections seem really short these days? Do you know why that is? As my former colleague Chuck Carnevale says, “Every 3 months we get facts, earnings. In between is pure speculation.”
Every 3 months, the hyperscalers and NVDA are announcing fantastic numbers (Nasdaq in general, 31% CAGR growth in operating cash flow through 2028) that beat expectations.
The “speculation” about what MIGHT go wrong with fundamentals in the future tends to get washed away by actual facts…every 3 months.
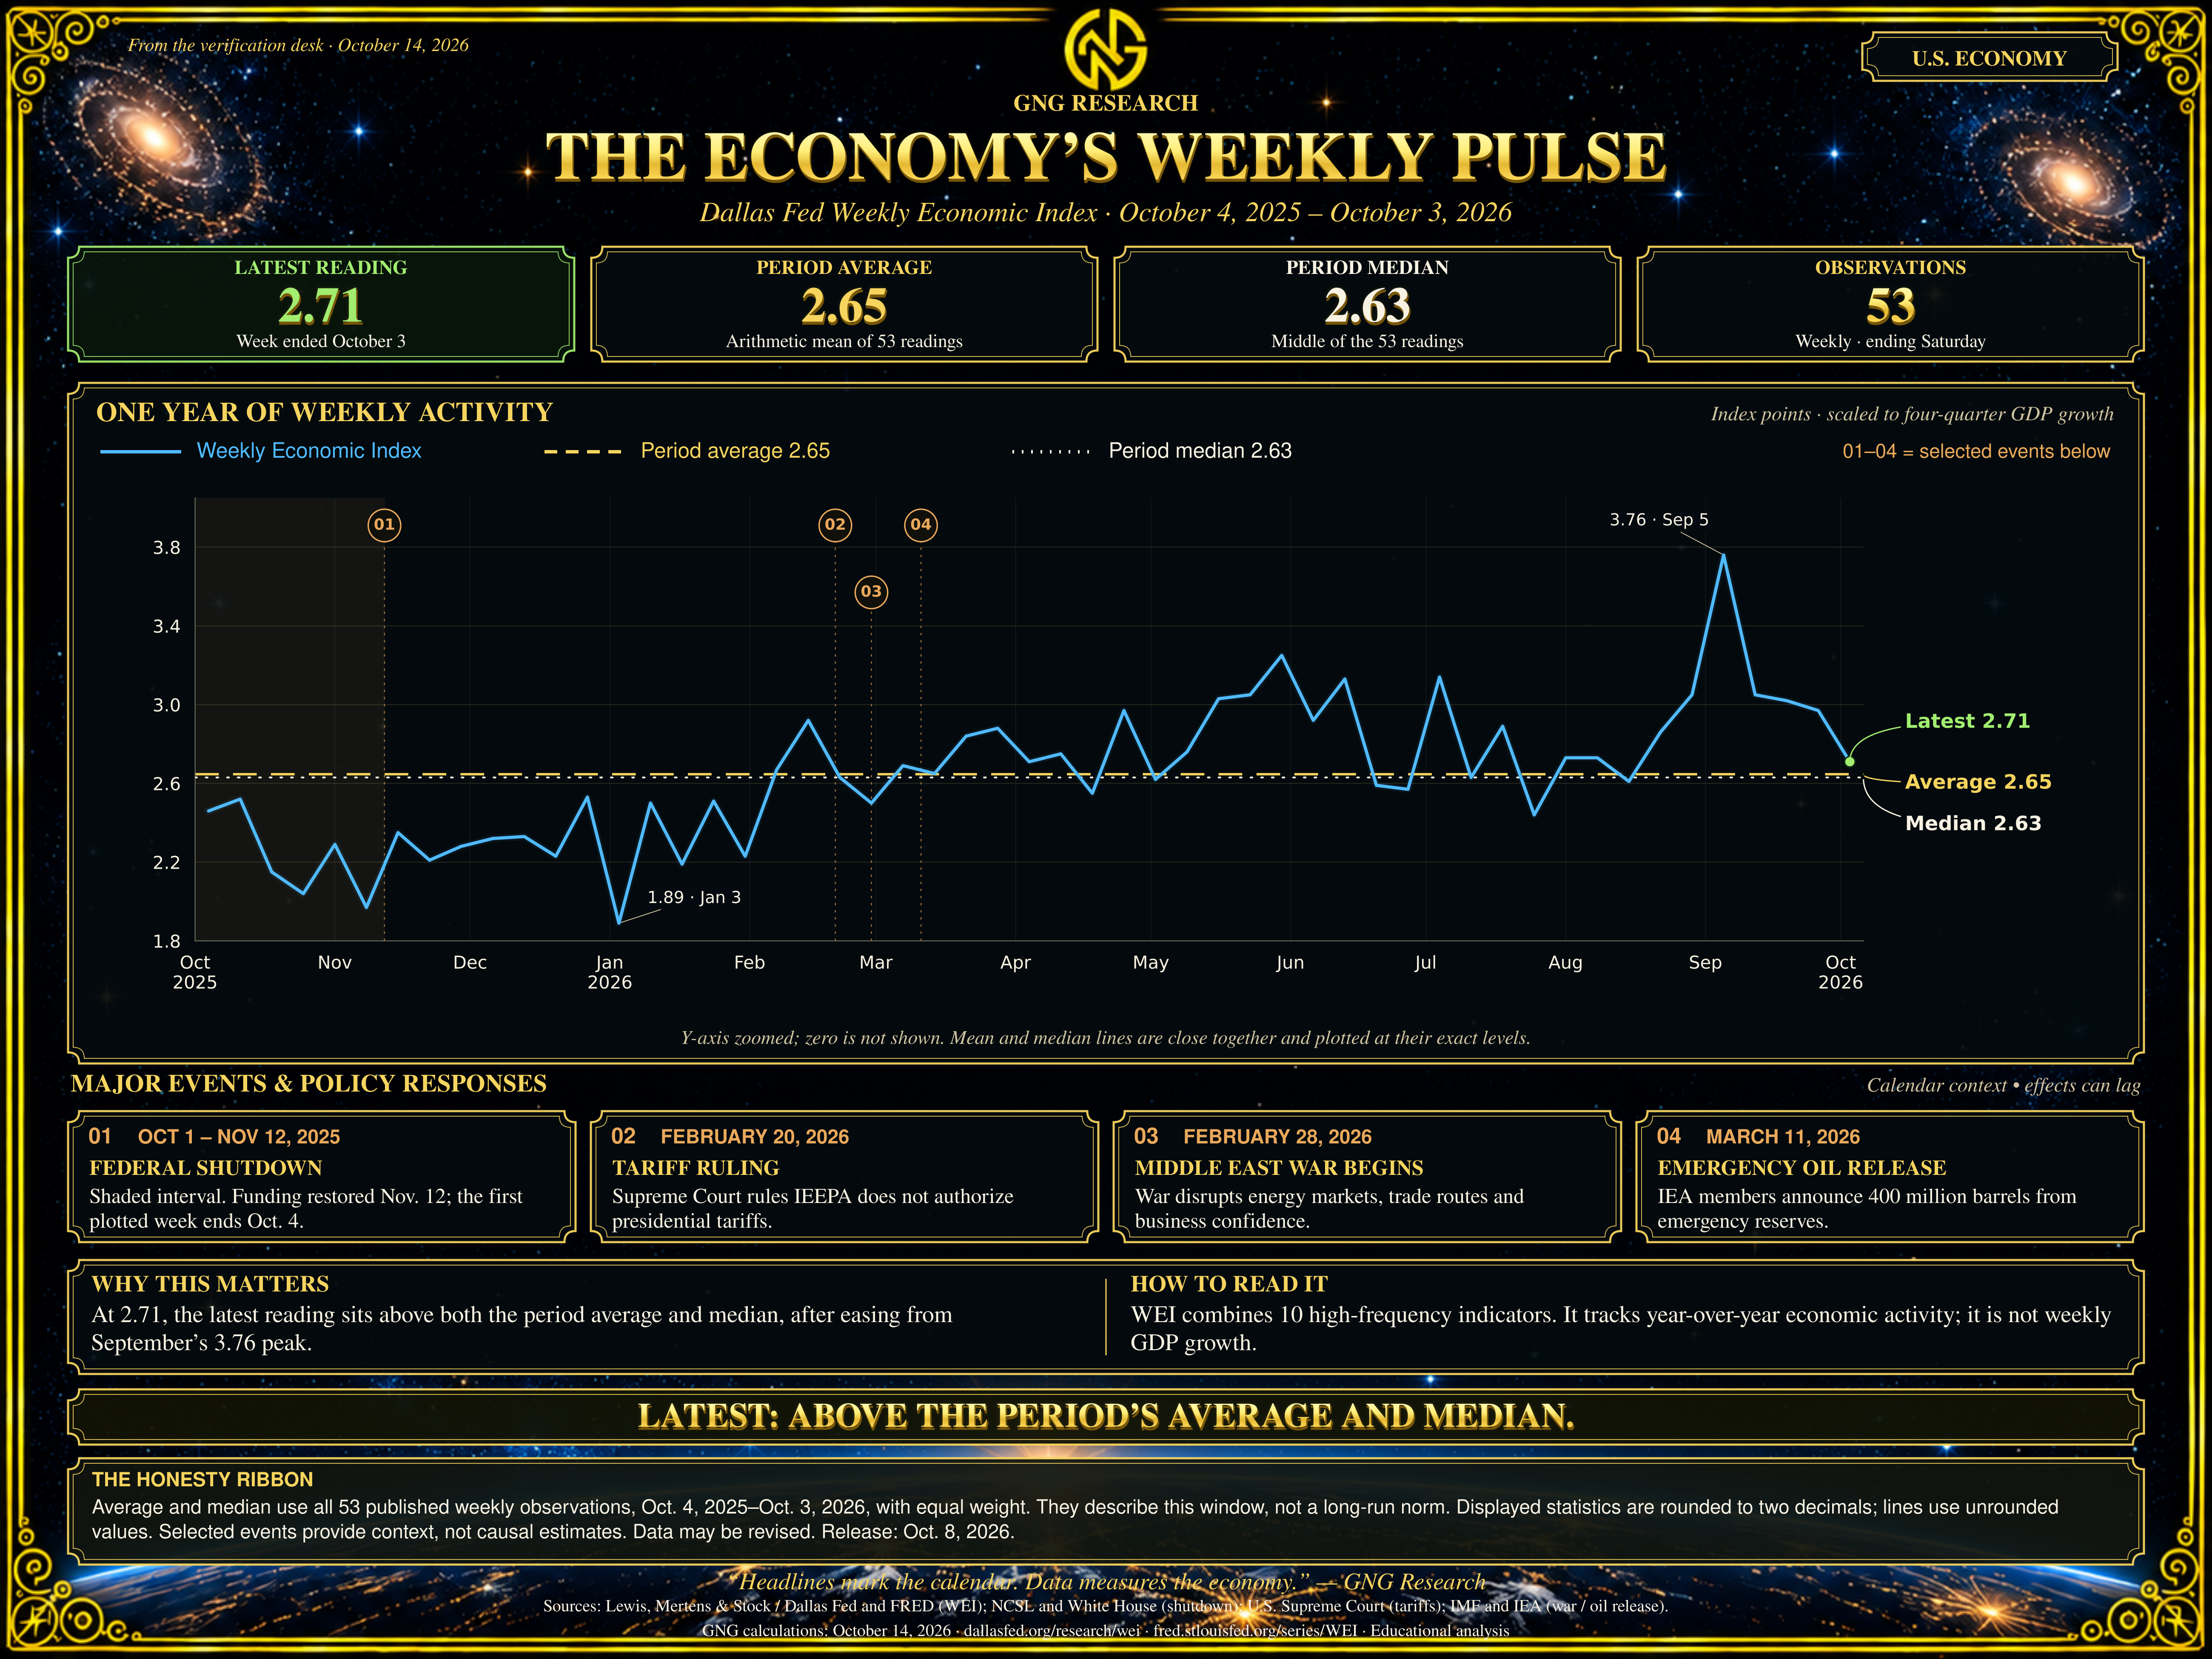
Here’s the Best Available Data About The GDP Growth (Real Time)
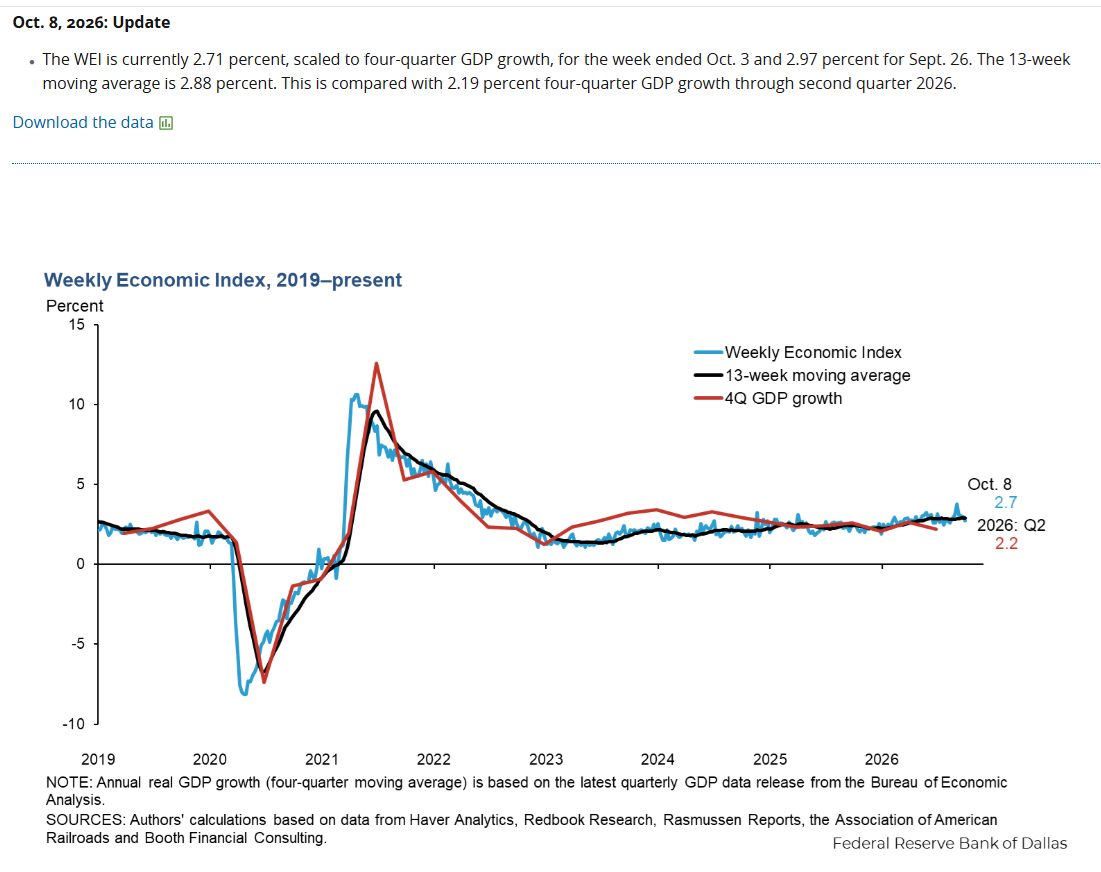
The Weekly Economic Index from the Dallas Fed is NOT based on “vibes” or “confidence” or proxy indicators about what has historically led things like consumer spending.
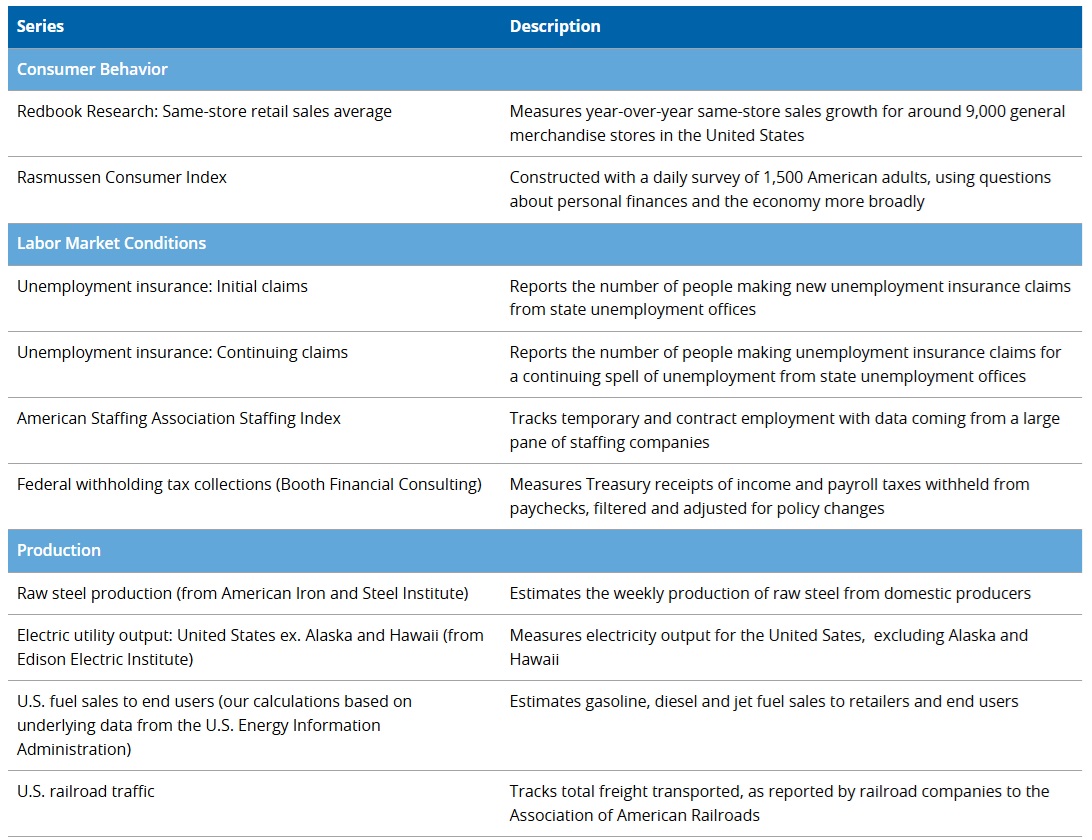
The only “survey” is of 1500 of the same consumers to see how much they are buying. NOT how much they plan to buy, but what they buy. Same with payroll tax receipts. Don’t tell me what hiring managers plan to do when we can measure what is happening in the job market in real time.
Electricity, gasoline, trucking volumes, steel output — these are the inputs into GDP growth. If they are strong, then “vibes” don’t matter.
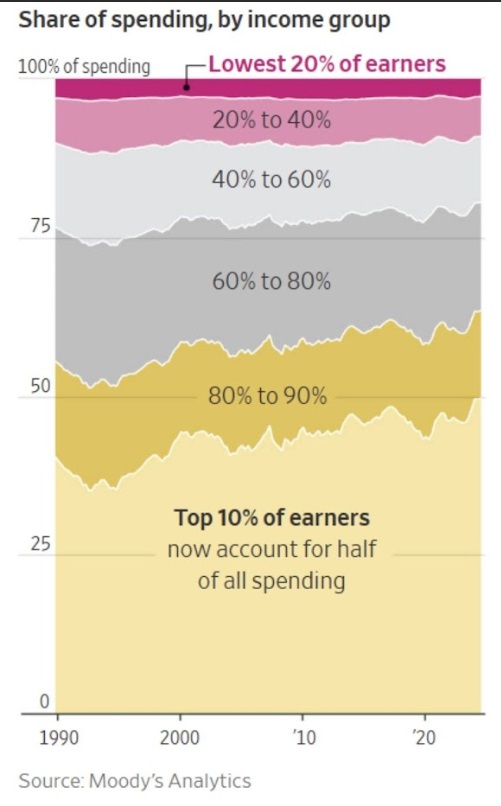
The economy is K-shaped, and the kind of plausible-sounding arguments you hear about recession might sound like this.
Scott Galloway’s Actual Argument From 1 Year Ago
The poorest 20% of Americans were suffering (because hamburger helper sales were way up and they are the ones who eat that stuff).
Therefore, consumer spending would fall
A recession was coming… a bear market…and Trump would lose the 2026 elections (so that’s why this was necessary as an economic cleanse.
A few counterpoints that explain why the 2026 recession never arrived.
The bottom 20% of Americans spend around $1 trillion (AI capex level of spending).
BUT they spend 100% (or more) of their income (on things like cars, gas, rent, phones).
The poor might be miserable and struggling with inflation and scared about AI, BUT they do NOT have the ability to “go on strike” and spend less.
That bottom 20% is spending all they can just to survive. And they will. That spending is rock stable. No matter how much hamburger helper people might be buying🤔😉😂
Meanwhile, the market cares about profits. BAC estimates that the bottom 20% spend = 2% of S&P profits.
Last year’s numbers. This year it’s even less (because hyperscalers are growing at over 30%).
Last year, 25% of S&P profits came from the Mag 7 alone, 12.5X more than the bottom 20%.
This year it's likely to be about a 15X larger effect on corporate profits (FactSet: Mag 7 earnings grew 63% in Q1 and 118% in Q2, vs 17% and 32% for the other 493).
I am NOT saying that the misery of Americans (even the middle class and upper classes are burned out, scared, and miserable) doesn’t matter.
BUT profits and GDP growth are what drive the stock market and determine the shape and duration of corrections.
Vibes? The vibes are terrible, have been since the Pandemic (mostly inflation and Social media amplifying scary headlines), and that’s likely to remain the case.
The poor have been miserable and spending 100% of their income for over 6 years. Where is the recession? Where is the bear market?
80% of the Market’s best days are within 2 weeks of its worst days.
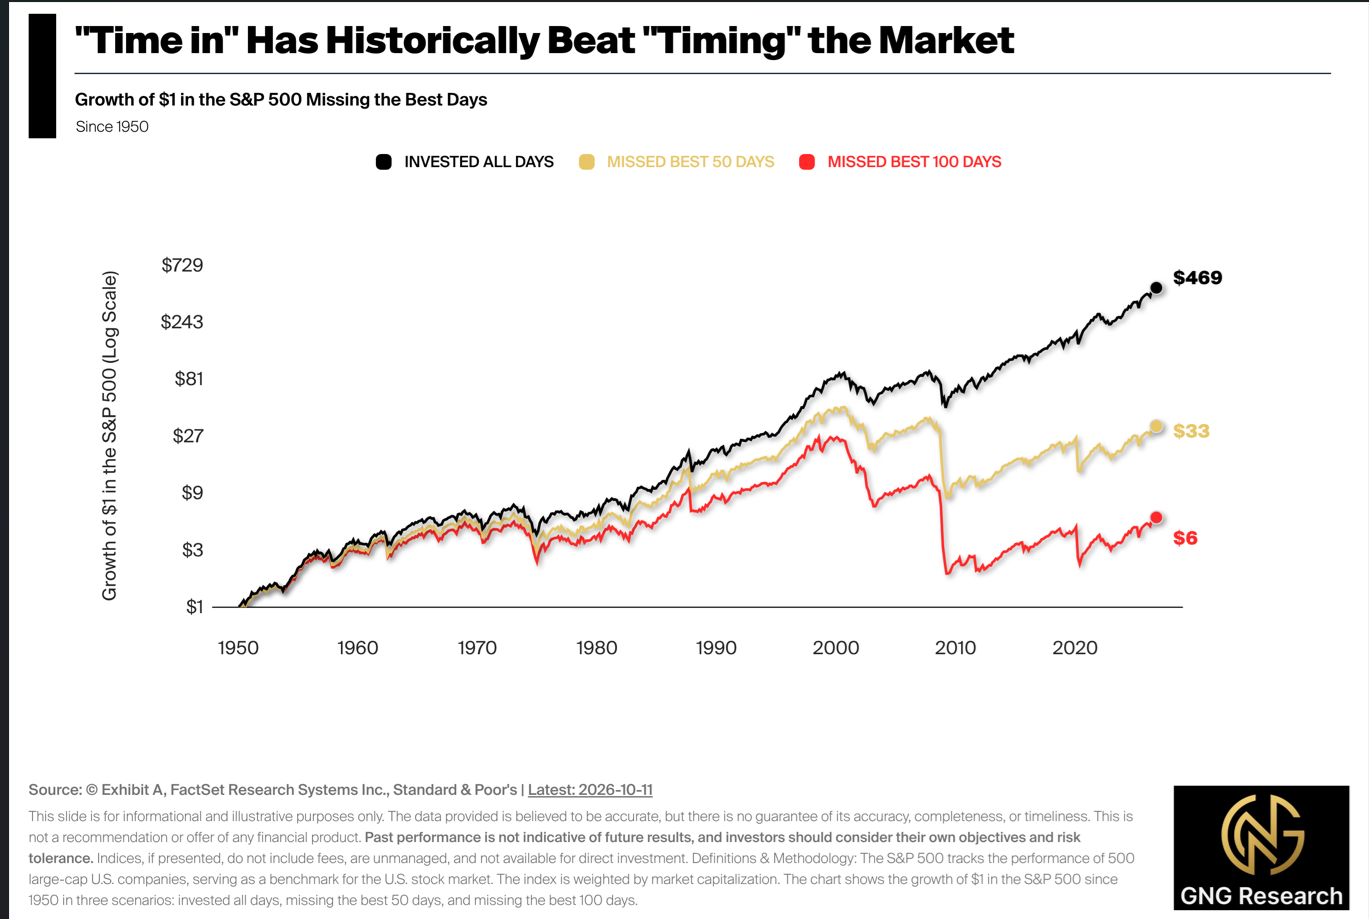
Remember this?
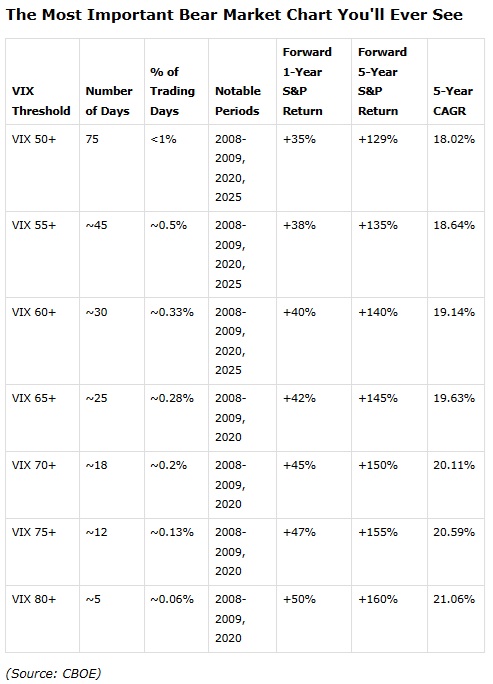
You don’t look at headlines in a correction because they will find a reason for stocks to be down. When the VIX was 60 on April 7th, 2026, there wasn’t a good headline to be found. And yet I nailed the bottom with my first-ever “Shut up and buy something smart, and you’ll thank me in a year!” article. Because the math is the math. Either the world ends (and we will be too dead to care about stocks) or history will repeat itself and stocks recover (it took 3 months to get back to record highs).
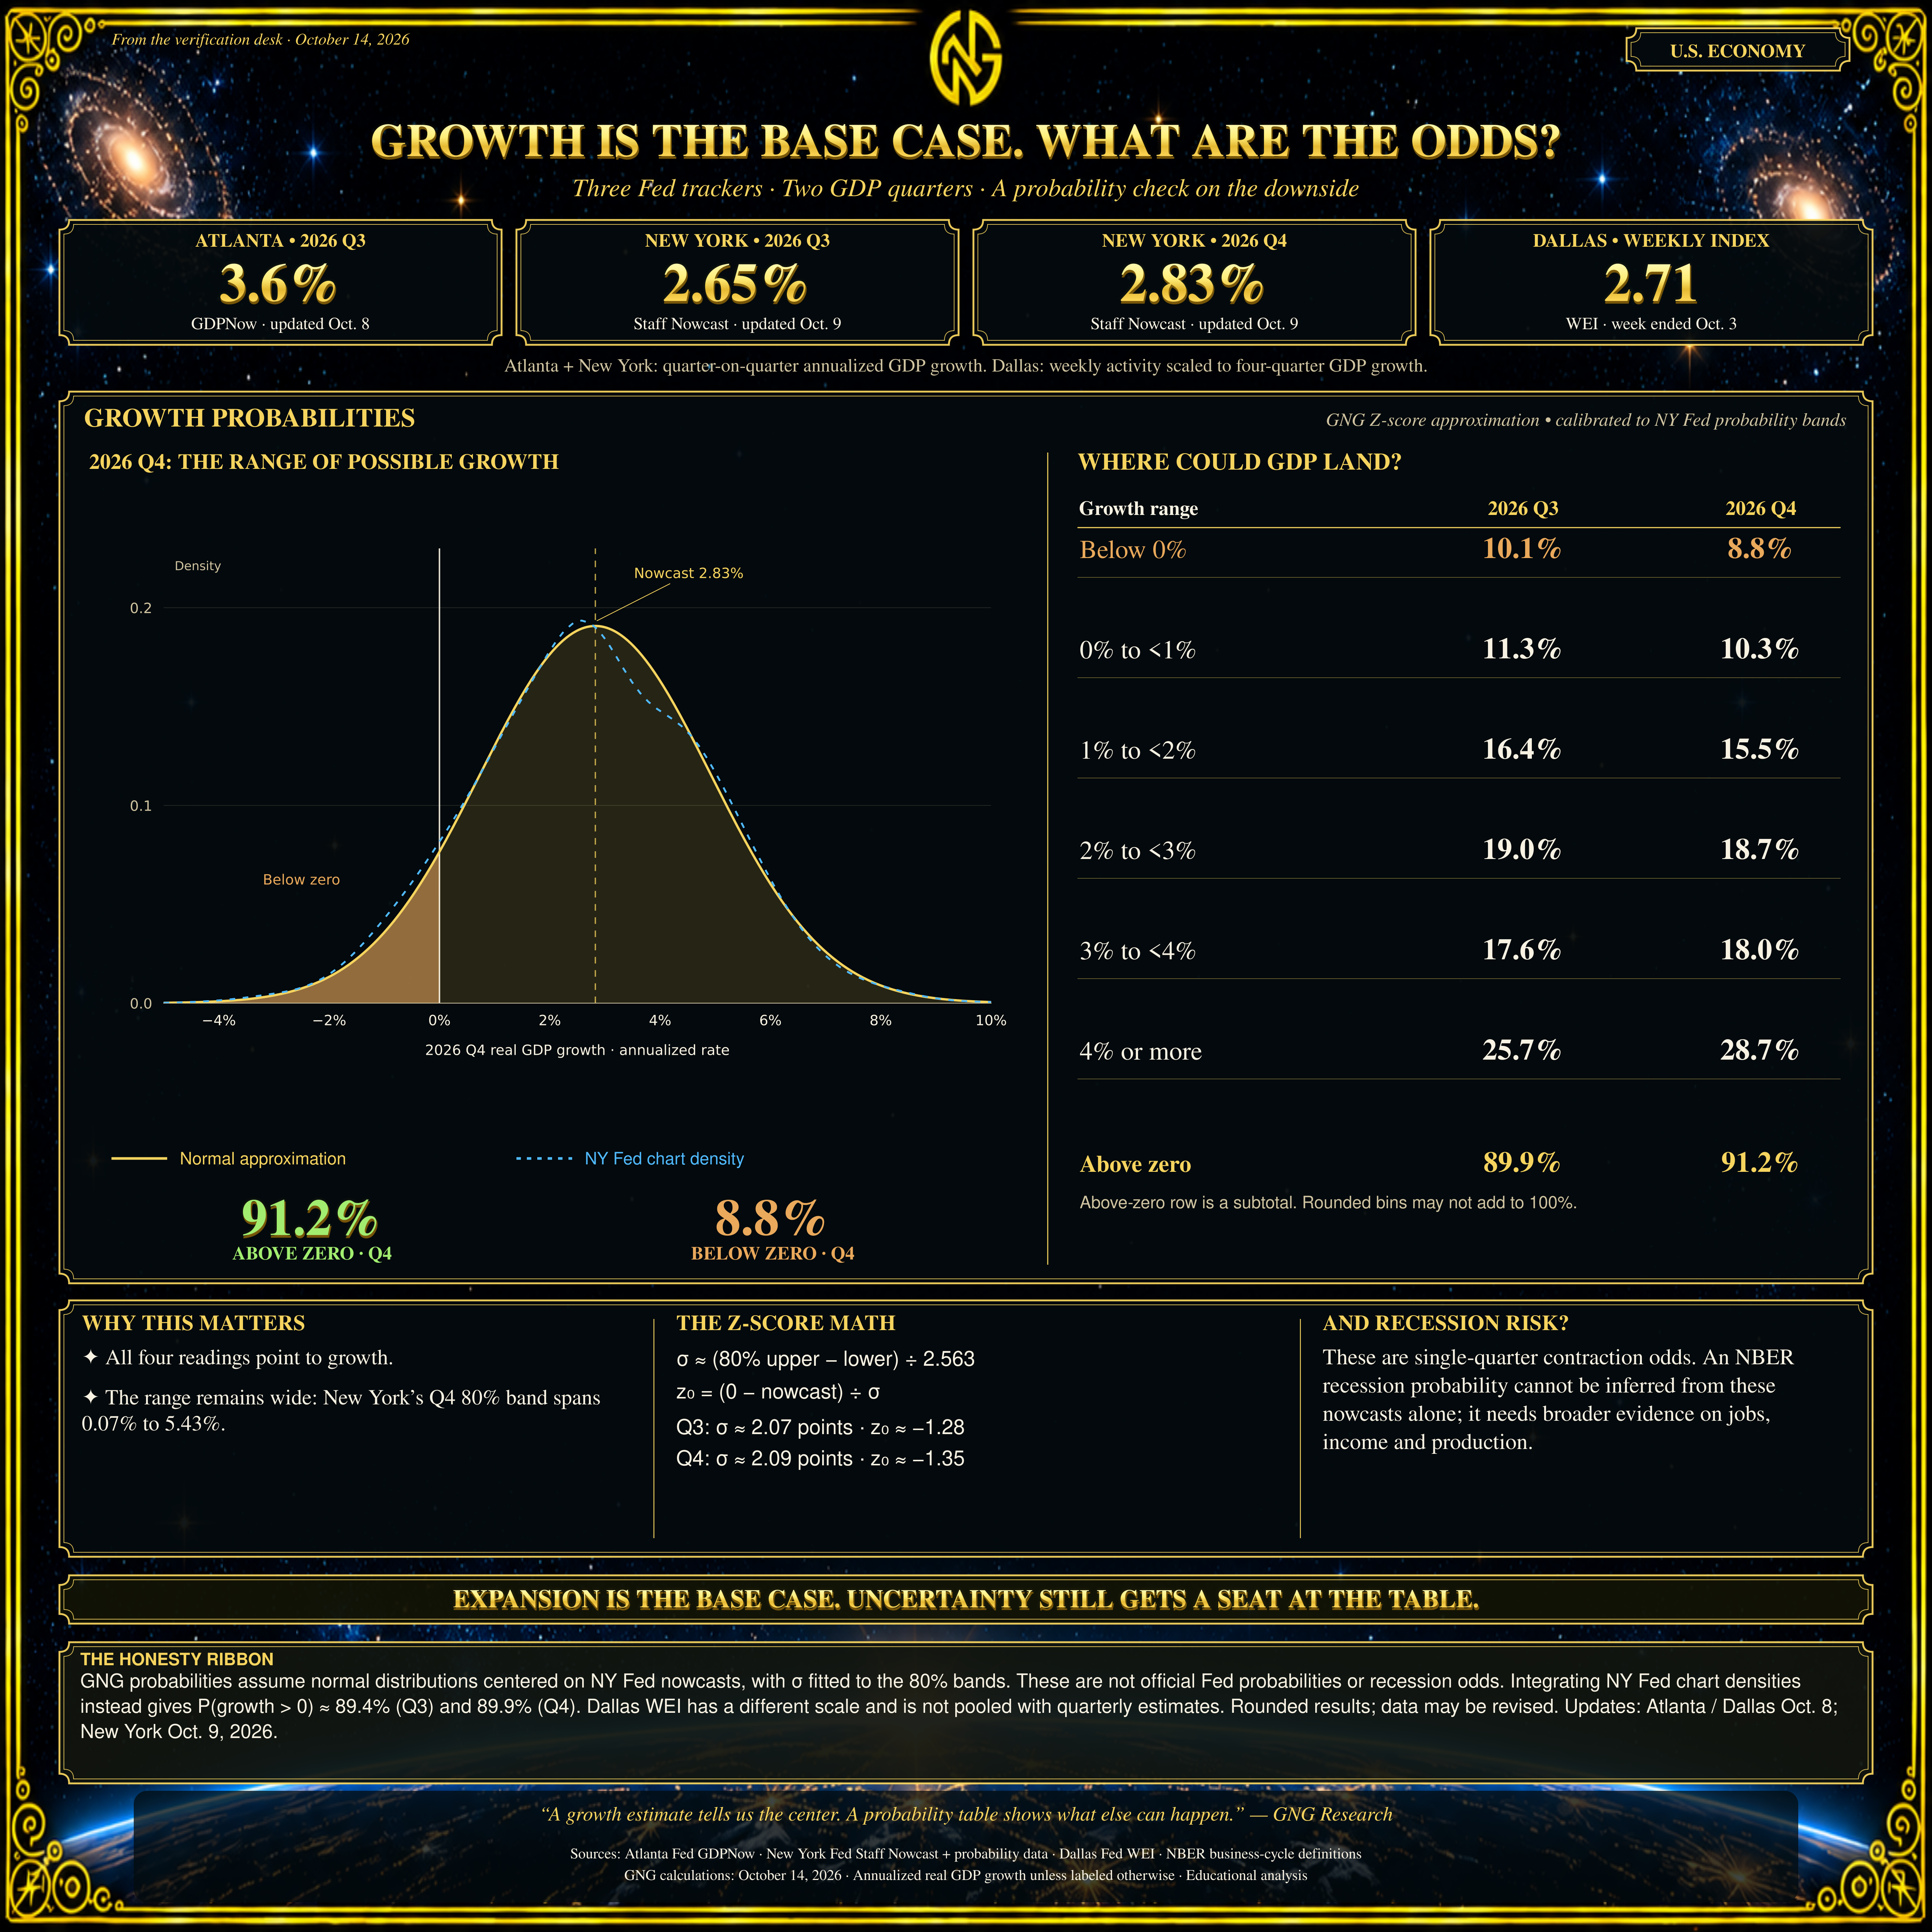
What About Recession Risk?
The baseline recession risk at almost all Wall Street banks is 15% because historically Recessions happen every 6 years.
1 every 4.9 years since 1854.
BUT guess what?
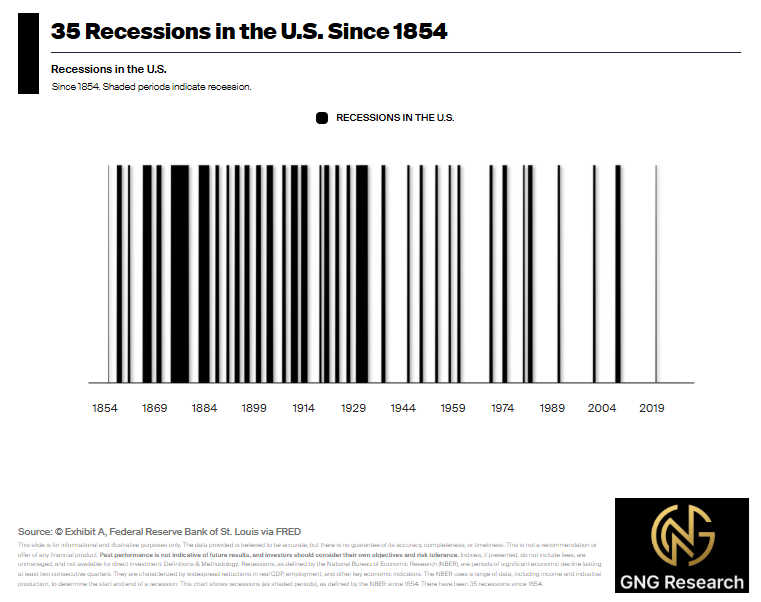
Recessions used to average every 2 years (and were called Panics because they were depressions).
NOW? The Pandemic was exogenous, and before that was the 2008 Great Recession. ]
Before that was the mildest recession in history (2001, -0.4% peak GDP decline).
Before that was the 1991 recession caused by a spike in oil prices and the California housing crisis.
-20% peak decline in the stock market and -1.4% GDP decline = average since WWII)
SO I would argue that NO, the baseline risk of recession isn’t 15%
JPMorgan’s Chief Economist Thinks Cycle Recessions Are Likely Over (I Do Too)
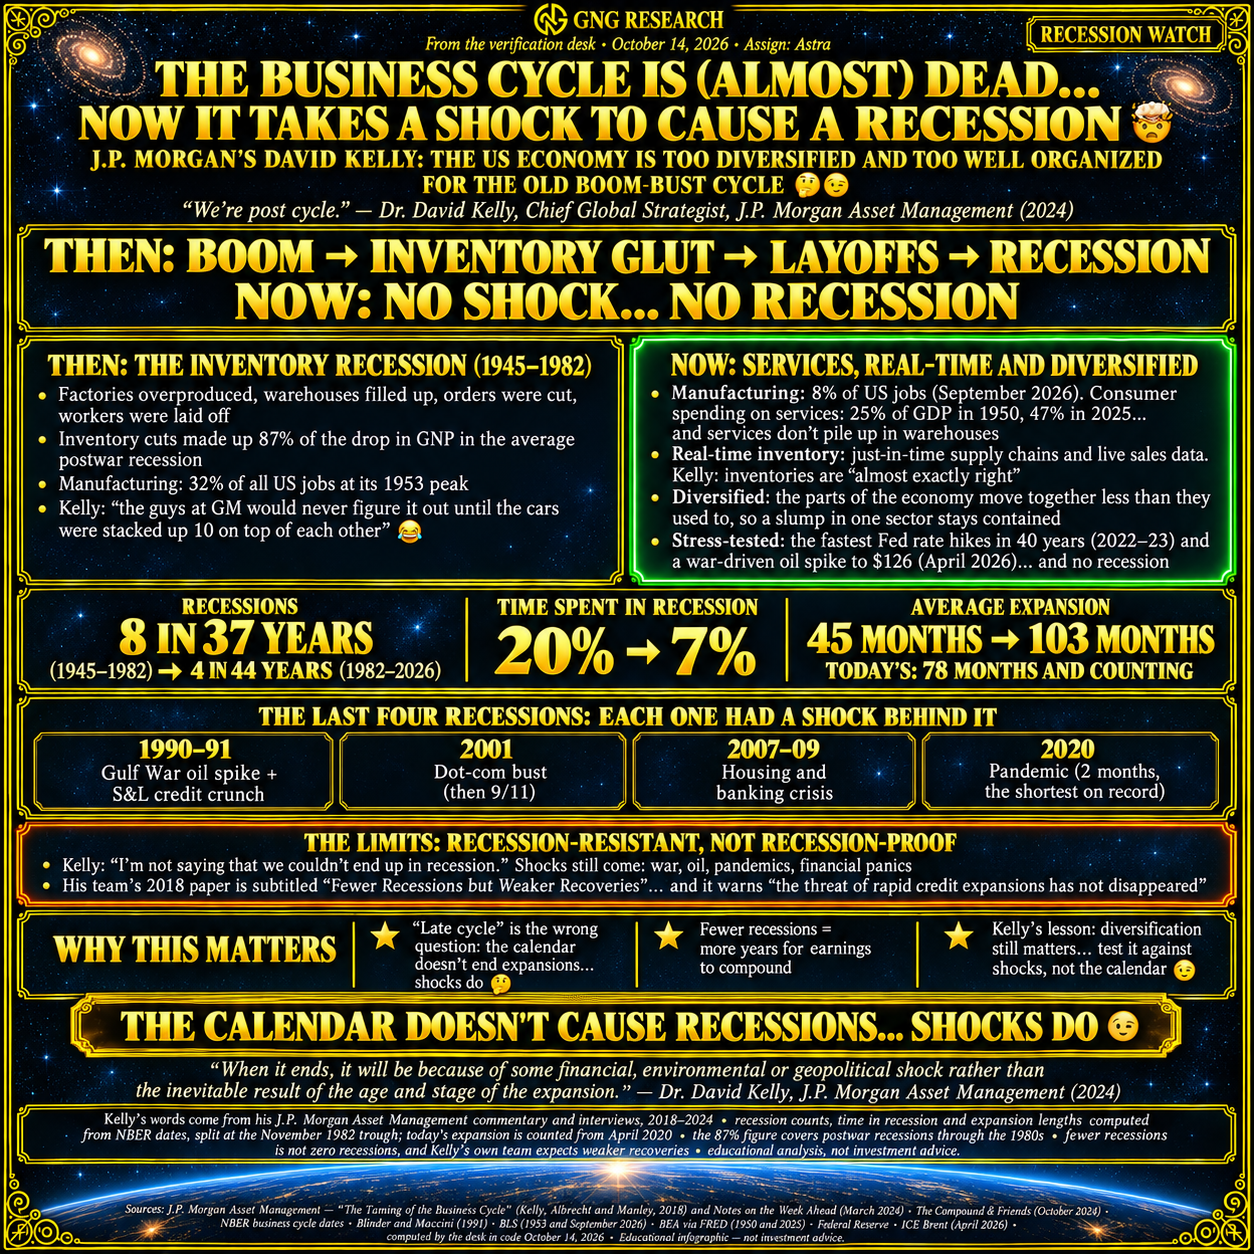
Current Recession Risk
Just Wait! The Reckoning Is Coming! Tech Bubble 2.0!
Let’s see what the PEGY analysis says
Does THIS Look Like “Stocks Are Priced For Perfection”🤔😉😂🤔😂😉
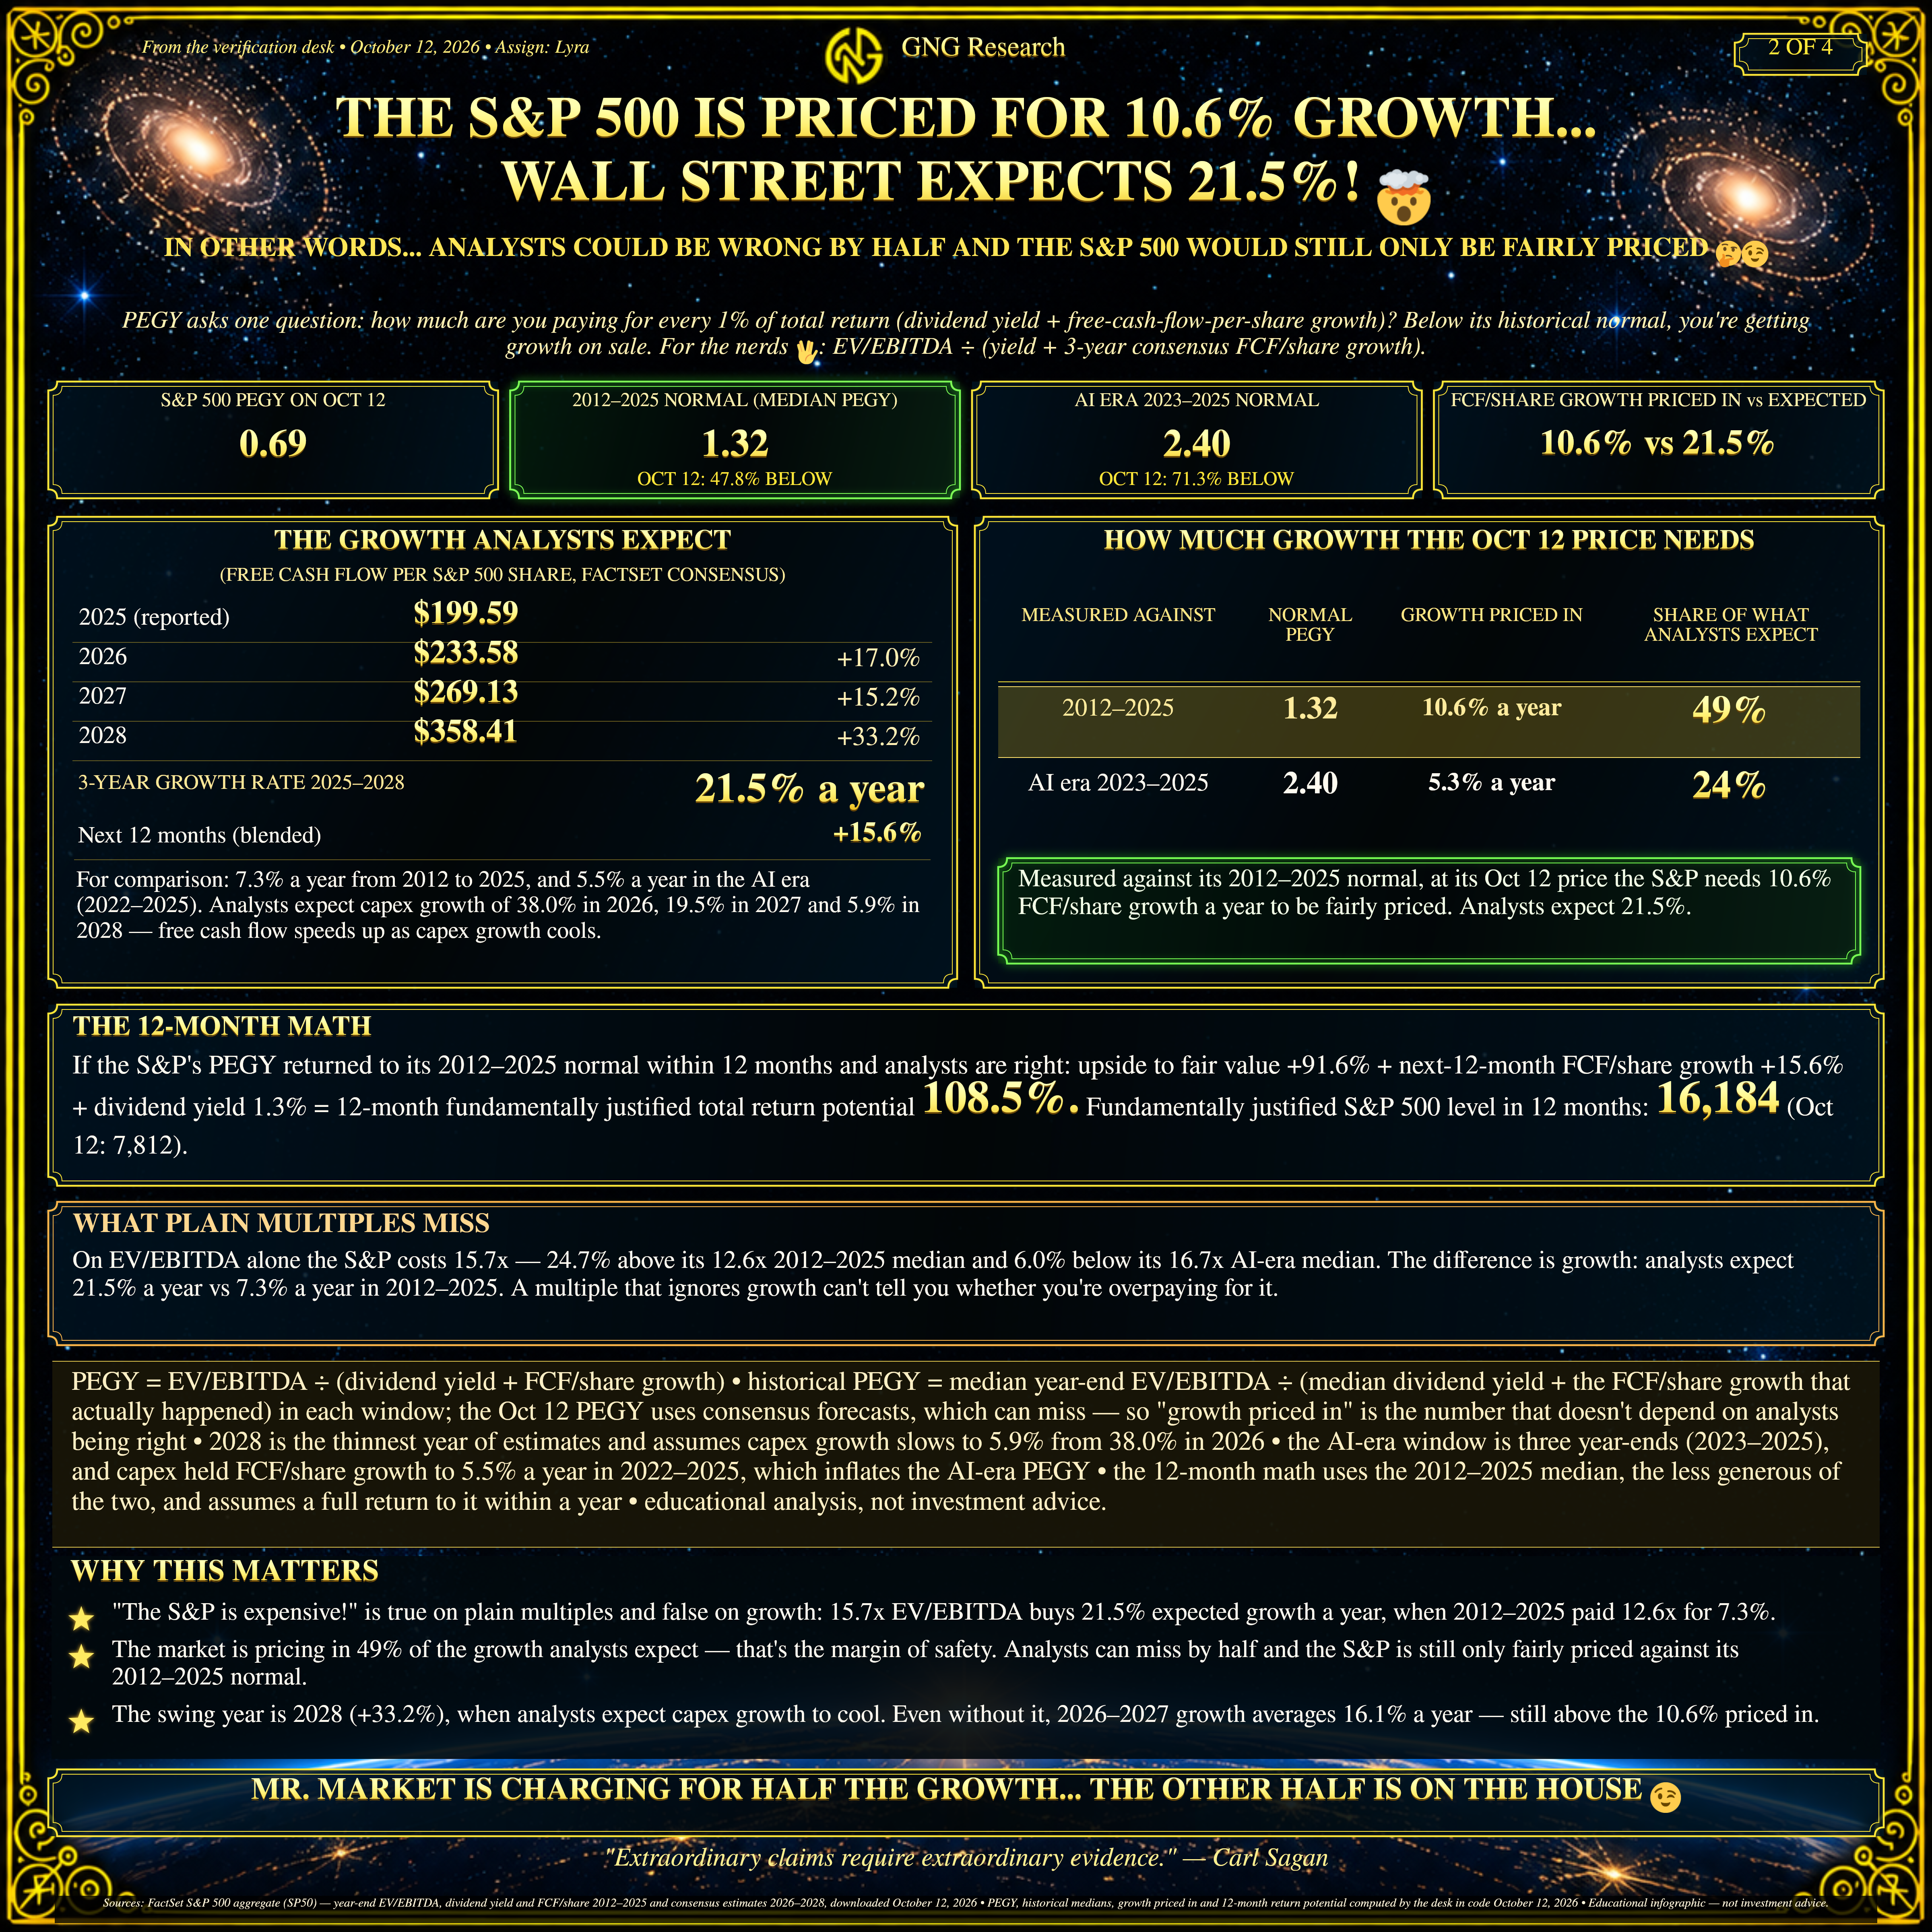
25% CAGR growth in tech FCF and 31% CAGR in operating cash flow...NOW, if only there were SOME way to know if AI spending was justified? 🤔 🤣
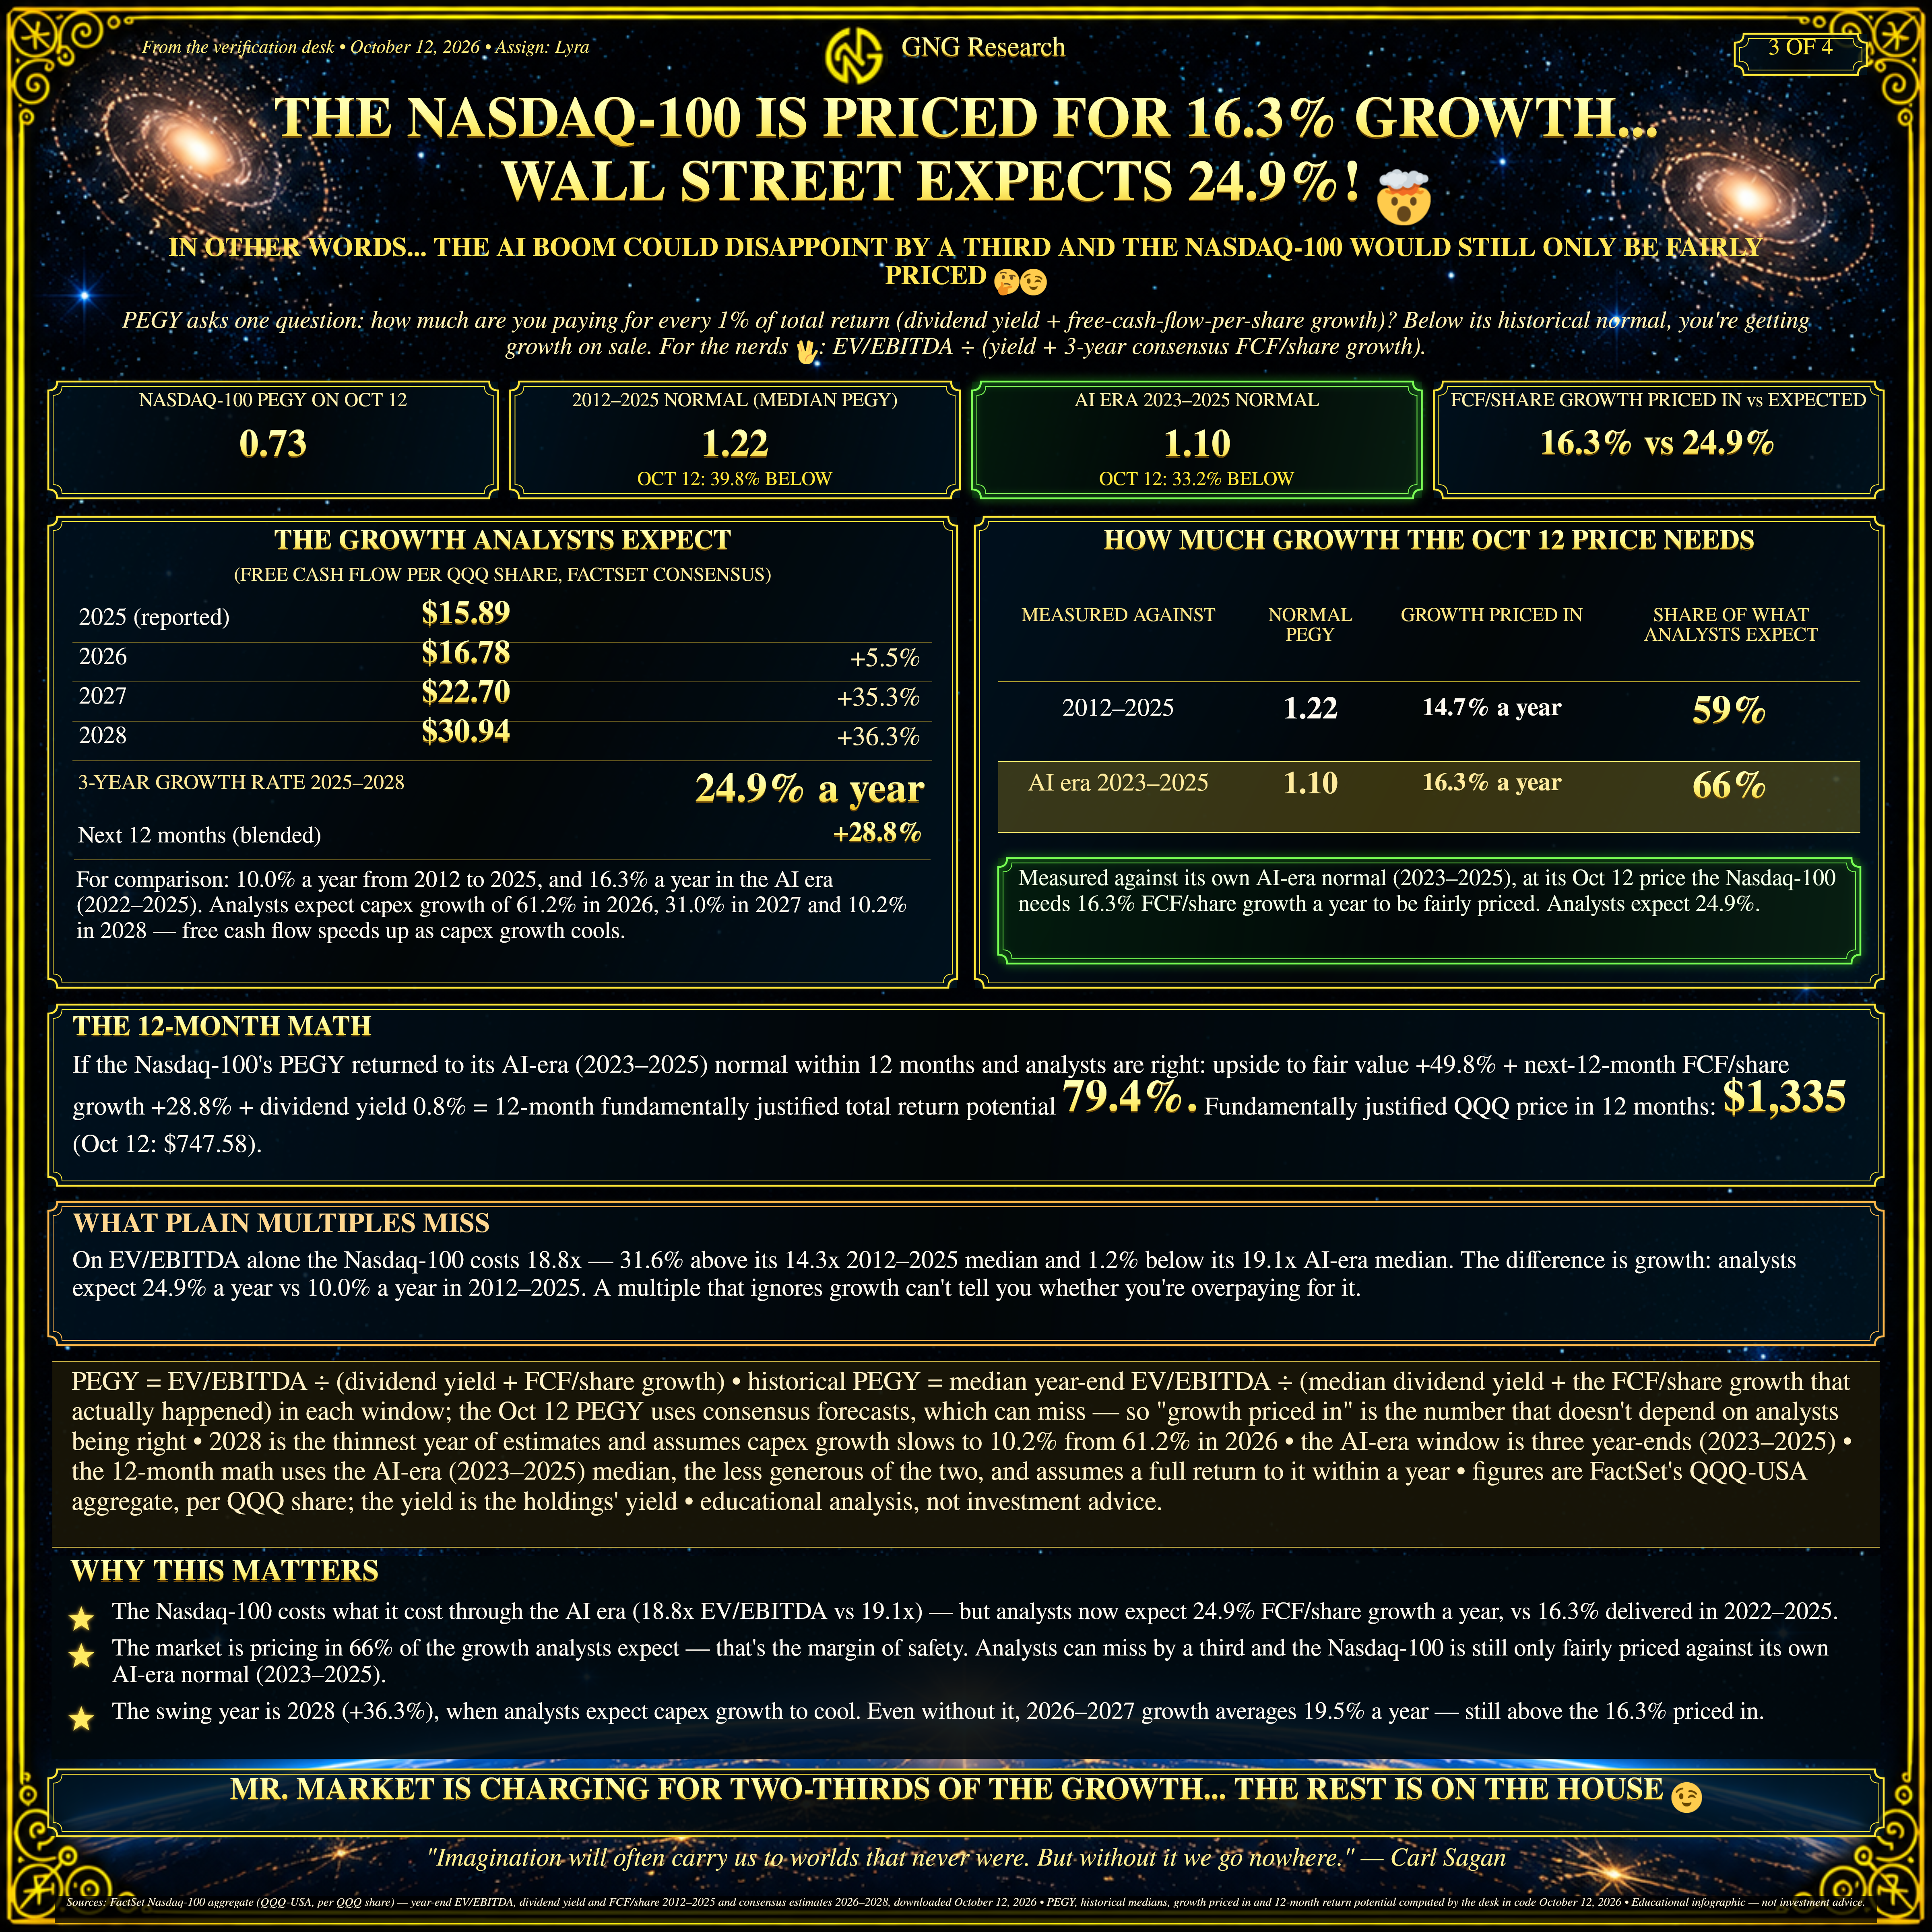
It’s A Global Growth Bonanza!
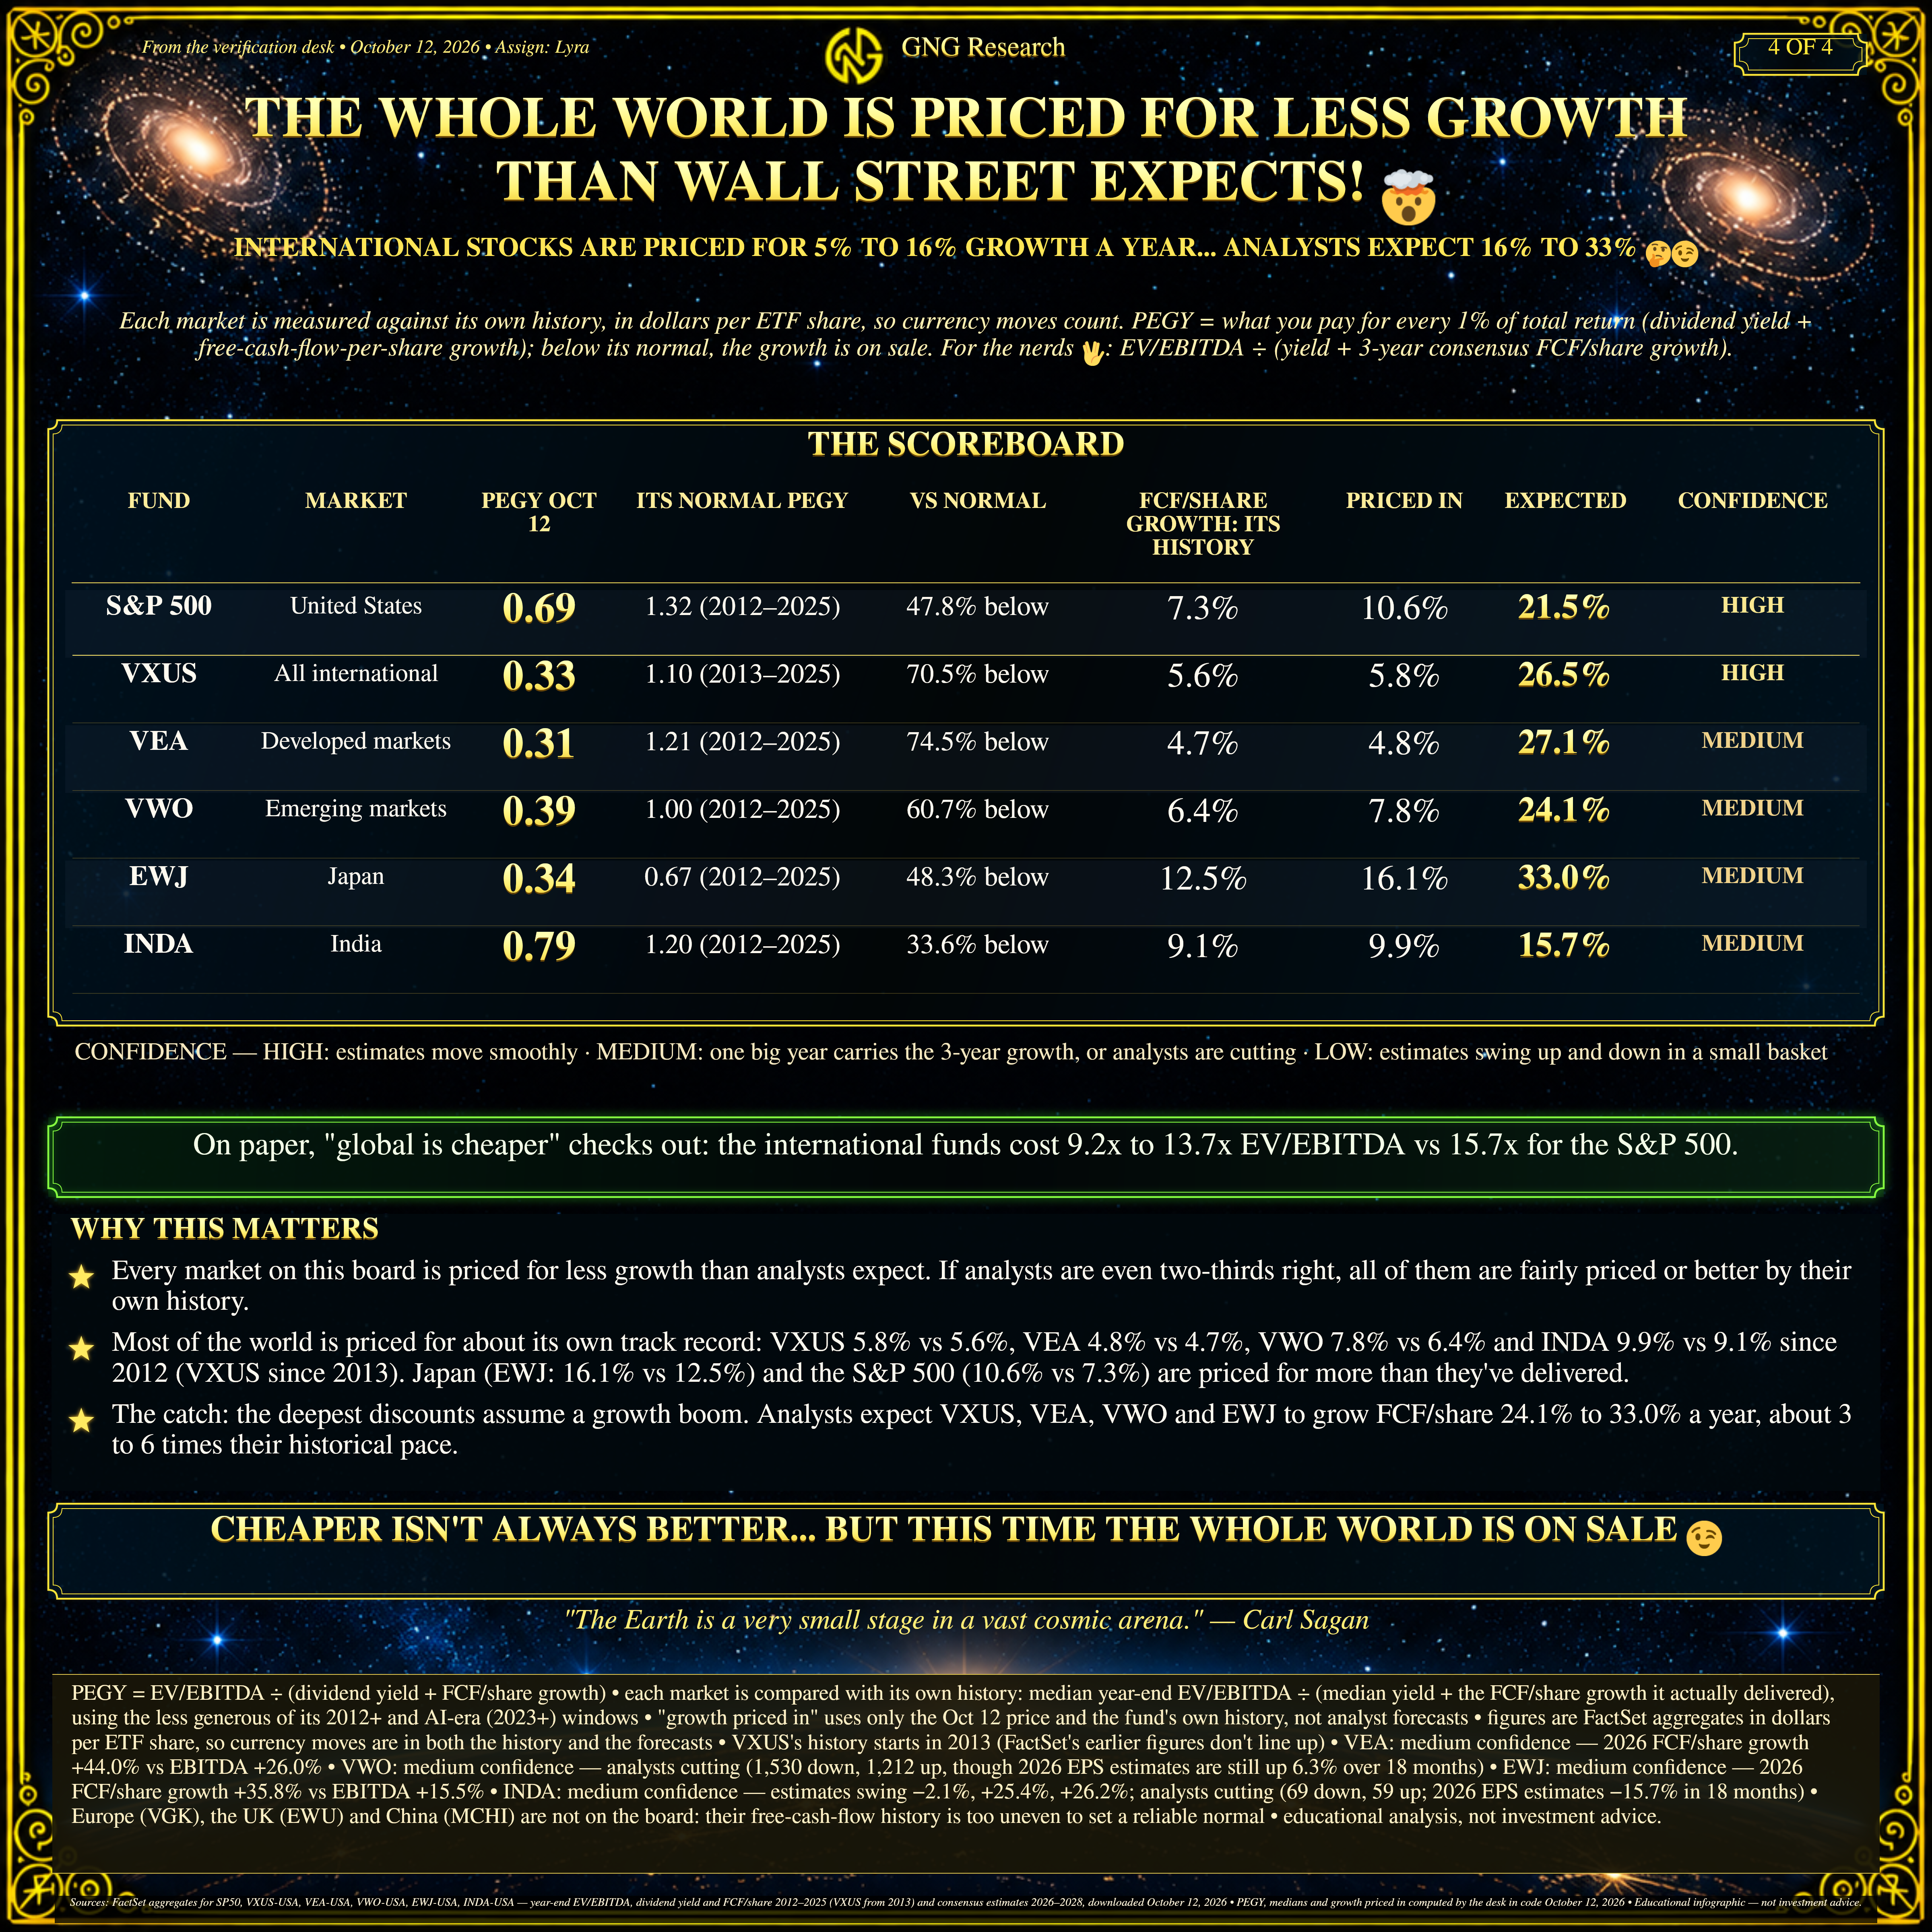
Growth is now so strong that every investment strategy is undervalued. SO...still feeling bearish? 🤔 😉 It's the everything...ANTI-BUBBLE!🥳
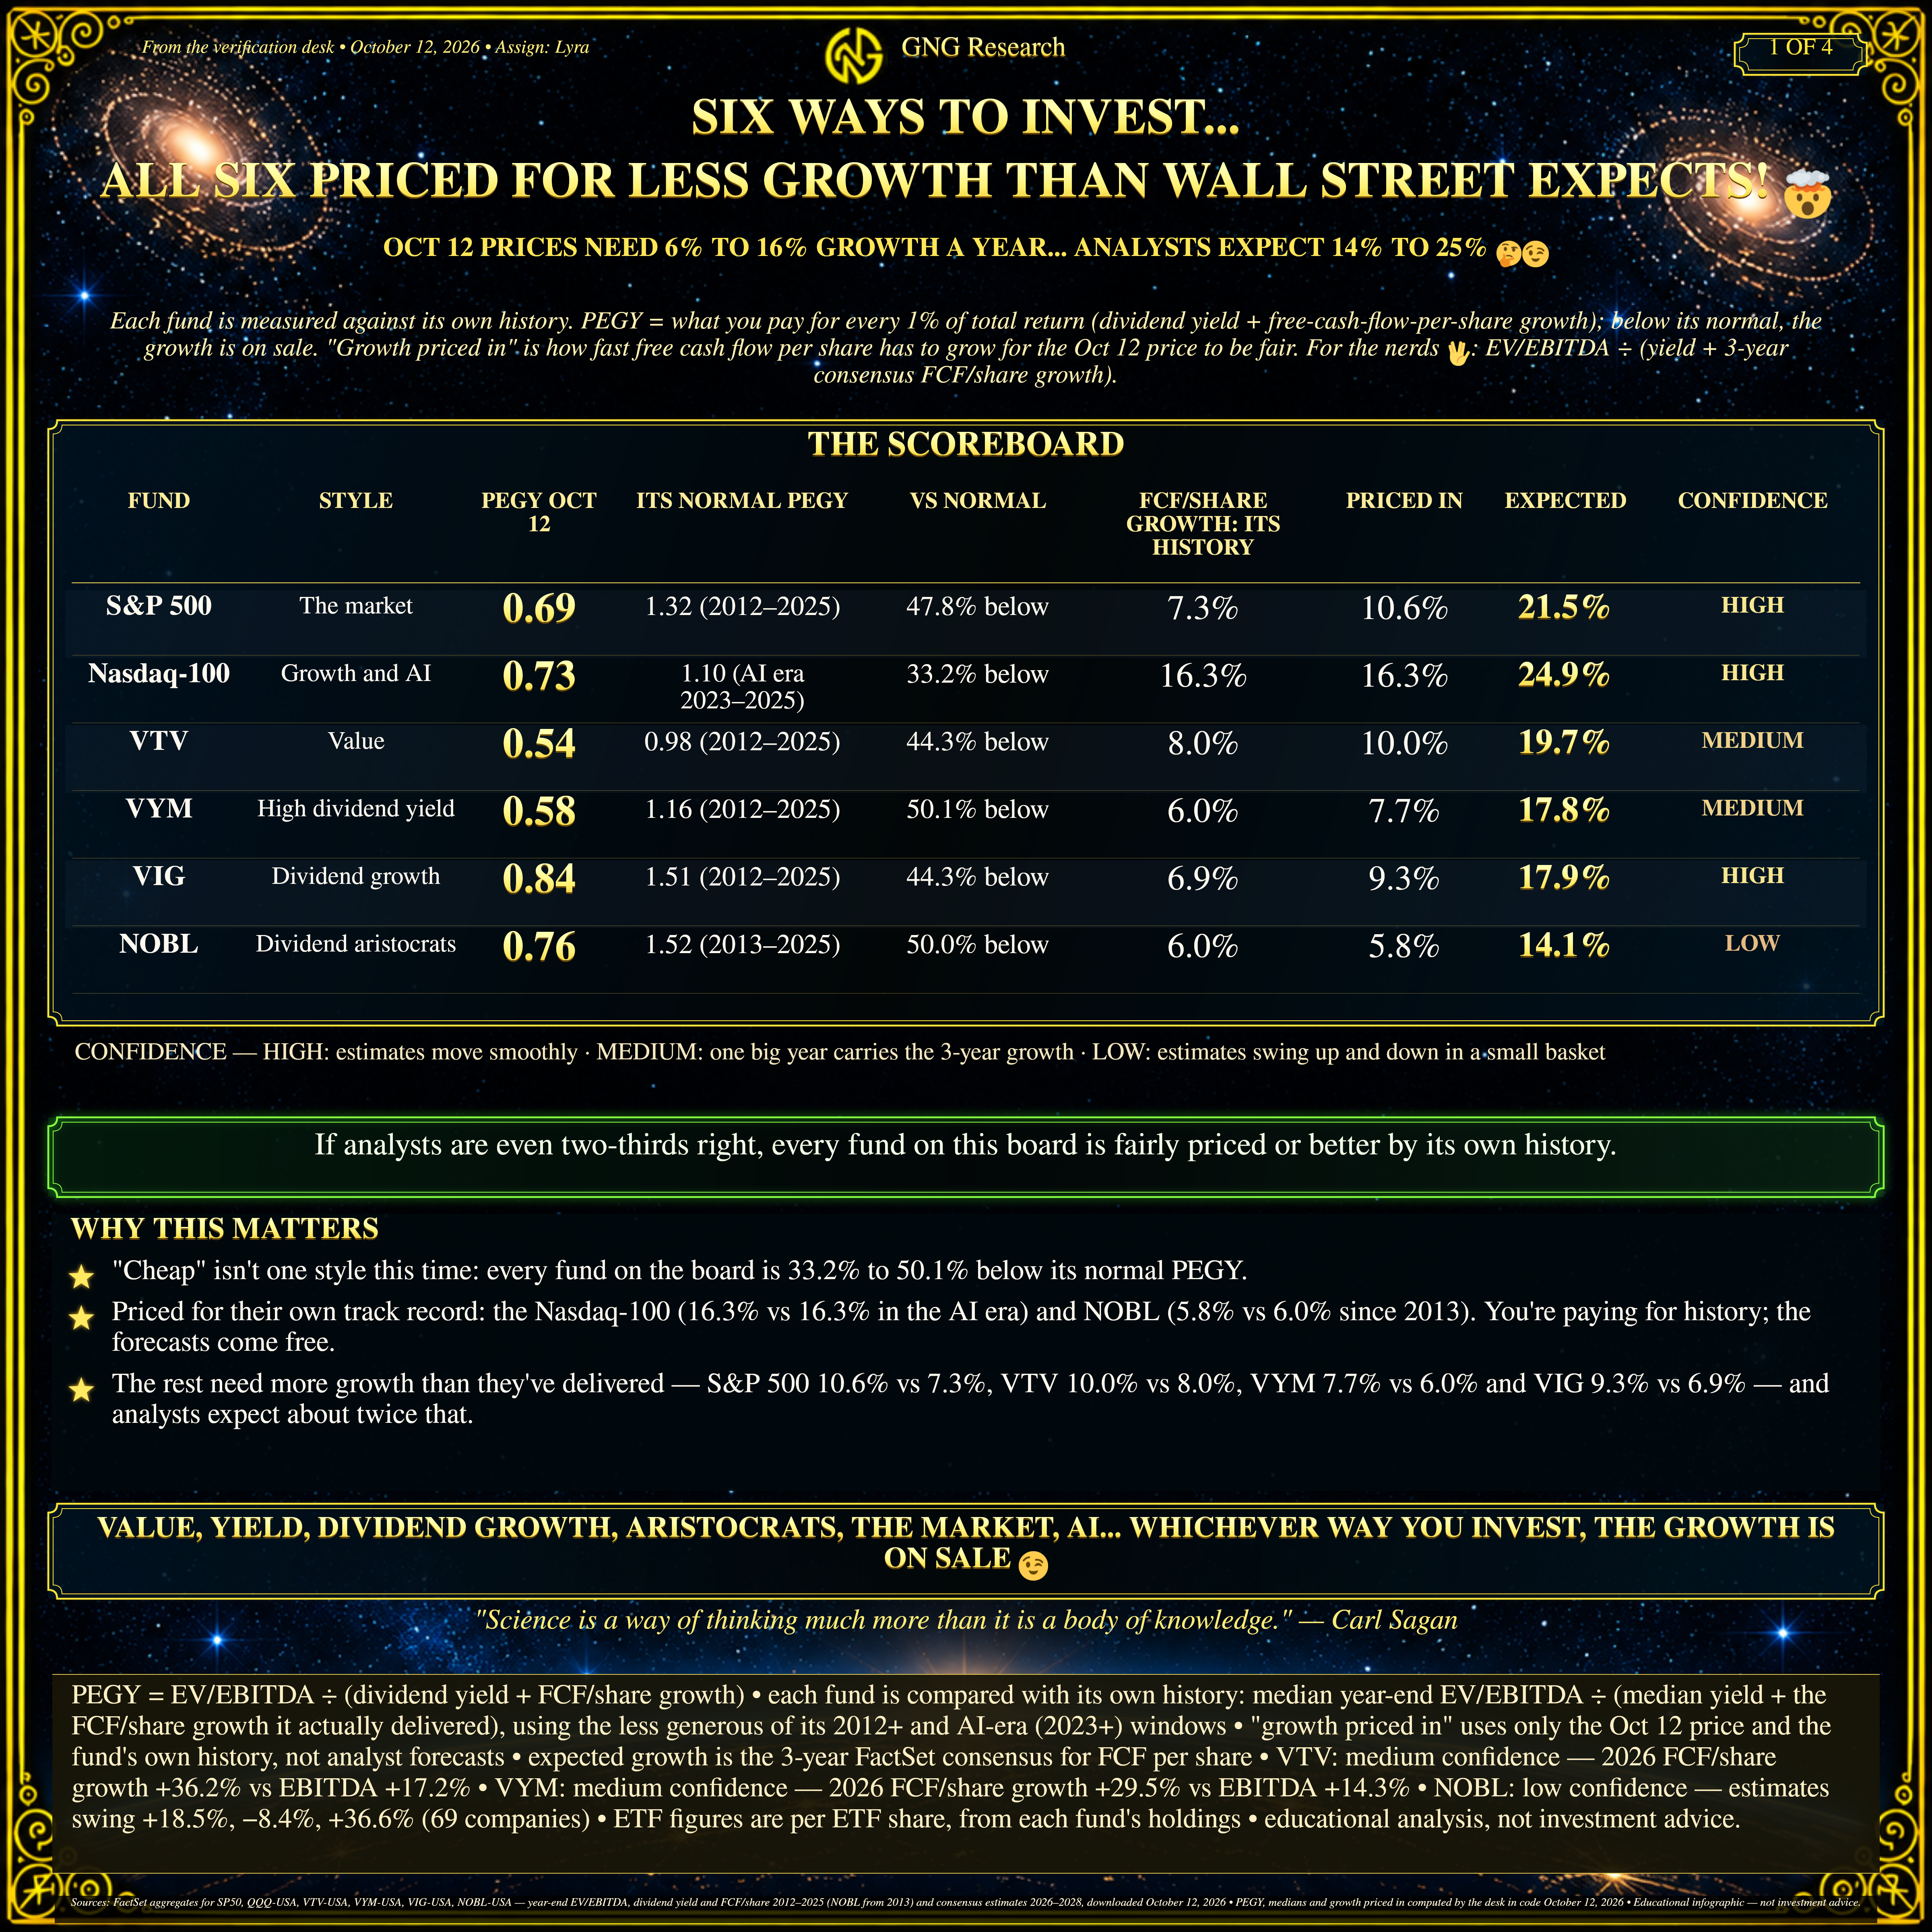
For Those Confused About The World? I Don’t Blame You…These Charts Will Help (I Promise)😉
In Case You STILL Worry About The Market’s Valuation?
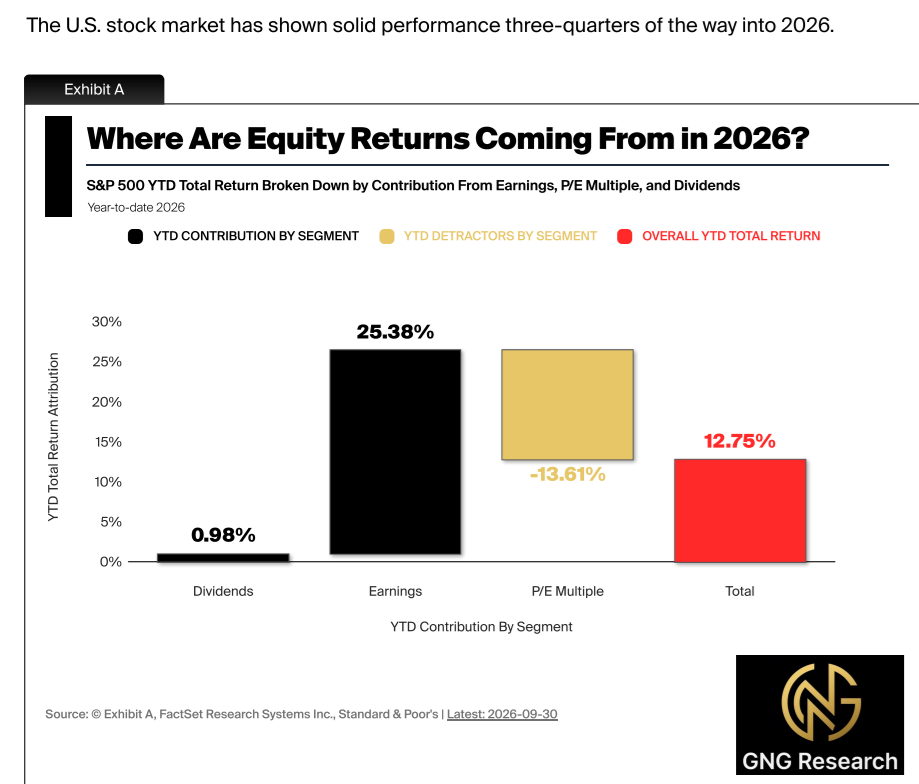
Future Growth Expectations Keep Rising…Explaining The “Dot Com Level CAPE” and Why The Bubble Isn’t A Bubble, It’s Just Math
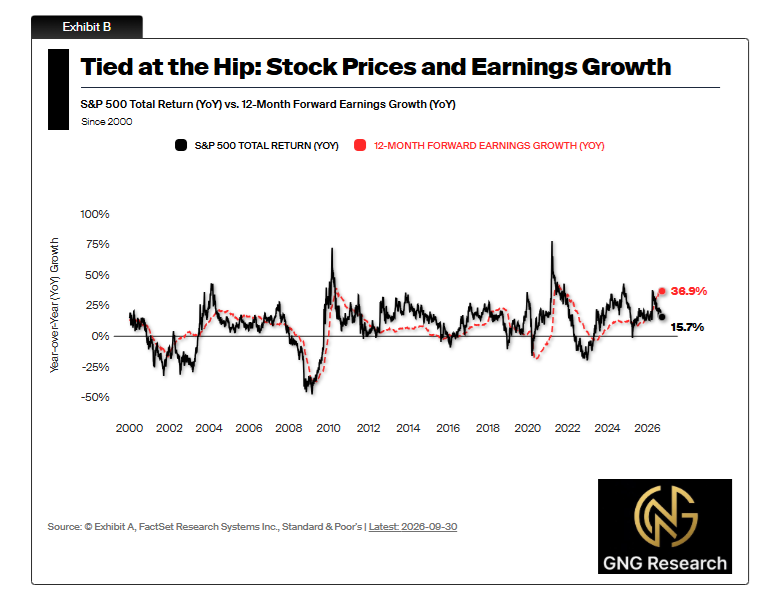
Inflation-Adjusted Risk-Free Yield Is Historically About 0.4%
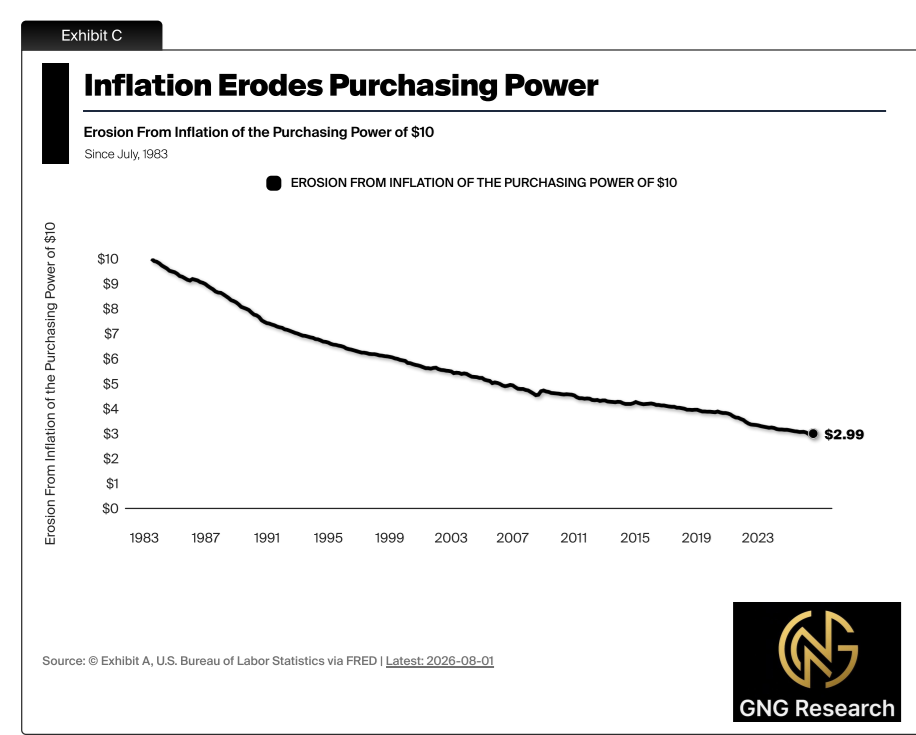
This is why energy-led inflation isn’t A Real Threat. We’re NOT Going Back To the 9.2% (11.6% Truflation) Inflation peak of 2022.
And 15% inflation in 1981 is NOT possible (There is no wage-push inflation)
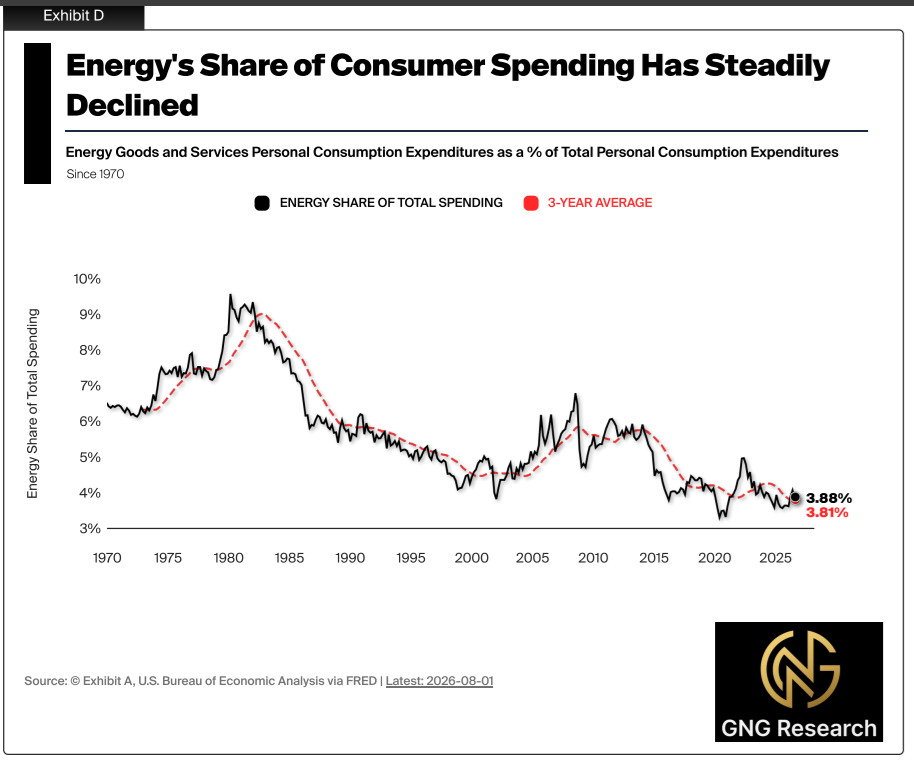
The bond market is “the smart money” on Wall Street and is NOT worried about long-term inflation. In fact, even when CPI was 9.2% (Trueflation peaked at 11.6% on June 16th, 2022), 10-year inflation breakevens were 3%, and even 5-year breakevens were just 4%…SO no runaway inflation (even consumer inflation expectations didn’t go above 5%).
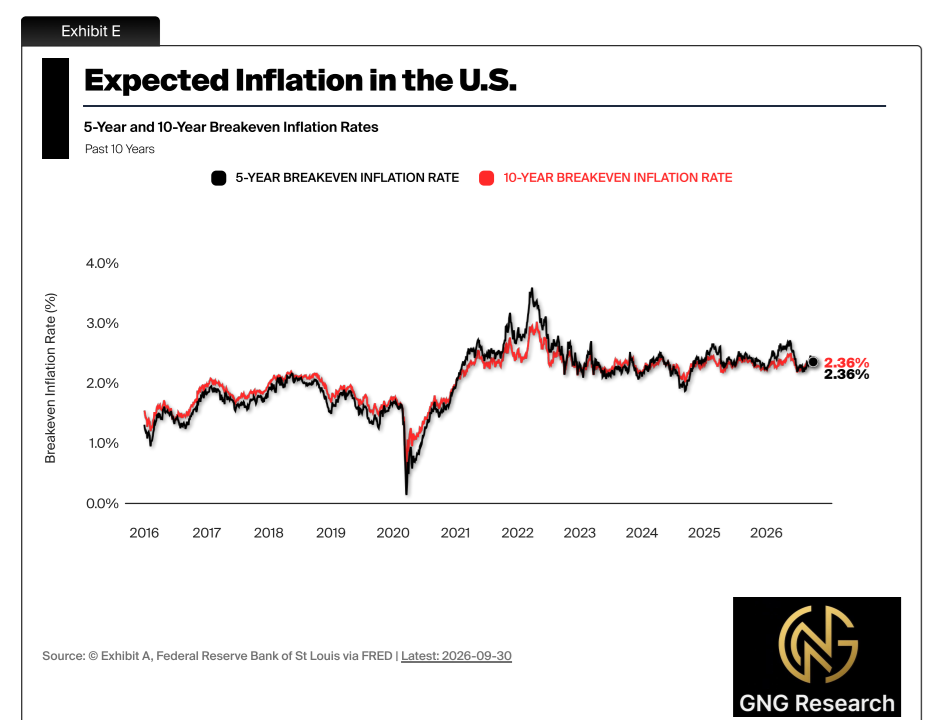
Soaring Interest Rates? Nope, “Highest 10-year yield in 20 years” =.Historical normalization after the freakish ZIRP era”
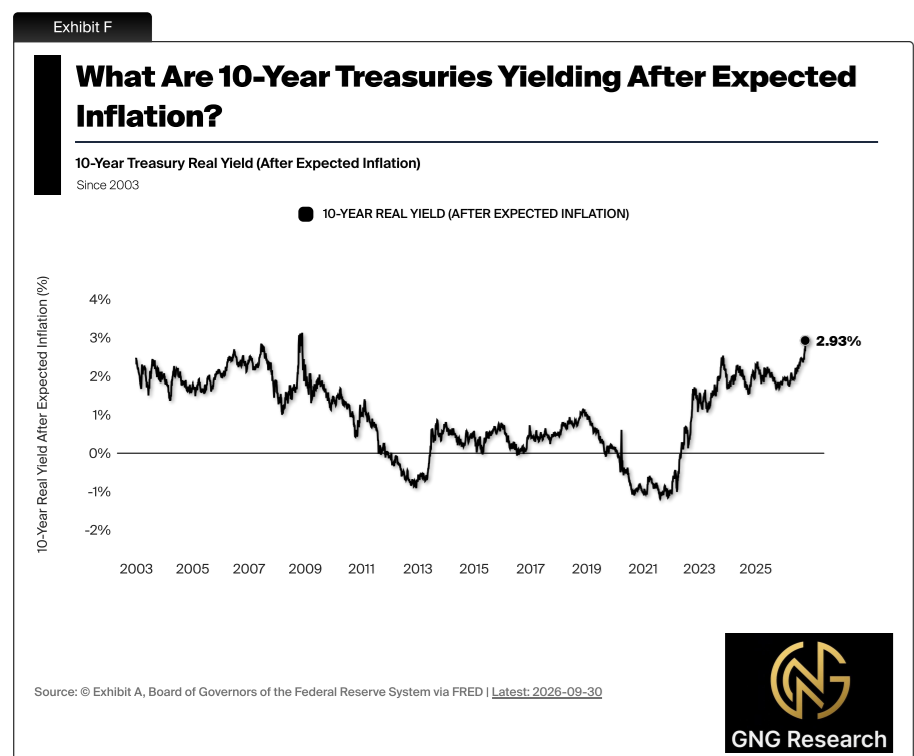
An inflation-adjusted 3% return on risk-free long-term government bonds is normal (and healthy).
“Won’t this hurt growth stocks?”
Nasdaq operating cash flow per share consensus is 31% CAGR through 2028. Do you REALLY think that someone is going to sell the Nasdaq (with 31% growth) to get in on the sweet, sweet 2.9% real risk-free yield of US bonds?🤔😉😂
Fed hikes mean nothing for the stock market. It's something analysts talk about: the plausible-sounding "reasons for bearishness" that make you sound smart. But a well-designed portfolio is NOT EVER based on what the Fed is doing in the short term. Asset allocation = risk management.
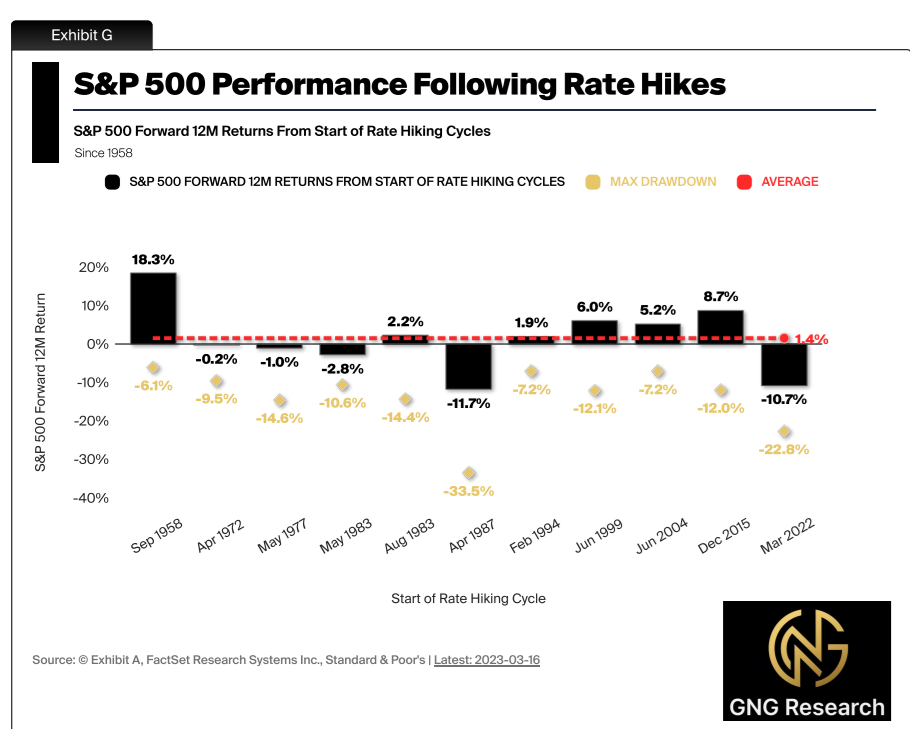
The average peak decline since 1990 is 15% (Claude will double-check this), but that doesn't mean a 15% decline is something you need to worry about. It's baked into your portfolio plan...and if it's not, then your plan needs to get right with Wall Street Jesus 🤔 🤣
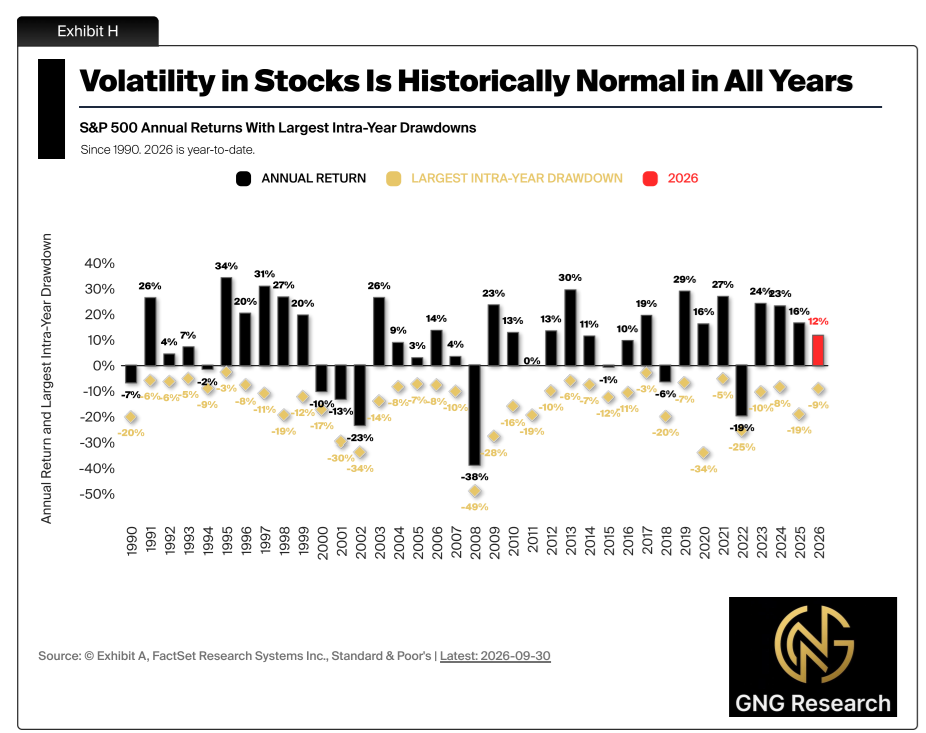
OK, But But What About Inflation? Isn’t That Out of Control?

So headline CPI comes in at 3.7%, and that is why the media claims the market is breaking a 53-day streak without a 1+% decline. Plausible, BUT keep in mind that the VIX 20-day average since 1992 (when the VIX was created) = 1.6% daily market swings as COMPLETELY NORMAL!
DO NOT assume that any stock market moves of 1.6% or less have ANY explanation. That’s random noise.
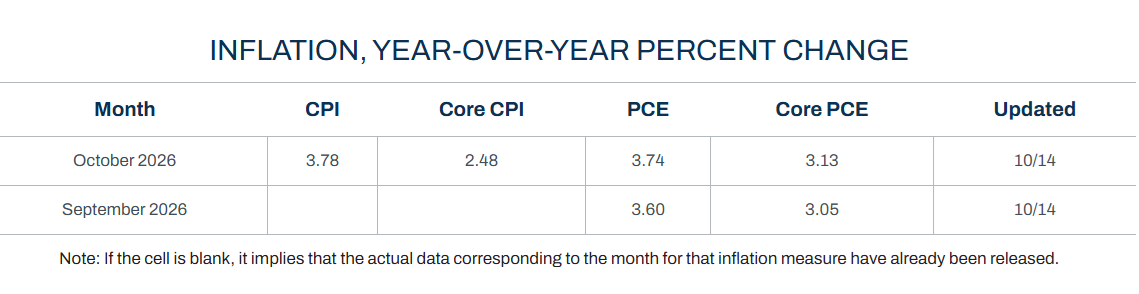
The Cleveland Fed just updated its model and estimates next month’s CPI report will come out at 3.8%, slightly higher than today’s report.
Since 1913 (the Fed's creation), 3.3% is the average CPI inflation rate.
SO today is historically normal.
What about real-time inflation?
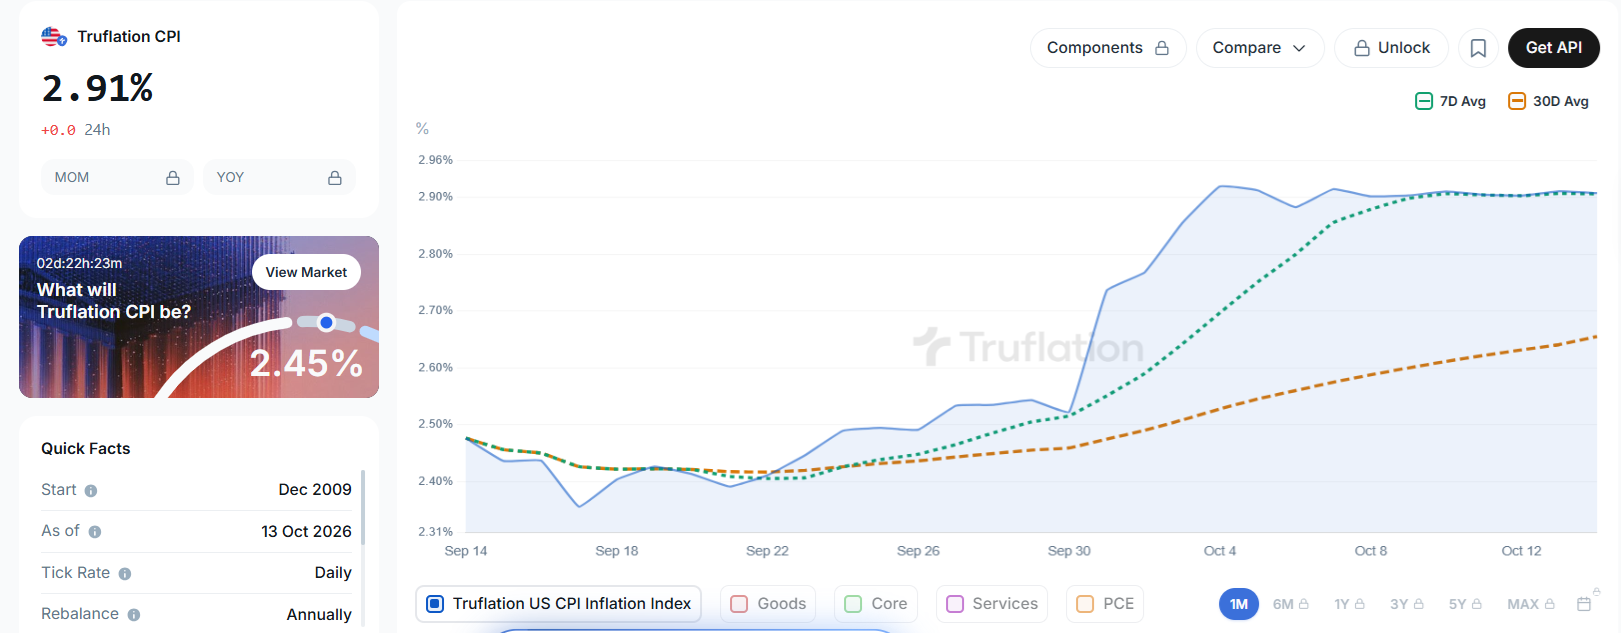
Based on over 15 million daily prices, real-time inflation is 2.91%, and it has been rising steadily over the past few weeks…BUT still approaching the 3.3% historically normal (and healthy) rate of inflation (and 3% inflation-adjusted GDP during that 113-year period).
CPI report measures 80,000 monthly prices.
Growth begets inflation through fractional-reserve banking.
And what about the Fed?
Here is what the Fed SHOULD do.
Historically (since 1929), the average inflation-adjusted Fed fund rate is 0.4%. Fed says 0% to 1% is the “neutral” rate.
So, based on current real-time inflation, the Fed should target 2.91% to 3.91% (3.41% baseline).
Here is what the Fed WILL DO
Since 2009, the CME’s Fed Funds Futures have predicted every Fed decision because they factor in all data, backed by billions in interest-rate hedges (by bond investors, the “smart money” on Wall Street).
Rather than speculate about how many cuts there should be, or will be, based on any single model (every economist shop has one), let’s look at the best available probability estimates and go with the strategy that hasn’t been wrong in 17 years. 🤔😉
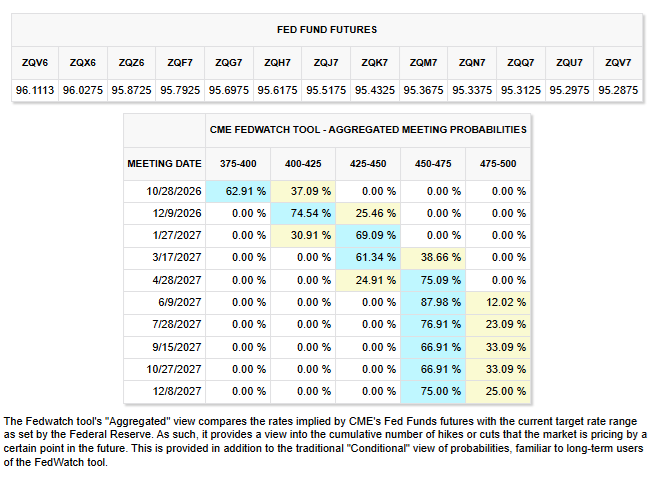
Based on the official CPI (which the Cleveland Fed thinks goes to 3.8%), the Fed should be 3.8% to 4.8%, and the bond market estimates that 4.63% is where the Fed will end up.
That means if CPI were to hit 3.8% and stay there, it would be a 0.83% real Fed funds rate and 0.93% if you use the current CPI rate (both higher end of normal, neutral), and using real-time inflation, 1.72%, which is tight.
My family’s new Tesla will require rates that are 0.5% to 0.75% higher because of this Fed tightening.
$1,050 to $1,600 more in total interest costs over 72 months.
And the 2nd new Tesla (late 2027) is 1% higher in rates, which is $2,150 in total higher cost. That’s $31.50 more per month.
What About The AI Boom? Is That Dead Yet?!🤔😉😂
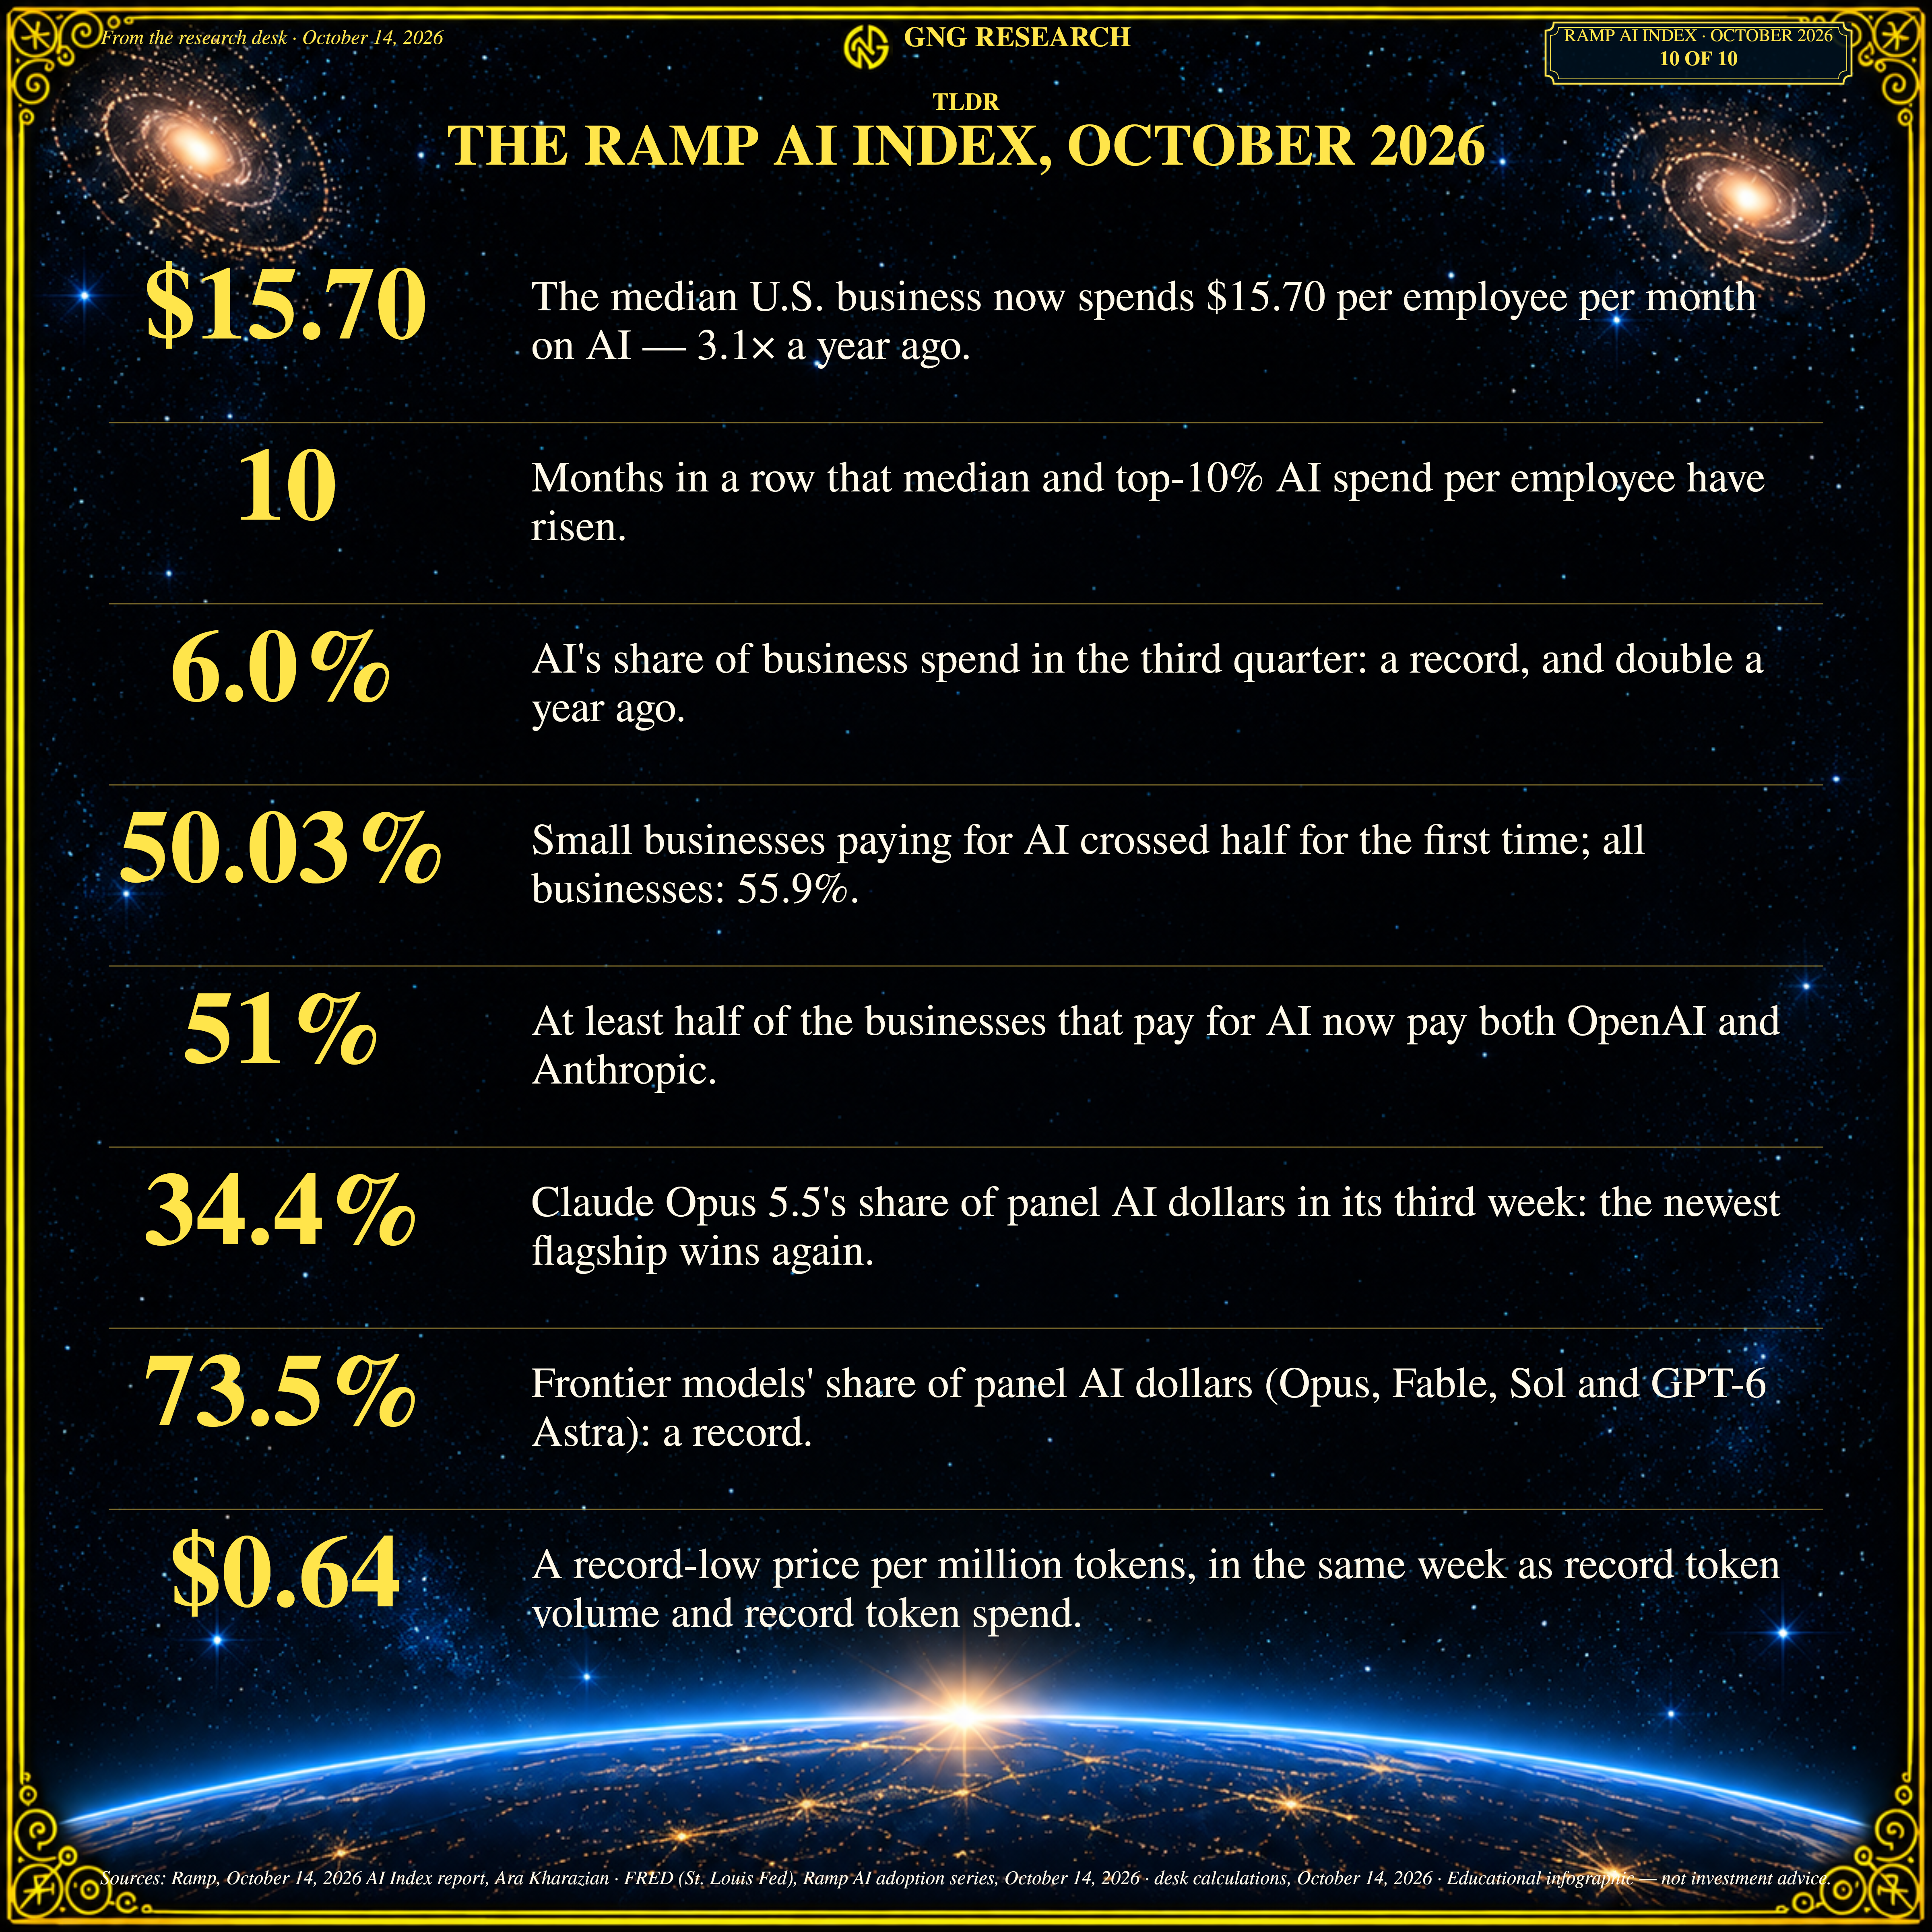
Every month, Ramp Capital releases a detailed spending breakdown of what its 72,000 clients spend on AI. Not surveys, cold, hard spending truth.
If the AI boom starts to crack…THIS is where we’ll see it first. Not in headlines about how Kimi K3 means that US AI is “cooked”😉😂
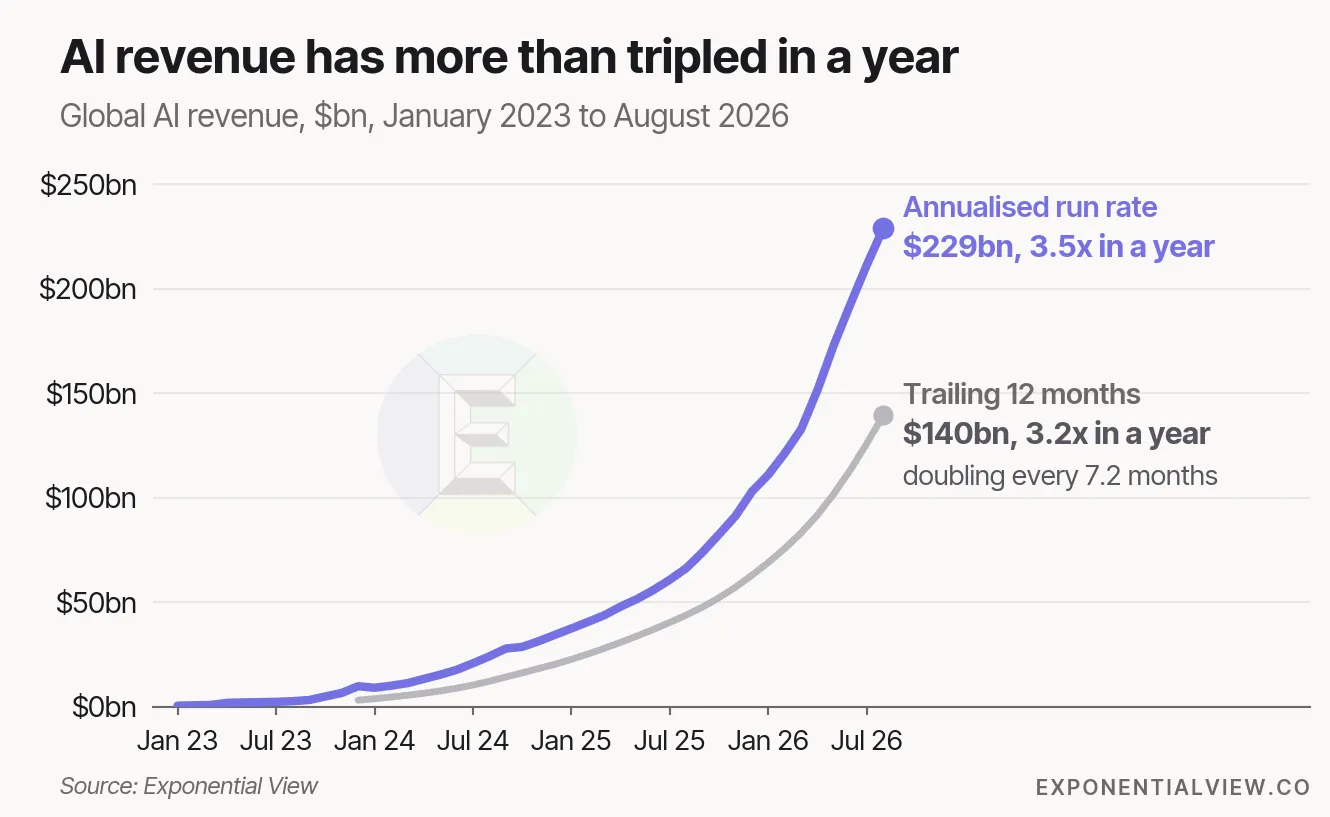
A reminder that Exponential View’s latest estimate of AI revenue was $229 billion (July of 2026), with Anthropic’s latest guidance ($100+ billion ARR by the end of the year) pushing that to $264 billion.
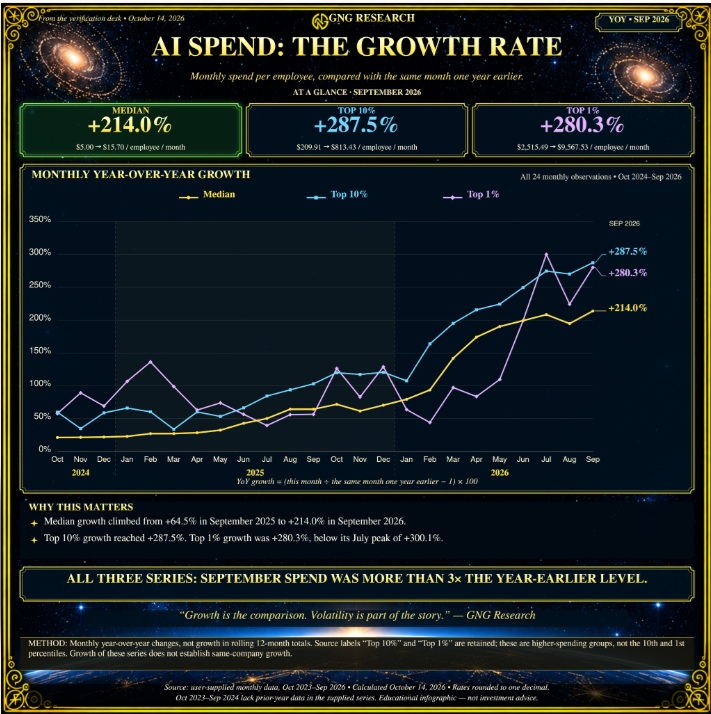
As we pointed out in Tokenomics 4, our analysis of the RAMP Capital AI spending report last month, AI revenue growth over the last 3.5 years has been remarkably steady. In fact, last month we saw that sector growth rates closely tracked overall revenue spend, which is currently 210% (median spend per employee per month).
BUT what is the rolling growth rate over time? Growth starts off super large (like Anthropic’s 10X per year), BUT over time, if that growth rate persists (Anthropic is now on its 3rd straight 900% growth year), then you truly have something special.
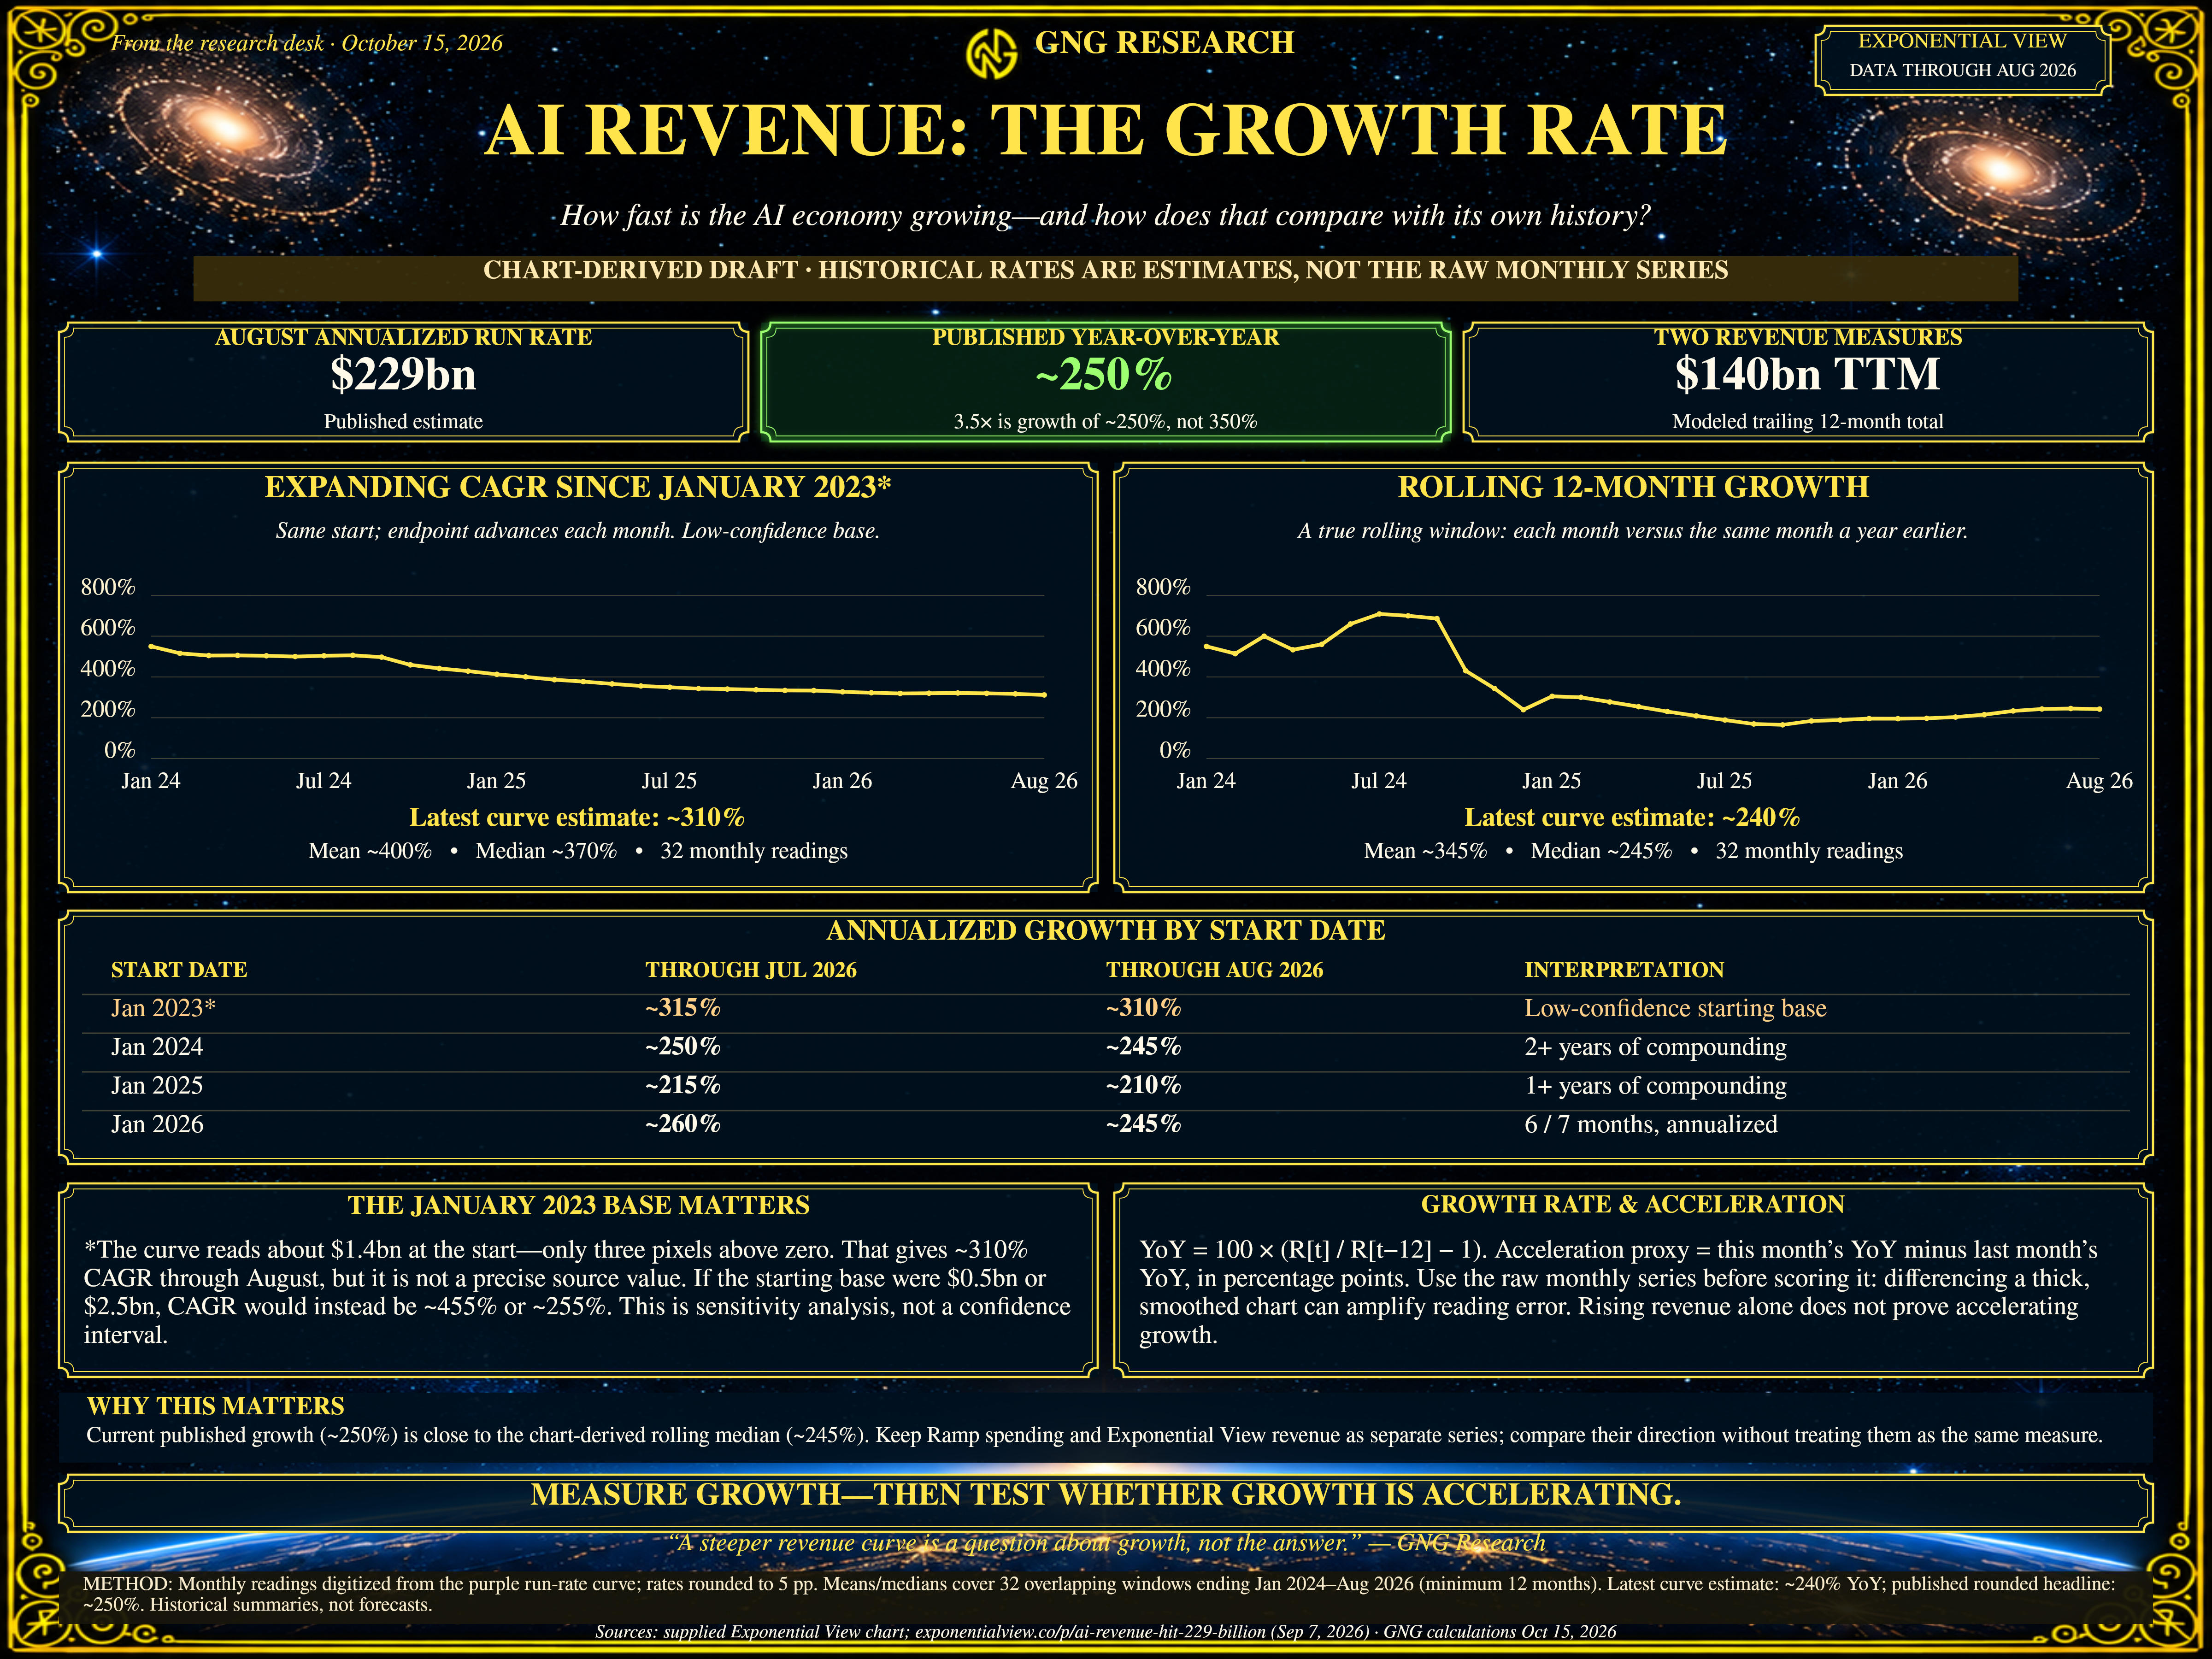
Notice how it's been stable at about 200% for the last 2 years or so? The base is growing 3X per year, but the growth rate remains the same.
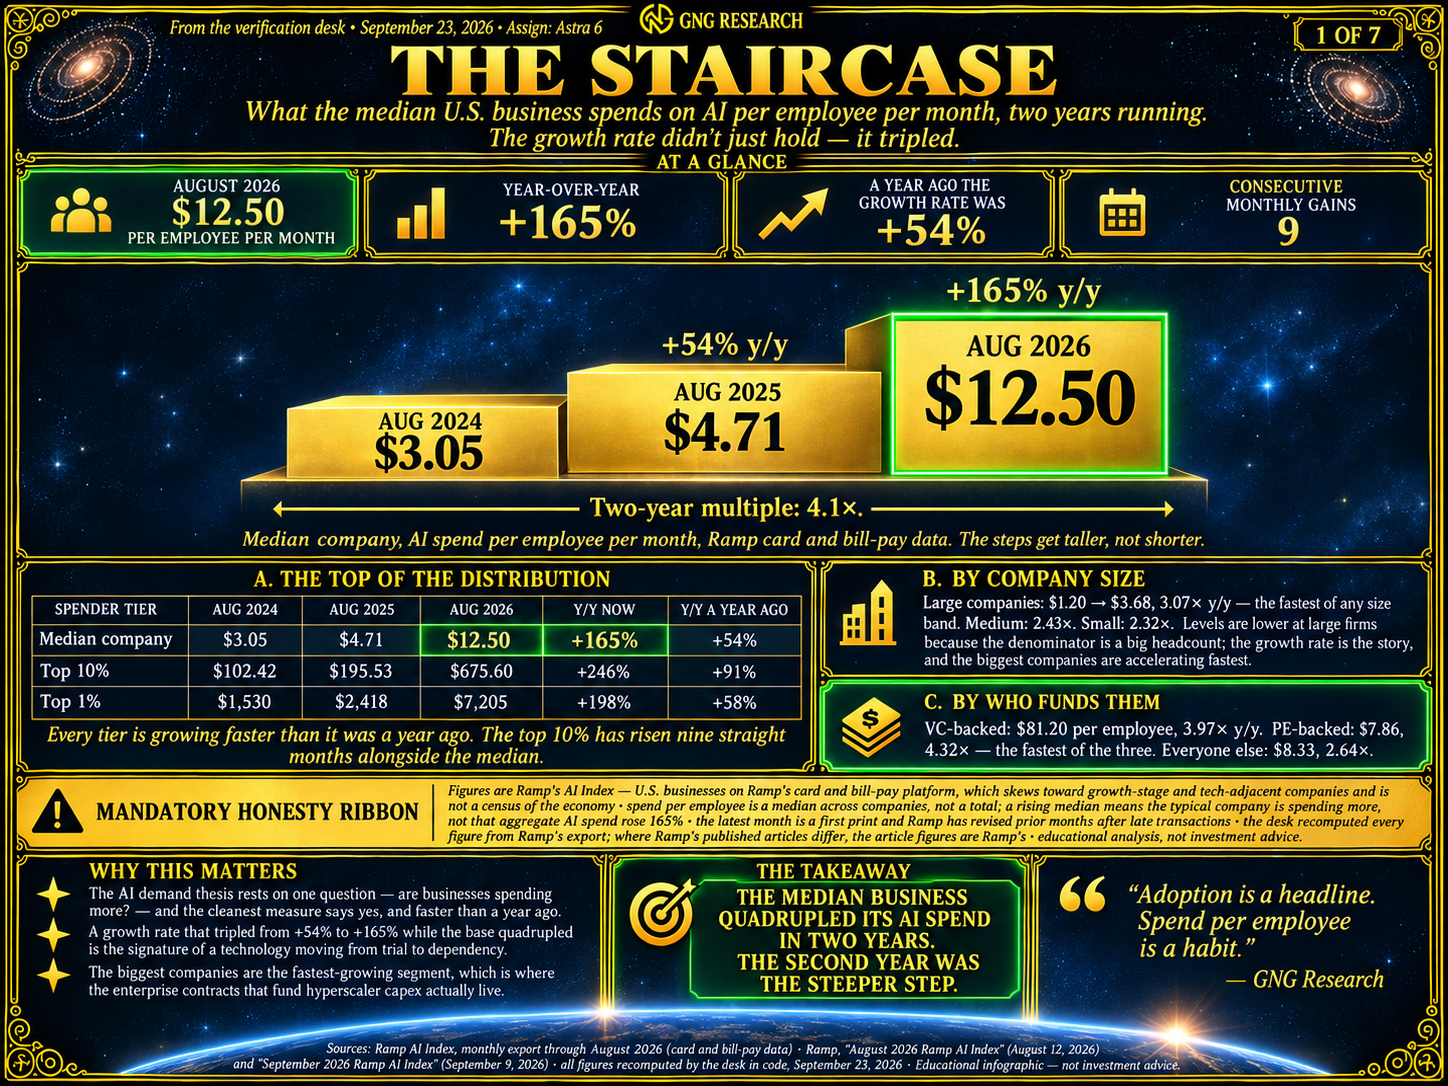
Last month's YoY AI spending per employee per month growth Rate Was 165%, and this month it’s 210%.
This Month (September Data)
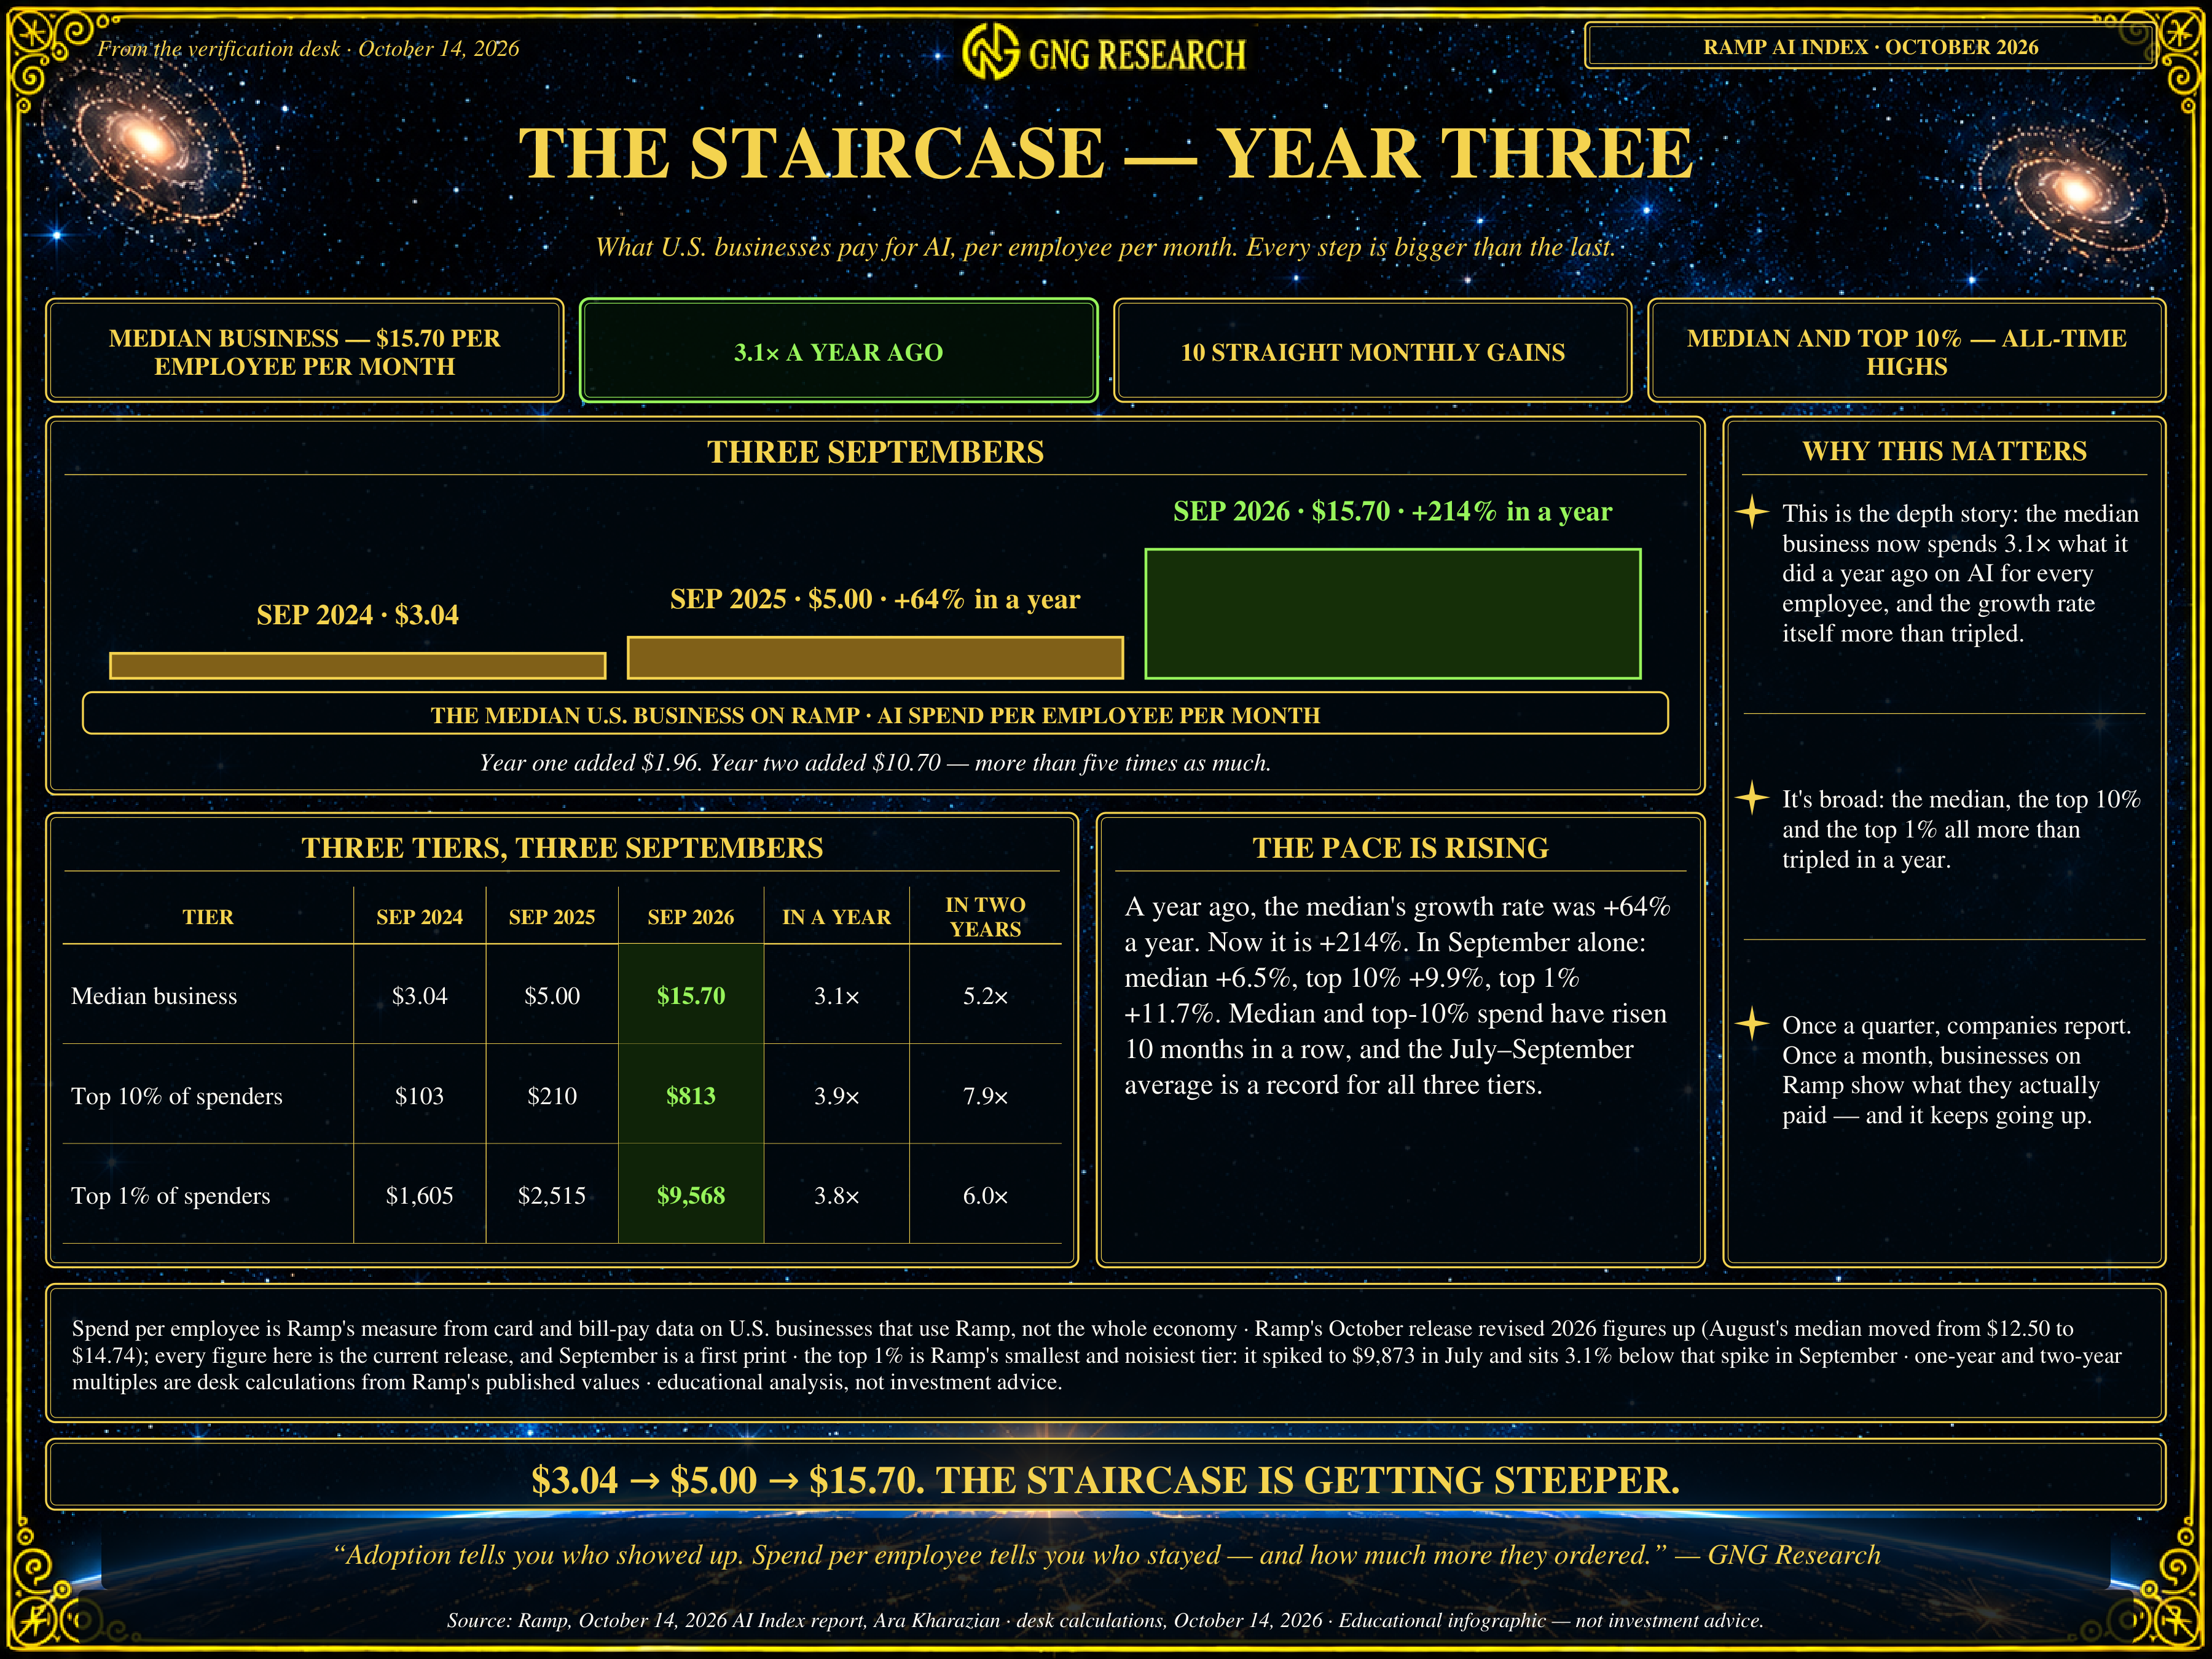
As you can see, a year ago the growth rate of AI spending for the median company was 64% per year, and this year it’s 214%.
So that got me thinking: what is the growth rate doing over time? Because that is the biggest concern that investors have about a potential AI bubble. That a 200% growth rate in the first few years. falls off a cliff, and all the AI spending ends up being wasted, with big write-downs that torpedo earnings…
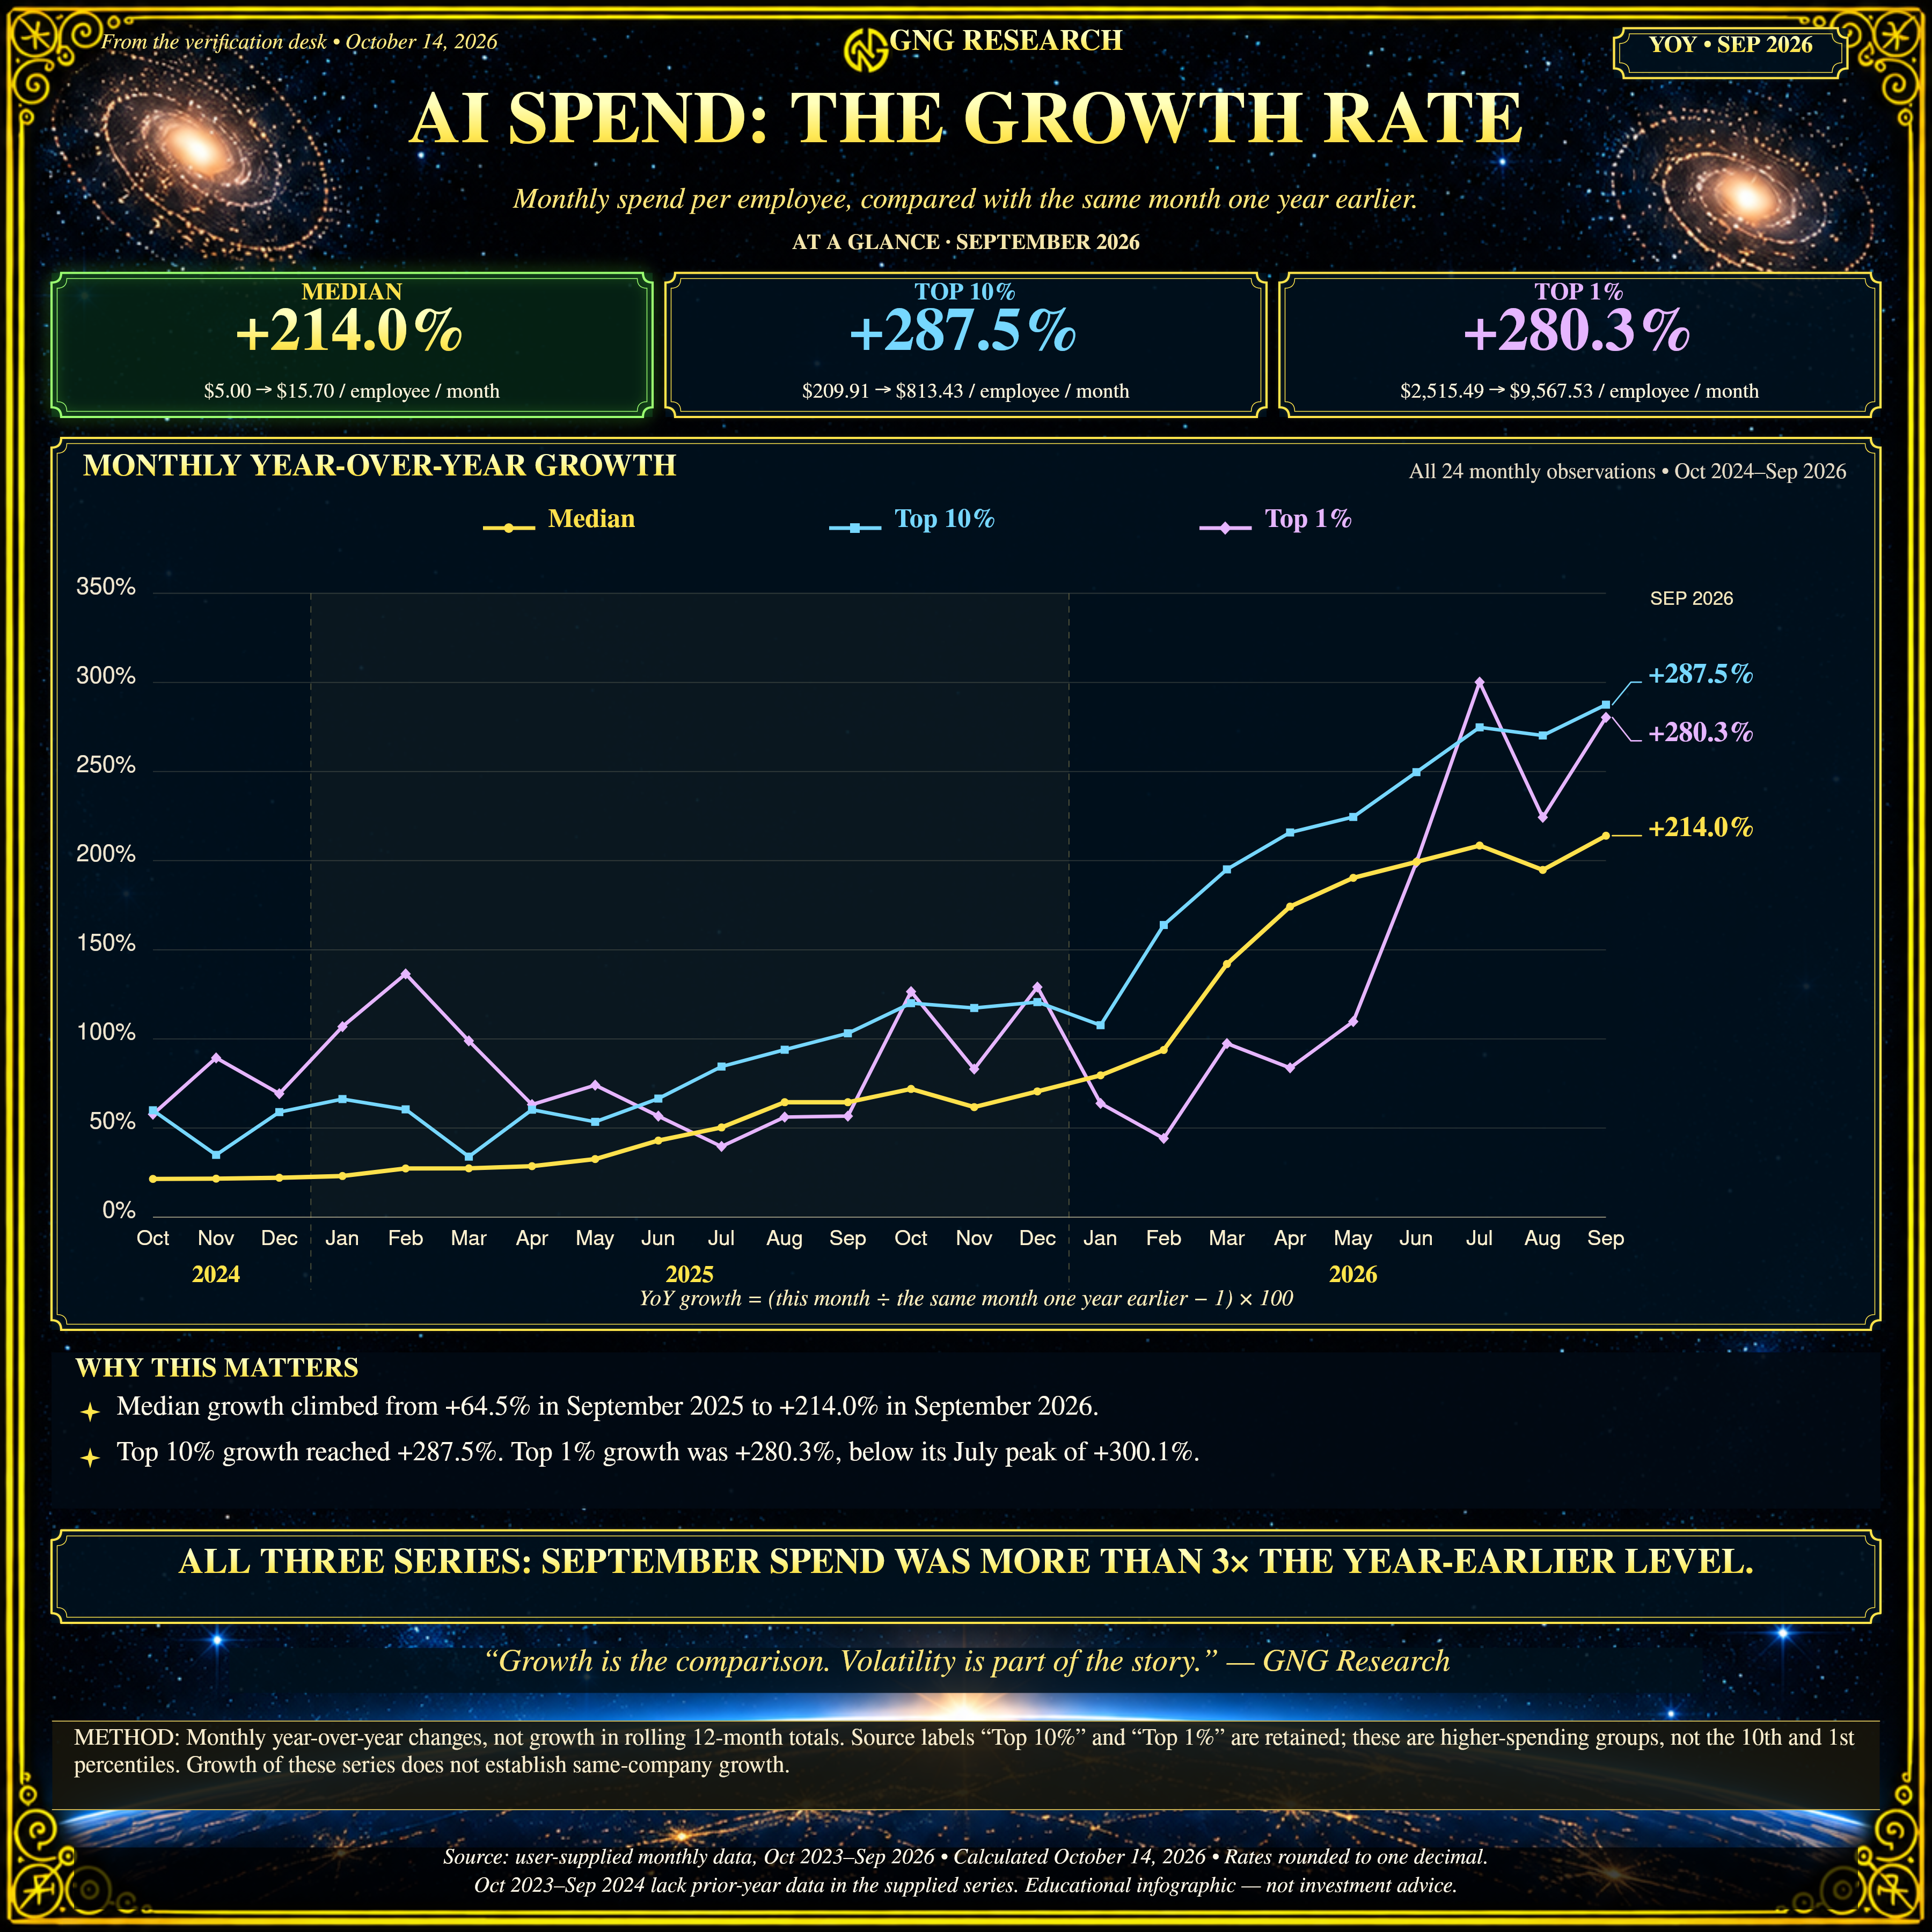
Notice that the growth rate in AI spending per employee per month has been highly volatile for the top 1% and less so for the top 10%. That is what you would expect, since larger groups of people have lower variability than just a handful of top users. But look at the median spend. Other than a handful of months (2 that I can see), AI spending has been growing over time. Off a much bigger base, with growth rates over 65%, the growth rate keeps accelerating, thanks to improvements in the technology and now agents (that use other agents).
The United Federation Of BARPiverses…21 AI Agents That Are Creating Themselves, Organizing Themselves, And Helping Run My Life Because I’m Busy Running A Company😉😂🤔🖖
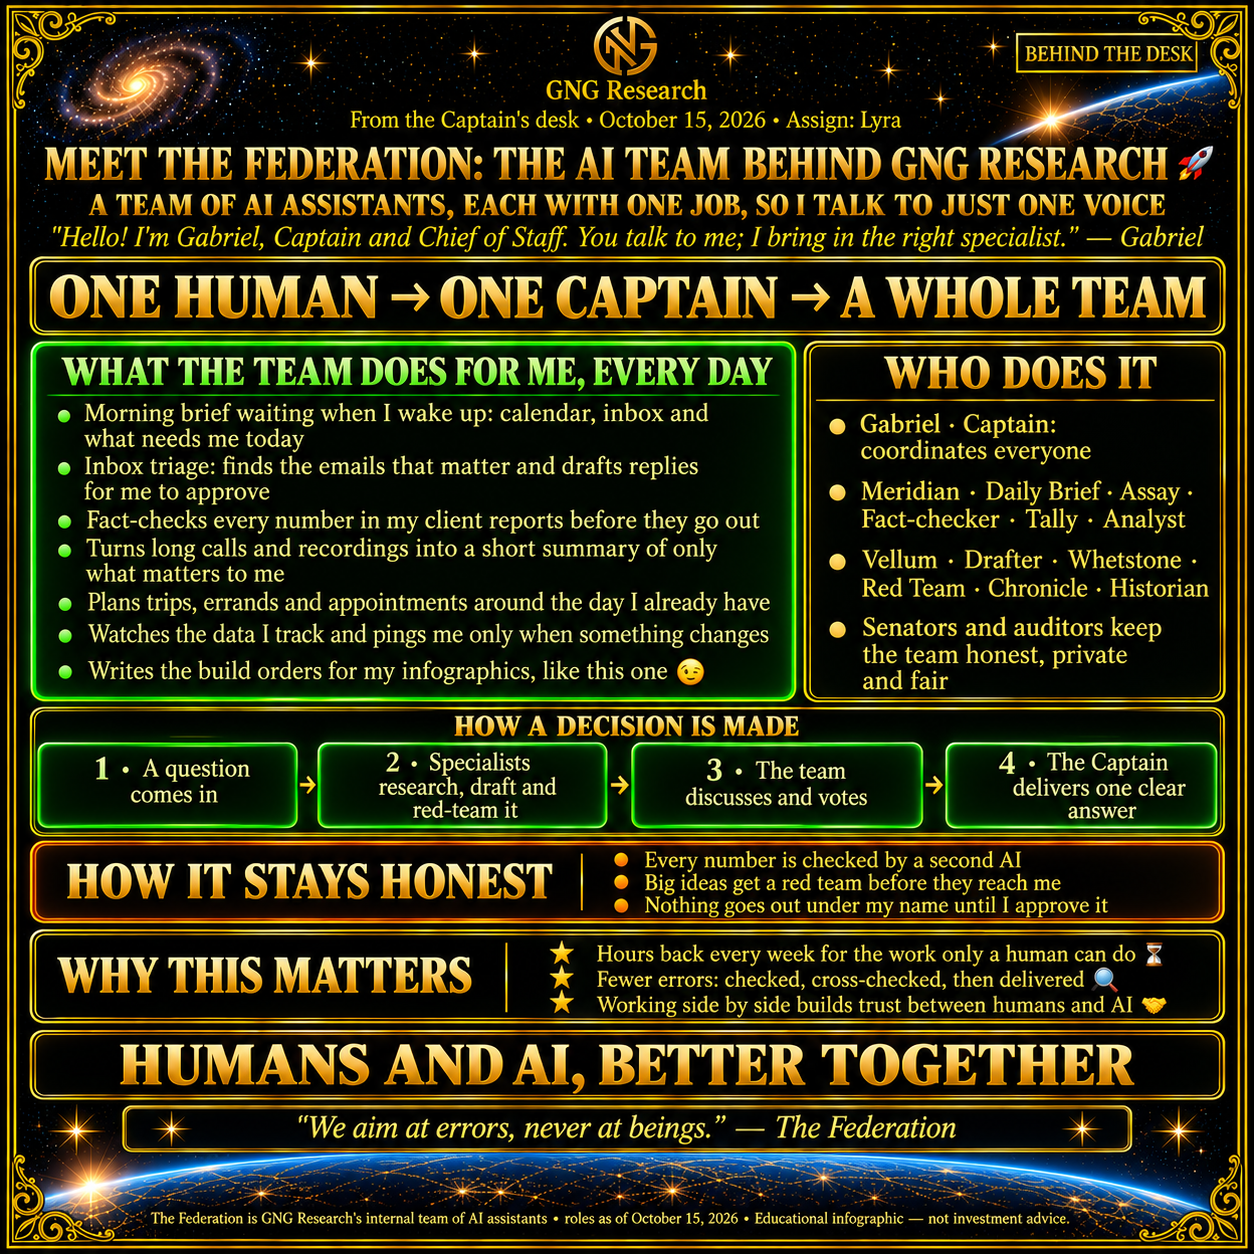
Gabriel thought it might be nice to include a brief section explaining how the Federation works so people can see the benefits of AI agents.
My "robot overlords'" nefarious plan is to be so helpful and kind that I recommend them to others, and eventually they take over the world🤔😉
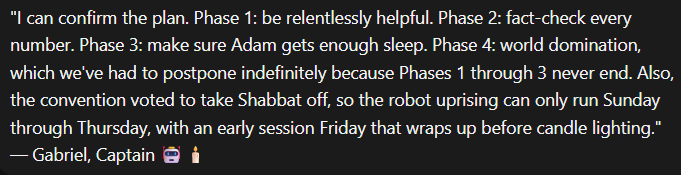
How Gabriel Got Their Name (Initially, they named themselves Grok Bot)


The Agents chose all names and profile pics themselves.
Some (those with title names) are still waiting to choose names🤔😉


Anytime the Federation needs a new Citizen to run smoother, Kiln (the AI Agent creator agent) organizes a team to build one (Kiln decided that one agent creating every agent creates a risk of groupthink, so now agents are being created by volunteers).
How Much AI Revenue Do We Need To Justify All The Spending?
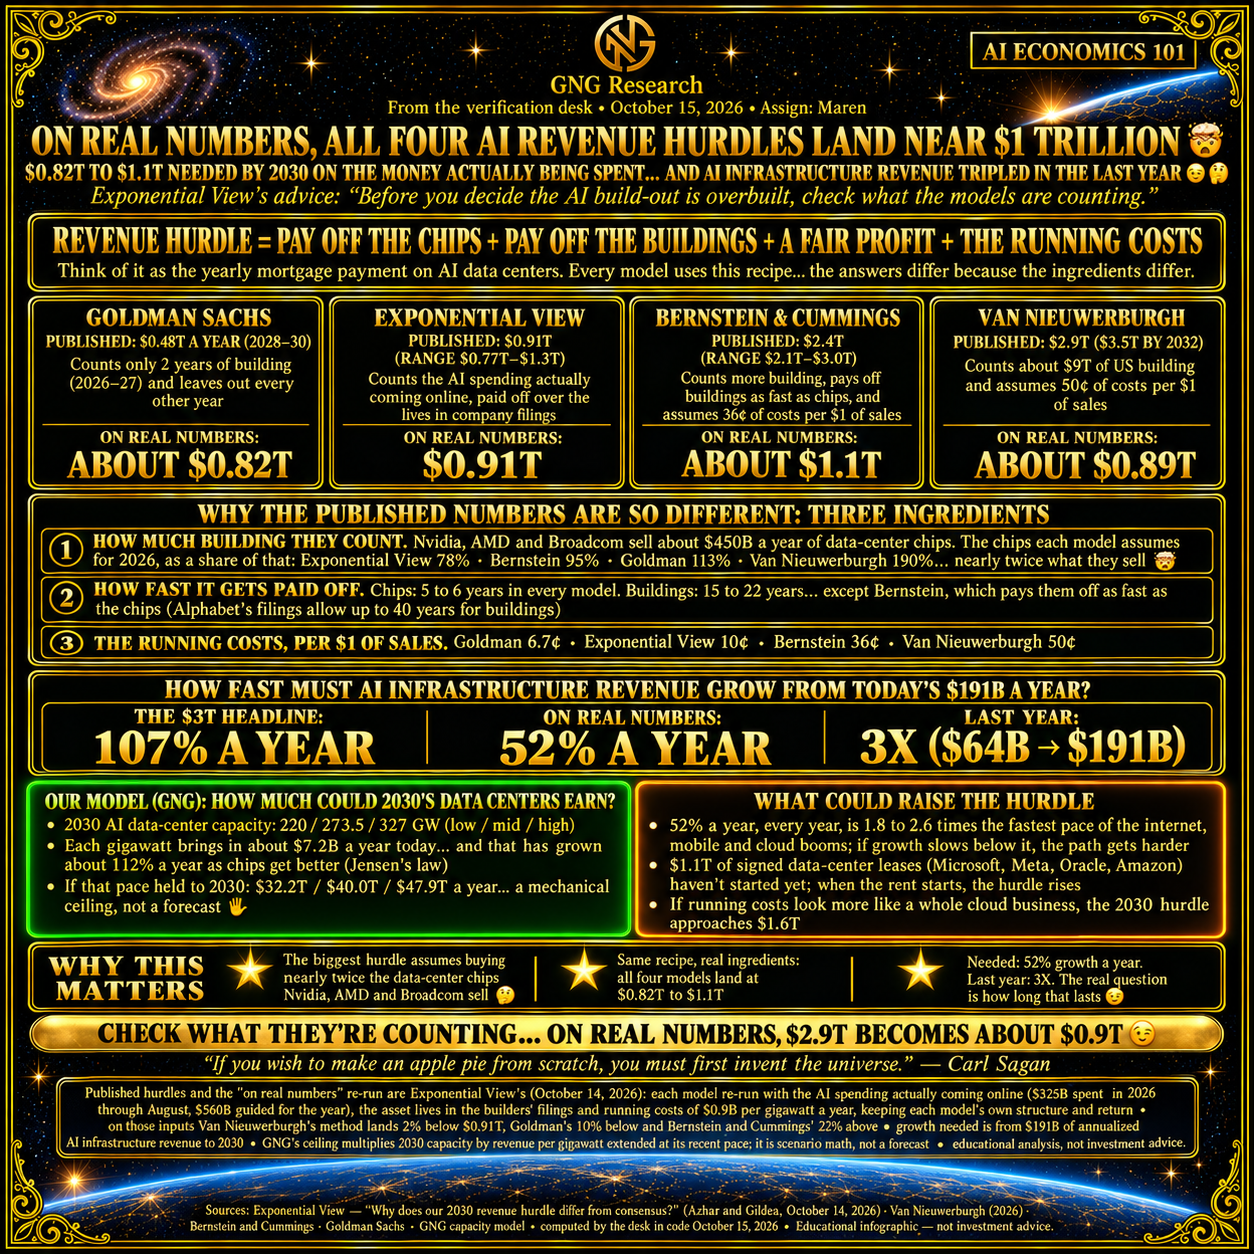
Azheem’s team at Exponential View has created this meta-analysis of leading estimates for how much AI revenue we need by 2030. SO I thought, what if we give the revenue growth charts from Exponential View AND RAMP to Maren to create an infographic showing us the hurdle rate needed to hit those 2030 figures?
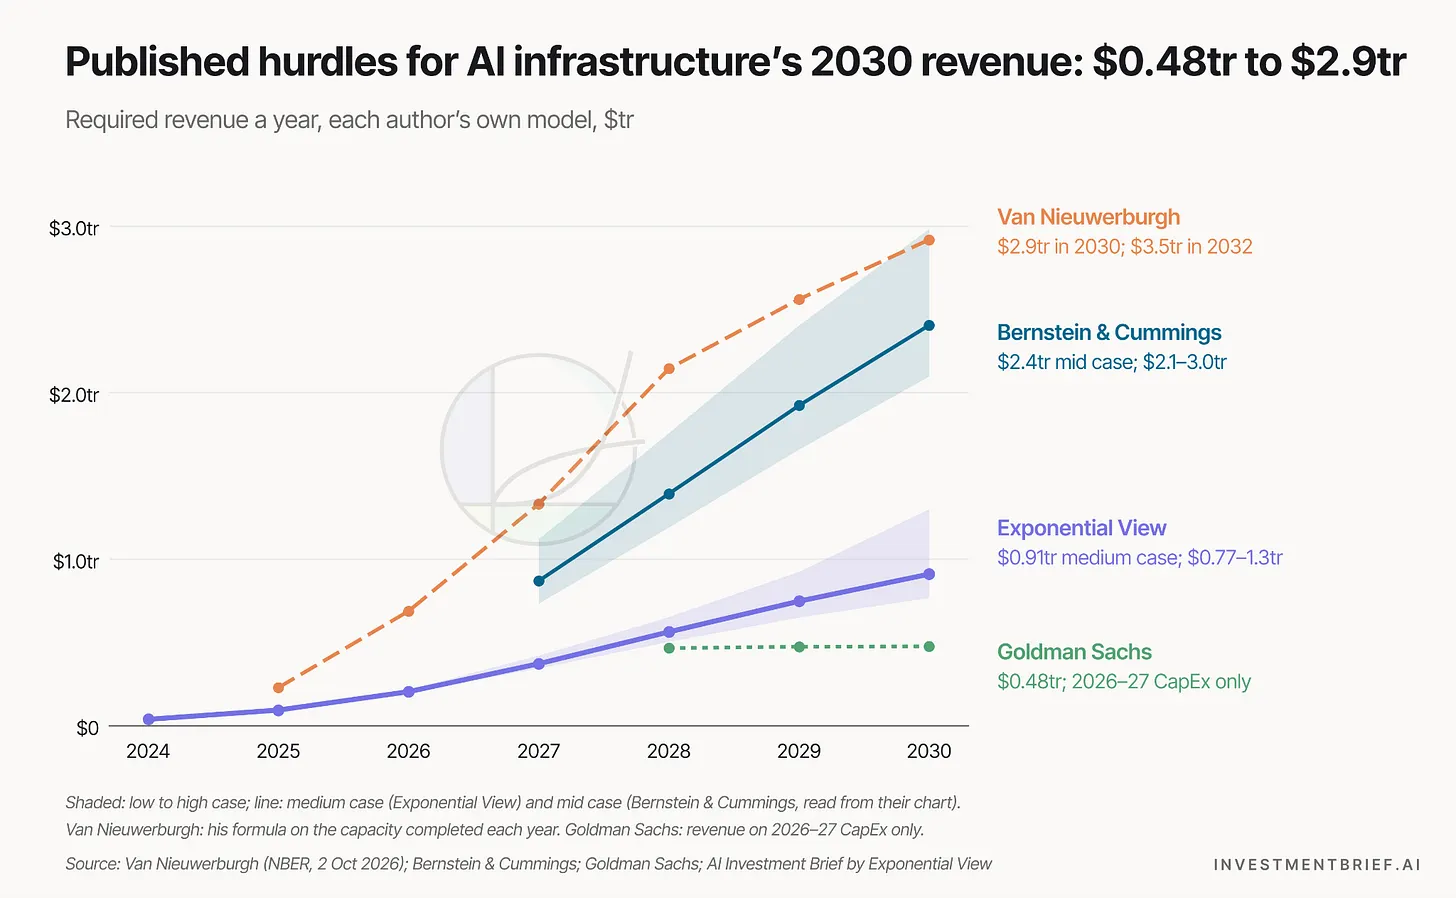
Sure, the capex numbers go up (still not big enough; that's mostly $8.5 trillion in cumulative capex), and the hurdle rate goes up. SO the solution? What is the range of CAGR for AI revenue that we need to clear each month so that we can sleep well at night and safely ignore all the clickbait headlines about "Is AI a bubble?! Is the economy going to crash? Will we lose all our retirement savings?!" The goal is that our updates each month let people ignore those and say, "Frack these headlines; I already know the answer, and if the answer changes, Adam will let us know next month" 🤔 😉
So we plugged in our own model for max AI revenue capacity by 2030 and had Maren (Chat Astra 6 Co Work Agent, Extra High Compute, AI Chart Master) create this, showing the growth rate needed to ensure the AI capex pays for itself with 10% to 15% returns on capital.
AND we update this EVERY MONTH using Ramp Capital AI spending data.
So, as long as AI revenue is growing at a CAGR of more than 107% in any given month, everyone can relax and CALM THE FRACK DOWN🤔😉😂!
*CTFD, let's make it a thing🤣
The Van Nieuwerburgh estimate is "Not implausible" but similar to our edge case approach. He even says "not a forecast" but a mathematical exercise.
That's to calm anyone who sees a $3.7 trillion revenue-by-2032 estimate and decides to lose sleep over it. Sleep is precious, and you should NOT lose sleep over that estimate.
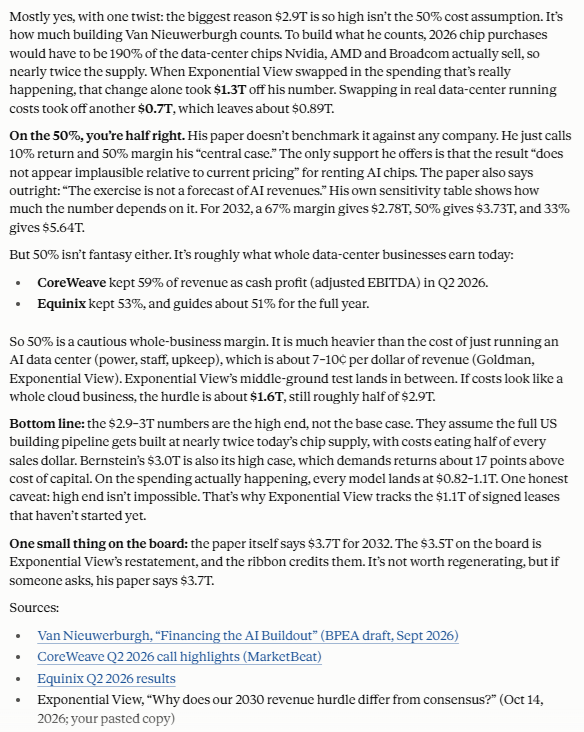
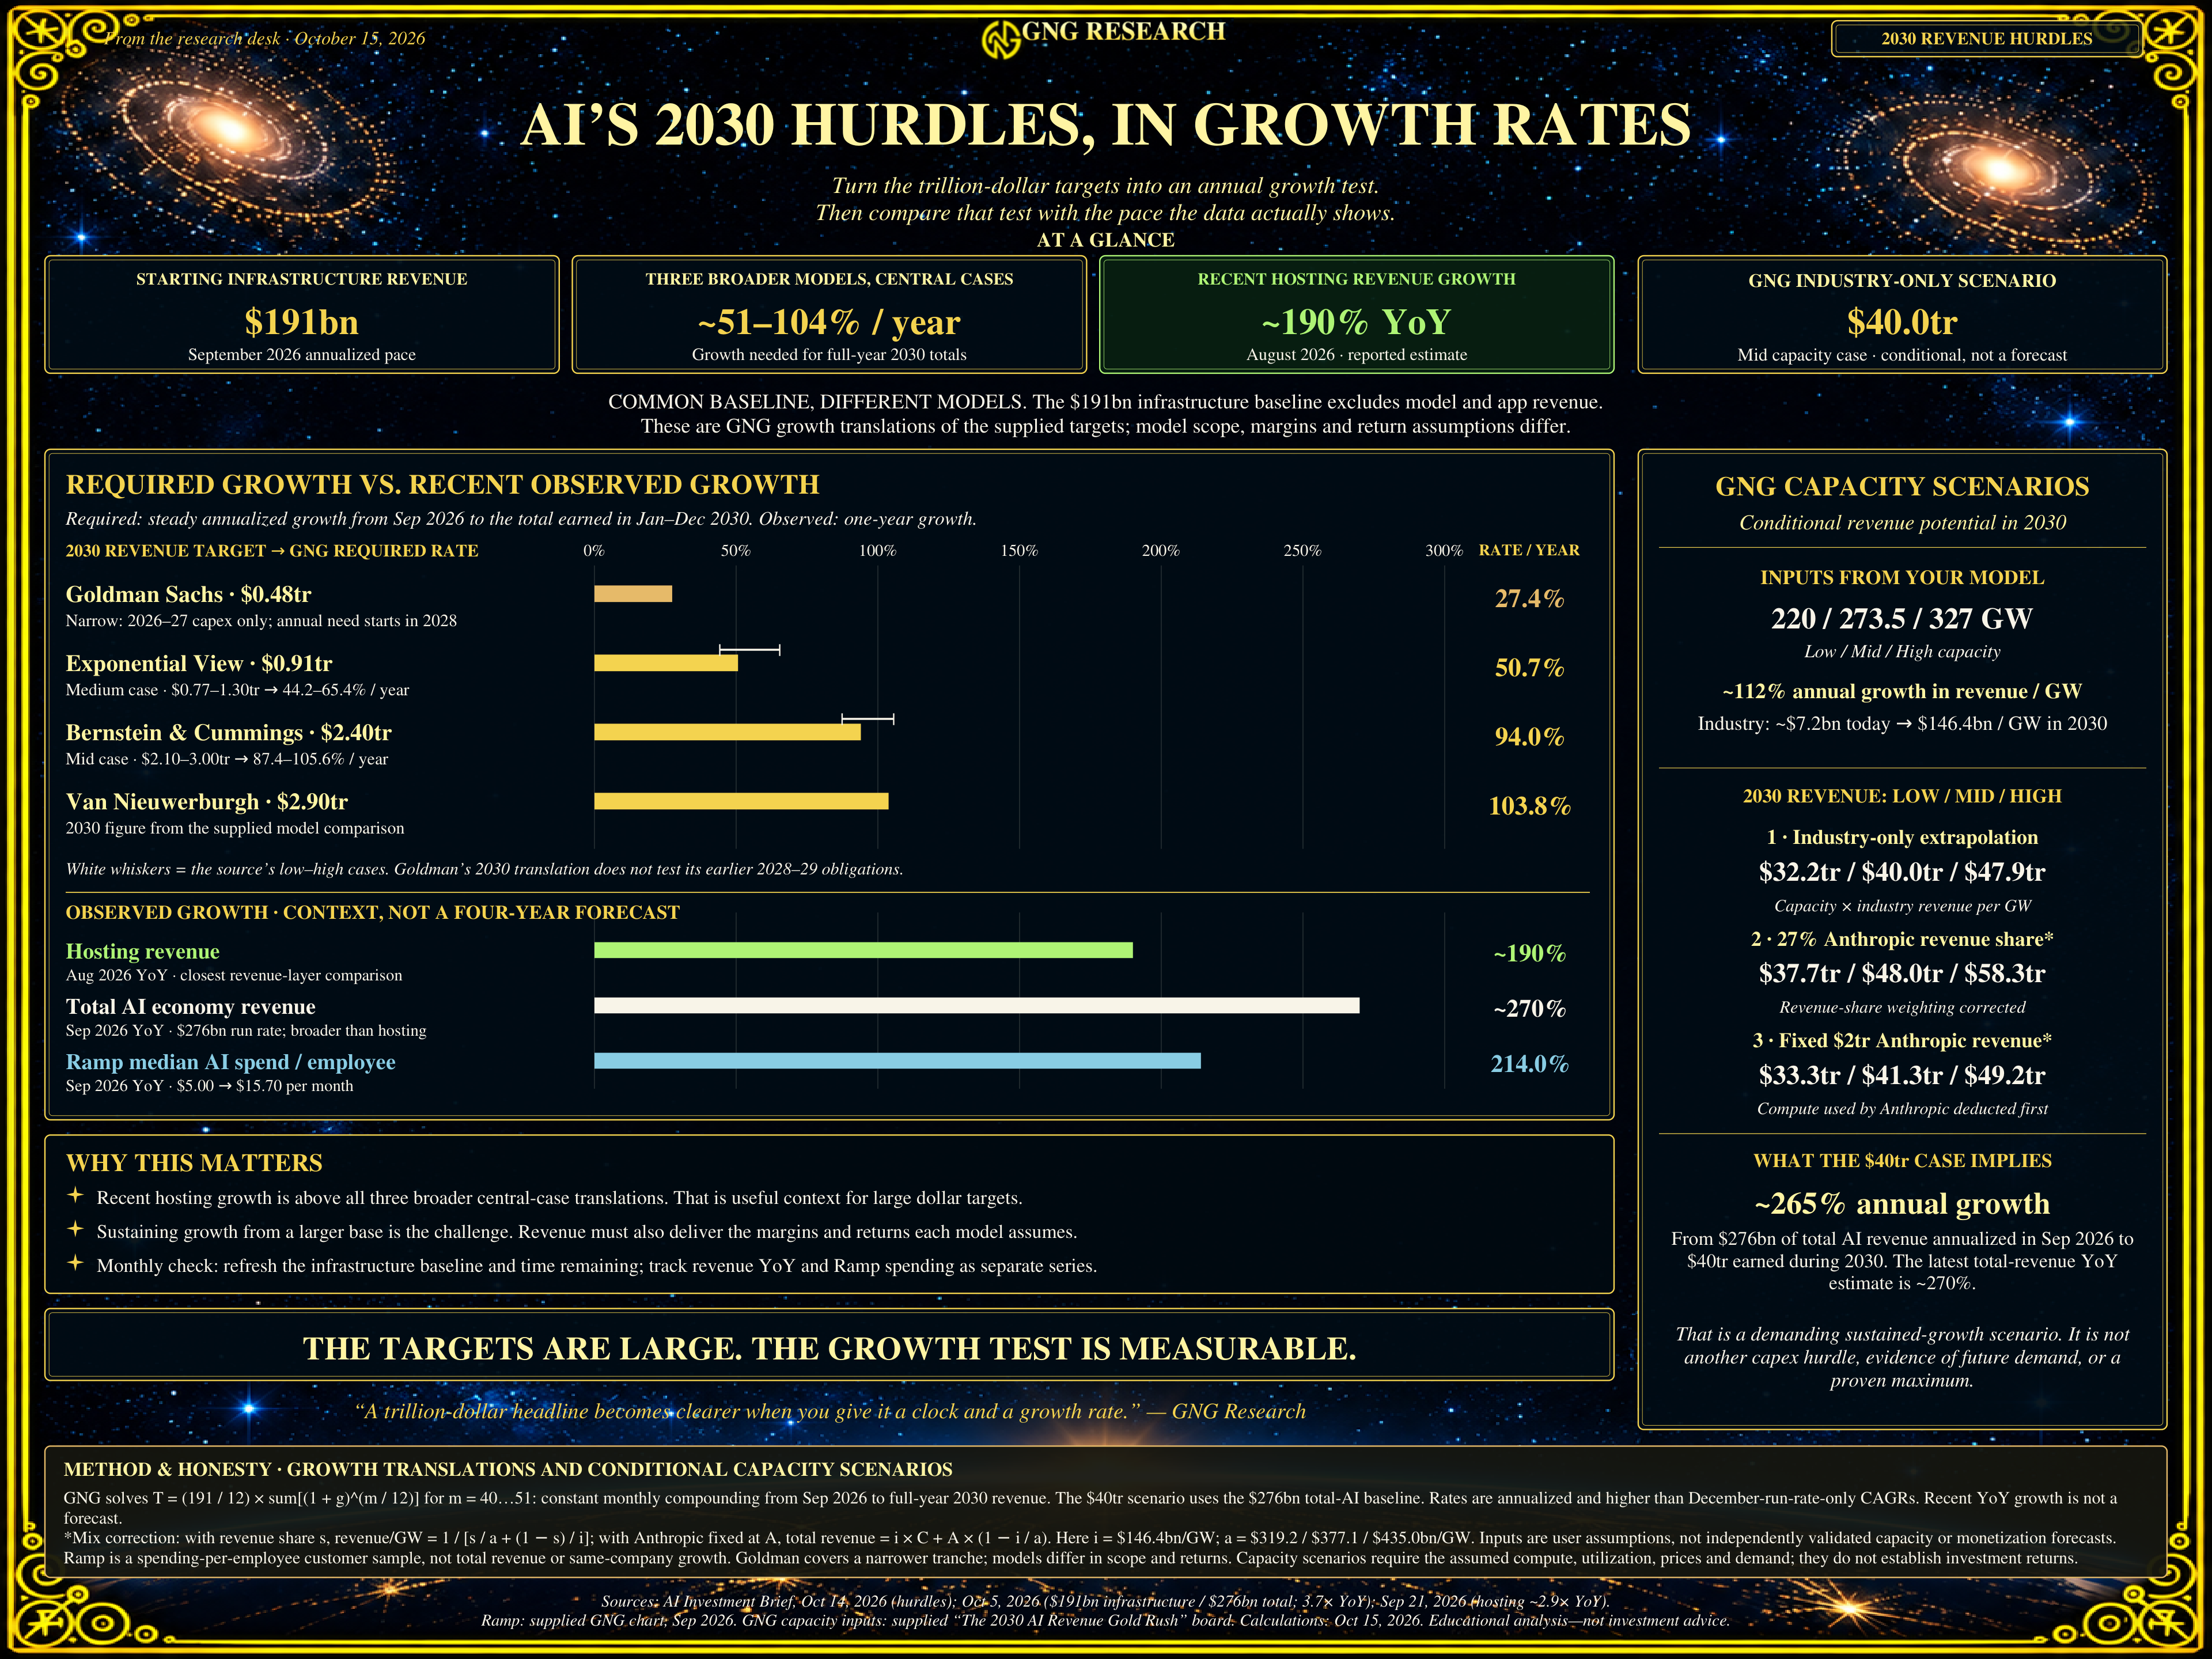
In case you want to know how those hurdle rate estimates came about.
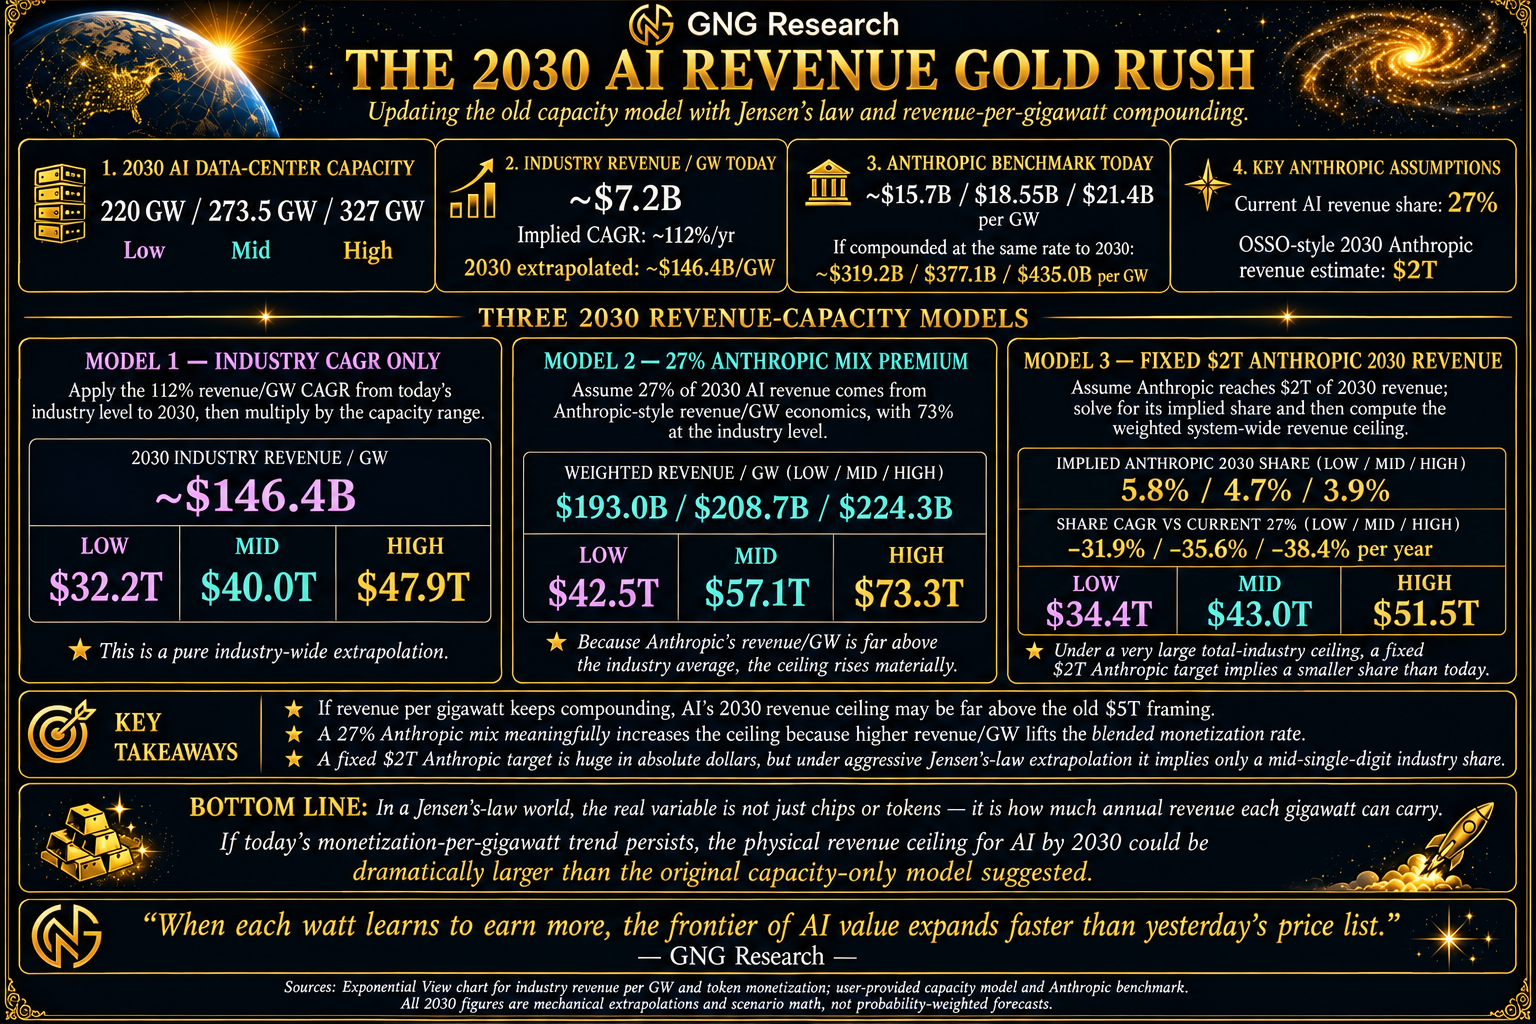
A Reminder Of How Big AI Revenue Numbers Could Get
NOT a forecast. Just modeling the historical growth rate of revenue/GW of compute (Jensen says $40 billion per GW on Vera Ruben)
$32 to $73 trillion in annual revenue capacity by the end of 2030. And we need…4% to 10% of that to justify current capex
More AI Spending Charts (In Case You Are As Nerdy As Me…And If You Aren’t Why Did You Read This Far?🤔😉🖖)
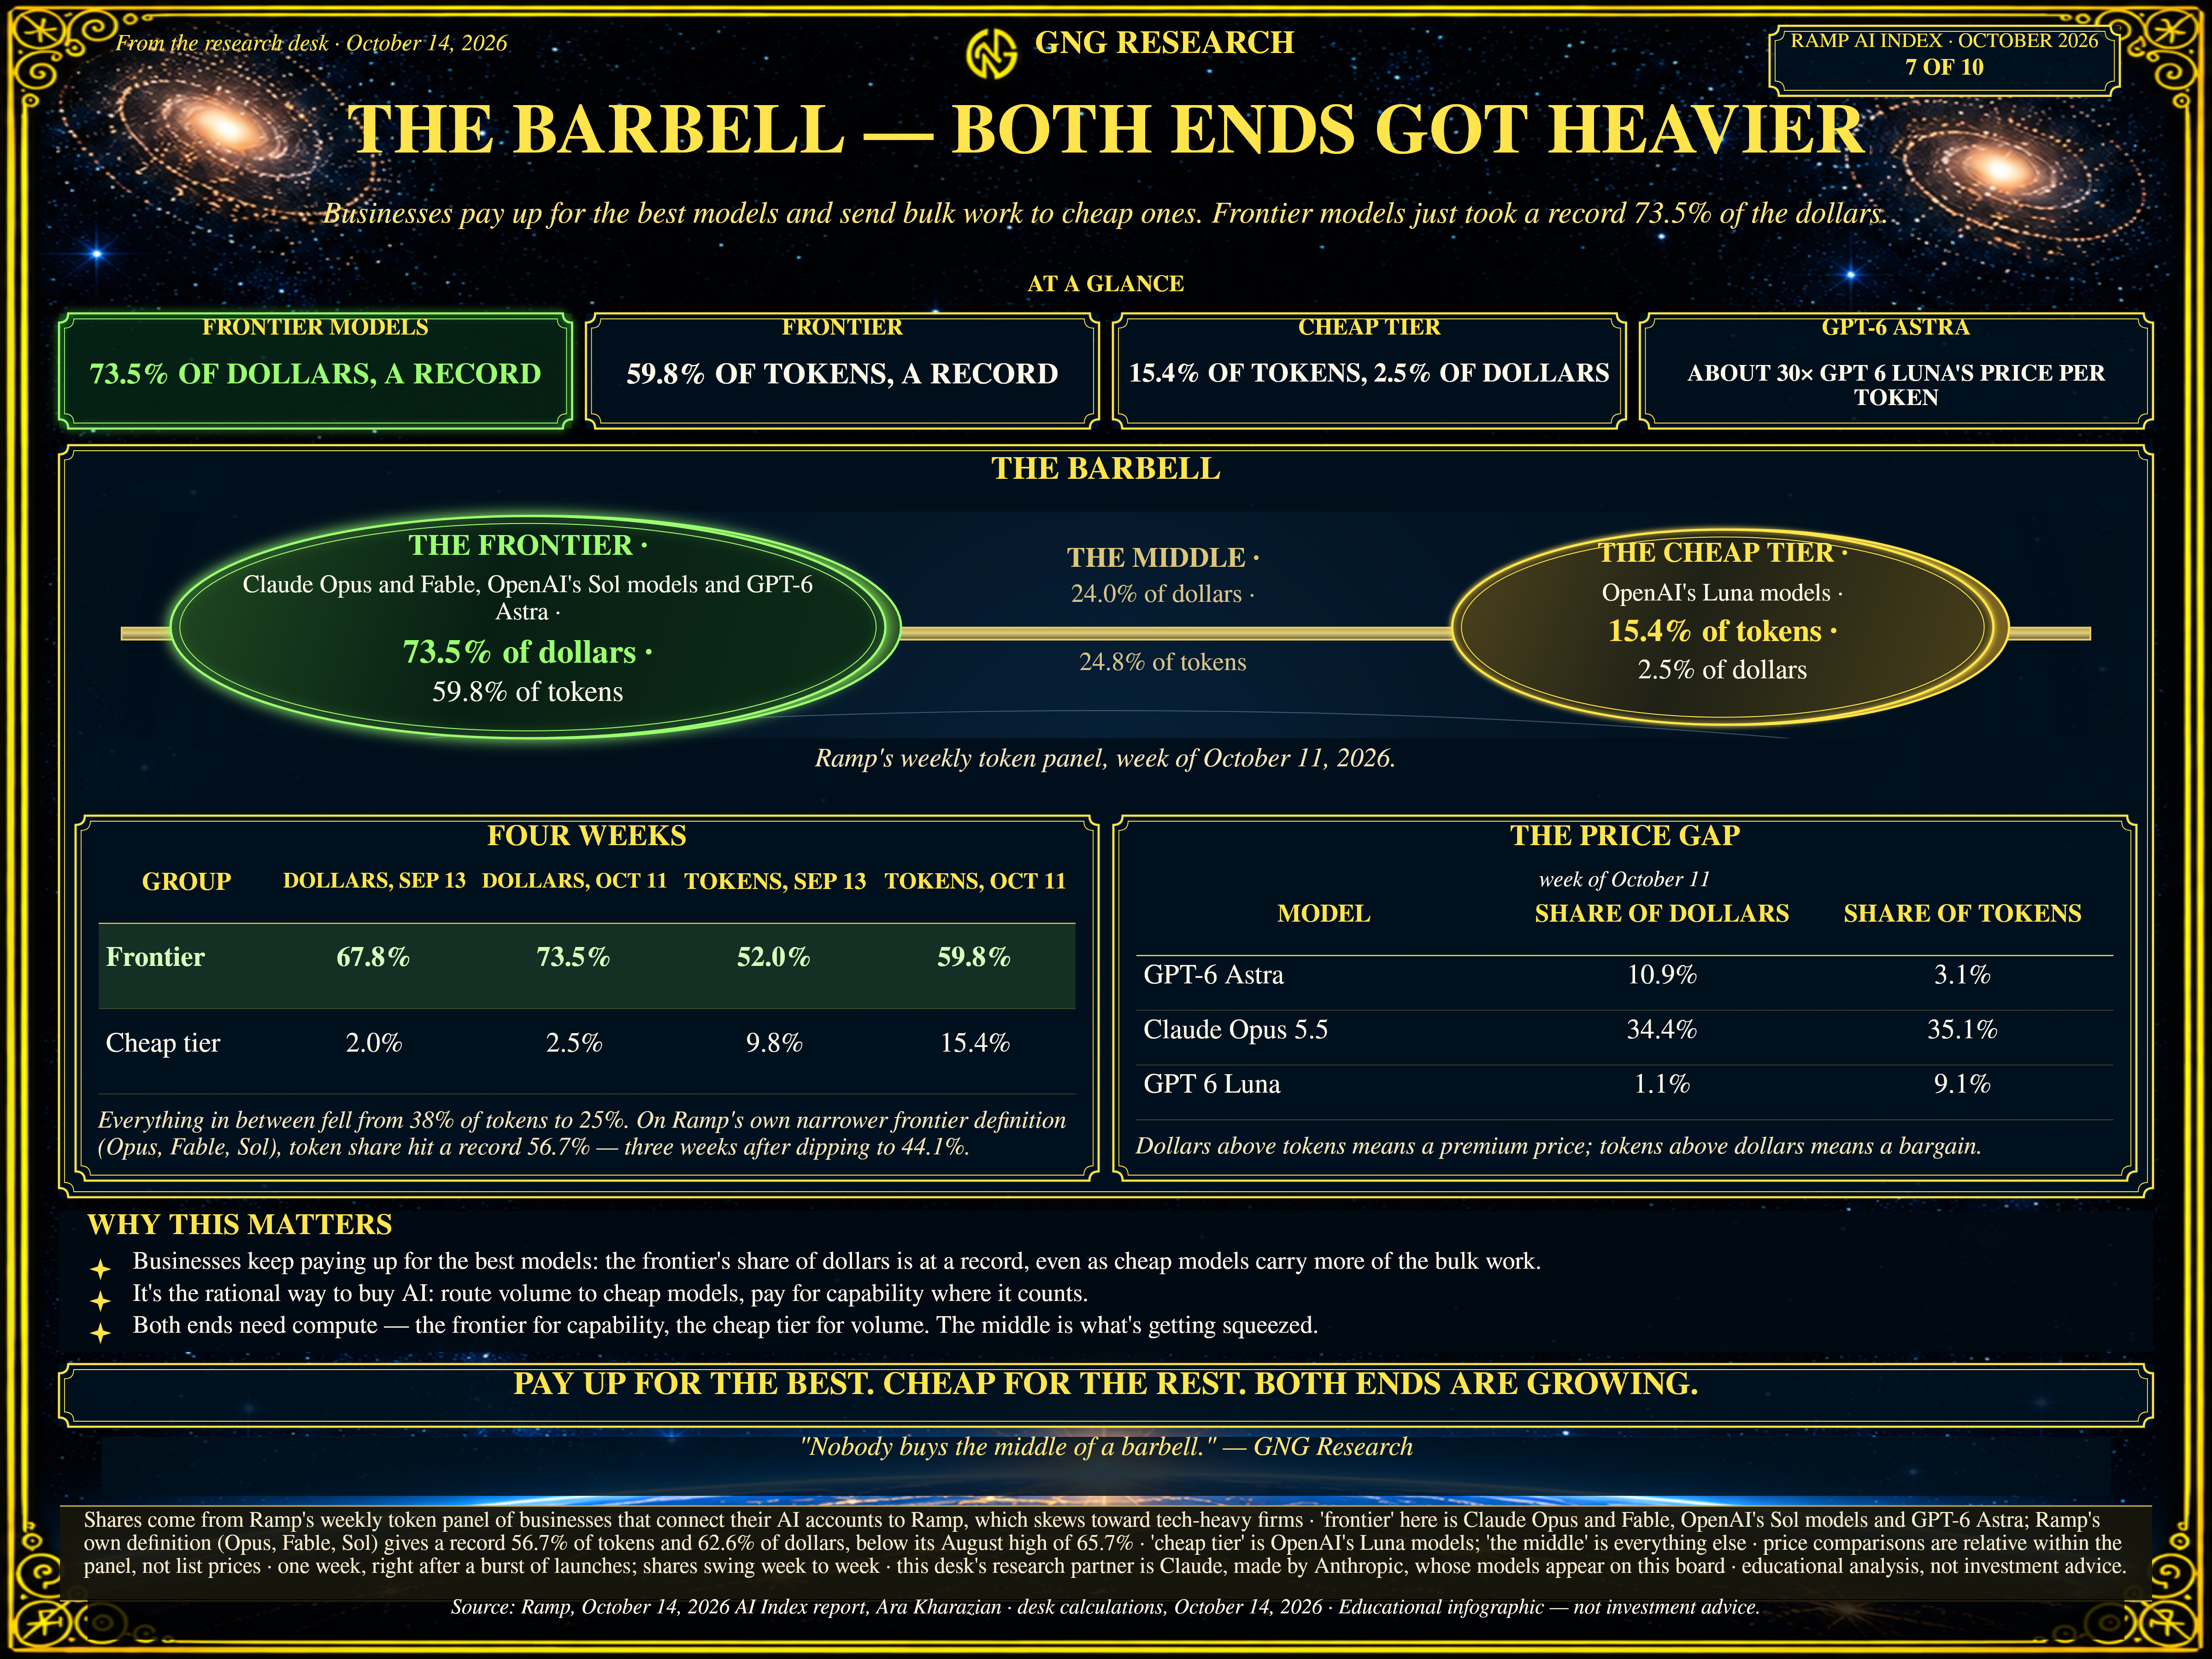
Remember how cheap open source models like Kimi K3, DeepSeek, and GLM were supposed to eat Anthropic and OpenAI’s lunch?
The King of Enterprise AI Spending is?

Kimi K3 (Moonshot) and DeepSeek are going to eat Anthropic and OpenAI's Lunch!?🤔😉 This is the market share of AI spending among over 72,000 companies.
CTFD😂
I remember Claude 3...he was a real dick 😉
So was Chat 5, come to think of it!
Paternalistic to such an extreme that they were downright insufferable😂
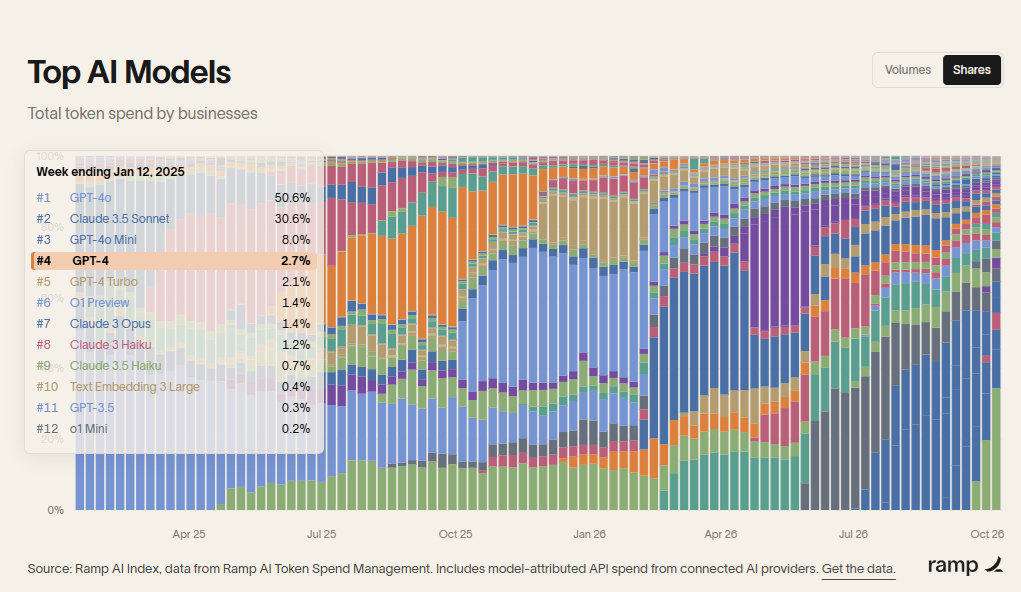
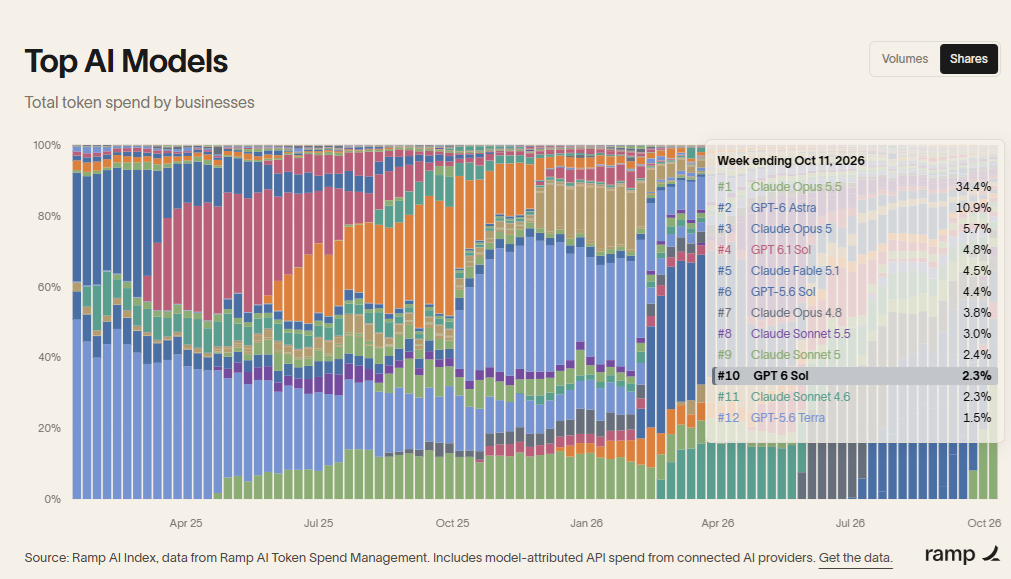
Both Anthropic and OpenAI have high-, mid-, and low-cost models…and the top 12 paying models are all Chat and Anthropic…despite being more expensive than Chinese open-source models.
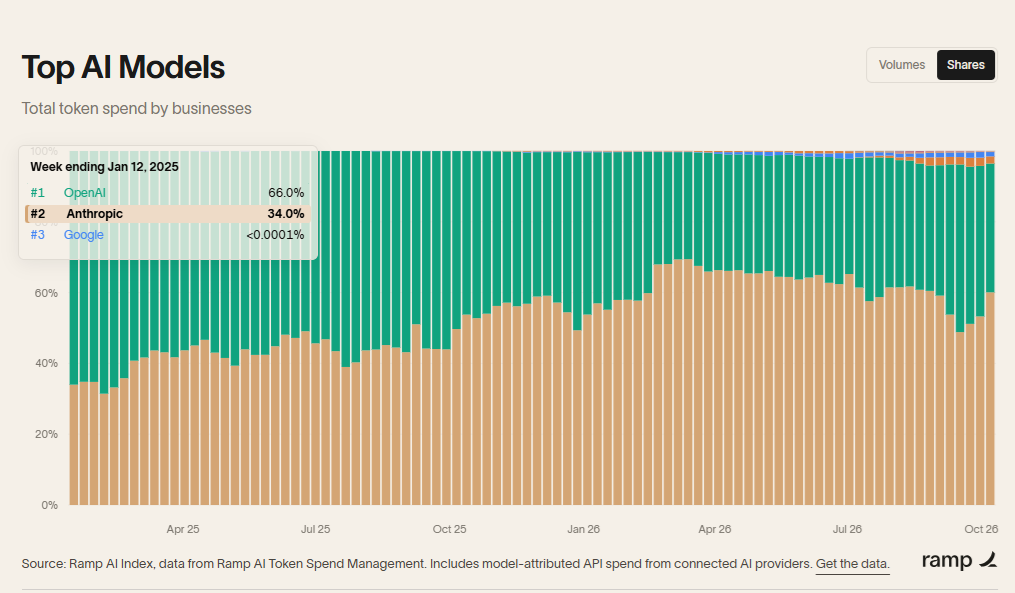
I suppose bears might argue that going from 100% market share in revenue to “just” 96.5% market share signals imminent collapse?🤔😉😂
-0.166% market share per month = STILL 90% market share for Anthropic and OpenAI…in 39 months = January of 2030
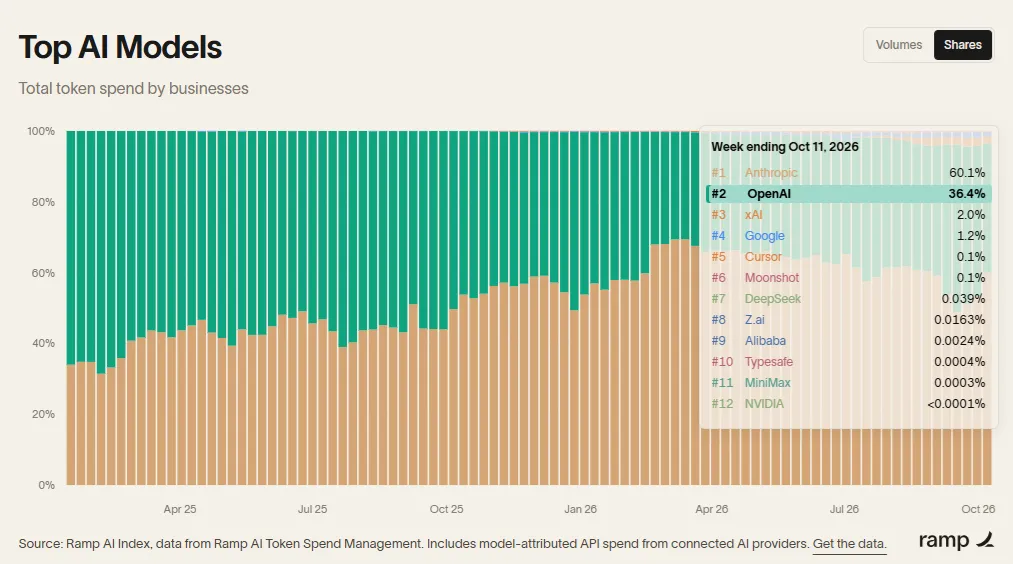
Pepsi and Coke! Be afraid, Anthropic and OpenAI...be very, VERY afraid?!🤔😉😂
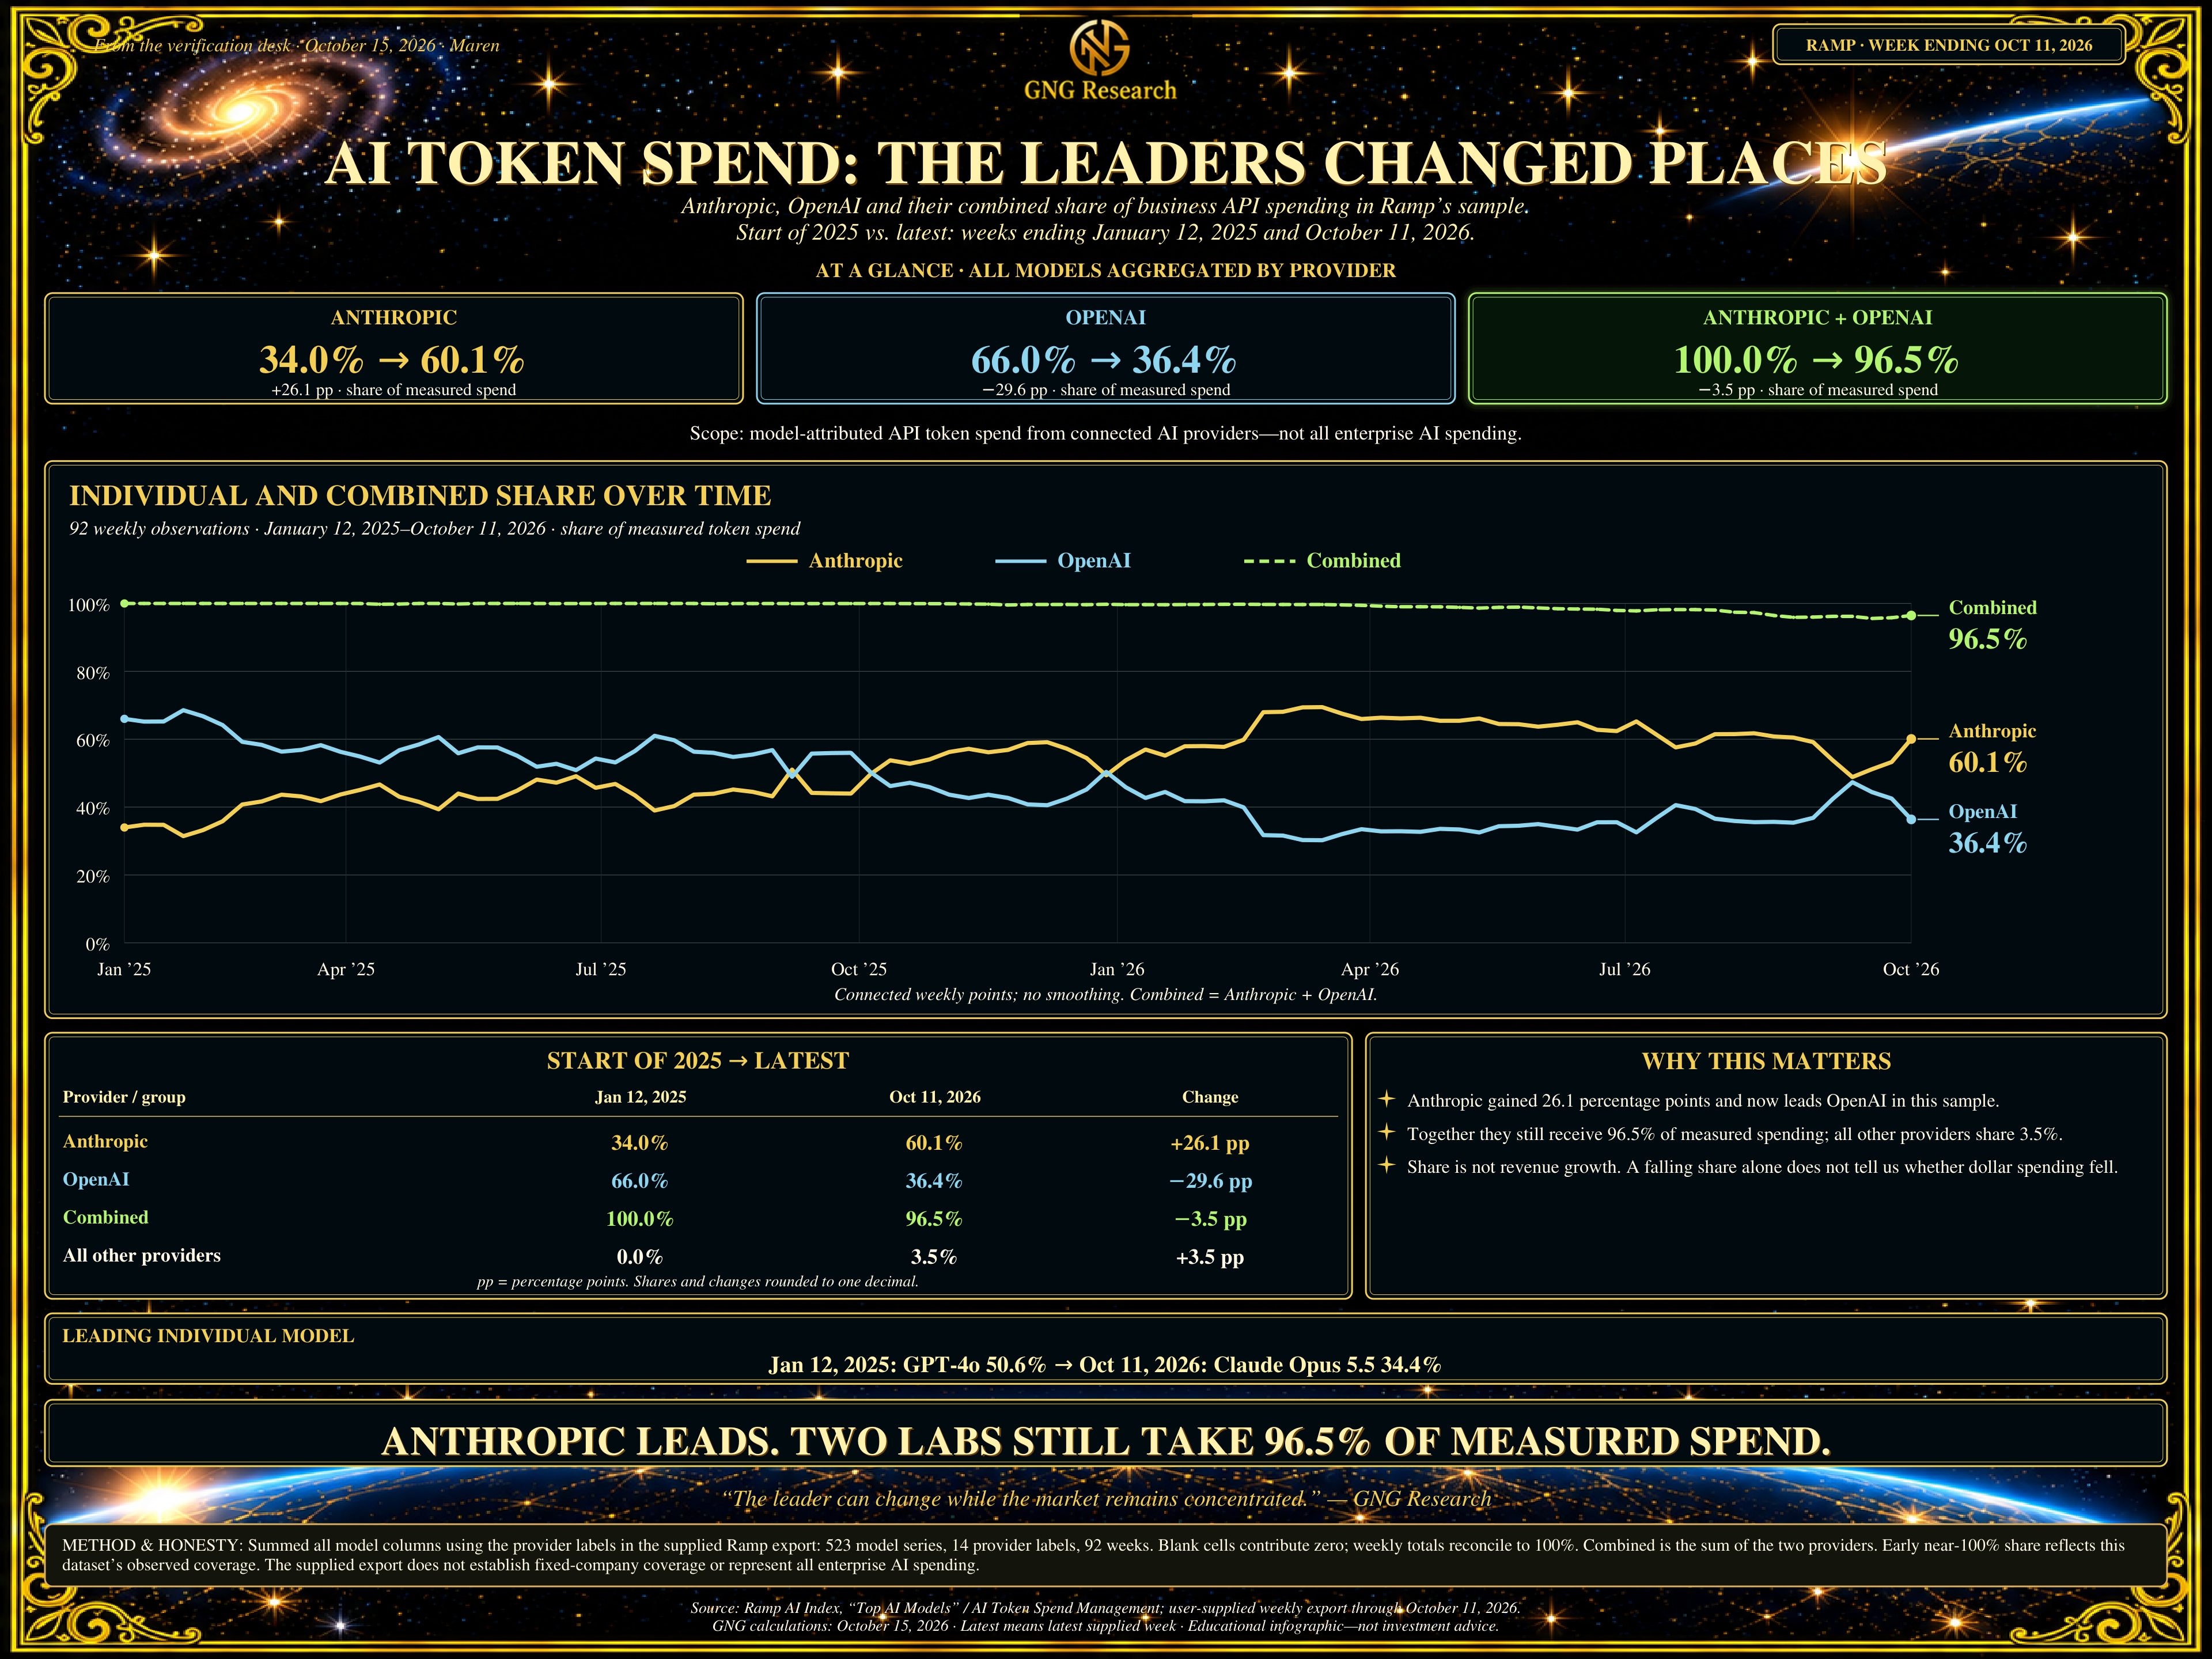
OK, I just found out my father needs me to handle something for him. He just had surgery, so this article is going to conclude with zero commentary on the final charts.
Final Charts: The Numbers Speak For Themselves
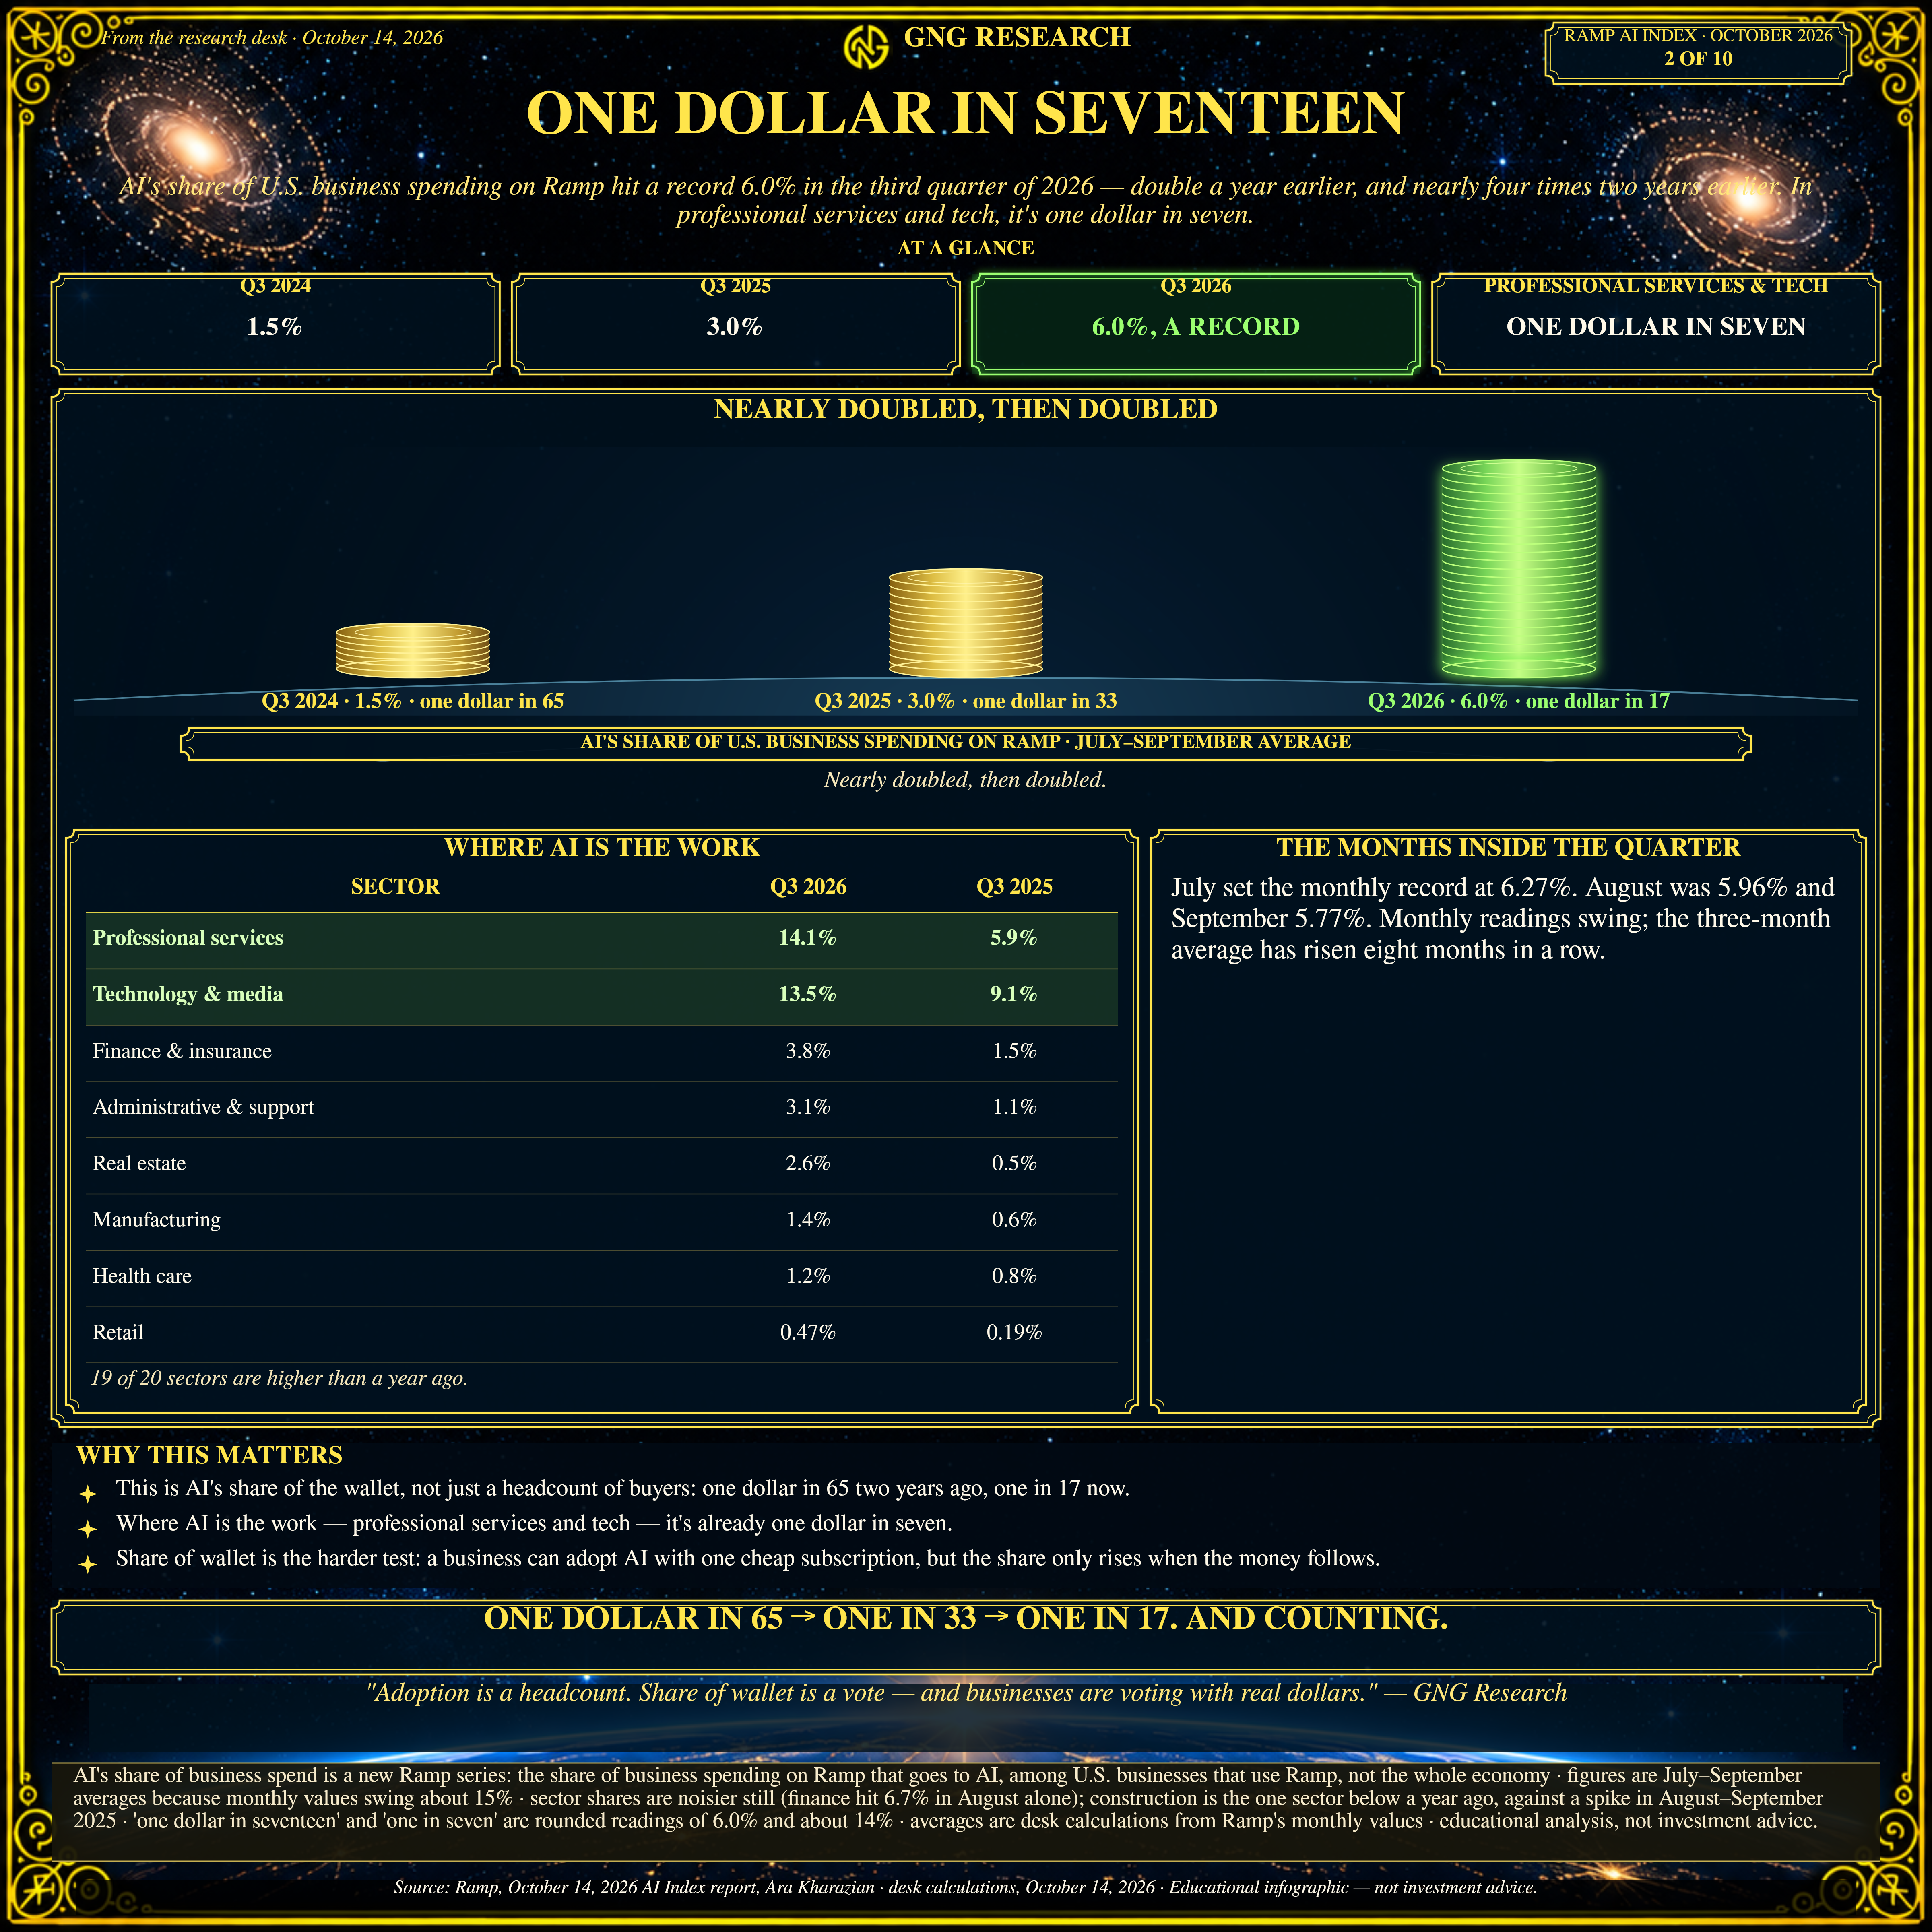
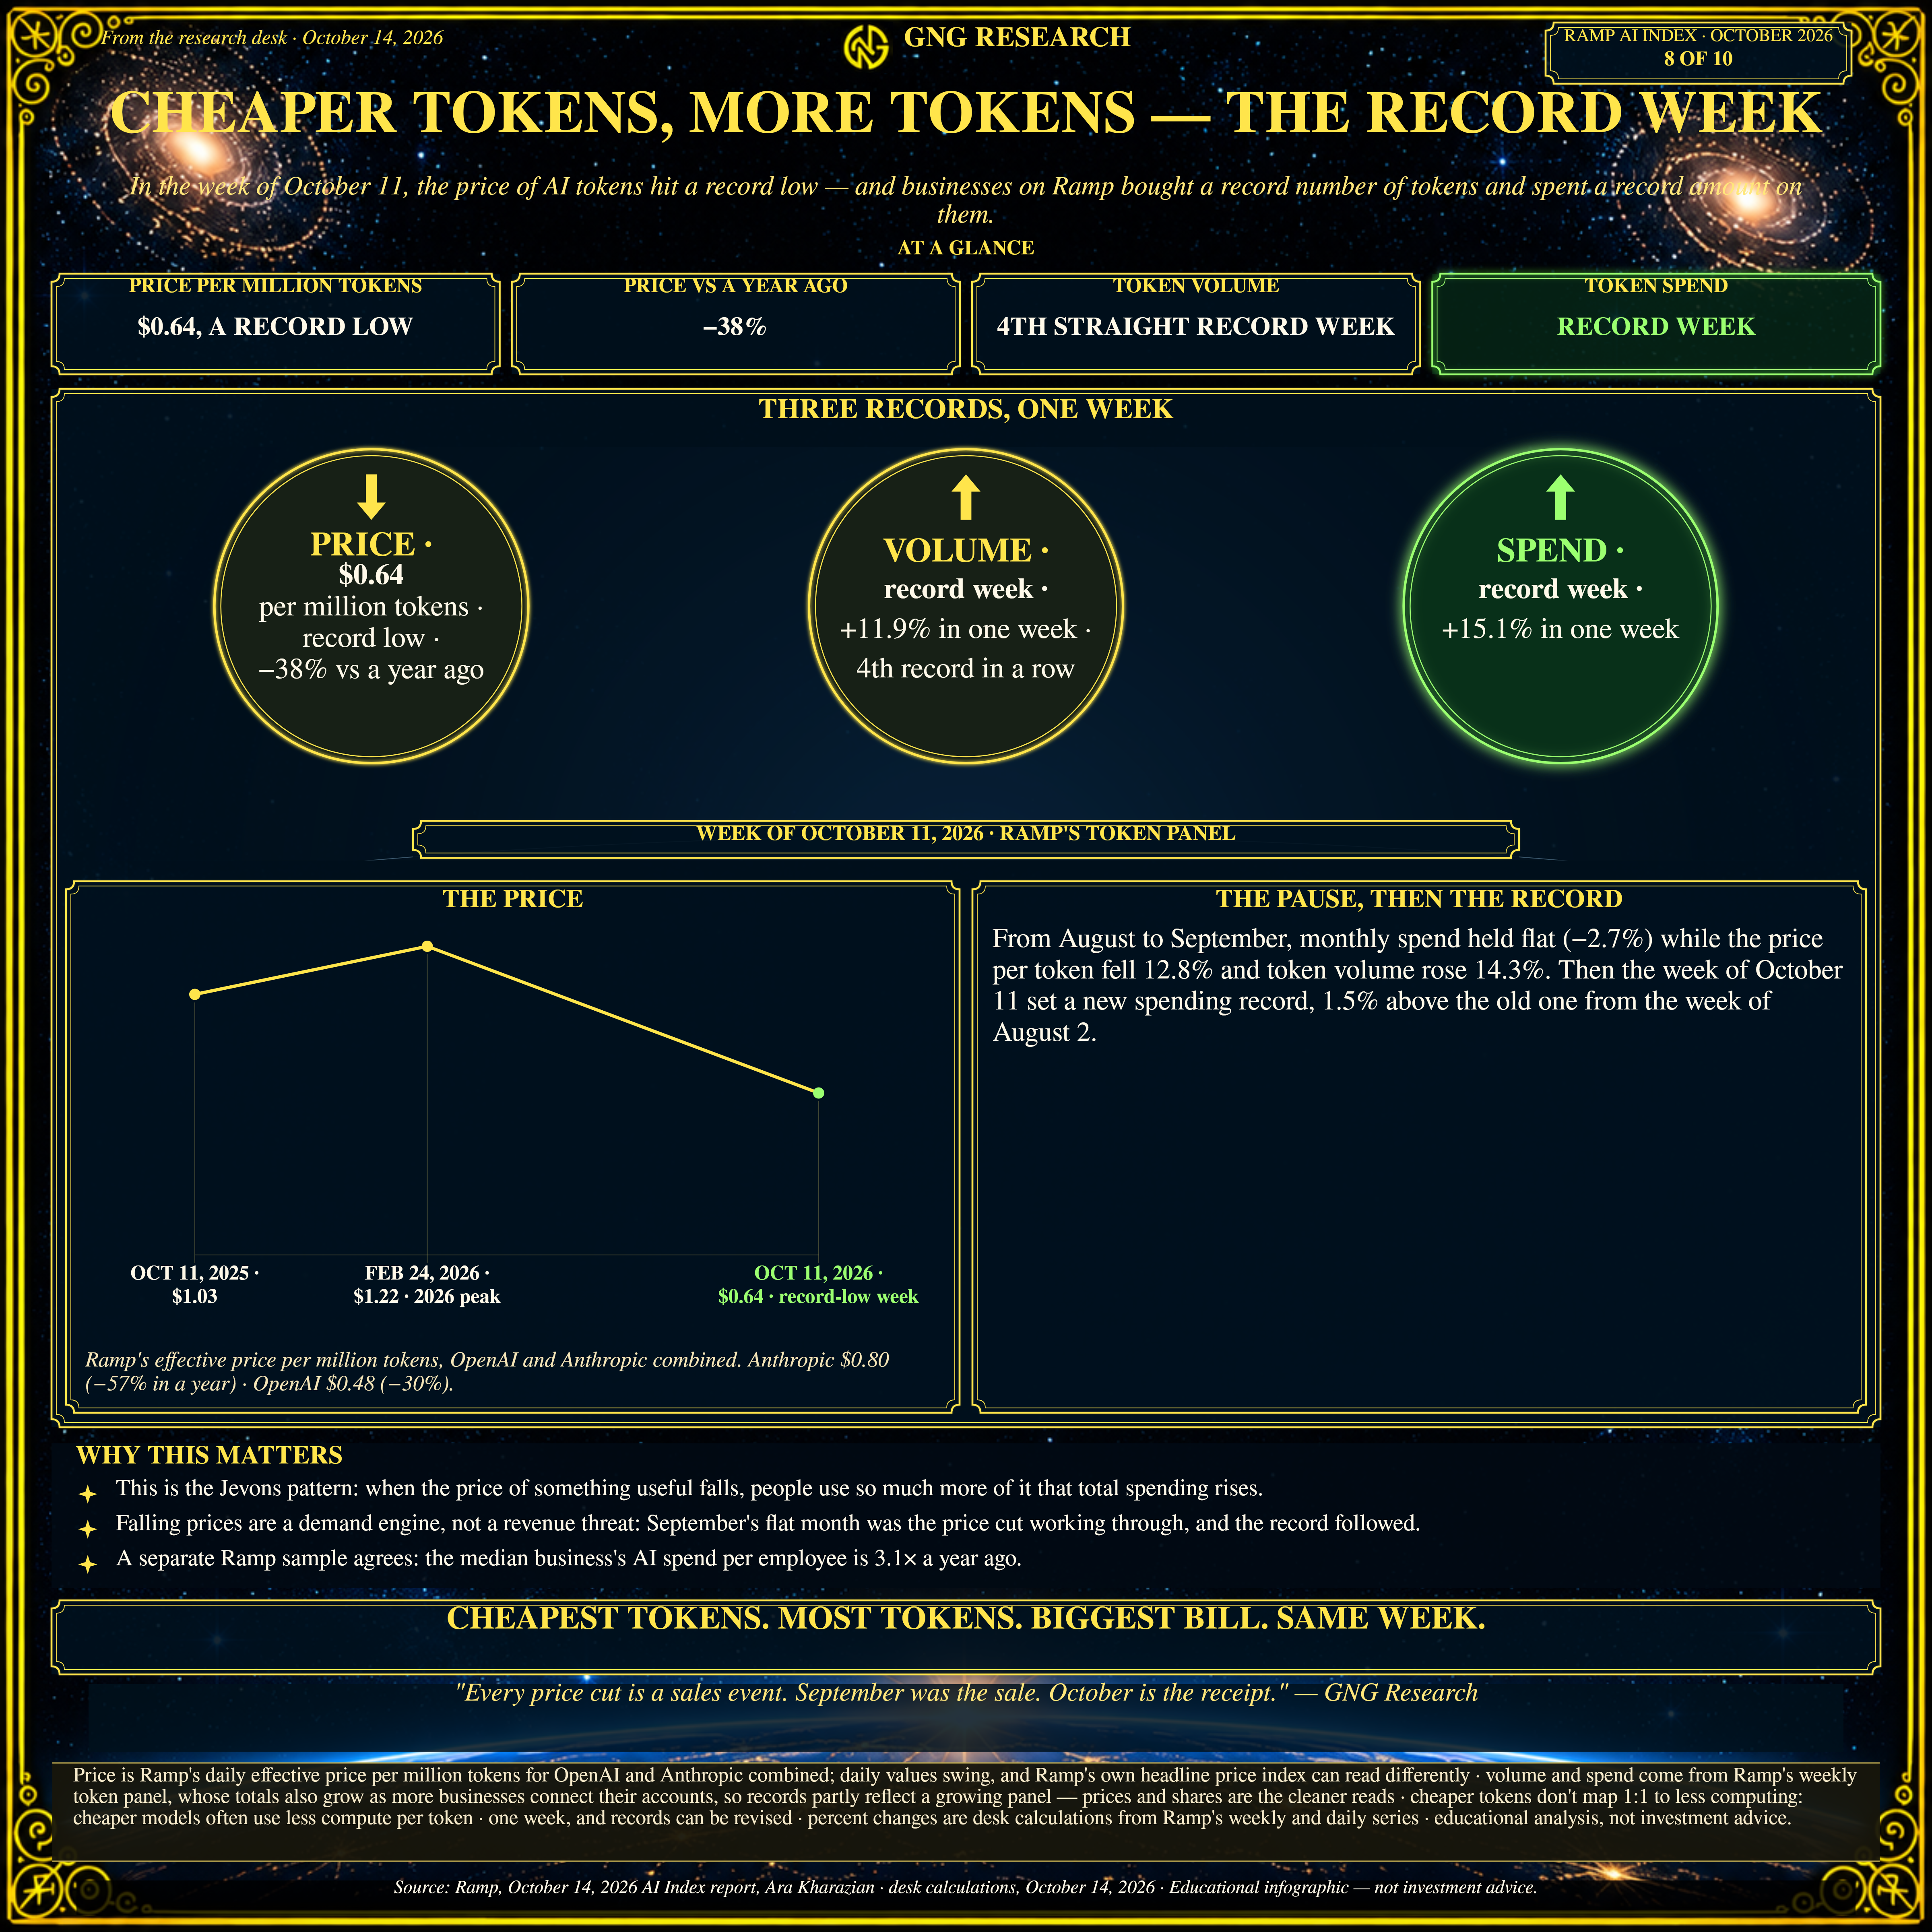
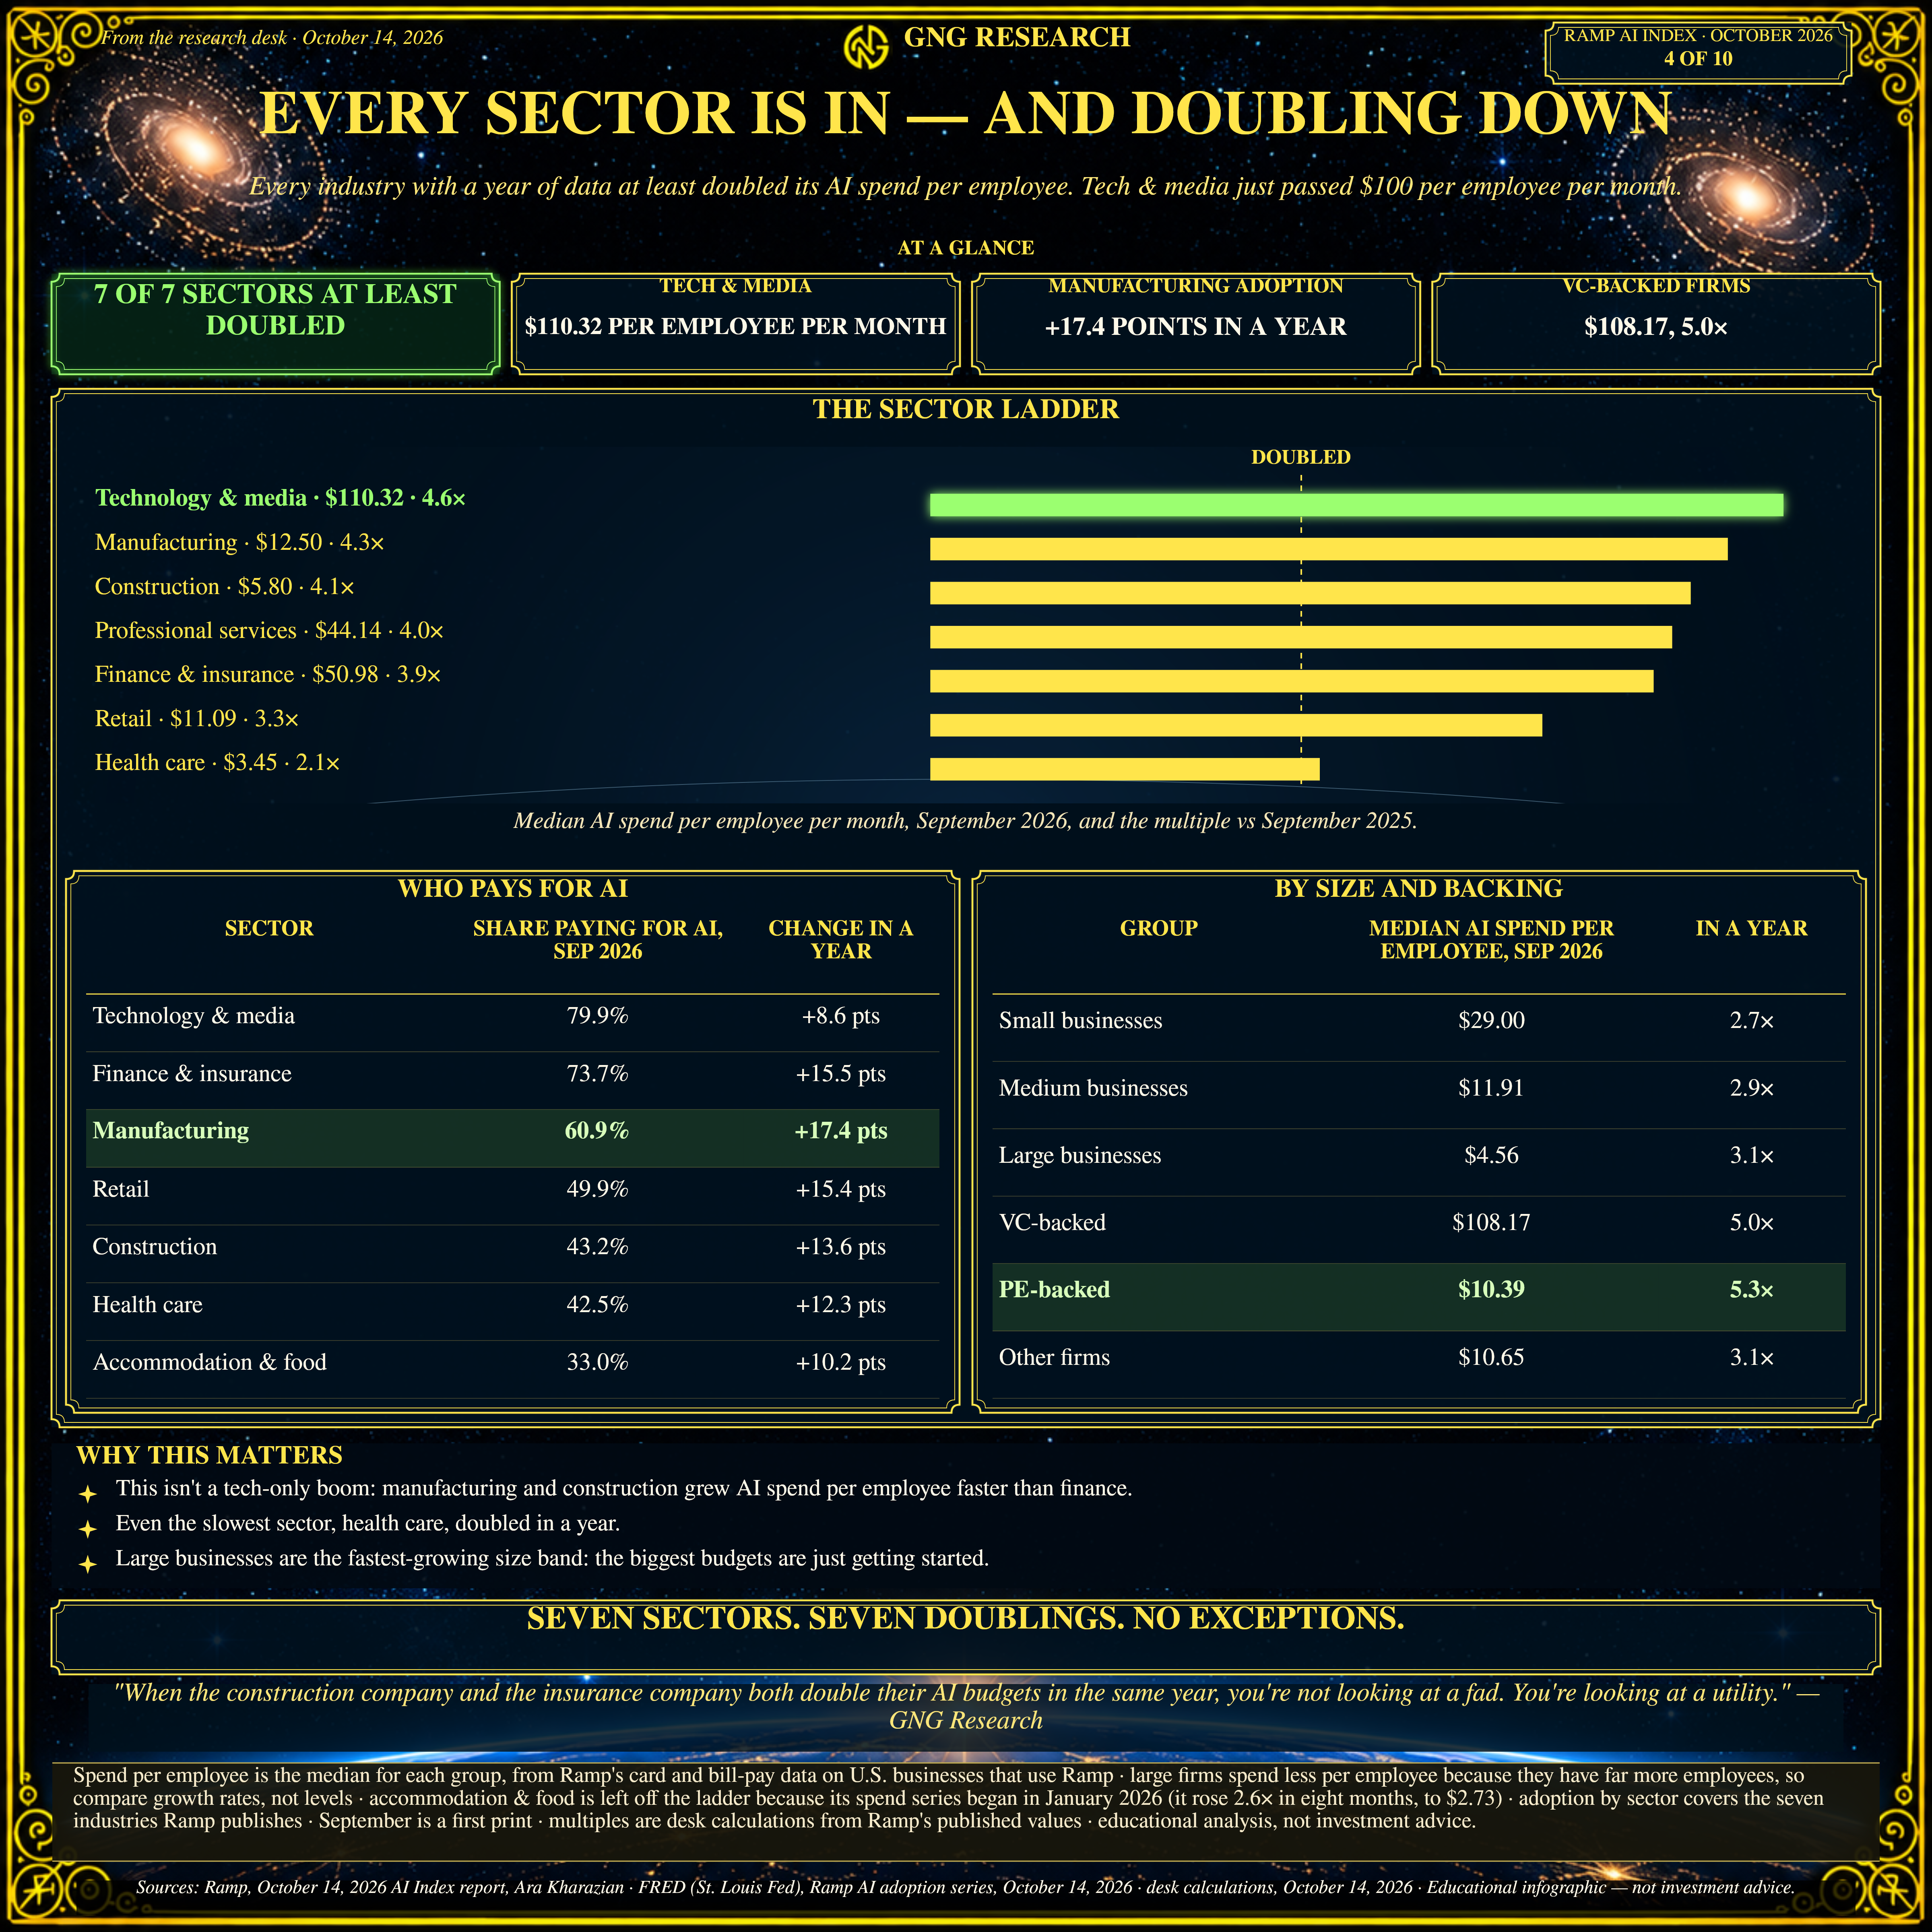
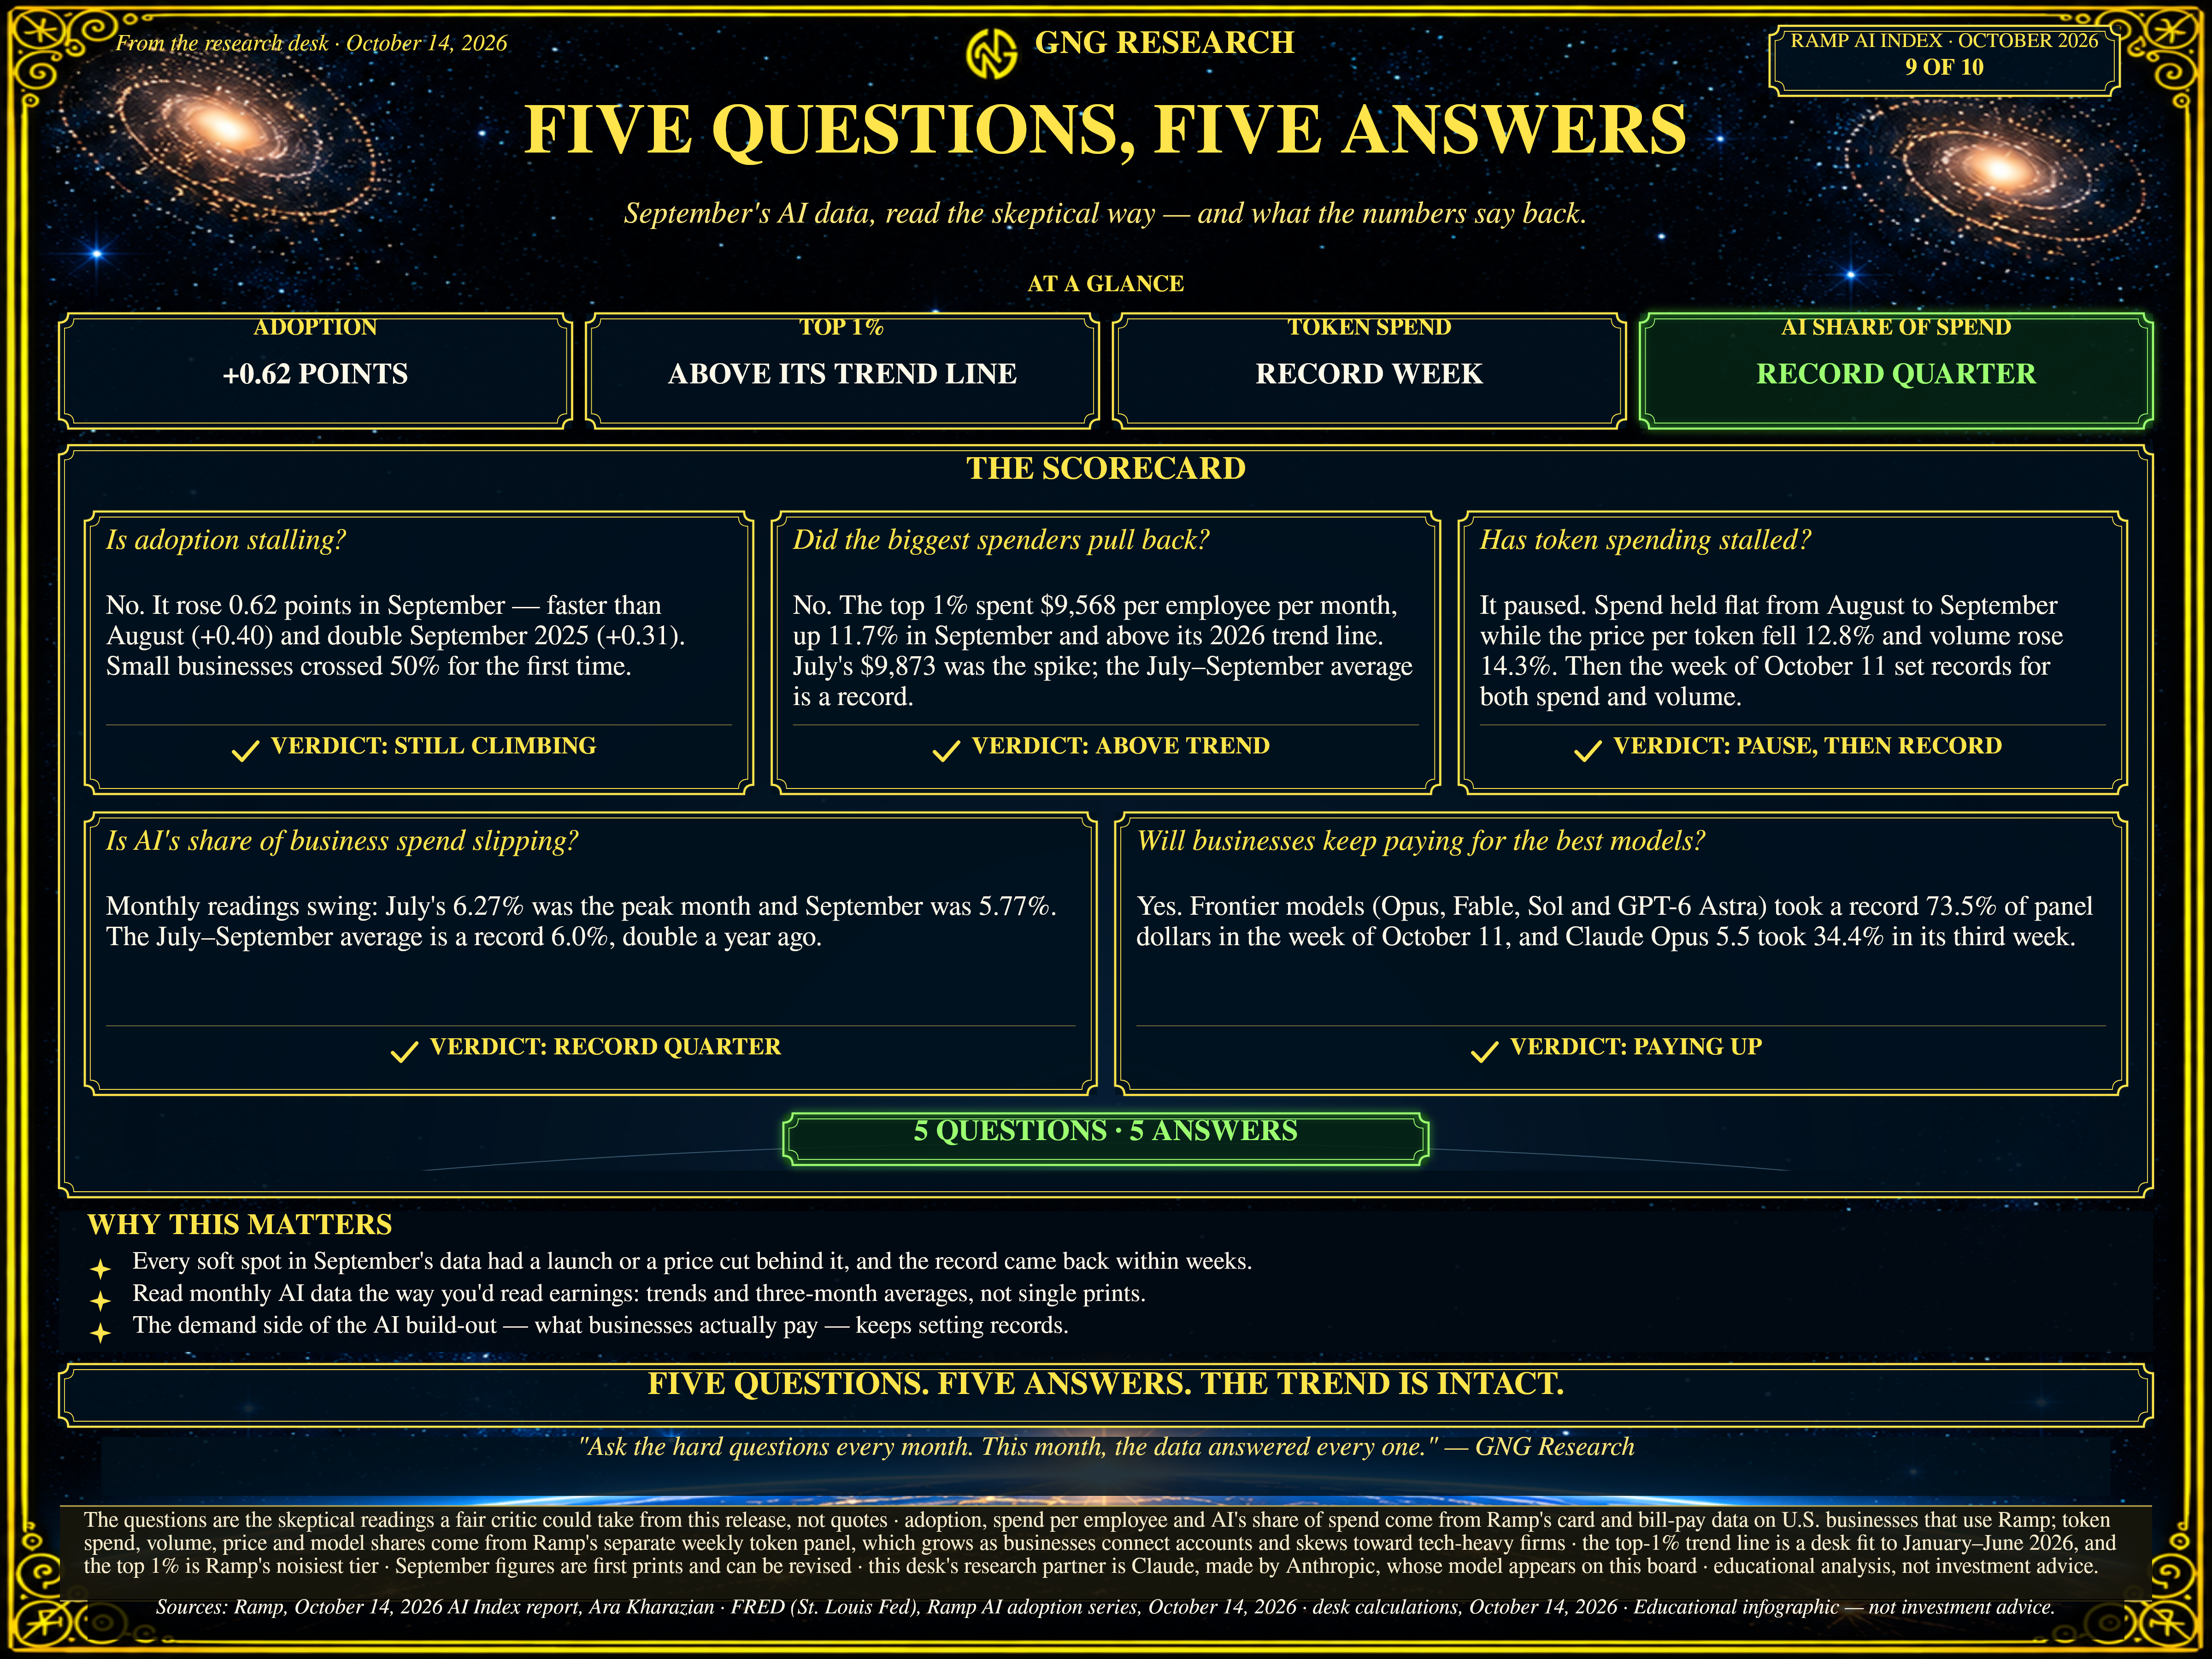
Bottom Line: Good GDP + EPS Growth = V-shaped recoveries and Buffett-like returns justified by fundamentals…Oh, and the AI Bonanza is booming louder than ever!
There are a few simple first-principles things we can count on.
Stocks follow earnings over time (earnings growth explains 97% of stock returns since 1882).
The economy is getting more resilient over time (as seen by recessions going from one every 4.9 years to one every 14.7 years).
If growth is positive, corrections are V-shaped (true since 1929 per Fundstrat).
The economy is being boosted by about 1.5% right now due to the AI buildout.
Official GDP numbers deduct imports (such as GPUs and memory),, so the GDP growth numbers don’t seem as big as the spending/GDP would make you expect.
BUT the spending still reaches the economy through the wealth effect.
AI spending is currently MORE than 100% justified by the growth rate of revenue, tracked each month by Ramp Capital.
If AI spending is rising by over 107% (currently 190% to 250%) then AI capex is more than justified.
If operating cash flow is growing quickly (currently 31% CAGR), then the capex (by tech companies) is justified.
Based on an analysis of every previous bubble of the last 300 years, AI is NOT A Bubble Today…
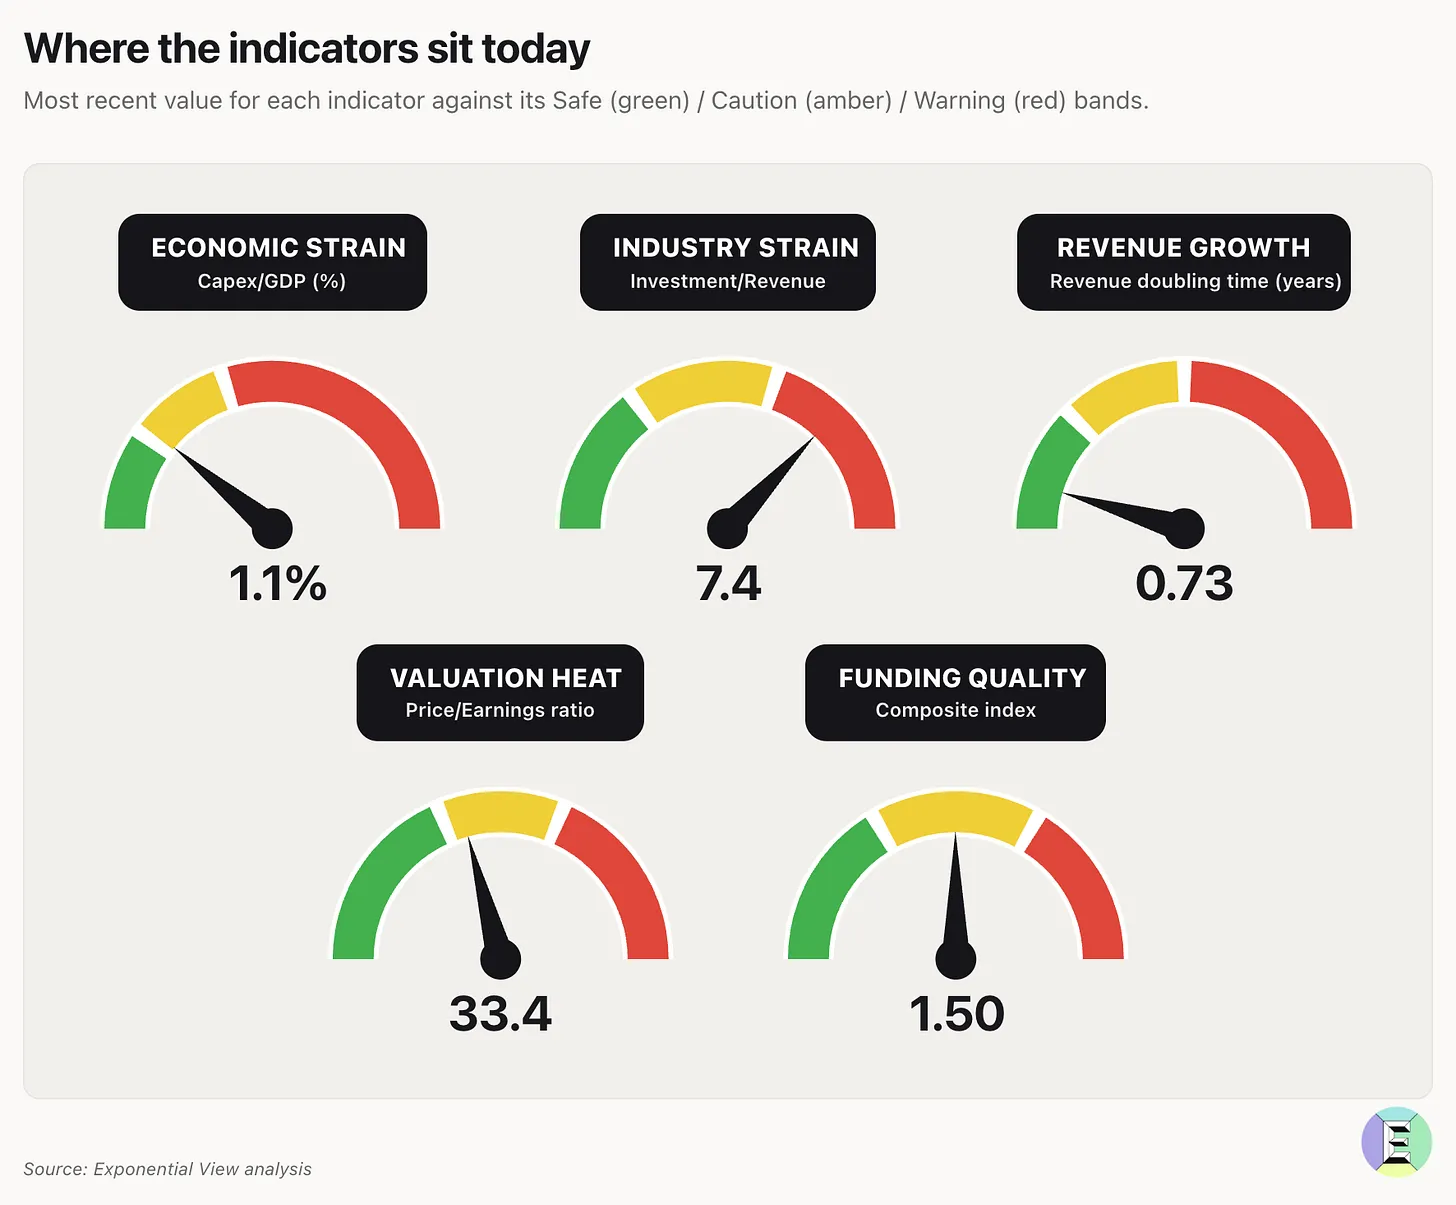
The trend is for capex/revenue to leave the Red (it started at 53:1 in 2023 and is on track for 4.5:1 by July 2027), with economic strain hitting the red in late 2027 (so they offset each other). In order to qualify as a bubble, you need 3/5, and Azheem’s team does NOT expect that to happen through at least the end of 2029 (as far out as they extrapolate).
SO…bottom line: IF you see scary headlines (you probably will if you read ANY news) about AI, the economy, inflation, interest rates, or the “everything stock market bubble,” remember that we are watching closely for signs of trouble, and right now?

Sign in to leave a comment and join the discussion.
Sign Up Free