

Its election day and the market is coming into it with a few scrapes.. The S&P 500 ended Monday at 7,541.40 which is down 3.5% from its Oct 6 all time high. Nasdaq composite is down 8.8% from its all time high and we saw the S&P 500 fall 1.8% on Friday its biggest down day since June. Most of the selling has been in the tech space as investors balk at the cash being burned building AI.
I thought I would share some quick facts/thoughts about the markets typical behavior around midterm elections. I took the last 24 midterm elections we have S&P 500 data on (1930-2022) and looked at returns from close on election day to year end and then the next 12 months.
Historical Performance
What's the cleanest and easiest test to run? How did the S&P 500 do one year after each Midterm Election?
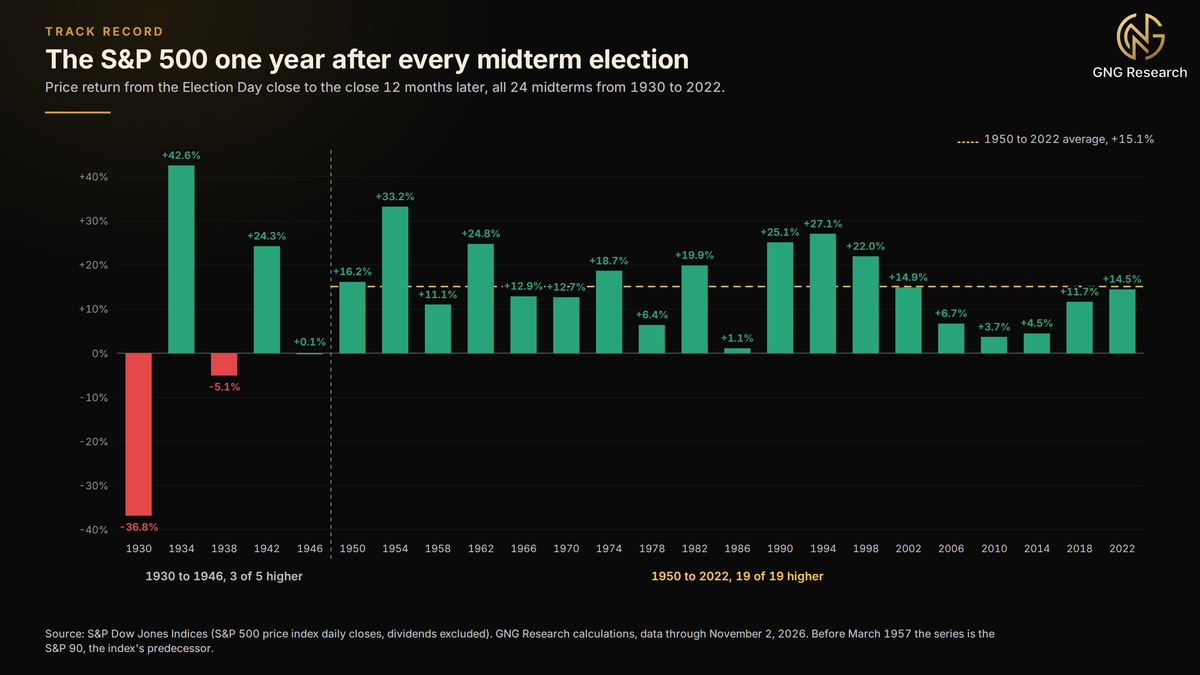
There are 19 one year returns ranging from 1.1% in 1986 (which includes the Oct. 1987 crash) to 33.2% in 1954. The average return is 15.1% with a median of 14.5%. All other years since 1950 have returned an average of 7.3% when measured off of November (to include the typical winter rally). They were up in 38 of 56 years. Various published work have found similar results with date conventions that vary slightly. Ranging from 14.8% (Carson Investment Research) to 16.6% (BNY) with Capital Group finding 15.4%.
Most research has used 1950 as the starting point. If we go back further the results are mixed.. 1930 was in the middle of the great depression and the 1938 window saw the start of a war in Europe. Both were down and 1946 returned 0.1%.
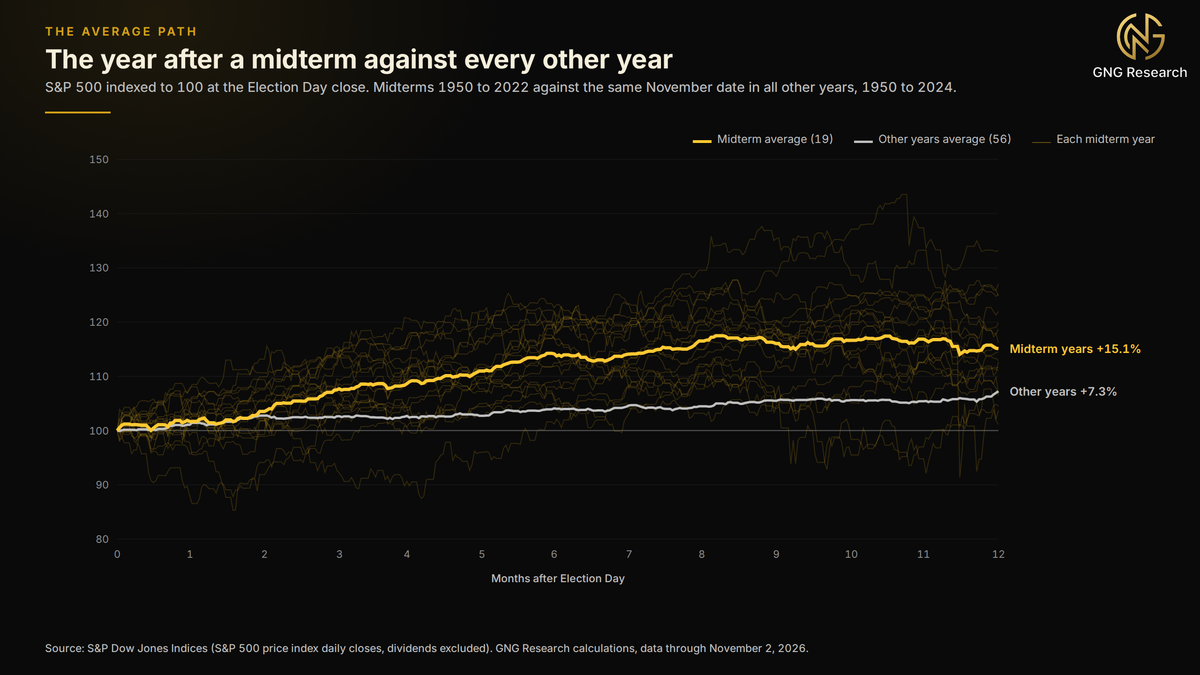
On average, midterms have beaten all other years about 7 weeks after the election and continue to lead for the rest of the 12 months. Individual years varied widely from the averages above.
The Year-End Window
As many have asked I'll go into more detail about this time period as its where things get murky.
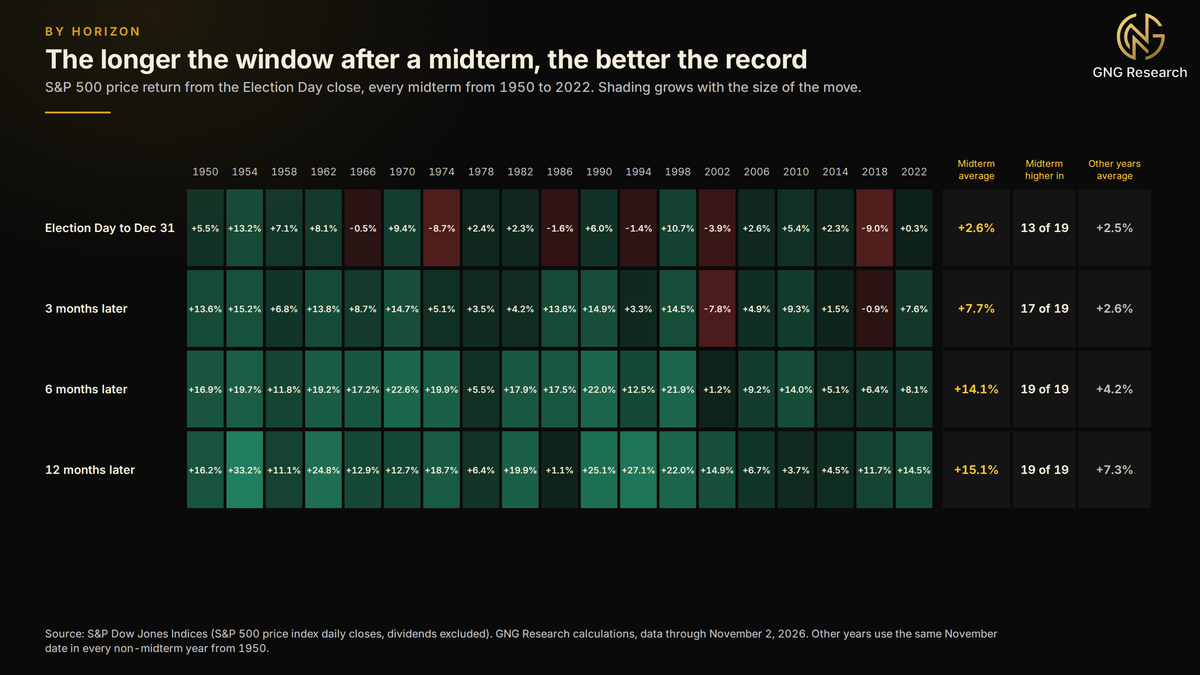
S&P 500 has increased since close on election day through the end of December 13 out of 19 midterms since 1950 averaging 2.6%. This is about the same as the 2.5% average for that time of year in other years. The more you extend the time period the bigger the gap becomes.. 3 months out its 7.7% with 17 out of 19 higher. Then at 6 months out its up 14.1% with all midterms since 1950 showing positive returns.
In 2018 we saw a 14.7% decline from the close on November 6th (election day) to the low on Christmas eve. It was up 11.7% from the close on election day one year later. 2002 saw a 7.8% drop over the first 3 months leading up to the Iraq war but was up 14.9% 1 year after the election.
On a quarterly basis the Q4 of midterm elections has averaged 6.6% since 1950 and has increased in 16 out of 19 years. Many of those gains have occurred prior to the election with an average increase of 4.0% from Sept 30th to election day. We did not see that happen this year with the S&P 500 down 1.4% from the close on Sept 30th through Monday.
Why?
No ones able to pin it to just one thing. U.S. Bank studied the past 31 midterms dating back to 1900 and could not find any consistent midterm effect so I would be wary of anyone who claims certainty. The research does point to three forces that overlap.
When elections happen there is the possibility of taxes, regulation, trade and spending changes all at once. Research by Brandon Julio and Youngsuk Yook showed that capital spending fell an average of 4.8% during election years. Companies wait until after the uncertainty passes to increase spending. Research by Bryan Kelly, Lubos Pastor and Pietro Veronesi found that options that live over an election were priced higher. Due to the possibility of change.
In the last 20 midterms the presidents party has lost house seats in 18 of them. Losing an average of about 26 seats. Only in 1998 and 2002 did the presidents party gain house seats. Having two parties control washington usually keeps legislation from changing too much. Which most believe is a good thing for the market. The outcome itself has mattered less than you might expect, though. After the election Edward Jones found the markets had an average return of 12.0% for 6 months if one party was in control of everything. If congress was split the market returned 11.6%. When the other party was in control of congress the market returned 14.5%.
Another pattern people look at is that Presidents try to pass the unpopular legislation they know needs to be passed at the beginning of there term. And will focus on growth leading up to the next election. This is known as the Presidential Cycle theory. Popularized by Yale Hirsch author of the Stock Trader's Almanac.
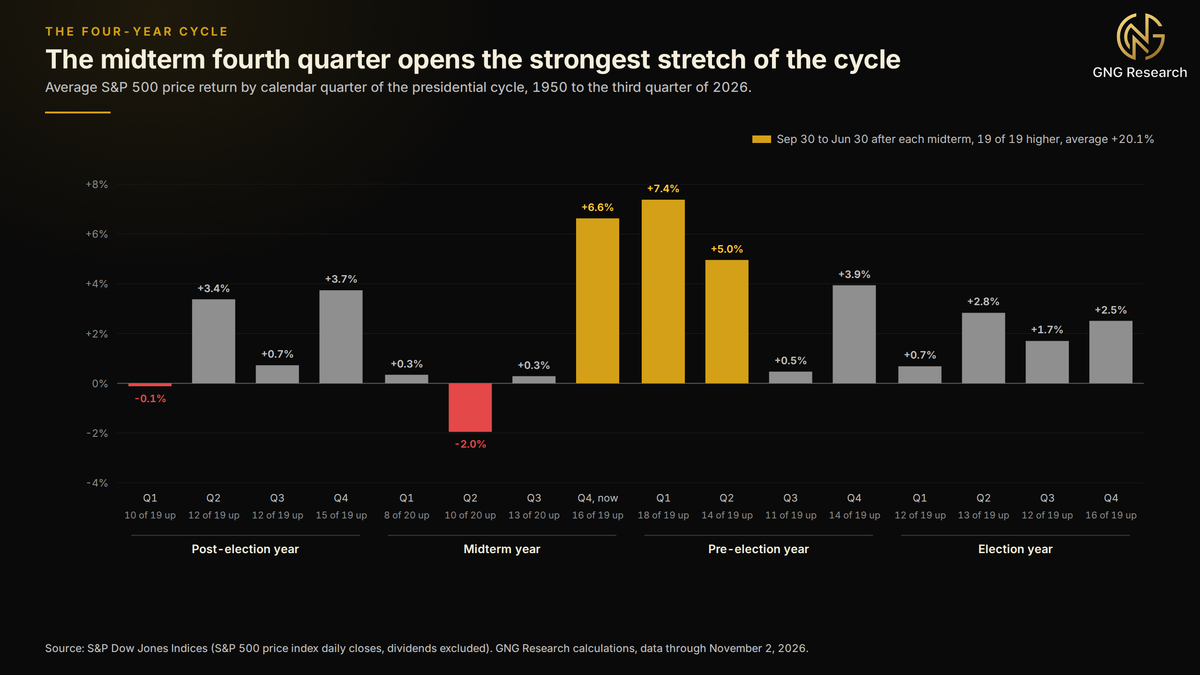
The second quarter of a midterm year has been the weakest of all 16 quarters. Averaging -2.0%. The three quarters starting from where we are at now have been the strongest. From Sept 30th of a midterm year to June 30th of the following year the S&P 500 has gained an average of 20.1% after each midterm year. And has gone up after every midterm year since 1950. Every other 3 quarter period has only gained an average of 6.2% and went up about 71% of the time.
Year of a midterm have also tended to drop more than other years.
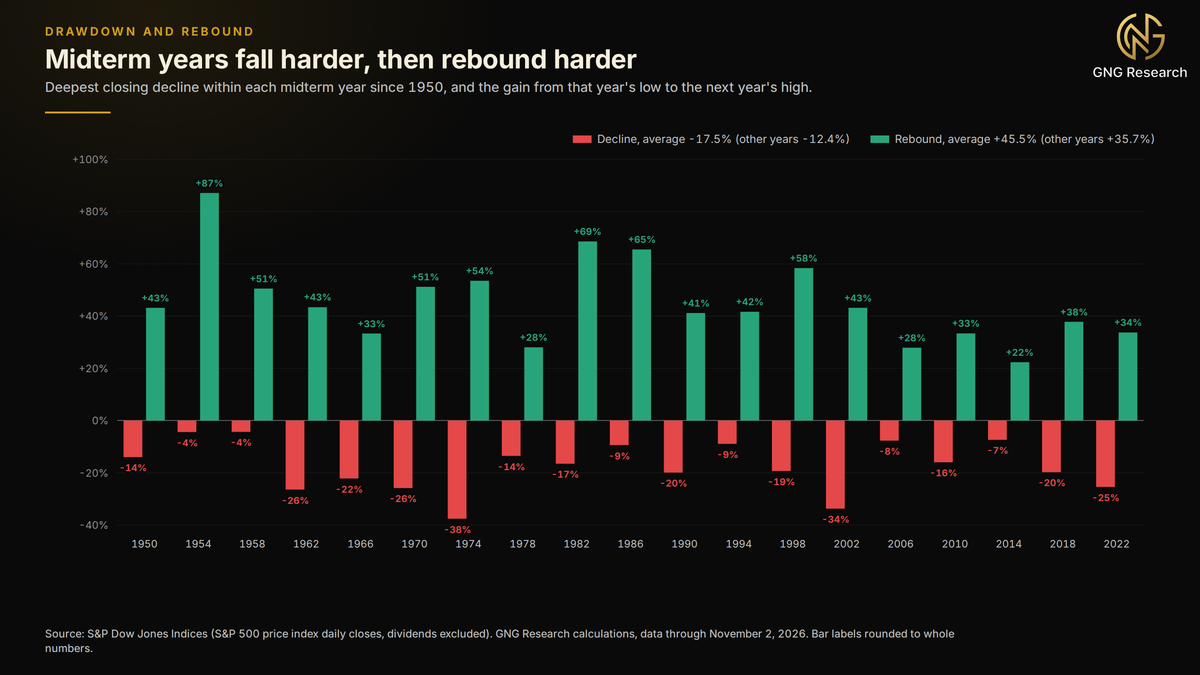
On average the largest close to close drop during a midterm year has been 17.5% since 1950. Other years have averaged drops of only 12.4%. From the bottom of a midterm year to the top of the next year the S&P 500 has gained an average of 45.5%. Other years have only gained an average of 35.7%.
2026 So Far..
Things have looked nothing like your typical midterm year thus far.
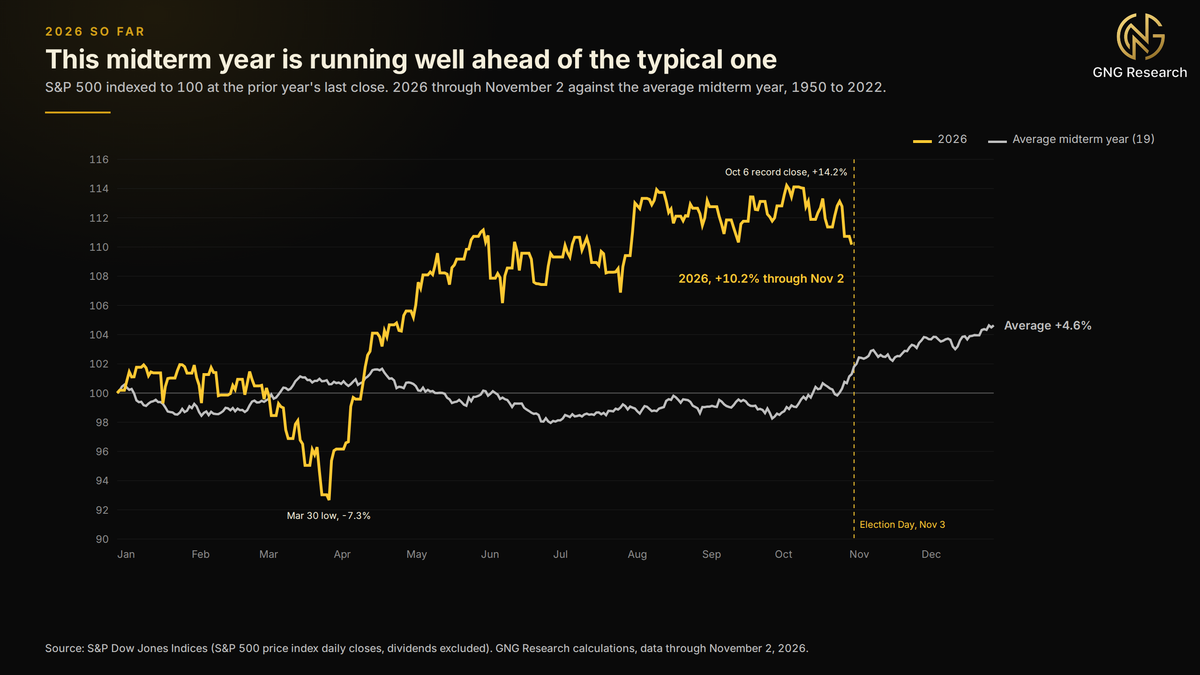
The S&P 500 is up 10.2% as of the Nov 2 close in 2026. Midterms have averaged about a 1.3% gain through this point of the year dating back to 1950 and closed the year with a 4.6% increase. Our max draw down as of the close this year was 9.1% about half the average of a midterm year. It took place from the Jan 27 close to our low on Mar 30 and occurred mainly after the war with Iran started on Feb 28.
History shows you can start off a midterm year high and still have a good year. Of the seven midterm years since 1950 with a 10%+ gain by election day the following 12 months have averaged 15.7% (a very small sample) and closed higher each time. The average run to dec 31 was 5.7%. All 19 midterm years show a correlation of -.10 between returns leading into elections and the following 12 months which is essentially no correlation.
The backdrop is still unusual for a post-midterm stretch. We are in a war which is driving oil prices up. Brent crude was at $104.77 on Monday after falling 7.6% in one day on news of possible peace talks. US strikes hit Irans Qeshm Island late Monday causing prices to rise slightly early Tuesday. Inflation came in at 3.7% higher than last year in September and the FED hiked rates by .25% on September 16th the first rate hike since 2023. Futures are pricing in a ~73% probability of another rate hike on December 9th.
There are positives as well. The 10yr has backed off its highs of 5.31% on October 5th (highest since 2002) and currently sits at 4.91%. Earnings growth is expected to be 30.2% for the third quarter according to factset with 82% of reporting companies beating expectations. There is a ~95% probability that Democrats will win the house on polymarket. Which means we would have split government.
Conclusion
I was debating whether I was going to publish this or not.. this article is just research I did leading up to the midterms out of curiosity, so I decided to throw it together quickly last night. I figured I'd post incase anyone else was curious. Let me know any future topics you guys would be interested in. Also just a side note: this article is completely entirely independent of any political thoughts, affiliation, or party.. And my research is entirely data driven im just presenting what has happened historically in a way that is easy to visualize and understand. All of my political event-based articles are 100% independent of any political beliefs and entirely data-driven.
Again thanks for reading and being a part of our community here at GNG, reach out in the comments or message me with any questions or concerns.
Btw..
I published a video article not too long ago Leo Glenn and I went through the GNG AI suite. If you missed it and are curious about any of the features or offerings on our AI, feel free to watch HERE.
Sign in to leave a comment and join the discussion.
Sign Up Free