
Introduction
I have to say that the feedback on the aerospace masterclass was fantastic, which is why I decided to write another one. This time, it's a different industry (obviously) and a slightly different approach, as all companies we discuss today have similar business models.
Also, railroads, which are the subject today, might be the closest thing to a perfect toll booth that money can buy. And you obviously know I'm going to use the TOLL+M model today.
Every railroad owns its own rail. It maintains it, polices it, and decides who uses it. A trucking company shares public highways with its competitors. A railroad's competitor needs its own track, and building a new coast-to-coast railroad in 2026 is about as realistic as building a new Manhattan.
It's also an industry that is changing faster than it has in decades. Union Pacific (UNP), CSX (CSX), Norfolk Southern (NSC), Canadian National Railway (CNI), and Canadian Pacific Kansas City (CP) are all part of a merger fight that could redraw the map of North American freight.
Let me give you two numbers.
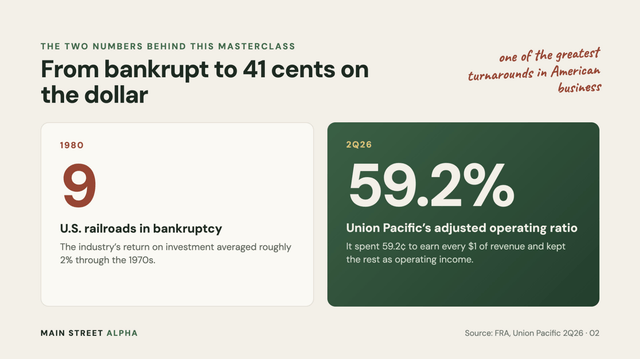
In 1980, nine U.S. railroads were in bankruptcy, and the industry's return on investment had averaged roughly 2% through the 1970s.
In 2Q26, Union Pacific reported an adjusted operating ratio of 59.2%. In plain English: it spent 59.2 cents to generate every dollar of revenue and kept the rest as operating income.
That's one of the greatest turnarounds in American business history.
In this article, I'll explain how the industry got here, who covers which region, how railroads score on TOLL+M, how cyclical they are, and how mergers and partnerships are changing the map. I'll also share my favorite railroad in each region and the five questions I ask before buying any of them.
It's a long one, but it isn't time-sensitive. Come back to it whenever a railroad lands on your radar.
Oh, and one more thing: in this article, I sometimes refer to Canadian National as "CN." Canadian Pacific Kansas City is CPKC.
So, let's dive in!
From Bankruptcy To Toll Booth
To understand today's railroads, you have to go back to 1980. Before then, almost every rail rate was set by regulators. Railroads could not raise prices to keep up with inflation, could not easily abandon money-losing lines, and could not sign confidential contracts with customers. Over 30 years, rail's share of U.S. freight ton-miles fell from 56.1% to 37.5%.
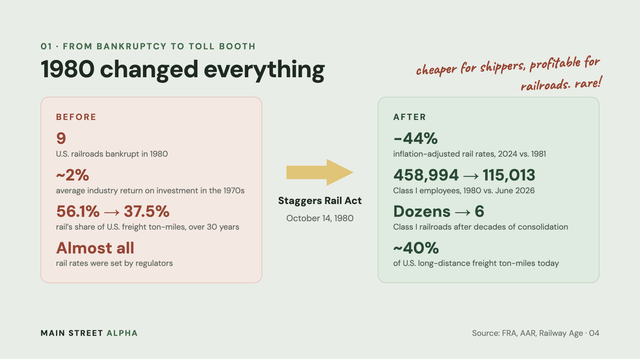
Then came the Staggers Rail Act, which was passed on October 14, 1980. It basically allowed railroads to set most of their own rates, sign contracts, and sell or abandon unprofitable lines.
What followed was decades of consolidation. The pre-Staggers industry had dozens of Class I railroads. Today, there are six.
The results are hard to argue with:
Average inflation-adjusted rail rates (revenue per ton-mile) were 44% lower in 2024 than in 1981.
Class I employment went from 458,994 in 1980 to 115,013 in June 2026.
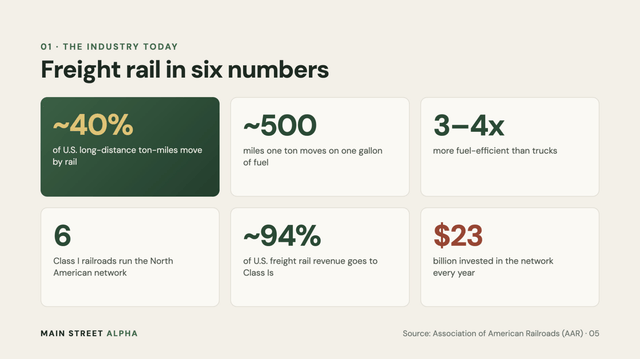
Freight rail now handles roughly 40% of U.S. long-distance freight ton-miles, more than any other mode.
Railroads move one ton of freight nearly 500 miles on a single gallon of fuel, making them three to four times more fuel-efficient than trucks.
Shippers got cheaper rates, and railroads got profitable. That's rare. And consolidation left each region with two dominant players, which is the foundation of everything that follows.
The Map: Six Railroads, Three Duopolies
The industry has six Class I railroads (the largest carriers, defined by an annual revenue threshold). Together, they account for about 94% of U.S. freight rail revenue.
Region | Railroad | Footprint |
|---|---|---|
West | Union Pacific | ~32,000 route miles, 23 western states |
West | BNSF (owned by Berkshire Hathaway) | ~32,500 route miles, 28 states |
East | CSX | ~21,000 route miles, eastern U.S. plus Ontario and Quebec |
East | Norfolk Southern | ~19,200 route miles, 22 states |
Canada and beyond | CN | Nearly 20,000 miles, Atlantic to Pacific plus a spine to the U.S. Gulf |
Canada and beyond | CPKC | ~20,000 route miles, the only single-line Canada-U.S.-Mexico network |
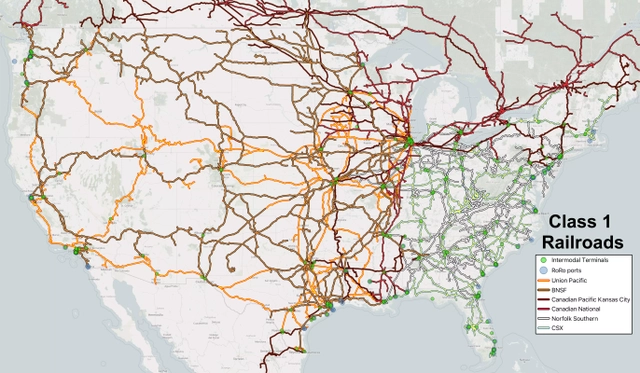
The West belongs to Union Pacific and BNSF. Between them, they connect the West Coast ports, the Texas Gulf, the Mexican border crossings, and the Midwest.
The East belongs to CSX and Norfolk Southern. Both reach Chicago, the Ohio Valley, the Atlantic ports, and the Southeast. They were already rivals before 1999, when they split Conrail between them, and that split still shapes the eastern map today.
The cross-border players are CN and CPKC. CN runs from coast to coast in Canada and down through Chicago and Memphis to New Orleans. CPKC was created in 2023 when Canadian Pacific bought Kansas City Southern, making it the first and only railroad that connects Canada, the U.S., and Mexico on a single network.
Then there's Chicago, where the eastern and western railroads meet. Cross-country freight usually changes hands there or in St. Louis, Memphis, or New Orleans. Those handoffs (interchanges) add time and cost, which is the core argument behind the Union Pacific-Norfolk Southern merger.
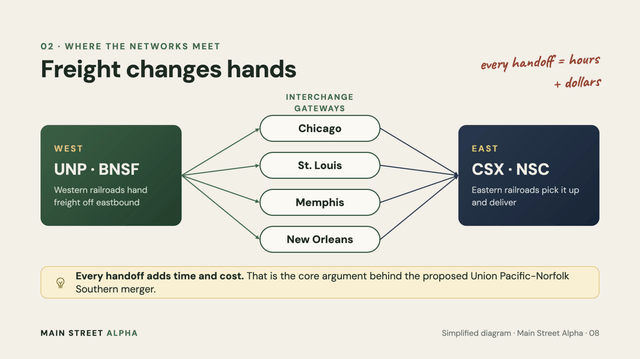
It depends a bit on who you ask, but roughly 25% of all U.S. rail traffic touches, originates, terminates, or passes through the greater Chicago area.
The Operating Ratio: The Number That Explains Everything
If you remember one railroad metric, make it the operating ratio ("OR"). It's operating expenses divided by revenue. Lower is obviously better.
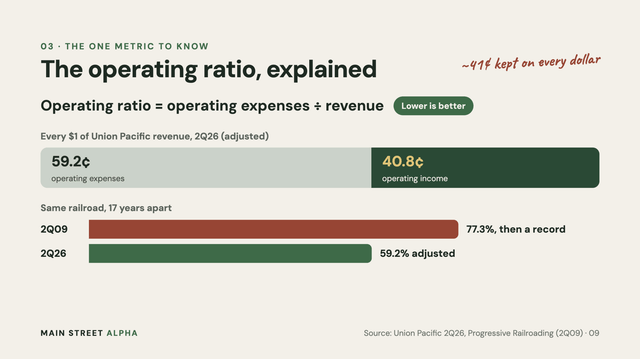
Here's where the industry stood in 2Q26 (some have reported 3Q26 numbers, but for comparison, we're using 2Q26):
Railroad | 2Q26 Operating Ratio | Comment |
|---|---|---|
Union Pacific | 59.2% adjusted (59.7% reported) | Industry leader; fuel cost 120 basis points |
CSX | 61.7% | Down from 64.1% a year earlier |
CPKC | 61.6% core adjusted (64.6% reported) | Up 90 basis points |
CN | 62.2% adjusted (62.5% reported) | Up 50 basis points, mainly fuel |
BNSF | 65.4% | Up 0.6 points; fuel costs up 68% |
Norfolk Southern | 65.5% adjusted (67.6% reported) | Up 210 basis points |
Source: company filings and releases for 2Q26
How did they get here? That question is extremely important.
They mostly got there through something called Precision Scheduled Railroading ("PSR") - you may have heard of it.
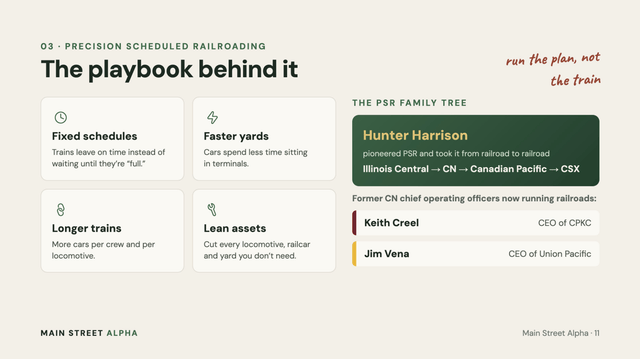
The late Hunter Harrison pioneered it at Illinois Central and CN before taking it to Canadian Pacific and CSX. Instead of waiting until a train is "full," you run trains on a fixed schedule, move cars through yards faster, run longer trains, and cut every locomotive, railcar, and yard you don't need.
You can imagine that this method isn't popular with every stakeholder...
PSR also created a family tree. CPKC CEO Keith Creel and Union Pacific CEO Jim Vena both served as chief operating officer at CN during the PSR years.
Now, an important nuance. The OR can be misleading in the short term, and 2026 is the perfect example.
Railroads charge fuel surcharges, so higher diesel prices mostly get passed on to customers (with a delay). But a pass-through cost inflates both revenue and expenses, which pushes the OR higher even if profits in dollars barely change.
Union Pacific paid $3.86 per gallon of fuel in 2Q26, up from $2.42 a year earlier, which hurt its OR by 120 basis points. Fuel explains a large part of the OR increases in the table above.
So, when you see a railroad's OR rise, always check whether it's fuel, volume mix, or genuinely lower productivity.
The TOLL+M Breakdown
As many of you know, TOLL+M is my framework for businesses with irreplaceable assets: Tangible assets, Oligopoly power, Low incremental capital intensity, Long-duration cash flows, plus Macro alignment. Each pillar scores out of 20. The scoring out of 20 isn't essential, but it makes comparisong companies, industries, and entire sectors much easier when the scale is the same.
On a side note, you don't need to be able to score things yourself. Understanding what TOLL+M is all about is way more important. Just think of driving a car. Knowing how to drive a car is much more important than knowing how to build one (silly but true).
Railroads are an interesting case because they ace some pillars and struggle with one. Here's my industry-level read (individual names differ).
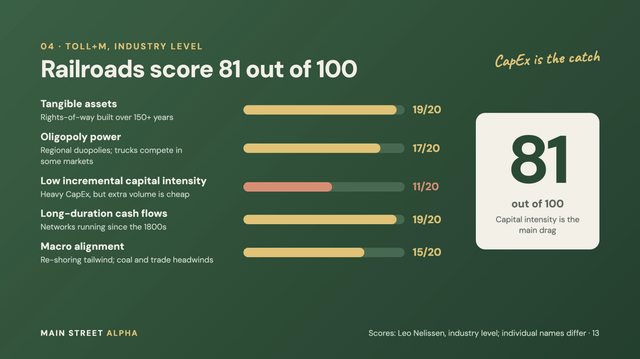
Tangible assets. A railroad's moat is literally made of steel and land. Union Pacific traces its roots to 1862. Norfolk Southern's predecessors date back to 1827. Much of the western network was built with help from 19th-century federal land grants. Try assembling a continuous 2,000-mile corridor through cities, farmland, and environmental reviews today. This is also why Union Pacific showed up in my LAND framework.
Oligopoly power. In most markets, a shipper has two railroads to choose from. In some, only one. A chemical plant built next to a single railroad's track is what the industry calls a "captive shipper." That's real pricing power. Union Pacific, for example, explicitly guides for pricing above inflation.
There's just one problem: trucks.
For containers and many consumer goods, trucks are a real alternative. That's why intermodal (containers moved by train) has the weakest pricing in the industry, while chemicals and bulk products typically have the strongest. Regulators also watch closely. The Surface Transportation Board ("STB") oversees rates for captive shippers and has to approve every major merger.
Low incremental capital intensity. This is the weakest pillar. According to the Association of American Railroads ("AAR"), freight railroads spend roughly $23 billion a year on their networks, and capital spending as a share of revenue is about six times that of the average U.S. manufacturer. Union Pacific alone has a $3.3 billion capital plan for 2026.
However, the incremental part of the equation looks better. Once the track exists, adding cars to an existing train costs very little. That's why railroads love volume growth. The fixed costs are already paid.
Long-duration cash flows. These networks survived world wars, depressions, and the interstate system. Customers change. The track stays.
Macro alignment. Here, it's mixed. Re-shoring, near-shoring to Mexico, and tight truck capacity are tailwinds. Coal is a headwind. BNSF's coal volumes fell 7.9% in 2Q26, mainly due to plant retirements and lower demand. And trade policy is a wildcard for the cross-border railroads. On July 1, the U.S. declined to renew USMCA in its current form. The agreement remains in force, but it now faces annual reviews, which adds uncertainty for CN and CPKC.
Sign in to leave a comment and join the discussion.
Sign Up Free