How to Screen Stocks: Research Terminal
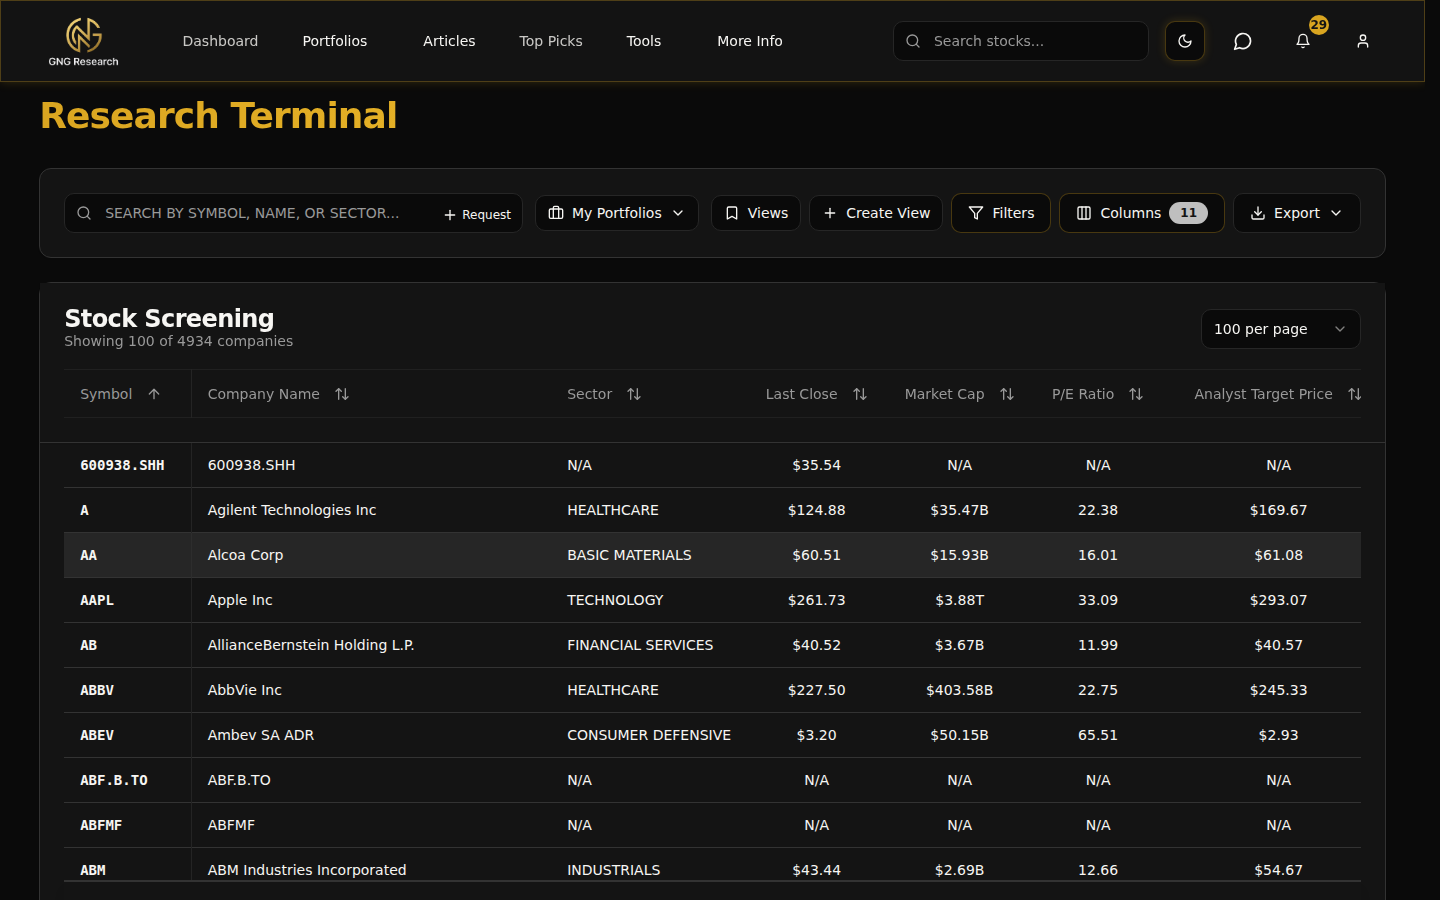
How to screen stocks in the Research Terminal: pick columns from 300+ metrics, filter by any value or sector, sort, and export the results.
Quick checklist
- Search for a ticker and confirm the company loads
- Open the Column Selector and add at least two new metrics
- Apply a numeric filter and a sector filter together
- Export the filtered view to CSV
- Click a row to open the full stock detail page
Pro tips
- Sort by any column (click once for ascending, twice for descending) to surface outliers fast.
- Bookmark the URL after setting filters; it preserves your exact screen for next time.
- Data refreshes daily at 7:30 PM ET, so screens reflect the latest fundamentals each morning.
- Click any row to open the full stock detail page with charts, financials, and forecasts.
The Research Terminal is built for deep, customizable screening. Columns, filters, and sort order all work together so you can craft the exact dataset you need.
Customize your columns
Click the Columns button to open the selector. Toggle on any metric: dividend yield, ROIC, quick ratio, PEGY, GNG Valuation Rating, and dozens more. There are 300+ columns across categories like price, valuation, profitability, growth, dividends, technical indicators, and calculated scores.
Drag columns in the table to reorder them. The terminal remembers your layout for the session.
Filter with precision
Open the Filters drawer to set numeric ranges or pick from multi-select chips for sectors, exchanges, or rating tiers. Active filters show as chips above the table. Click the X on any chip to remove it instantly.
Combine multiple filters to build targeted screens, like 'Technology sector + P/E under 20 + Dividend Yield above 2%'.
GNG Valuation Ratings
Every company with sufficient financial data receives a proprietary composite Valuation Rating based on multiple valuation methods. Ratings range from Strong Buy to Strong Sell and update daily at 7:30 PM ET.
Export and share
Download CSV, Excel, or PDF versions of the exact view on screen. Exports include every row that matches your active filters and every column you have toggled on.
FAQs
- How do I screen stocks in the Research Terminal?
- Open the Research Terminal, add the metrics you want from the Column Selector, set numeric ranges or sector filters in the Filters drawer, then sort by any column. Export the filtered list when it looks right.
- Which companies does the terminal cover?
- Actively listed US companies with complete price history back to 1999. Coverage expands as new listings are added.
- How often does the data refresh?
- Fundamental and calculated metrics refresh daily at 7:30 PM ET. Price data updates throughout the trading day.
- What are the 138 calculated financial metrics?
- Derived metrics computed by our pipeline: ROIC, PEGY ratio, interest coverage, dividend payout ratio, trailing CAGR, GNG Valuation Ratings, and more. They go beyond raw financial statements to give you actionable screening power.
- Will my filters and columns persist?
- Filters stay in the URL query string and the column layout persists per browser session. Bookmark the URL to reopen the same screen later.