How to Backtest a Portfolio: Analytical Tools
How to backtest a portfolio, run a Monte Carlo simulation, screen options and forecast dividend income with GNG's four analysis tools, explained step by step.
Quick checklist
- Run a backtest with at least two tickers
- Review the Performance, Risk, and Dividends tabs
- Open the Monte Carlo Forecaster and run a simulation
- Screen for options using the Options Screener
- Forecast dividend income for a stock you follow
Pro tips
- Use different date ranges in the BackTester to see how a strategy handled multiple market regimes.
- Run Monte Carlo with different time horizons to compare short-term vs. long-term outcome distributions.
- In the Options Screener, sort by implied volatility to find the richest premiums quickly.
- The Dividend Forecaster is most accurate for companies with consistent payout histories.
Backtest a portfolio against history, run a Monte Carlo simulation of what could happen next, screen options, and forecast dividend income. Each tool answers one question: 'How would this have performed?', 'What could happen next?', 'Which options fit my criteria?', and 'How much income will this generate?'
BackTester
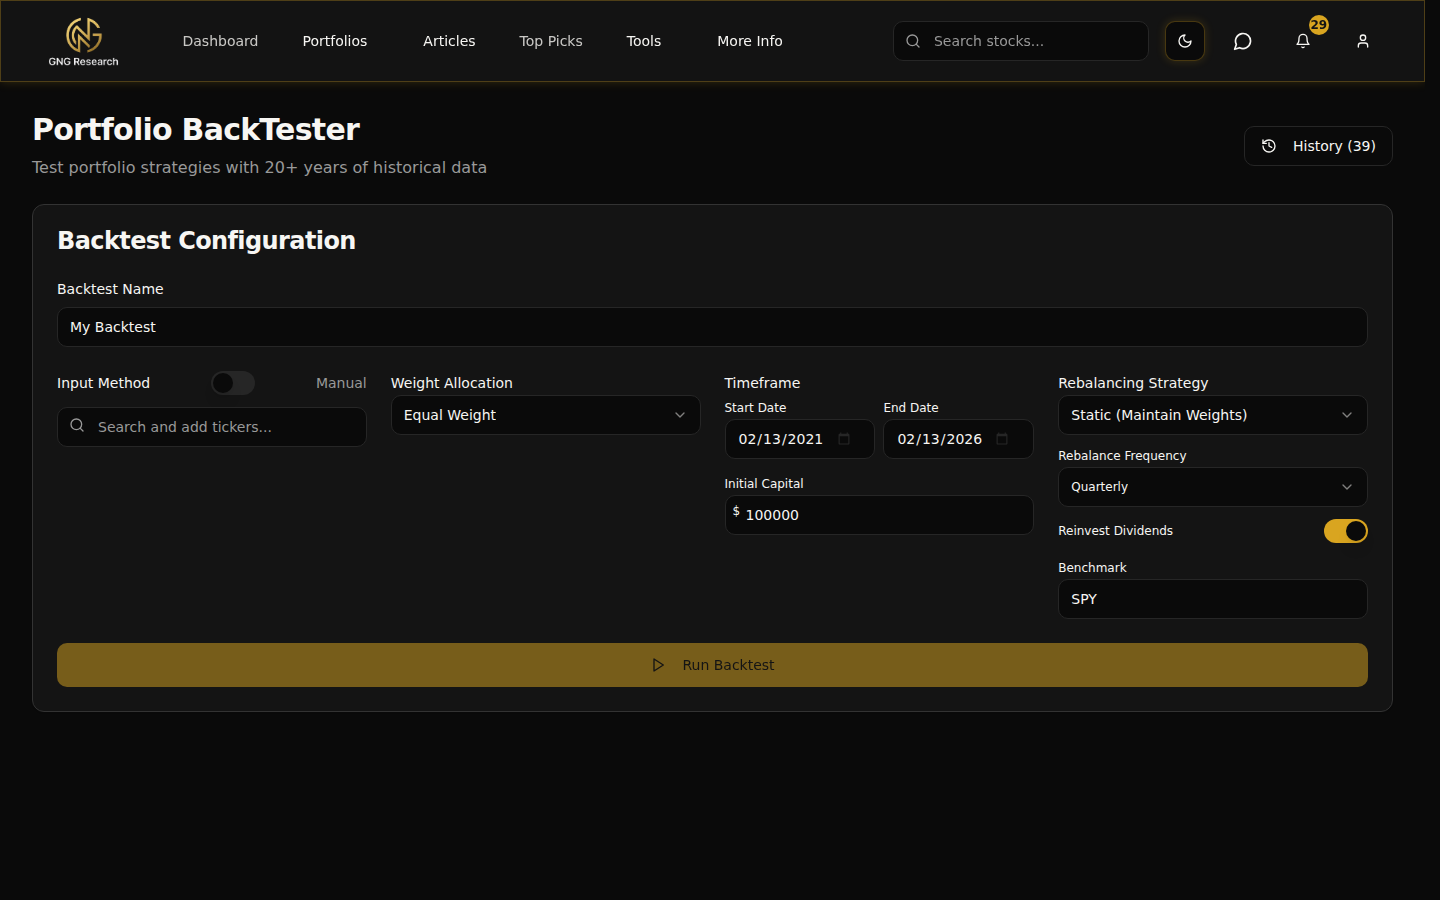
Name your backtest, add tickers, choose equal or custom weights, set a rebalance schedule, and decide whether dividends should be reinvested. Select start and end dates, then press Run Backtest.
Results populate across five tabs: Performance, Benchmark, Risk, Dividends, and Transactions. Past runs are saved in the history sidebar for instant replay.
Monte Carlo Forecaster
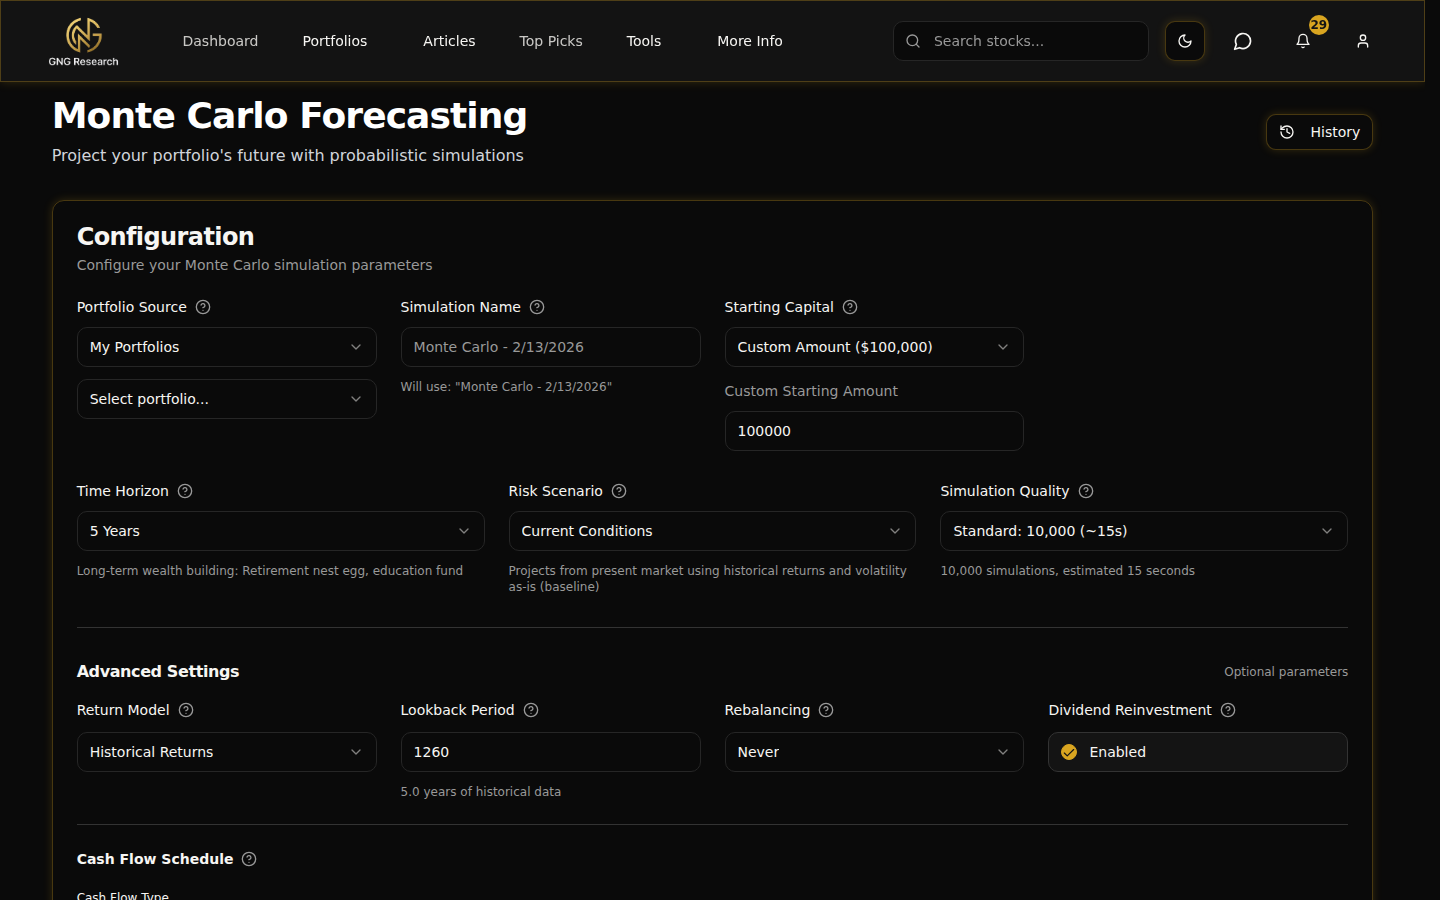
Enter a portfolio or single ticker, set the simulation parameters, and hit Run. The forecaster generates thousands of potential outcome paths and summarizes them into probability bands: best-case, worst-case, and median scenarios.
Use it alongside the BackTester to combine backward-looking analysis with forward-looking probability.
Options Screener
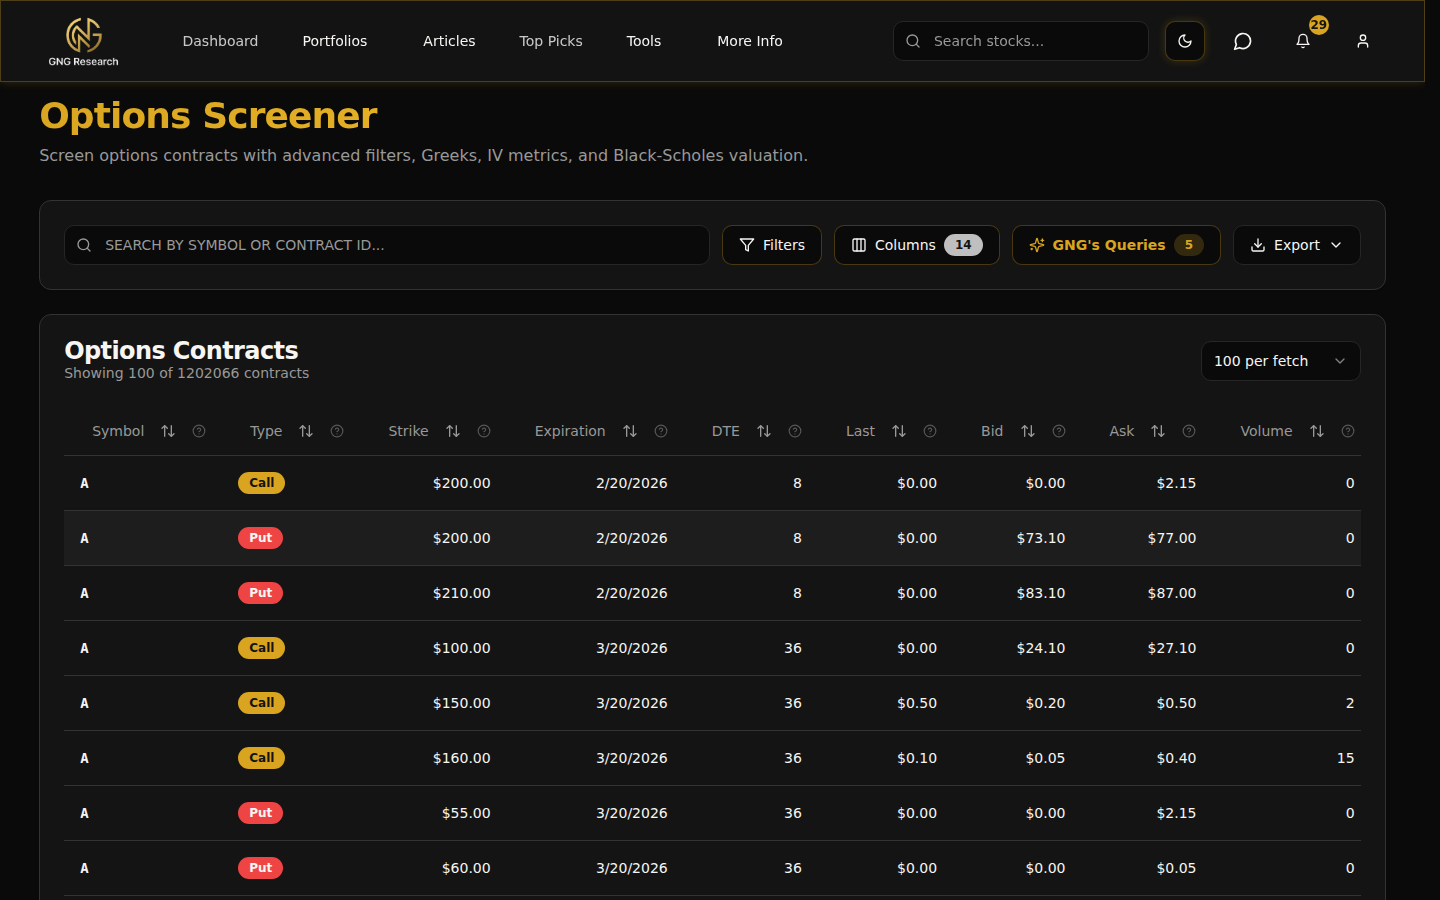
Filter by underlying ticker, expiration range, strike range, implied volatility, delta, and more. Results display in a sortable table. Click any row for contract details.
Use the screener to find high-IV income plays or low-delta hedges quickly.
Dividend Forecaster
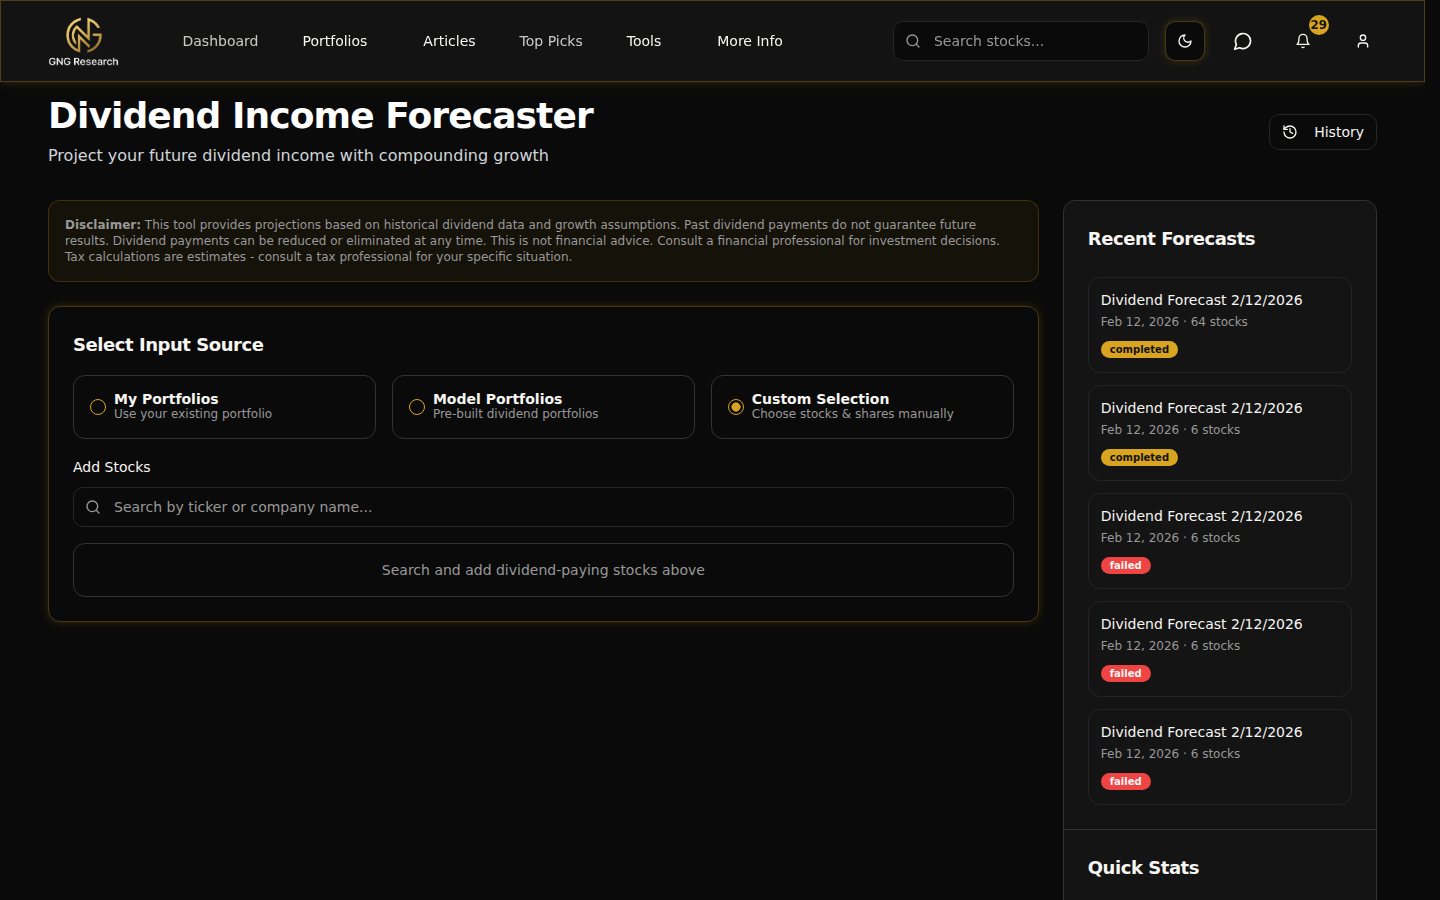
Enter a ticker to see projected future dividend payments based on historical payout patterns, growth rates, and the months each company has paid in the past. The forecaster accounts for payout frequency, ex-dates, and CAGR trends.
Pair it with portfolio holdings to estimate total annual dividend income across your positions.
FAQs
- How do I backtest a portfolio?
- Open the free Backtester, add the stocks and ETFs you want to test, choose equal or custom weights, a rebalance schedule and whether to reinvest dividends, pick start and end dates, then press Run Backtest. You need a free GNG account.
- How do I run a Monte Carlo simulation?
- Open the free Monte Carlo tool, enter a portfolio or a single ticker, set the simulation settings and press Run. It simulates thousands of possible paths and shows best-case, median and worst-case bands.
- How do I forecast dividend income?
- Open the Dividend Forecaster (Pro Lite and higher), enter a ticker or your holdings and choose whether to reinvest dividends. It builds a 10-year projection by default from payout history, growth rates and past payment months.
- How long does a backtest take?
- Most tests finish in under a minute. Larger baskets or multi-decade spans may take longer, but results persist in the history list.
- What data powers the Monte Carlo simulations?
- Historical return distributions from our price database (back to 1999). The engine applies variance drag and realistic return modeling, not simple random walks.
- Does the Options Screener show real-time data?
- Options data is aggregated and recomputed daily after the market close. Use the screener for discovery, then confirm execution-level details with your broker.
- How far out can the Dividend Forecaster project?
- The forecast is a 10-year projection by default, and accuracy naturally decreases further out. The calendar shows estimated monthly income based on the forecast assumptions.