Dividend Forecaster
Project your monthly dividend earnings
Discover what your investments may pay each month over the next 10 years. The forecast uses your DRIP choice and tax rate and shows each holding's safety score.
This feature is part of Pro Lite and higher plans. Begin with a free GNG account.
You must be logged in to view this page. Log in or create a free account.
Free to join. No credit card. Takes seconds.
Overview
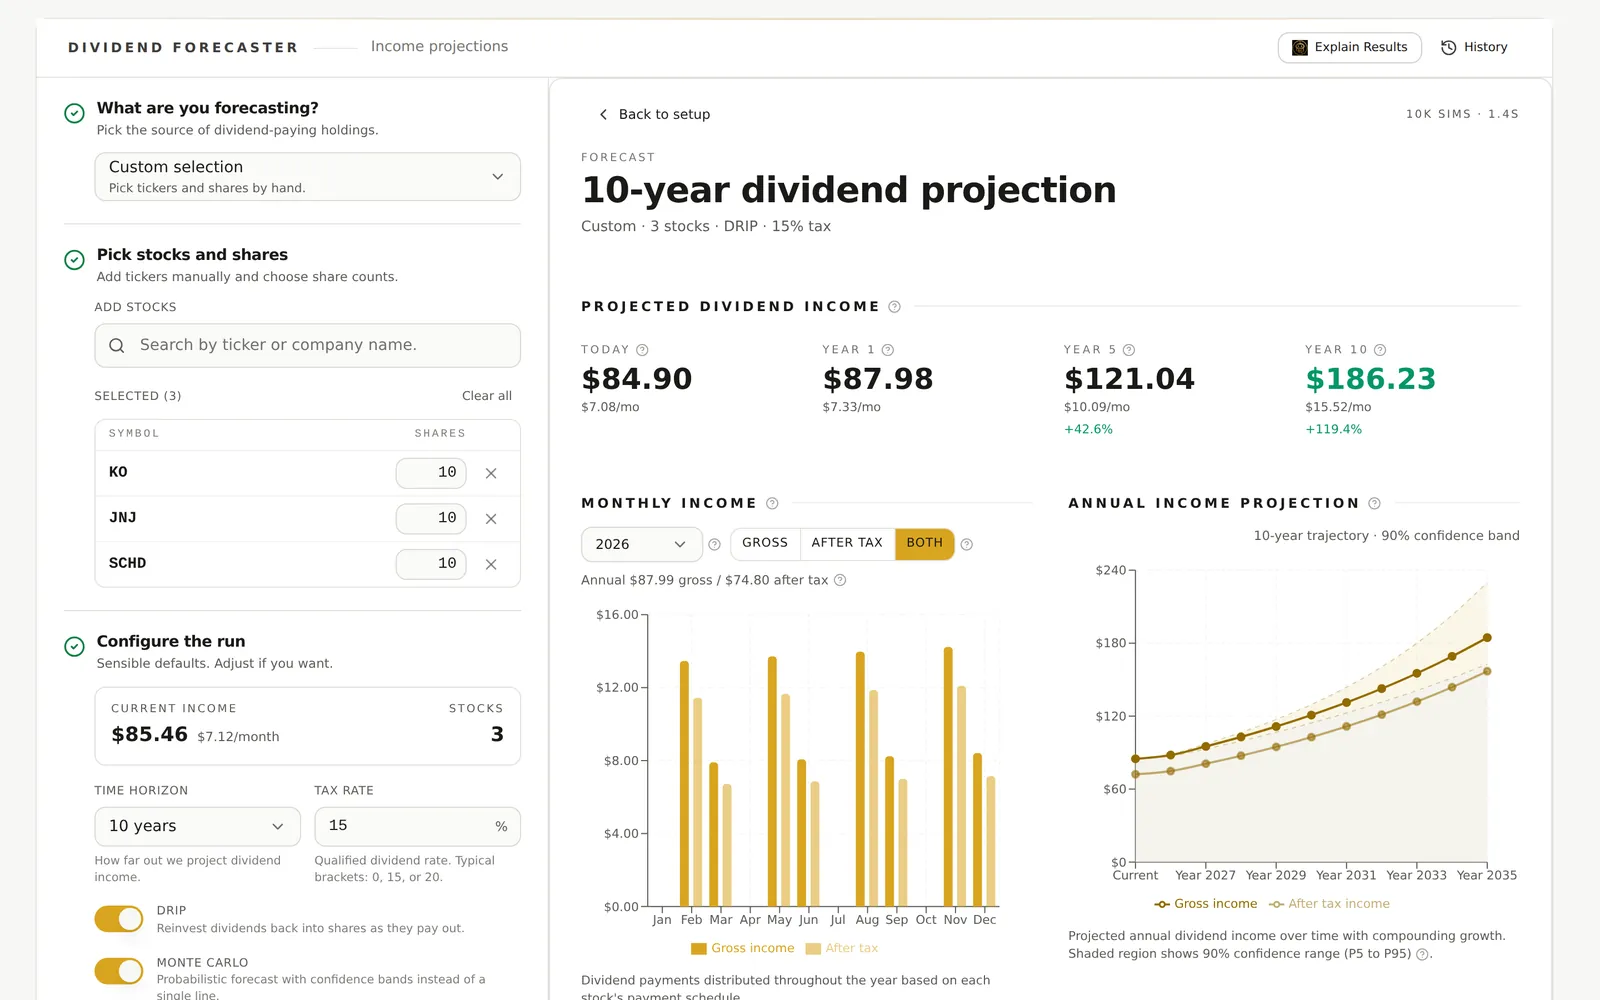
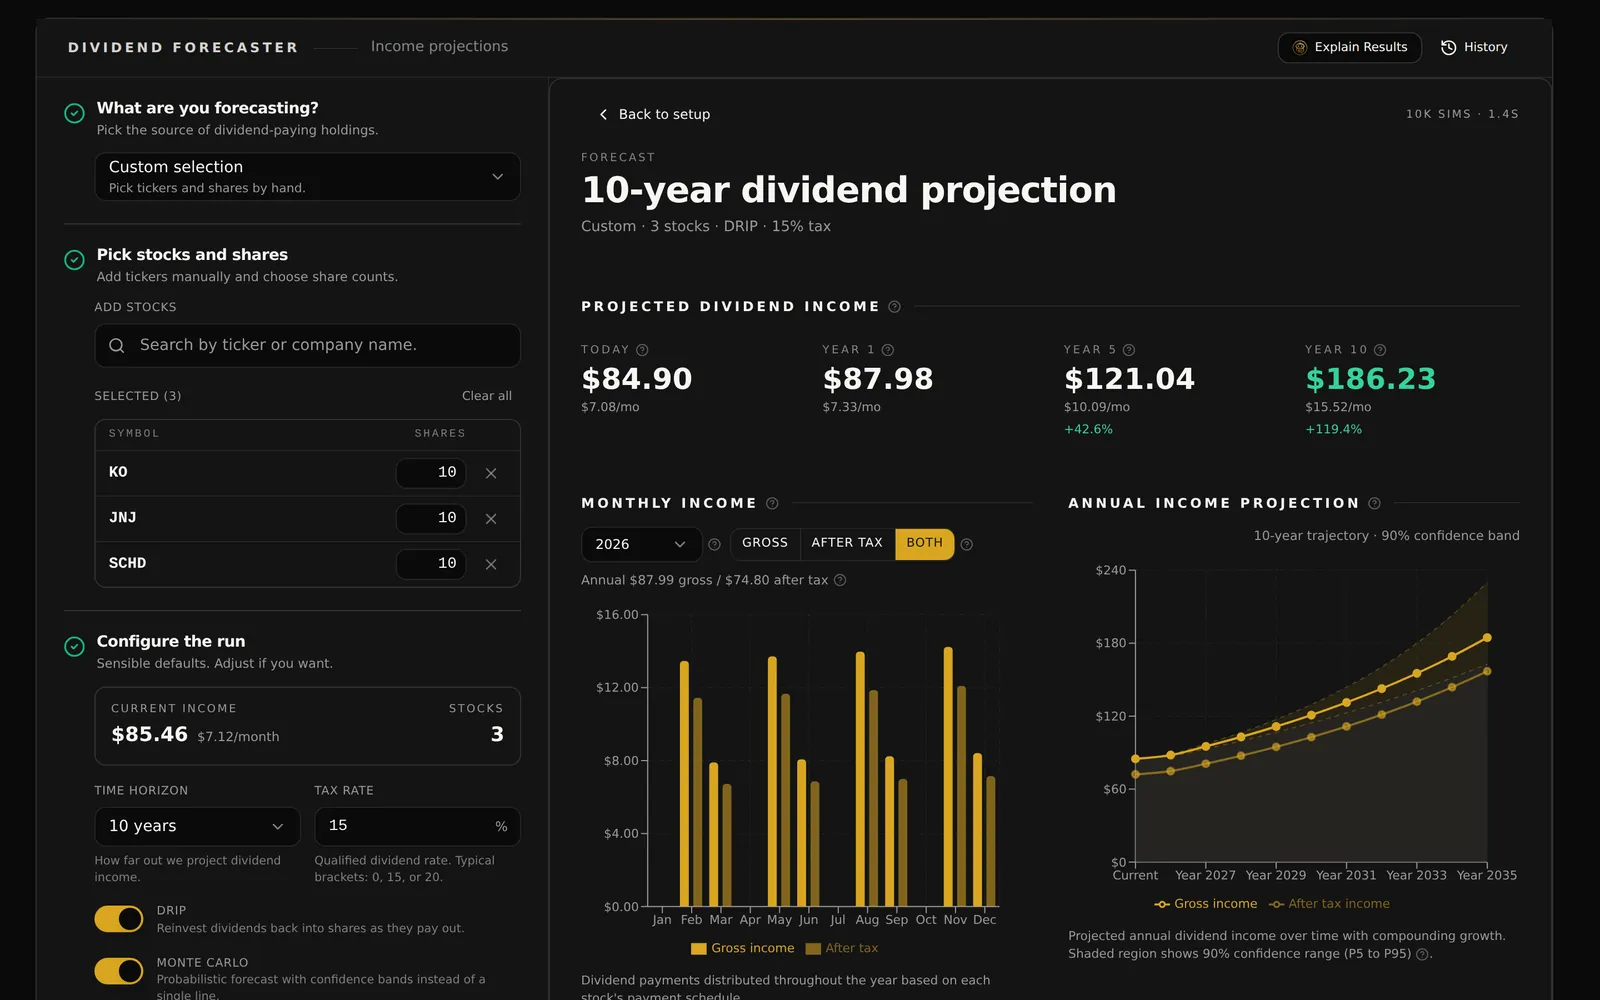
The GNG Dividend Forecaster builds a dividend income forecast for your investments: how much they may pay and when those payments may land. Pick a portfolio or build a custom list of tickers and share counts. The forecast shows monthly and yearly income for the next 10 years. You can turn DRIP on or off, set a tax rate, and choose a growth rate for each holding.
It also shows expected payment timing and each holding's part in your income. Every investment gets a safety score from 0 to 100 based on payout ratio, dividend growth, earnings stability, and debt. It also shows cut risk. If a holding lacks enough data, the tool shows N/A.
This tool is for investors who plan around dividend income. It shows which assets drive income, which months are weak, and how income changes when you reinvest or take cash. Access is through Pro Lite or a higher plan, so start with a free GNG account and upgrade later if you need it.
What you get
- A 10-year forecast by month and year
- DRIP on or off, then compare both results
- A payment calendar with tax-adjusted income
- History-based or custom growth rates for each holding
- A safety score and cut risk for each asset
- Monte Carlo runs and saved forecast options
Inside the tool
Income by holding
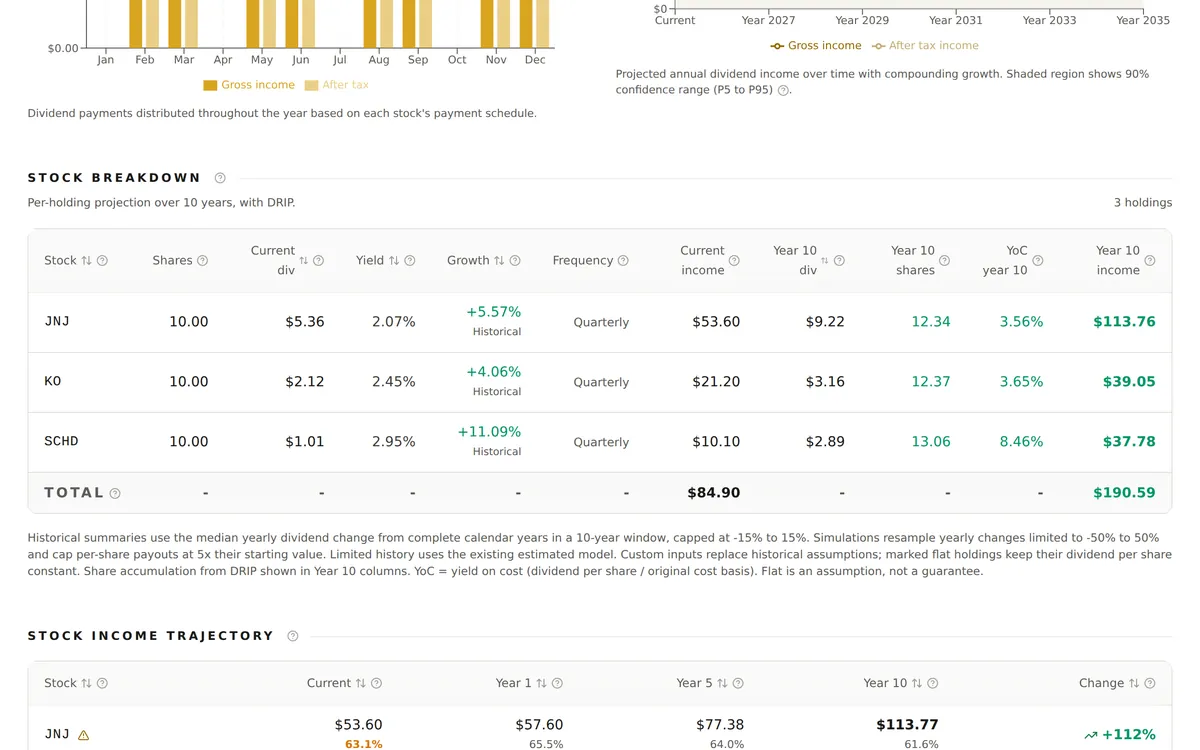
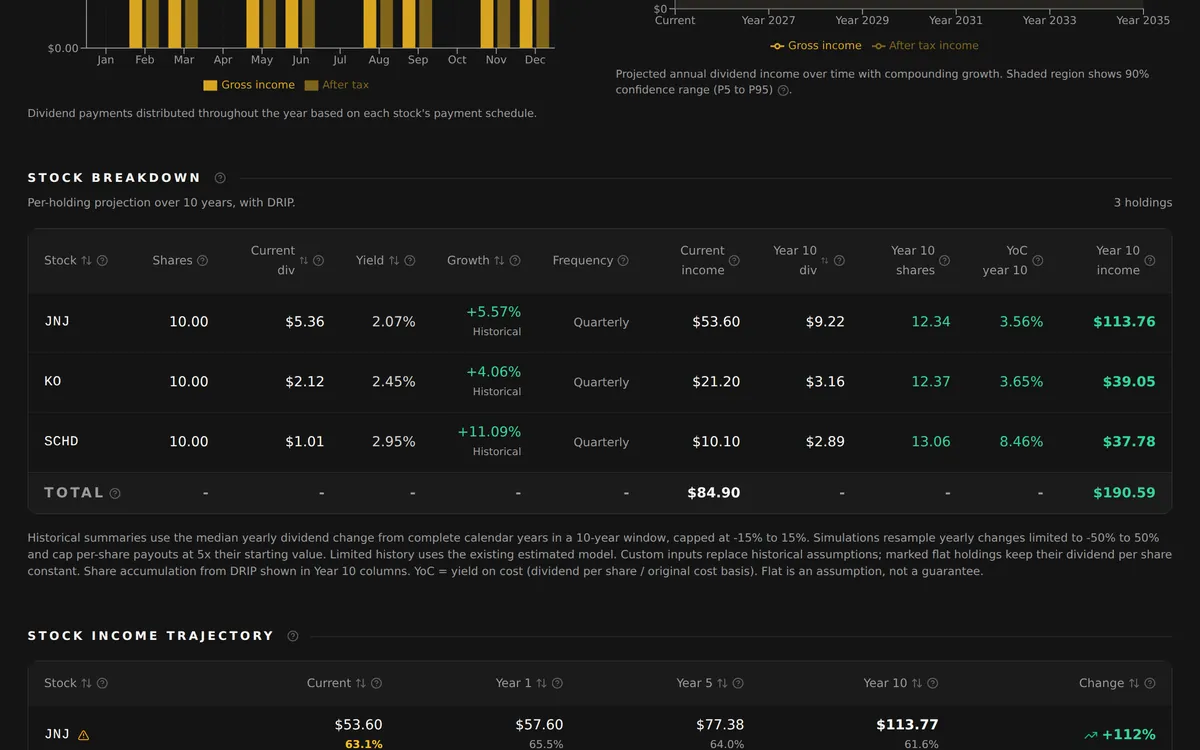
See each holding's yield, growth rate, payment frequency, and projected income in year 10 with dividends reinvested.
The stock breakdown shows each holding's shares, current dividend, yield, growth rate, payment frequency, and current income. It then shows the future dividend forecast and expected income in year 10. If DRIP is on, it also shows the year-10 share count and yield on cost. That helps you spot which investments may lift future income.
- Sort by stock, current dividend, yield, growth, or year-10 dividend forecast
- Each growth rate is marked as historical, override, or fund default
- Year-10 share counts and yield on cost appear only when DRIP is on
Monthly payment calendar
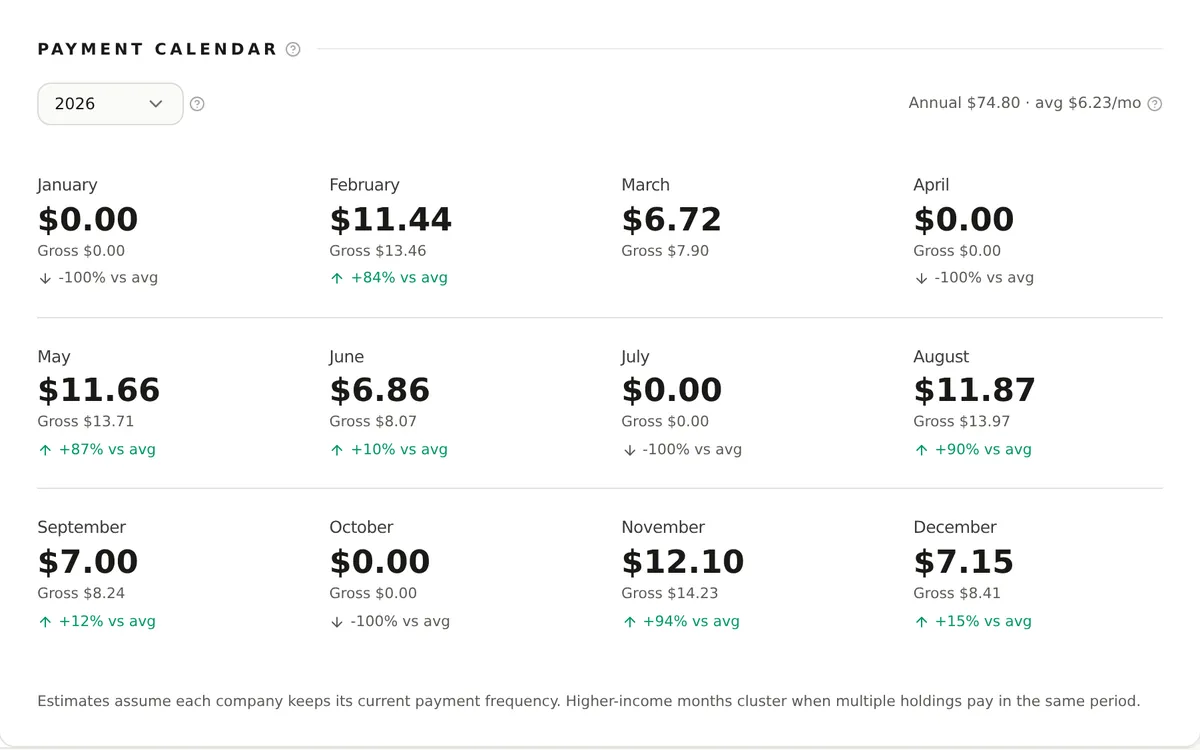
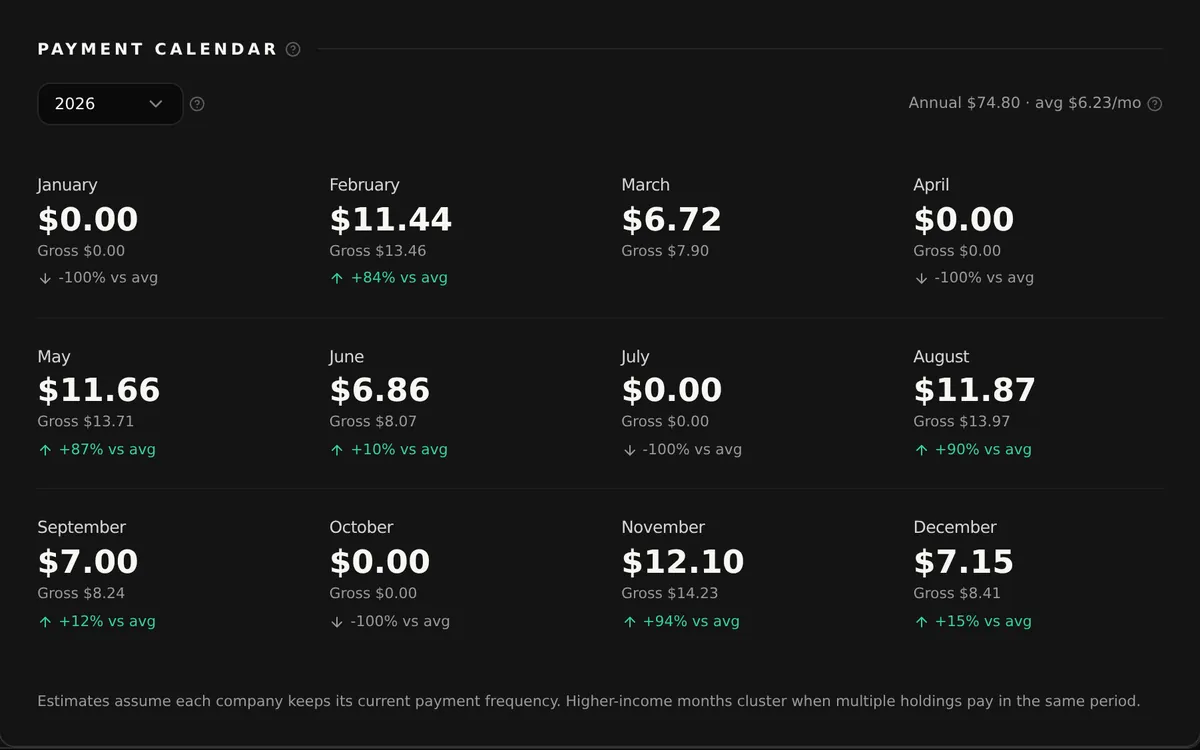
Plan around the months your dividends arrive, with after-tax income for every month of the year.
The payment calendar shows projected monthly dividend income for one forecast year at a time. Each month shows gross and net income after tax, plus the monthly average, so you can spot weaker months before you spend.
- Move between forecast years with ease
- See total yearly income and the monthly average
- Modeled months use payment frequency or historical ex-dividend months
Capabilities
Choose your investments
Start with an existing portfolio, combine portfolios, use an available GNG model portfolio, or create a custom list of tickers and share counts. Manual portfolios and linked brokerage accounts can both work as sources. The setup finds dividend payers and totals the current annual income they make.
- Search by ticker symbol or company name to build a personal list
- Custom share counts let you test different allocation ideas
Set growth assumptions
Each holding starts with its past dividend growth rate. You can set a custom rate from -50% to 20% a year, or reset to the default. Fixed income and money market funds start flat, since their payouts follow rates more than steady growth.
- Holdings marked as held flat keep their dividend per share constant
- Growth rates can differ from one holding to another
Reinvest or take cash
Turn on DRIP to reinvest dividend payments into more shares, or take the cash instead. Compare both paths with the same holdings. Set one tax rate to see gross income and net income over the 10-year forecast.
- You can view both gross income and after-tax income
- Compare DRIP on and DRIP off by running the forecast twice
Review the income forecast
Track predicted dividend income year by year and compare monthly gross and net income. You can run one forecast path or use Monte Carlo mode to see a wider range of outcomes, from the 5th to the 95th percentile.
- Choose how many simulations to run in Monte Carlo mode
- Monthly charts follow the selected forecast year
Track where income comes from
The stock income timeline shows how each holding's share of income changes over time. The monthly dividend schedule allocates holdings to modeled payment months. These are estimates, not confirmed payout dates.
- Current and projected income analysis for stocks
- Income and payment schedule tables are sortable
Check dividend safety
Each holding gets a safety score from 0 to 100 based on payout ratio, dividend growth streak, earnings stability, and debt. Scores of 70 or above are Safe, 40 to 69 are OK, and below 40 are labeled Risk. The tool also shows cut risk and a portfolio average.
- Holdings with too little data show N/A, not a guess
- Use the safety score with your own research on each company
Keep forecast history
All forecasts are saved in your history. You can reopen a forecast, rename it, rerun it with the same settings, or delete it. GNG Analyst can also help explain your setup before you run it or review the result after, if AI access and credits are available.
- Review the assumptions that led to a saved result
- Change one assumption and rerun the forecast to compare results
How it works
Choose investments
Select an existing portfolio or enter custom tickers and share counts. Review which assets pay dividends and their estimated annual income.
Set assumptions
Decide whether to reinvest dividends through DRIP or take the cash, set your tax rate, check each growth rate, and choose whether to use Monte Carlo mode.
Review the forecast
Check the annual and monthly income charts, the holding breakdown, the payment calendar, and each investment's safety score and cut risk.
Open forecast
Open a saved forecast from your history to review it, or rerun it with different growth or reinvestment settings.
Common questions
- What dividend income will my portfolio generate?
- If you choose a portfolio or enter tickers and share counts, the forecaster estimates monthly and yearly dividend income for the next 10 years, with taxes included. Keep in mind that these are only estimates; companies may raise, cut, or stop their dividends.
- How can I forecast monthly dividend income?
- Set DRIP, your tax rate, and each holding's growth rate, then run the forecast. The calendar shows modeled monthly income using payment frequency or historical ex-dividend months, not confirmed payout dates.
- Is it better to reinvest dividends or take the cash?
- It depends on your need for income now. Reinvesting through DRIP buys more shares and may speed up future income, while taking cash gives income right away. You can run both scenarios to compare the result.
- Which plan gives access to the Dividend Forecaster?
- The Dividend Forecaster is in Pro Lite and higher plans. First create a free GNG account, then upgrade to Pro Lite for access. The tool also shows how many forecasts remain in your account.
- Can I adjust the dividend growth rate for each stock?
- Yes. Each holding starts with its history-based dividend growth rate, but you can set a custom rate between -50% and 20% for any asset. Fixed income and money market funds start flat.
- Does the Dividend Forecaster include a safety score for dividends?
- Yes. Each asset gets a score from 0 to 100, based on payout ratio, dividend growth streak, earnings stability, and debt. It labels holdings as Safe, OK, or Risk, and shows estimated cut risk. Assets with too little data are marked N/A.
Create a free GNG account and upgrade to Pro Lite to start forecasting.
Free to join. No credit card. Takes seconds.
Dividend estimates and safety scores are based on current data and your settings. They do not guarantee future results. This is not investment advice.