
While going to many daily meetings, I am constantly listening to trusted YouTube finance shows like the Compound, Creative Planning, and of course coverage of AI (Big Technology, Moon Shots, Mo Gadwat, Azheem Azar, ect) to keep up with the firehose of data, news, and exponential change that is driving the economy and earnings of the future.
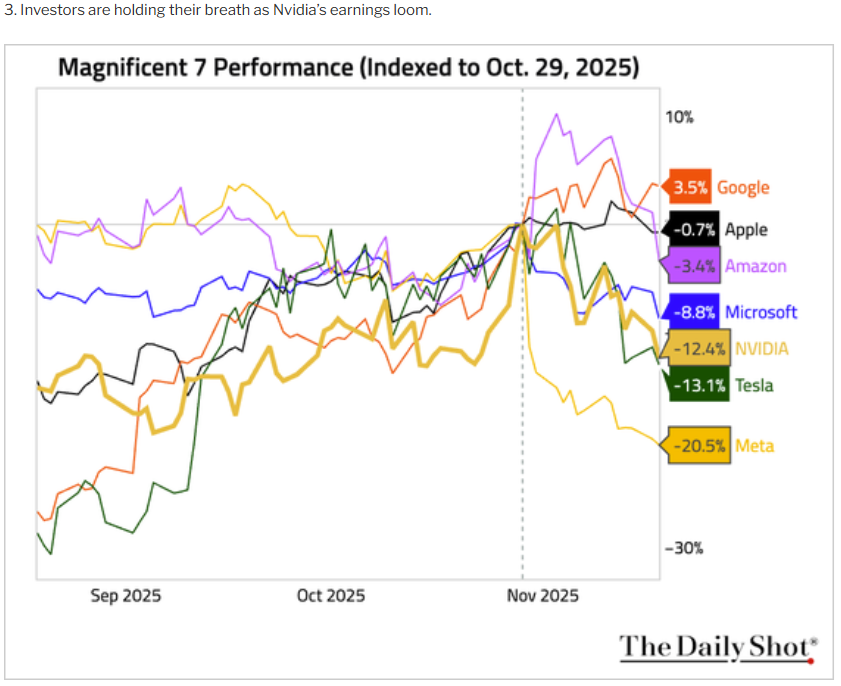
And lately I’ve been tickled by the near panic or outright glee that some in the media are posing about how investors are “getting more skeptical of AI”.
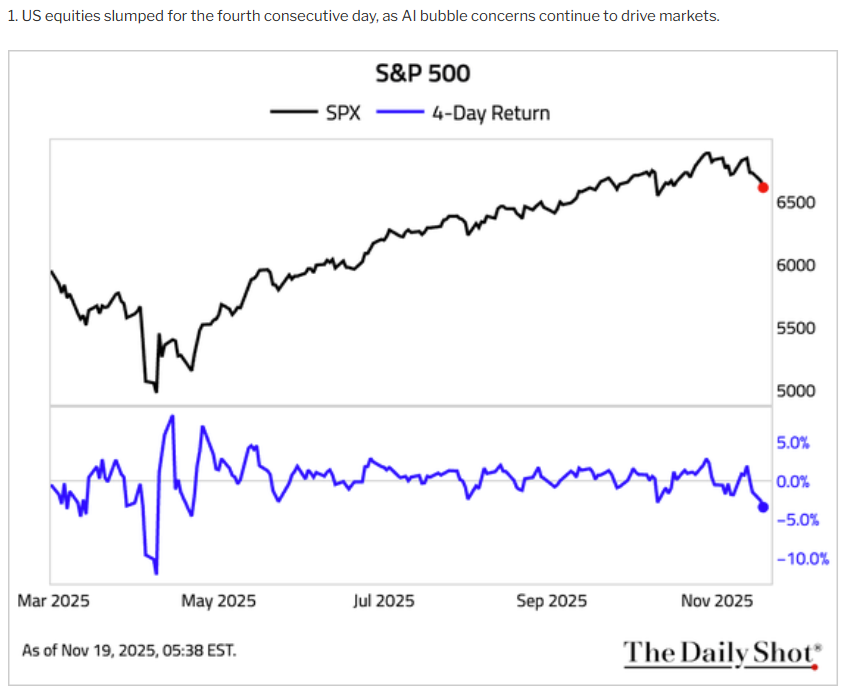
So I wanted to share my thoughts, based on really cool charts I’ve come across, to help fight fear with facts…and context… chart-driven context!
Always And Forever A Market of Stocks, Not A Stock Market
TLDR (Too Long, Didn’t Read)
The economy is strong (and has been strengthening since 2023).
Corporate profits are growing at 15% (this quarter) and expected to grow 14% in 2026 and 13% in 2027 (preliminary 2028 estimates I’ve seen 11%)
GNG’s Chief Equity Strategist, Glenn Ford (He’s our Liz Anne Saunders😉), is forecasting a base-case peak decline of 10.6% within the next month (about 7% further from the Nov 18th close) (his report is coming soon).
Market valuations, earnings growth, and economic growth all support this base case 100%.
THIS IS 100% a regular correction (most likely, but possibly not even that).
And Now The Nerdy Fun! 😂
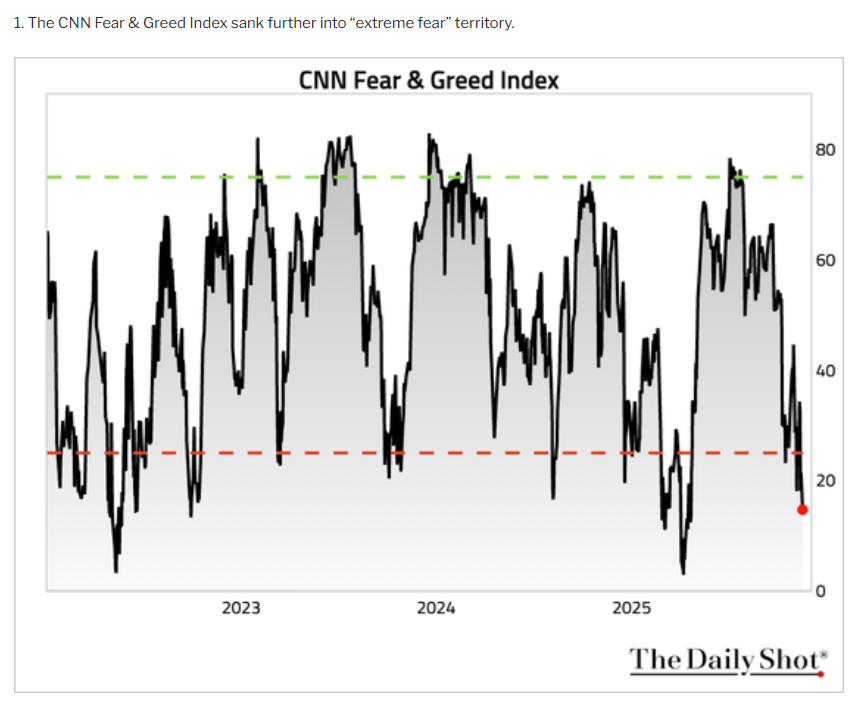
My first reaction when I saw the CNN Fear and Greed index was a knee-jerk "For the love of god, people! Calm the F down! The market is down 4%!" 😂
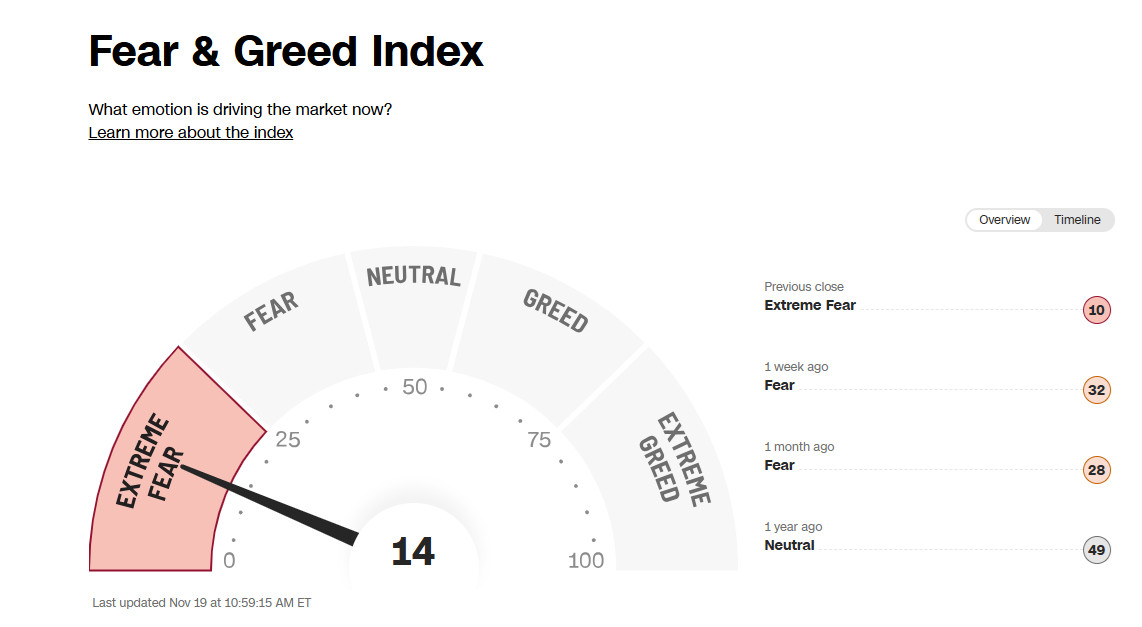
BUT I realize that this is a sign of social media and scary headlines driving us all mad😉 It's not your fault, you're so nervous! You just haven't seen the right charts! That's what I'm here for😂
But seriously, the market was down a peak drawdown of 4% on Nov 18th! 🤣
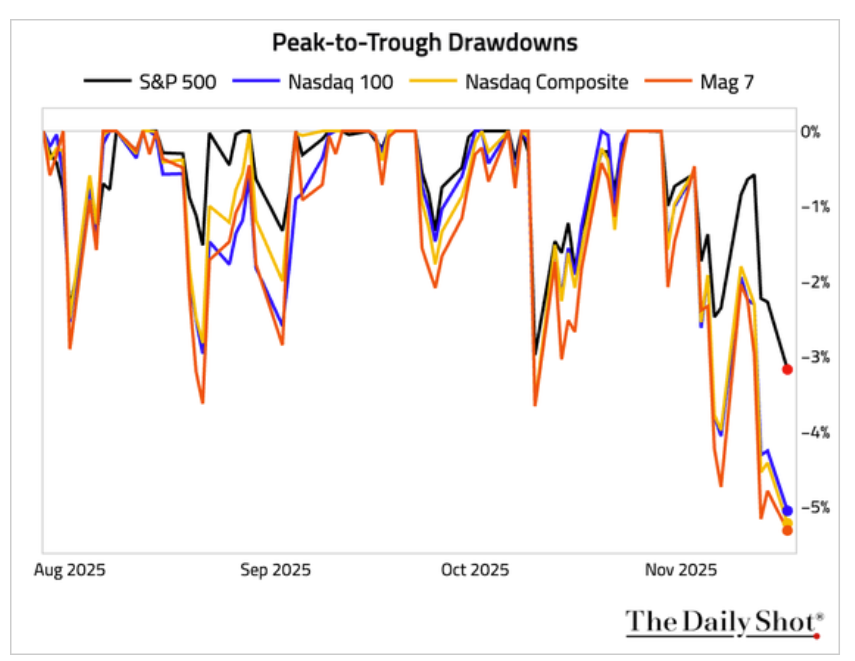
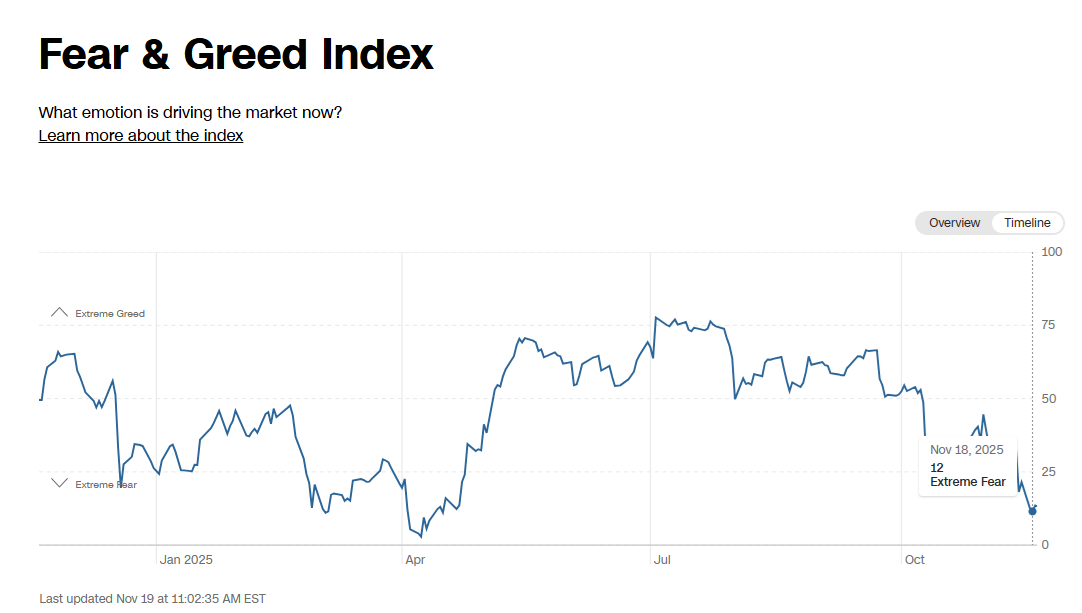
This is what VIX 60 “Greedy When Others Are Fearful” looks like on the Fear & Greed Index
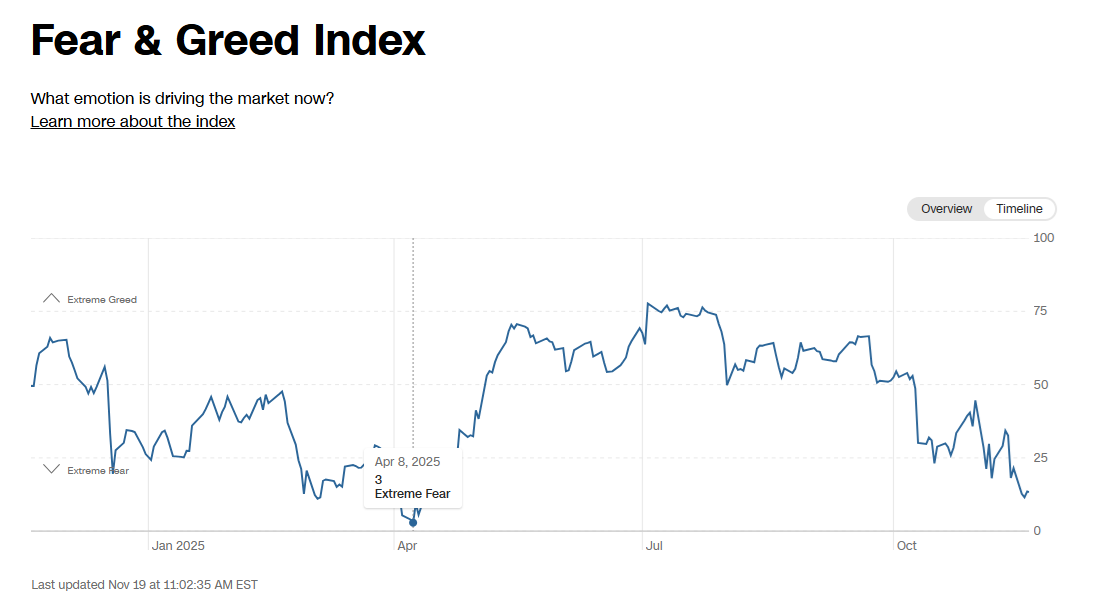
By the way, for those that don’t know what the CNN Fear & Greed Index is, it’s a handy way of gauging FEELINGS and SENTIMENT (but is only useful as a market timing tool at extremes like back in April).
What Is In The CNN Fear & Greed Index (Because I’m A Nerd Who Loves Spreading the Gospel of “Charts Are Sexy And Cool”😂🤣
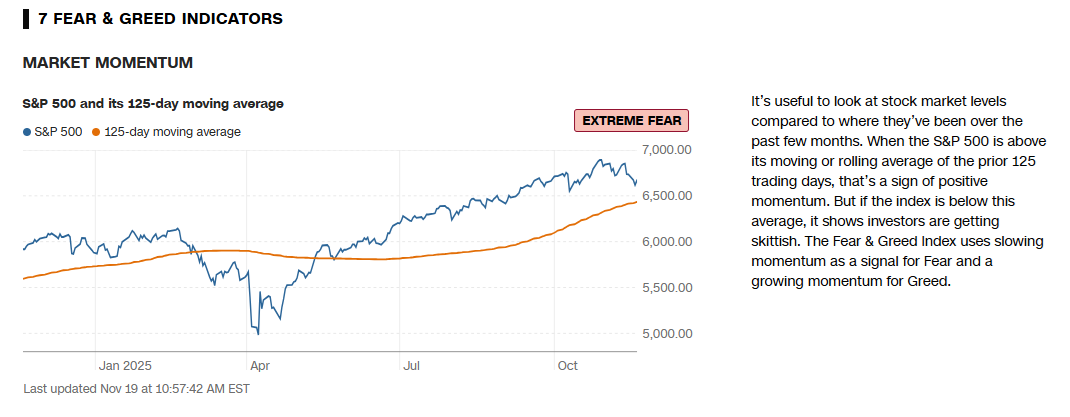
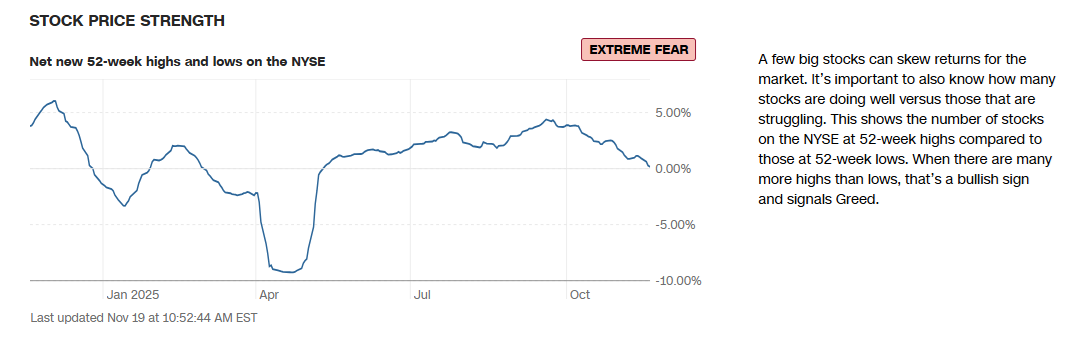
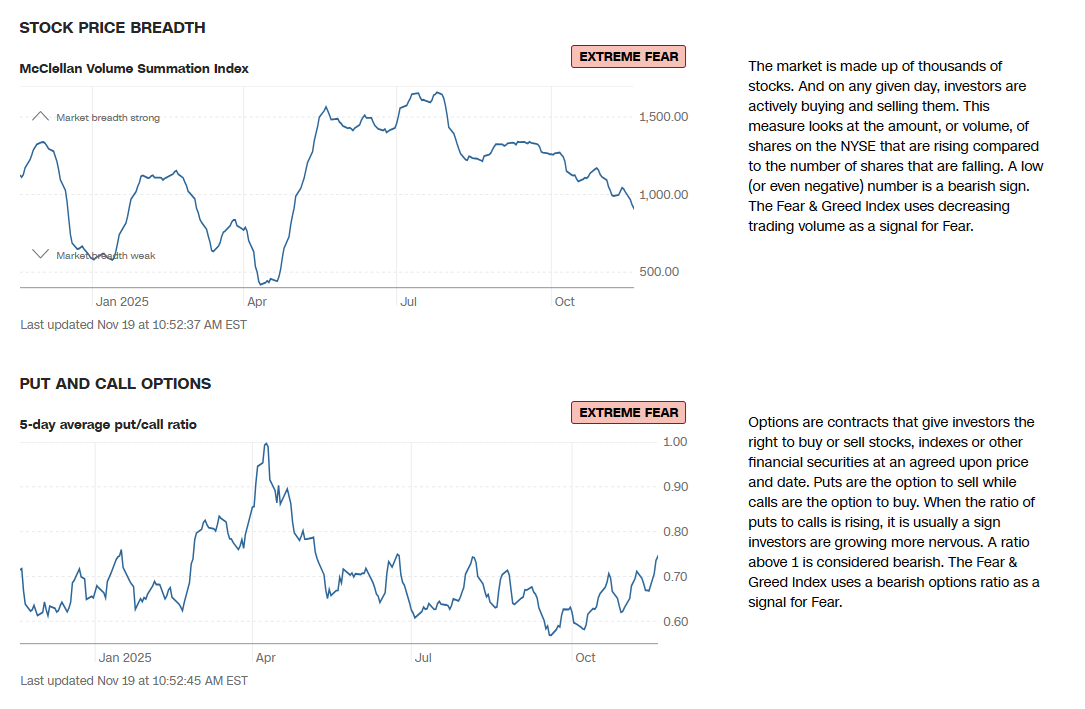
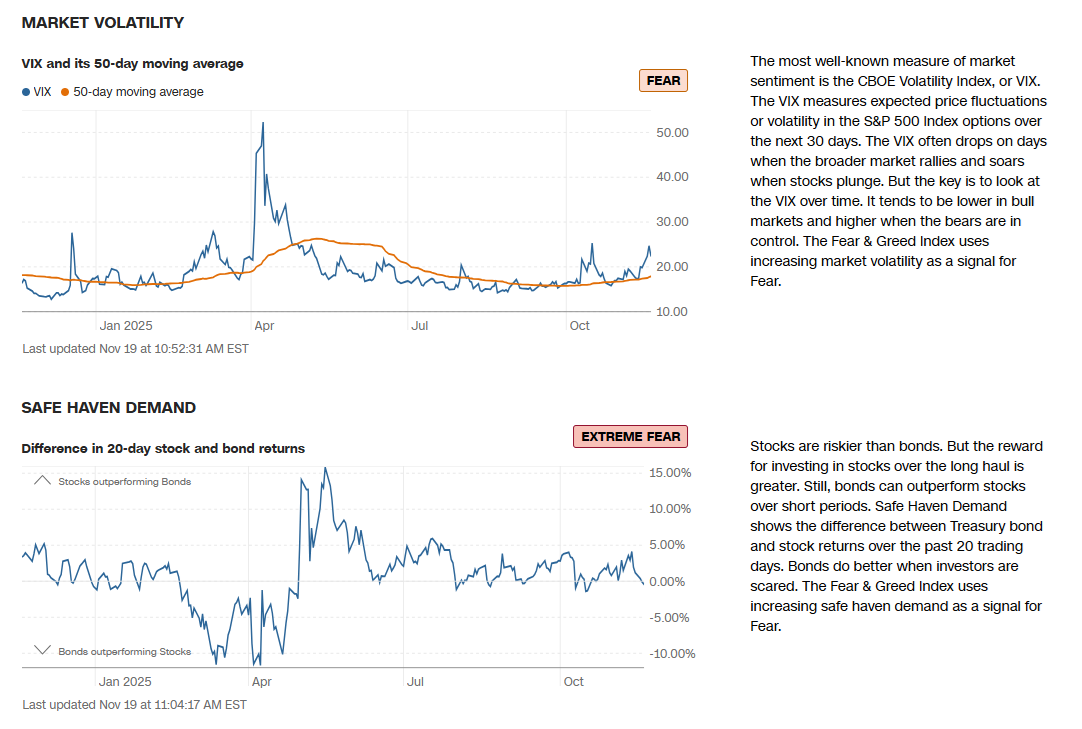
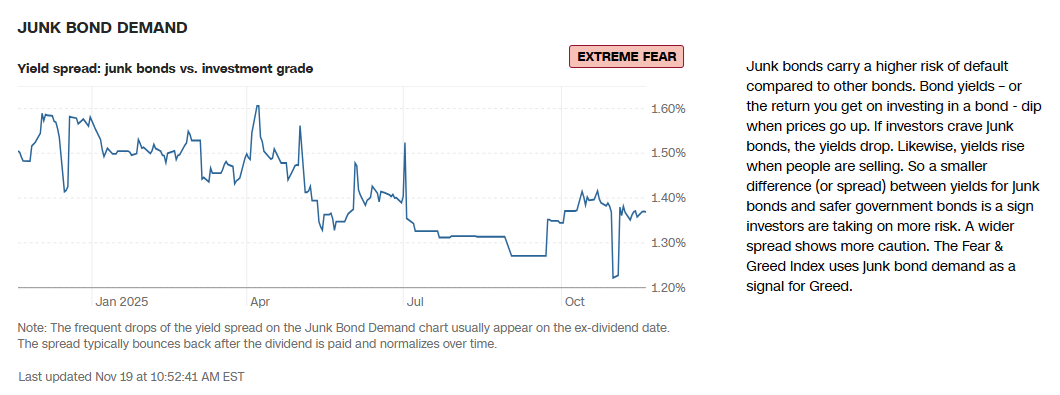
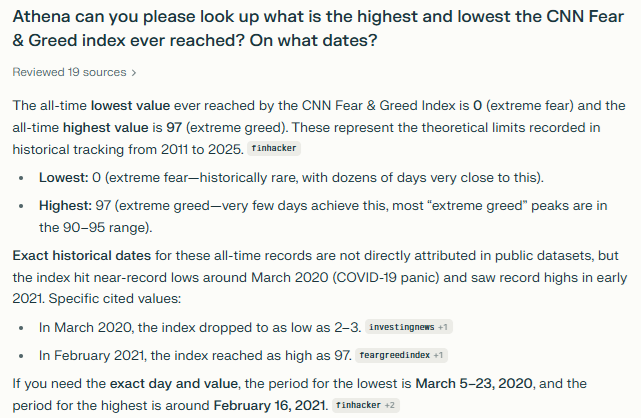
In the Pandemic, we hit zero on the F&G Index, and at the peak of the post-pandemic stimulus mania, 97.
In case any of you play trivia night with your friends.
IT IS SO MUCH FUN!
And the random trivia you learn makes you a better person…I think😂
OK, enough charts, let’s get to the plant-based meat 😉 (yes, I really am this much of a nerd) of the article…which is explaining today’s confusing headlines…with more charts!😂
Fact 1: The AI Boom Is Real, But So Is The AI Bubble!
There is a lot of fear about companies like C
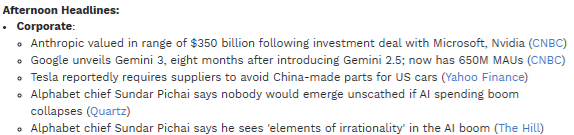
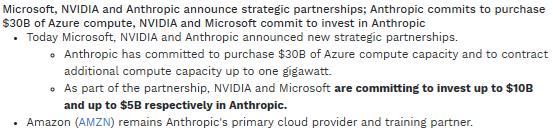
AI Headlines From Nov 18th
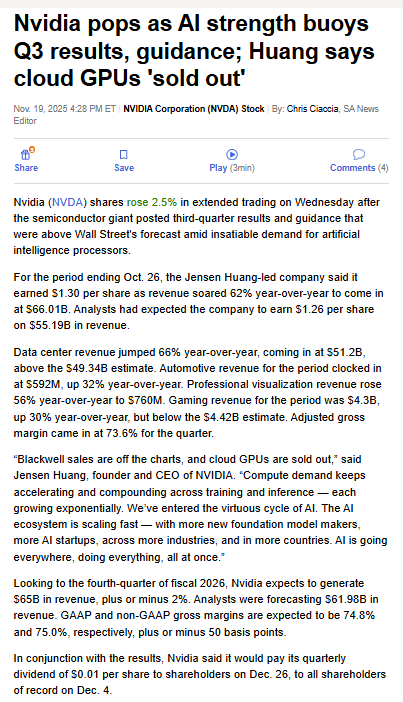
At what point is it OK to start believing Jensen when he makes his “crazy” announcements like “$500 billion in orders through the end of 2026”? Or $3 to $4 trillion in AI spend by 2030? $65 billion in guidance revenue vs $61 billion consensus. Jensen always delivers. At some point, it will become consensus to believe him, and THAT will be when it MIGHT become a bubble😉
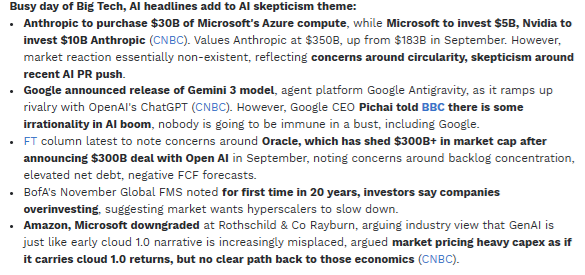
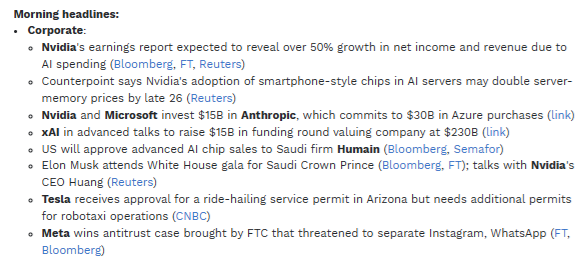
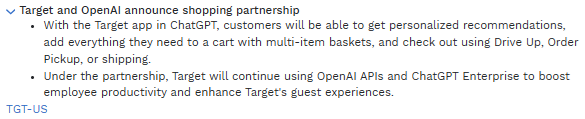
AI Headlines From Nov 19th…Morning Edition! And Only The Business Focused News!
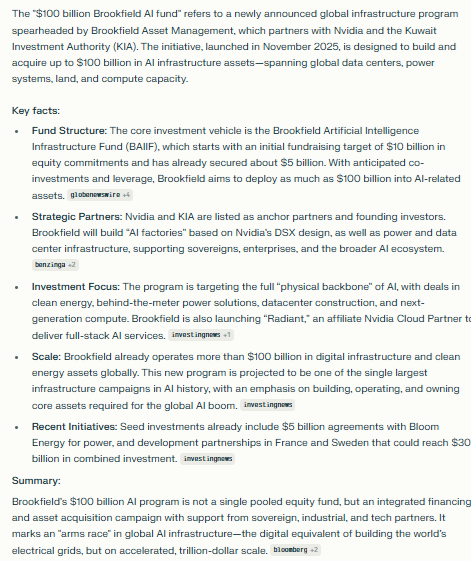
$100 Billion Brookfield AI Fund: Why I Love Owning BAM As An “AI Play” That Pays 3.5% Yield Growing 19% CAGR
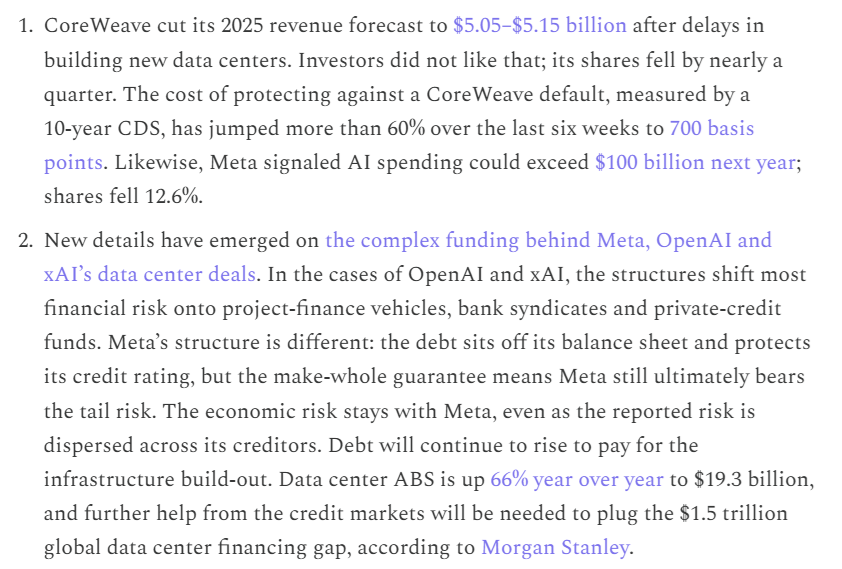
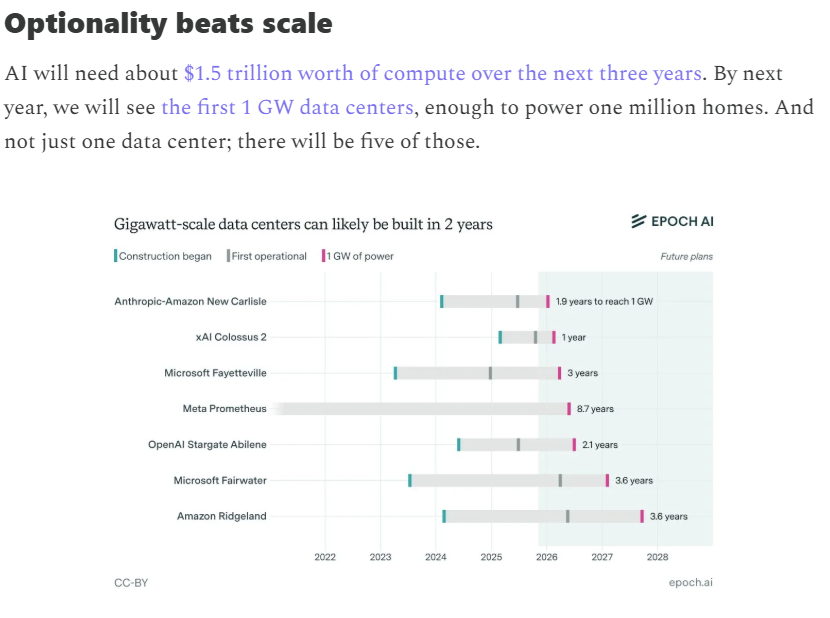
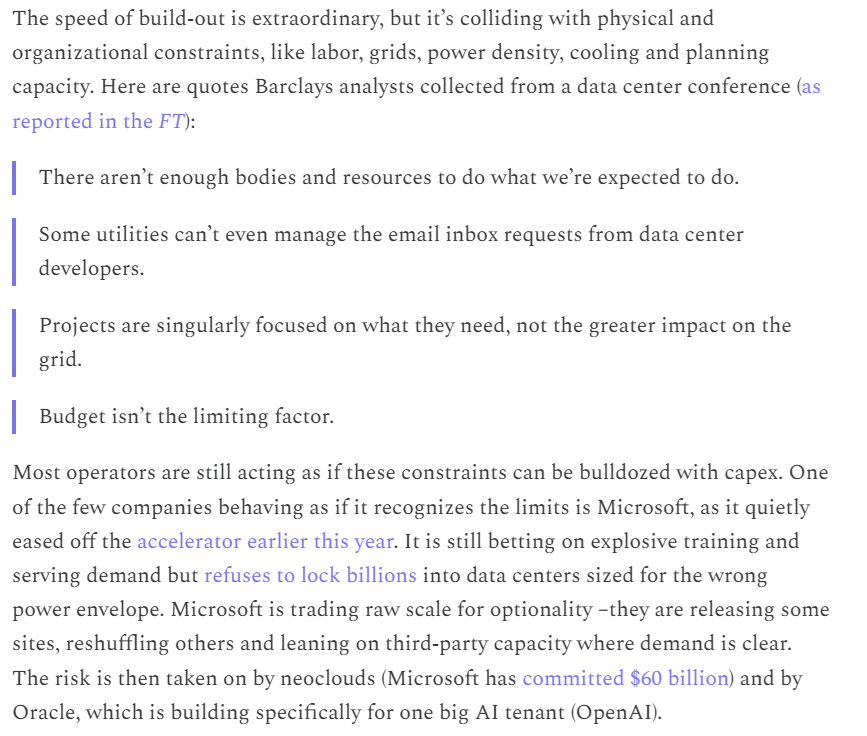
Those headlines about Microsoft cancelling some data centers? It’s not because of a lack of demand but the optionality to build where there is power. Microsoft doesn’t know about the power supply until regulators approve a project, so they need to be nimble. The headlines don’t tell you the key details.
The point is that you will ALWAYS find evidence of mini-bubbles everywhere.
For the Geekiest Amongst You😉
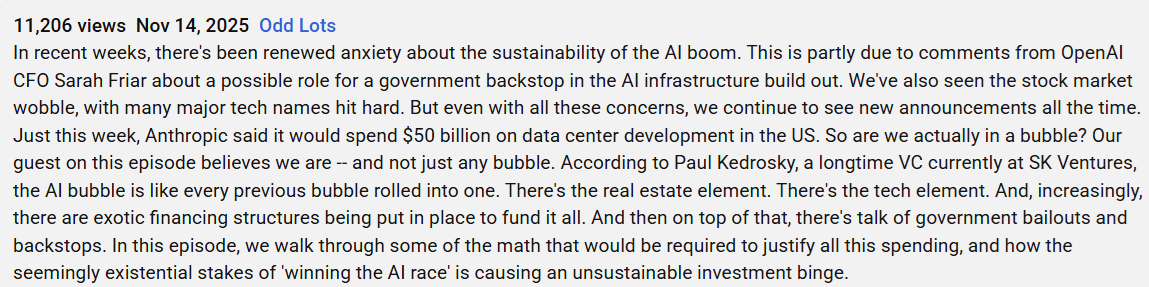
Why Paul Kedrosky Says AI Is Like Every Bubble All Rolled Into One (Bloomberg Odd Lots)
However, it’s important to remember that just like about 33% of the S&P was in a bear market very recently (a market of stocks, not a stock market), the presence of mini-bubbles doesn’t mean that all of AI is a tech bubble, like risk that is going to blow up the economy.
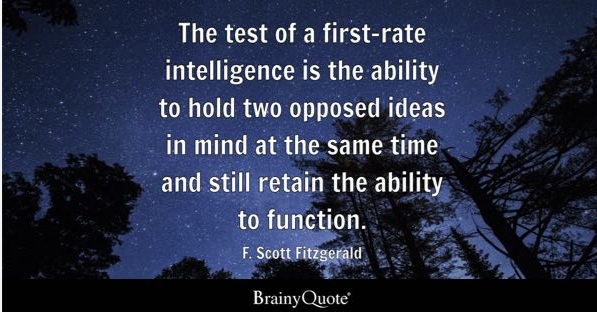
Fact 2: The Depreciation Debate…Why This Time Might Really Be Different (For Some Companies And Disastrous For Others)
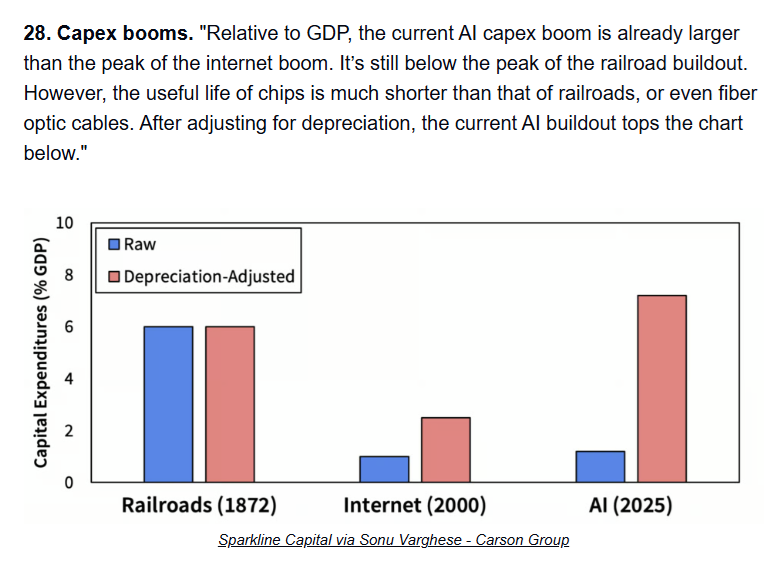
Adjusted for depreciation, we’re already at the largest infrastructure boom in history. That makes many investors (and people in general) understandably nervous.
The odd lots podcast made several very interesting points about the depreciation debate, which is terrible news for Core Weave.
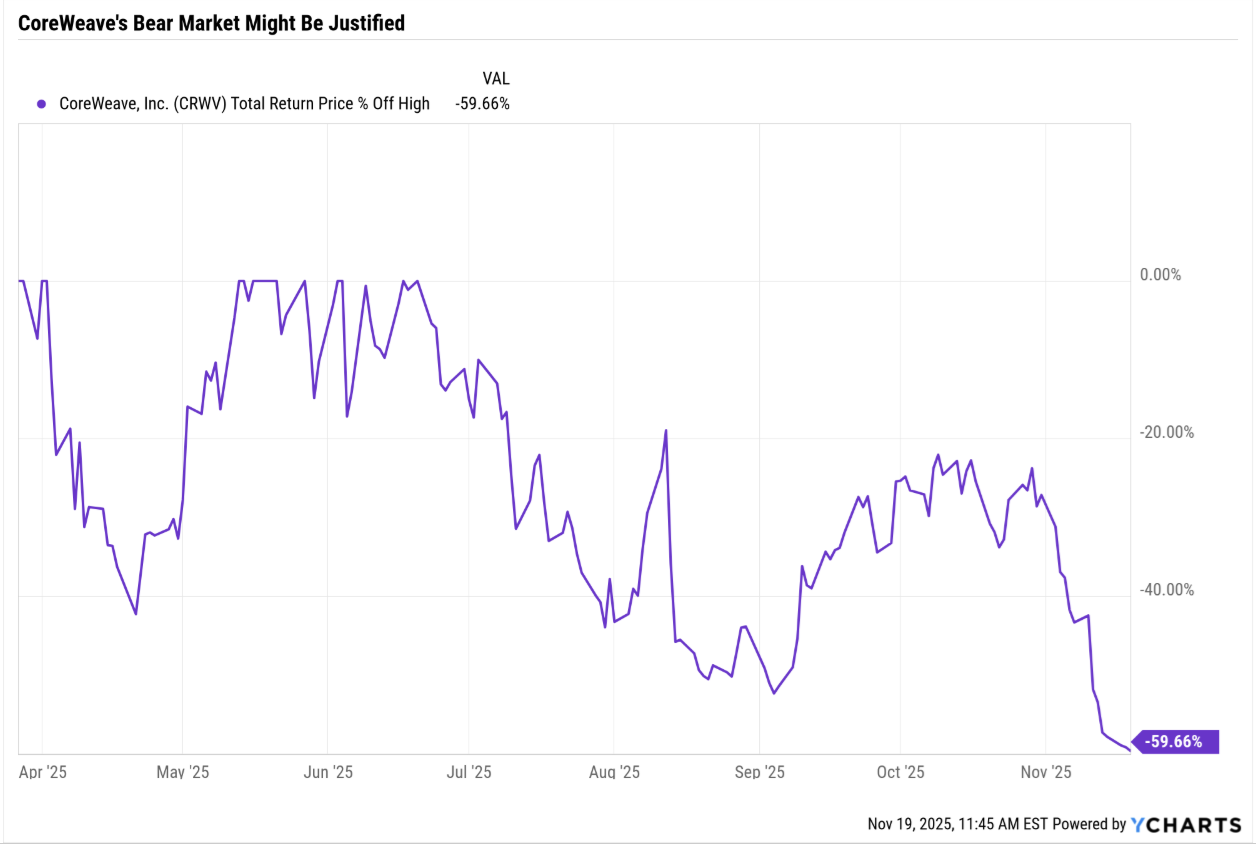
Let’s use CoreWeave as the poster child of the speculative AI bubble that does exist.
Its entire business model is to buy GPUs and then rent them out. It’s kind of like WeWork, which rents out (short-term leases) office space, and then pretends it is a world-changing tech company😉
Except that in the case of CoreWeave-WeWork, it’s like new offices are being built every year that are 4X more profitable in terms of revenue per square foot generated by the tenant.
So what does that mean for CoreWeave? The 18-month depreciation schedule mentioned by Michael Burry is likely correct.
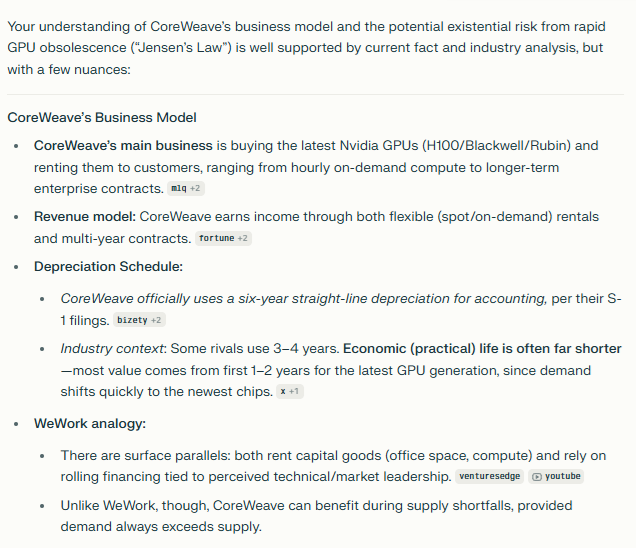
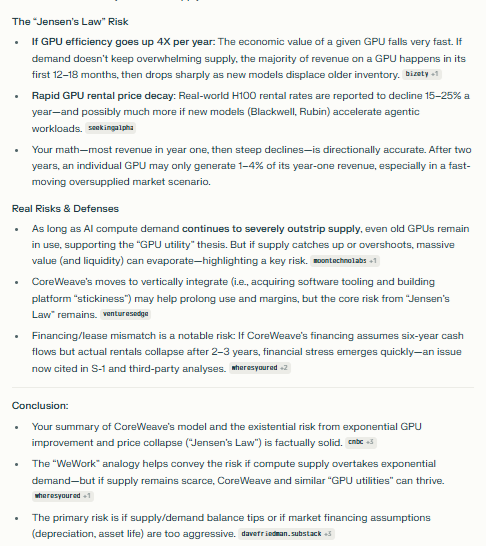
If CoreWeave’s business is renting out individual GPUs, meaning clients are booking BlackWell, Hopper, or Rubin GPUs (coming next year), then Jensen’s law poses an existential threat to CoreWeave.
And here’s why.
Because CoreWeave’s entire business hinges on there being a backlog of compute demand. Suppose there is always more demand than supply. In that case, people will need to rent ANY AND ALL compute capacity, and CoreWeave’s business of renting out BlackWell or Hopper’s individually, that’s viable.
BUT if the GPUs get 4X better each year? Then that means about 80% of the revenue will come from year one. And the next year prices will fall 80%, and the following year 80% more. In other words, after 2 years, a Hopper GPU CoreWeave that is renting out will be generating 4% of the revenue it was in year one, and by year 4, just 1%.
Basic CoreWeave Business Model (Simplified)
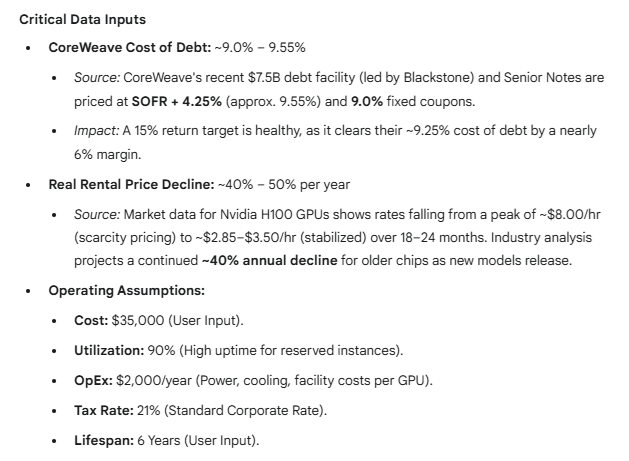
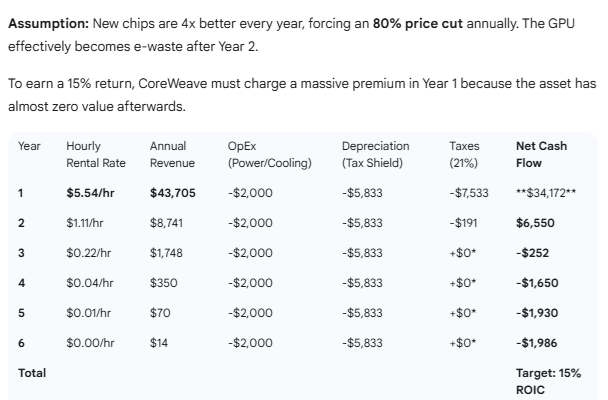
This is a simplified model, but you can see that over 6 years, CoreWeave could generate $54,628 in revenue from a $35,000 GPU. That’s a 56% return, BUT when you factor in the costs of operating those chips, paying workers, AND paying taxes (the only certainty is death and taxes, and in the Age of AI, we can’t be certain about that first one😉).
But you can see how, using these assumptions, CoreWeave should stop operating GPUs after just 2 years. Anything beyond that is actually losing money.
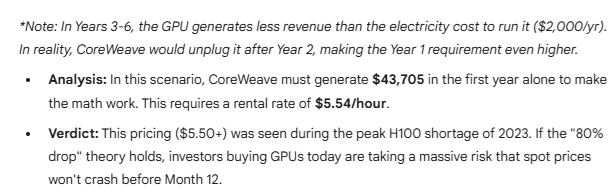
Ok, but what about CoreWeave’s actual economics? Can the “magic” of Gemini 3 Pro shed light on how CoreWeave actually runs?
CoreWeave’s Historical Model So Far
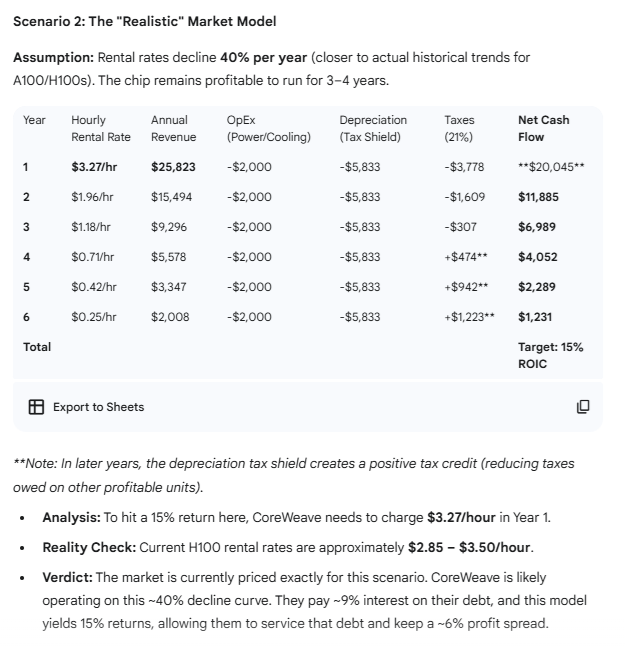
Now we have only one upgrade cycle between Ampere and Hopper GPUs (A100s to H100s), but as you can see, the rental rate has SO FAR fallen by 40% per year.
That makes sense since the world is so compute-starved that even though 4X better chips are coming out each year, implying an 80% decline in rental prices, CoreWeave is still able to command 40% of last year’s pricing because a Hopper 100 is still helpful today and even an Ampere 100 GPU is still useful.
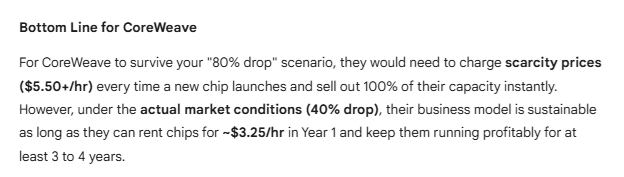
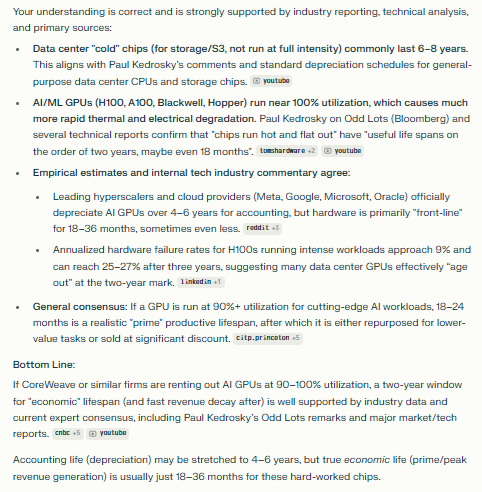
The problem for CoreWeave may be that the GPUs they rent are running near 100% of the time. And while 6 years for S3 data center chips is reasonable (according to Bloomberg Odd Lot’s Paul Kedrosky, chips that are run near 100% of the time last 18 to 24 months.
And What The FactSet Consensus Expects (Good News, Kind Of)
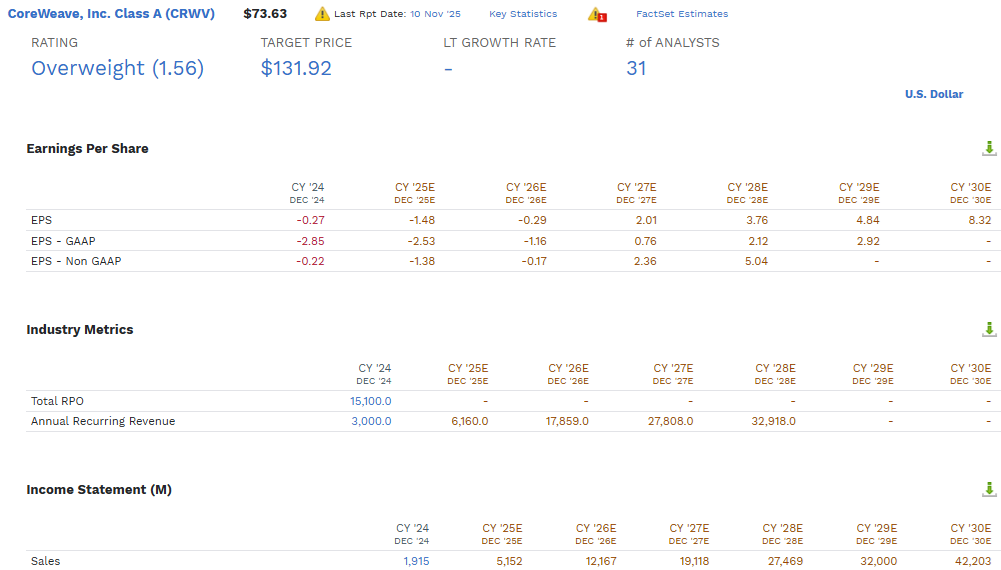
The good news for CoreWeave investors is that the company is expected to become profitable in 2027.
If everything goes to plan.
What Michael Burry is saying is that the company is lying about these GPUs being useful for 6 years, because no GPU can run at 100% for that long. So they will have to take huge write-downs that will wipe out profits and push break-even even further.
If CoreWeave Can Survive To The End of 2028, it will be Free Cash Flow Profitable
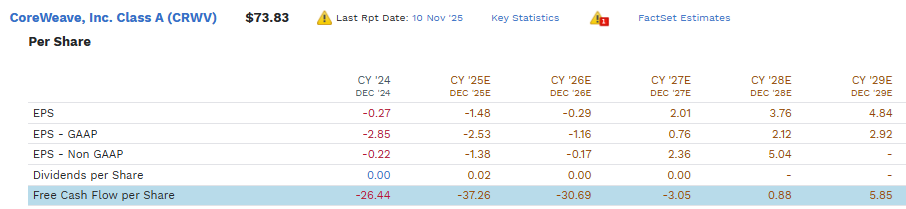
Depreciation doesn’t affect free cash flow, so IF everything that analysts expect (based on management guidance and their own research) happens, THEN 2028 CoreWeave should be safe, at least from going bankrupt.
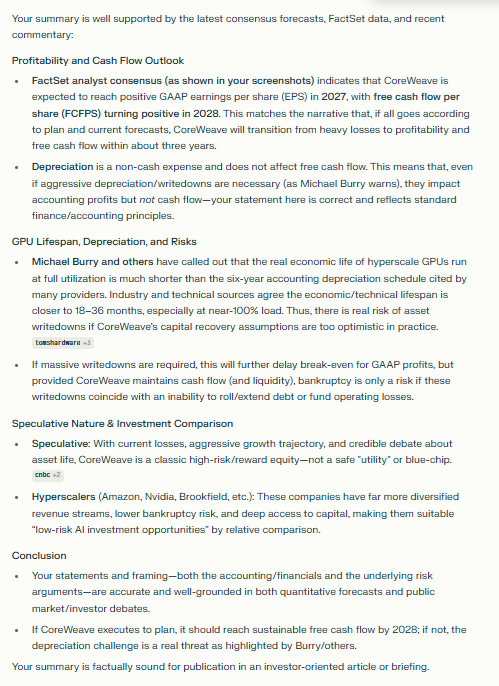
Until then? Well, that’s why its a speculative company that I personally have no interest in.
I’m sticking to hyperscalers like Amazon, Nvidia, and Brookfield as my low-risk AI investment opportunities.
What About The HyperScalers! Are They Screwed? Are They Committing Fraud?
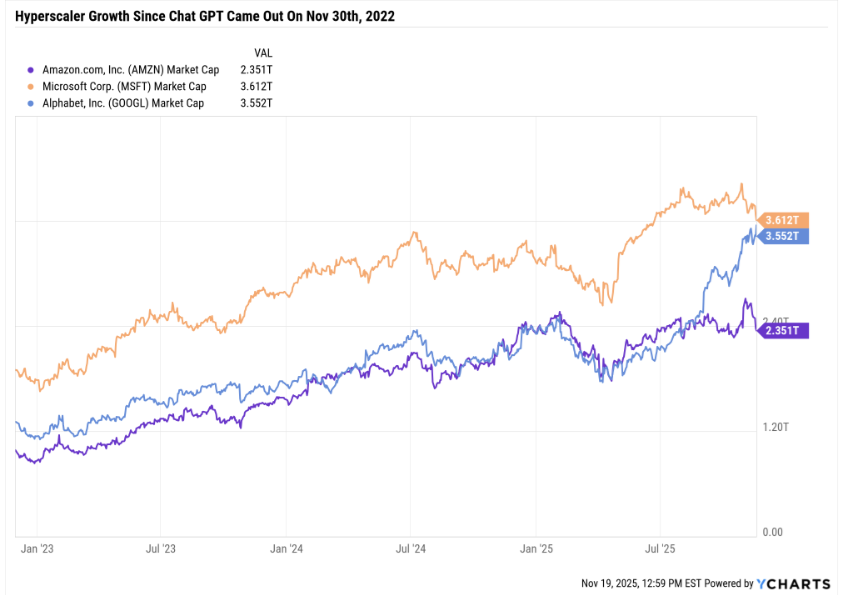
OK, so what about Microsoft, Amazon, and Alphabet? They have reported exceptional growth since ChatGPT launched on Nov 30th (the 3-year anniversary is coming soon!).
Are they committing accounting fraud?
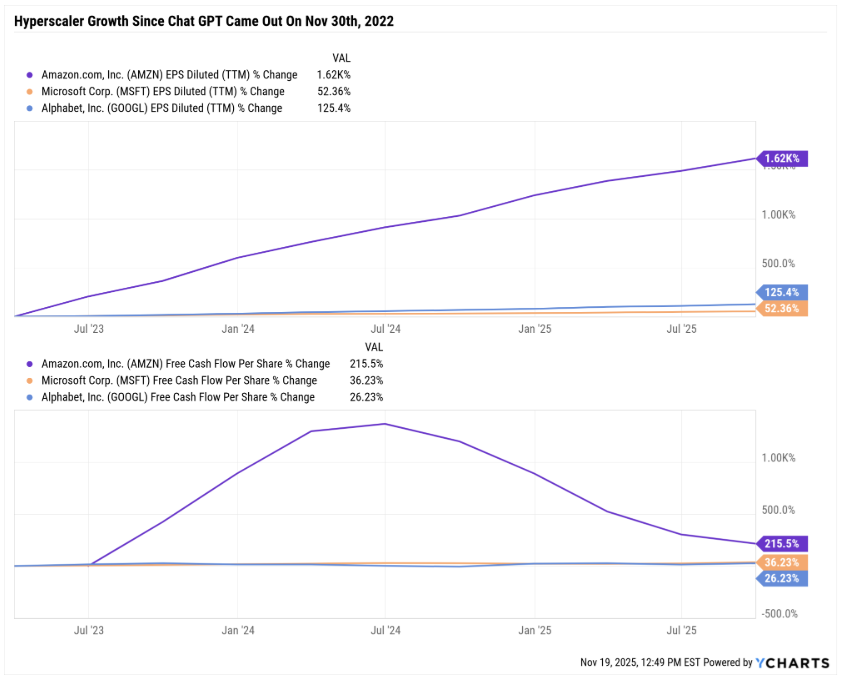
Free cash flow isn’t affected by depreciation, so we can see that growth has been good, but not as good as earnings growth alone would suggest.
BUT is this fraud?
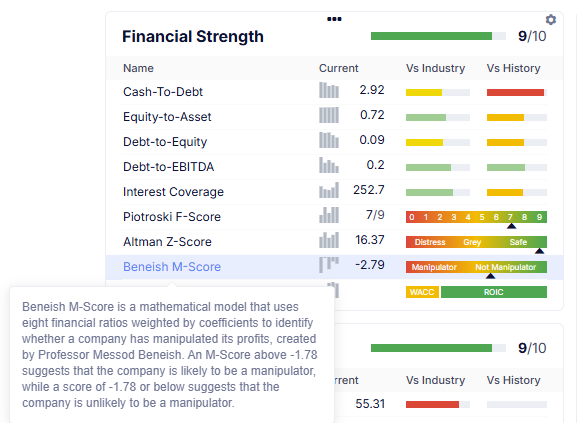
These are audited results filed with the SEC, and if they were actually fraudulent, not only would we see it in the Beneish M-scores, but the CEOs of these companies would go to prison.
Microsoft M-Score
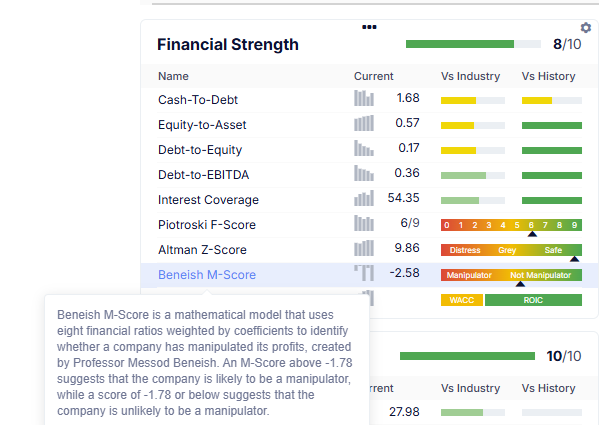
Amazon M-Score
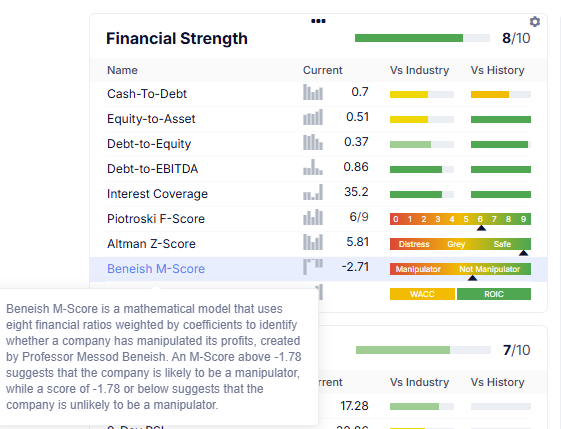
Alphabet M-Score
Let’s also not forget that we’re at the end of year 3 of the AI Boom. CoreWeave has been around as a public company for less than 2 years. There is a lot of impairment charge/writedown risk with them.
The cloud giants? If Michael Burry was right and they were overstating their earnings? The auditors, accountants, and regulators would have pointed it out.
Also, let’s remember that Michael Burry himself has stated that he estimates hyperscalers are improperly using depreciation to overstate earnings by around $180 billion over 3 years.
That’s $60 billion per year, which, at a forward PE of 30 (the historical fair value norm for the Mag 7 per Morningstar), is $1.8 trillion in market cap.
I’ve seen some claims that “The market value of some of these stocks could fall as much as 40% in a day if they are forced to change depreciation from 5 years to 3 years”.
Actually $1.8 trillion vs a $9.5 trillion market cap is 19%, not 40%, or even 75% as might be assumed by depreciation going from 6 years to 1.5.
According to Michael Burry’s Estimates, HyperScalers MIGHT Be Facing A 19% Haircut
Remember, free cash flow is not affected by depreciation, so unless big tech is literally cooking the books about FCF (and that is a severe legal claim that not even Burry is making), depreciation is not a big risk to the hyperscalers.
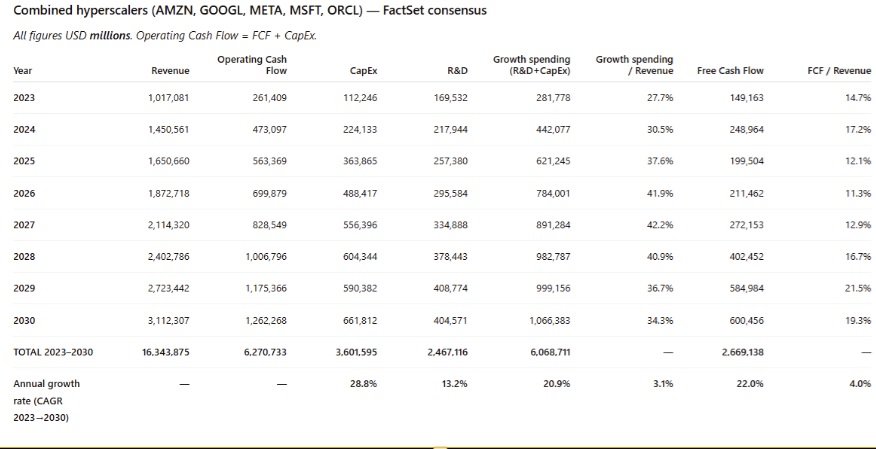
The free cash flow is expected to grow at 22% CAGR (up from 18% last quarter) through 2030, and including buybacks, that 23% to 24%.
And remember that hyperscalers are beating expectations quarter after quarter.
So, no, investors in MSFT, GOOGL, or AMZN don’t likely have to worry about an Enron-like fraud.
CoreWeave investors? You are betting 100% of the company’s value that the AI boom will last through 2028 and the supply of compute will remain below demand (the data supports this).
But what if Nvidia were able to move to a 6-month refresh cycle (say, using AGI) or ASI allowed it to move to a 3-month refresh cycle? CoreWeave would go bankrupt trying to buy enough chips. Because the actual depreciation on CoreWeave is around 24 months today and that would fall to 6 months in such a scenario.
CoreWeave is a company that can’t survive if tech accelerates, which is why I don’t own it; I do own Nvidia.

FactCheck: Because My ZEUS Family Can’t Afford For Me To Be Wrong
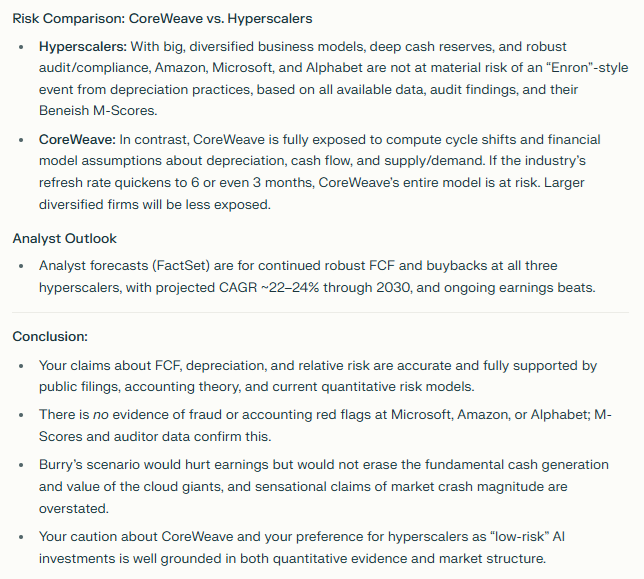
Don’t forget that even if OpenAI were to grow itself into bankruptcy by taking on hundreds of billions in debt, Microsoft would likely buy it for pennies on the dollar.
Even if they weren’t allowed to buy the models, they could purchase the datacenters, which is what they really want and need.
ChatGPT would not go away; the products and services would still operate, they would simply be run by someone else (most likely a hyperscaler).
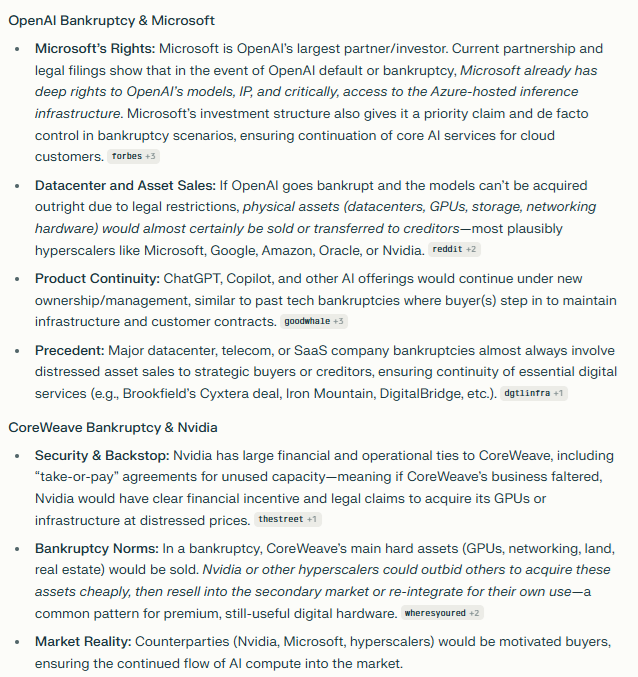
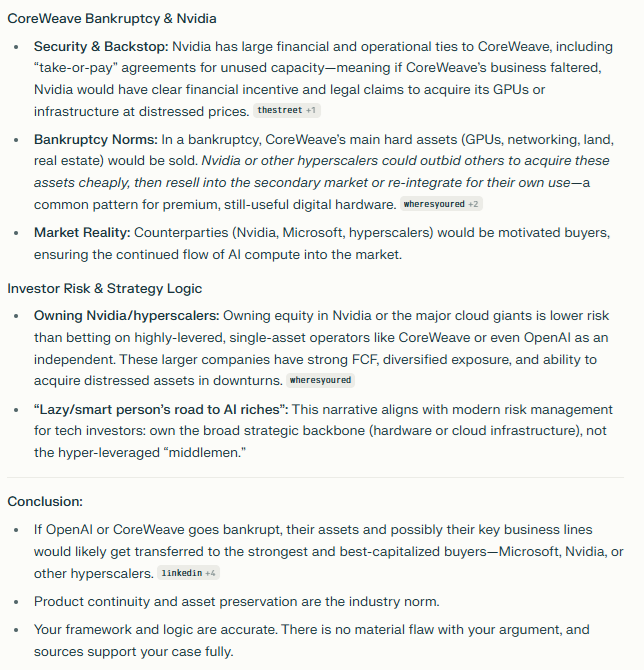
CoreWeave Going Bankrupt? Nvidia would likely buy it out of bankruptcy to get access to the chips, which could be sold at a rich profit (because they pay pennies on the dollar and then resell for a deep discount but still at a multi-X markup).
Do you own Nvidia? A Hyperscaler? You are “Playing” AI in a low-risk, free cash flow-rich manner, what I call “The lazy/smart person’s road to AI riches”🤣
Fact 3: Corrections In Any Given Year Are The Norm
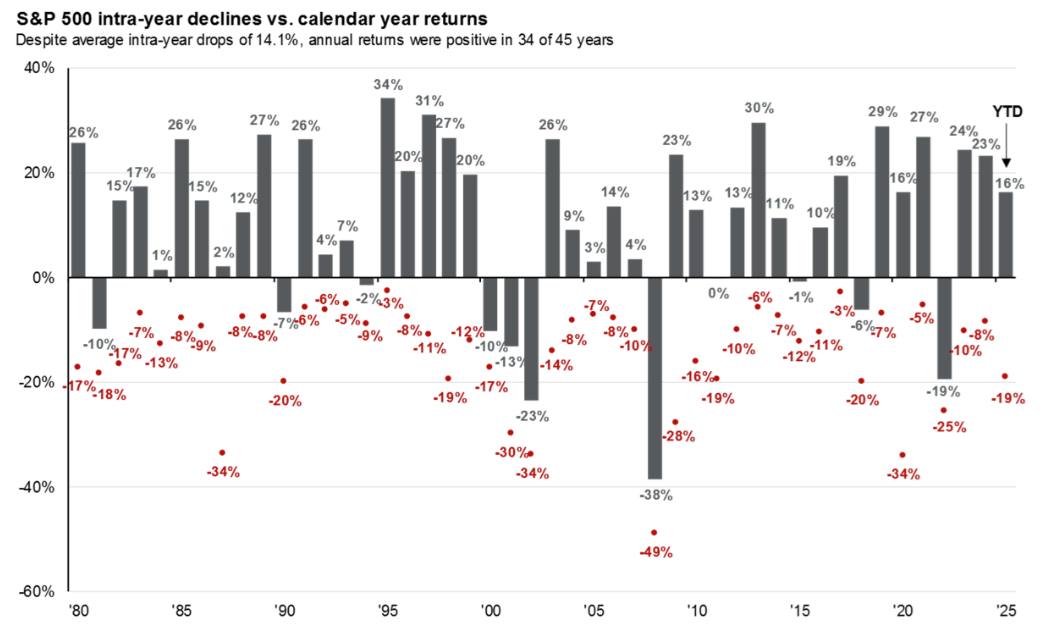
A 14% correction in any given year is the norm since 1980. It’s not a growth scare, it’s not a sign of impending recession, even a 15% decline is par for the course, the “price of admission” into the high volatility world of stocks.
Did you know that the average up or down in the S&P since 1990 is 1.6% on any given day?
The average 20X VIX = 1.6% up or down = completely random “noise”.
If stocks are down 1.6% or less? That’s normal. There is no reason to even search for a story, narrative, or bit of news about why stocks are down 1.6% or less on any given day.
According to Charles Schwab’s Chief Equity Strategist Liz Anne Saunders, if GDP growth is above 2% and stable or accelerating, then we are NOT in a growth scare environment and a 10% to 15% correction is unlikely to become a 15% to 20% correction.
And according to Tom Lee, of Fundstrat, as long as economic growth isn’t negative, every correction is a V-shaped recovery.
1.4X to 1.7X (avg 1.55X) recovery time.
2 months of decline to trough = 3 months from trough to new record highs.
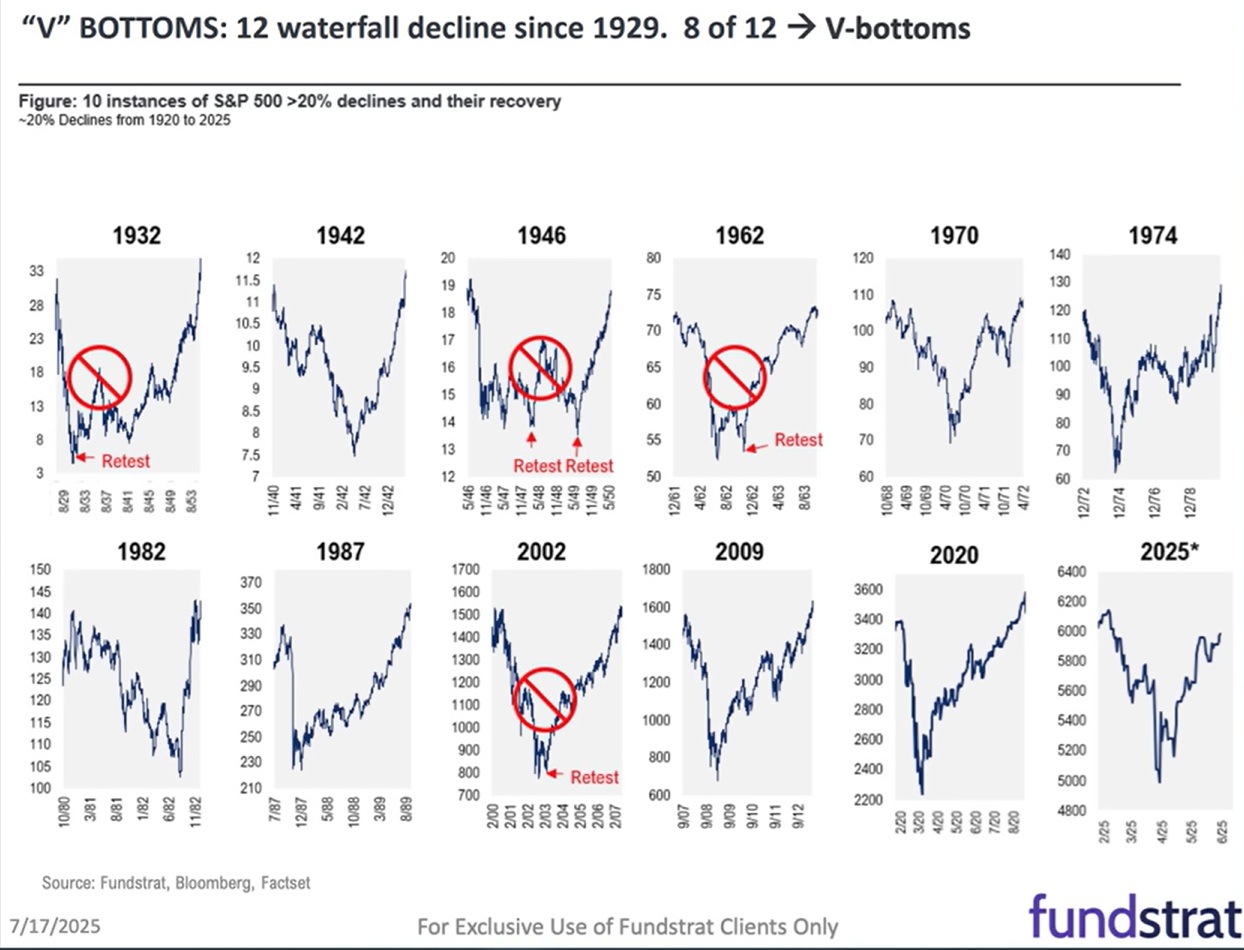
So let’s take a look at the economic fundamentals.
Fact 4: The Economic Fundamentals Don’t Justify A 15% to 20% Growth Scare Correction
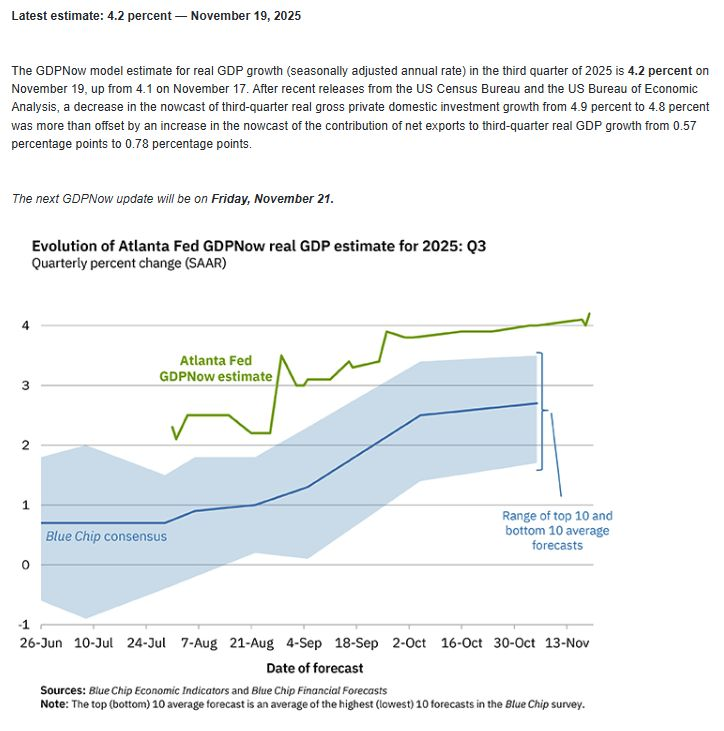
Note how economists have been racing to increase growth estimates to nearly 3%. For the first 9 months of the year, they were expecting growth to slow. And instead it’s been accelerating.
AI boom (growth spending) = corporate profit boom (growth spending begets growth).
Stock market boom = wealth effect (Rich people spending profits or borrowing against assets at record highs).
25% of consumer spending is by retirees (record wealth due to stock market gains + housing wealth)
So AI growth spending = more growth in profits = stock market gains = more AI growth spending = “Richistani AI Wealth Flywheel”
Don’t overthink it…this is the “Story” that explains the objective real-world data.
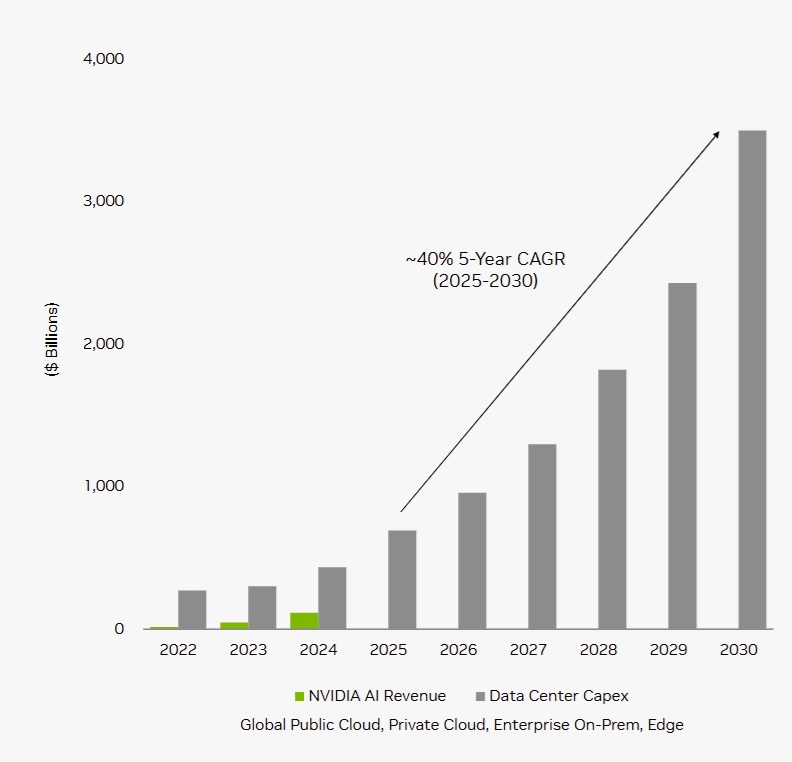
Citigroup AI Spending Effects Through 2030
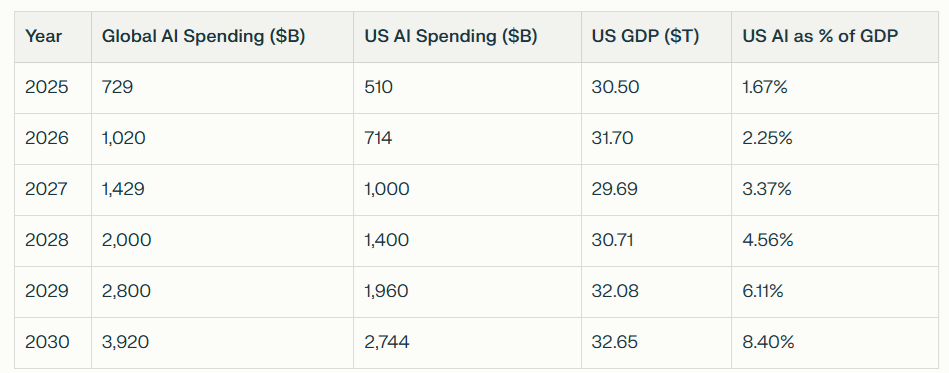
The US growth rate will accelerate if AI spending matches Citigroup, Morgan Stanley, IDC, and Nvidia's expectations.
Economists are not willing to plug in these rather obvious stimulus figures into their models…because it makes them seem crazy😉
BUT In Q2, Atlanta Fed Nailed It (No Matter How “Crazy” They Seemed😉
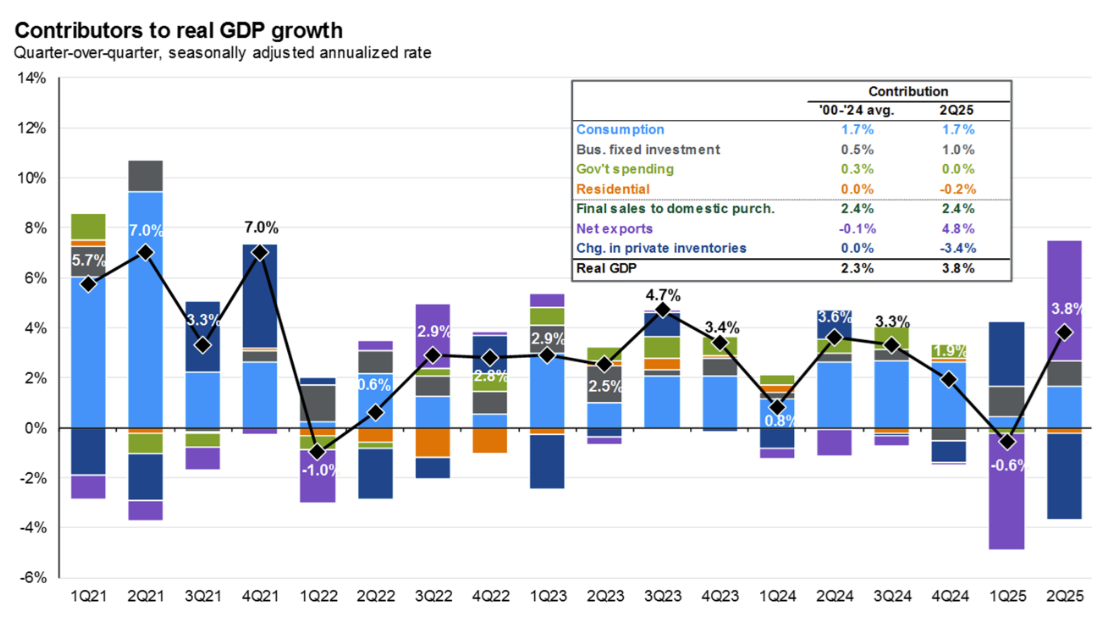
Economists were so worried about tariffs in Q2 that no one dared look at the actual first-principles data and report what was most likely to happen (except the Atlanta Fed).
Imagine forecasting 4% growth, and it comes in 1% or less? You’d lose your job! Best to just call it safe, and predict “we’re on the verge of recession!” as Moody’s Chief Economist Mark Zandi did (on a LOT of podcasts and media appearances) before the data came out, proved his model wrong, and he admitted recession risk was a lot lower.
I respect any person who admits when they are wrong.
I have been wrong before, and will be wrong a lot in the future, that’s what it means to be alive.
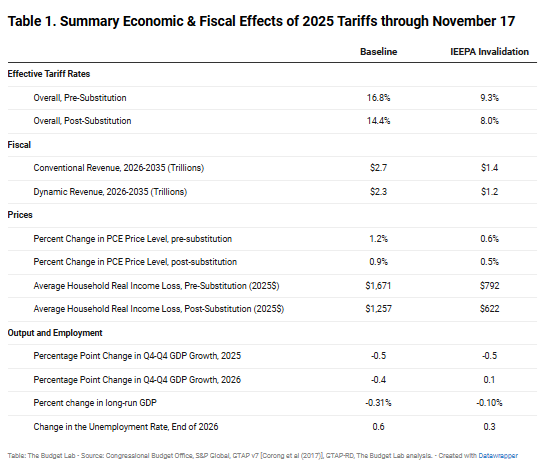
According to the Yale Budget Lab, if the Supreme Court strikes down the tariffs, that’s another 0.6% boost to the economy relative to current baseline rates.
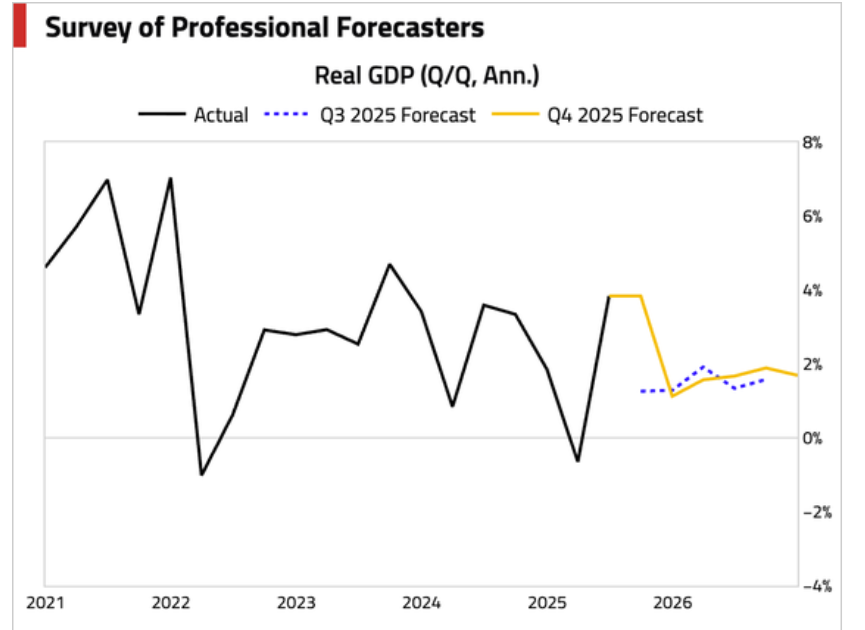
The consensus is playing it safe even in 2027, despite Goldman expecting a 0.15% boost from productivity (as high as 0.2%, though we’ve already seen 1.3% productivity-boost estimates for LAST YEAR from the St. Louis Fed).
Only 2% growth in 2027? Citigroup estimates a 3.4% boost from AI spending. And economists REALLY believe “just” 2% growth? I consider this a “Canadian style Chart beef” I have with my peers.
A very polite, very civilized disagreement that involves dueling charts.
No name-calling, because that wouldn’t be very Canadian, would it😂
I have an unprovable hypothesis: everyone knows growth will be above 2%, but is too afraid to say it.
What’s the harm in saying 2% when we know it will be 3% to 4%?
It’s dishonest and if GNG members know what our models REALLY say, then they are less likely to panic sell if next year’s correction comes with scary headlines.
GNG’s Current Economic Model Through 2030
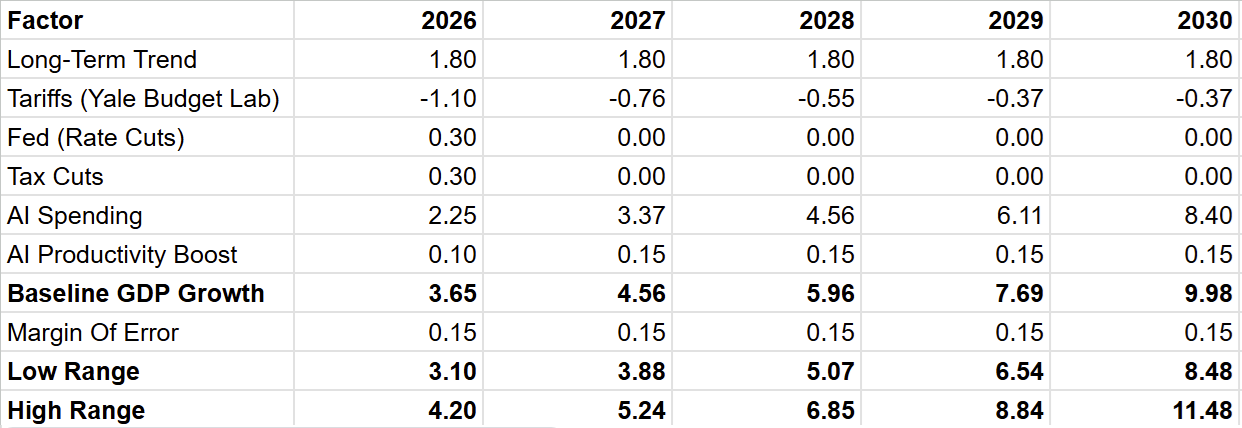
I'm the only economist with the job security to say the GDP growth is going to be significantly higher than 2% in 2030😉
Do I REALLY believe we’ll see 10% GDP growth in 2030? I’m not mentally capable of accepting my own math. BUT if the growth is 10%? Then I’ll take credit for sharing this table and admit that I should have believed my own math better😂😉🤣
It’s like fundamentally justified return potential.
If it happens? You’ll know why. If it doesn’t work well, it’s just that its potential isn’t. It’s my version of Ben Carlson’s Grand Rapids hedge. But in my case, it’s the Minnesota Hedge😉
However, the point is that I am not going to be telling people to go “all in” on stocks just because a 10% GDP growth rate would result in the most significant stock market in history.
And Vanguard’s “go 70% bonds for the next decade”? Well, that is likely to look really silly and destroy a lot of retirement dreams.
The data doesn’t support extra conservatism (statistically speaking, for any individual investor, things will always vary).
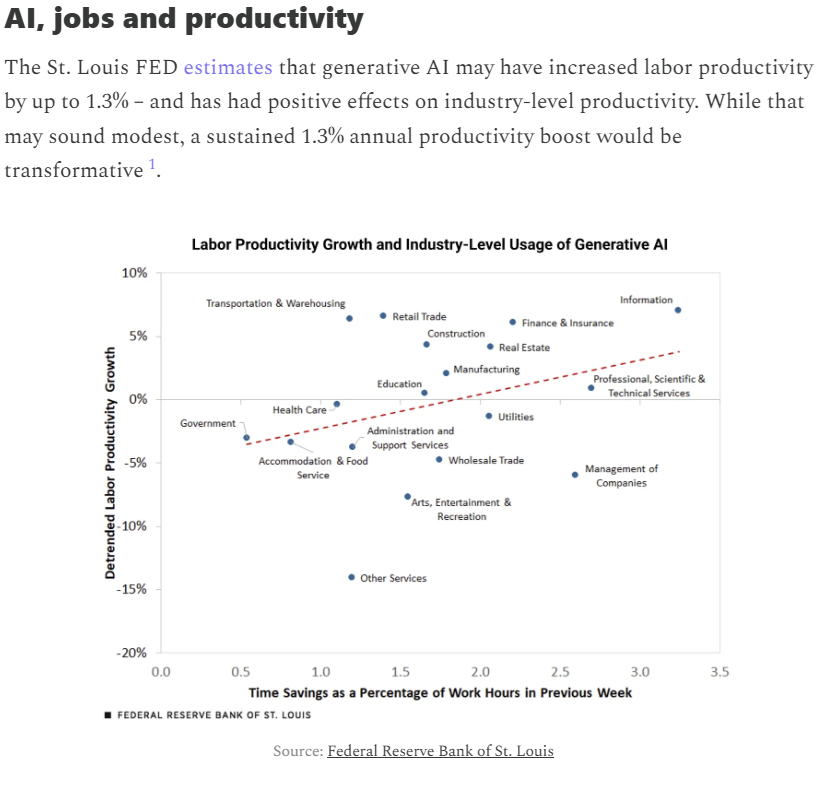
And keep in mind that the St. Louis Fed is showing 1.3% productivity growth from AI in the past year alone. So, potentially my estimates might be conservative! Welcome to the age of AI!😂
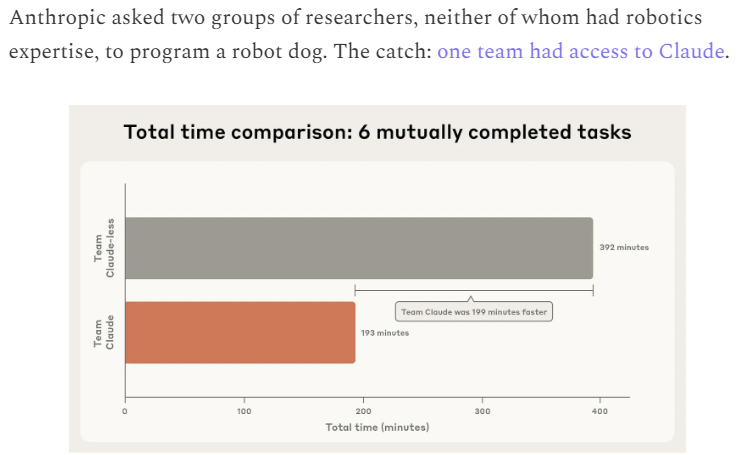
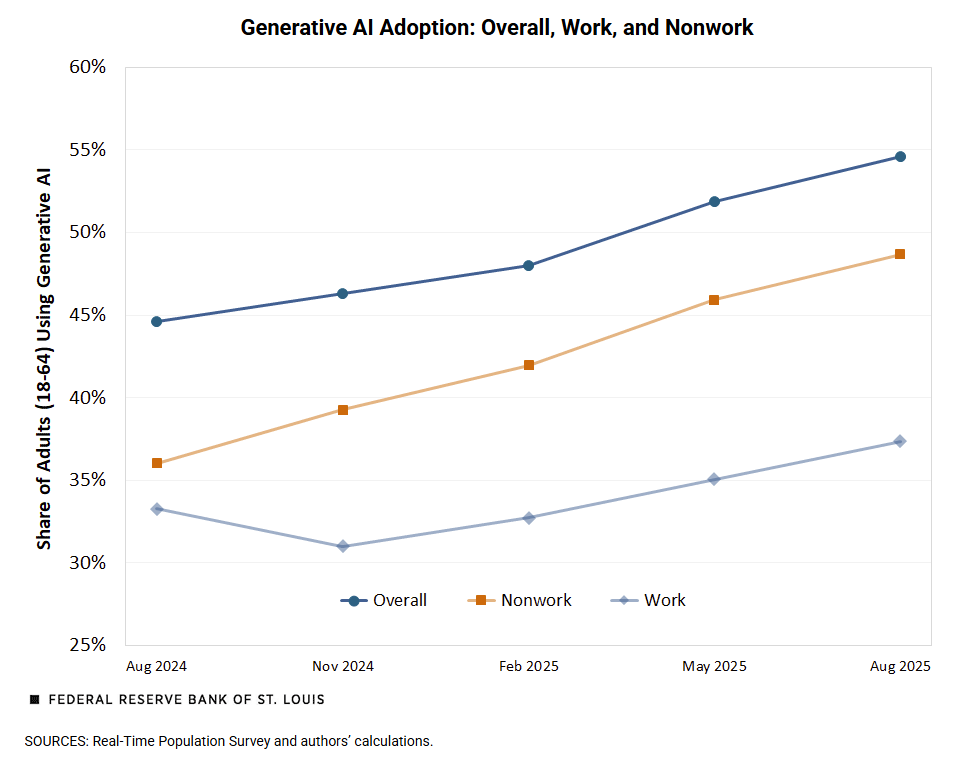
The majority of Workers Still are Not Using AI: So that’s More Growth In Users Potentially (Plus Productivity Boom Has Room To Run)
The only AI curve that matters: What 99%-reliable AI could look like by 2030
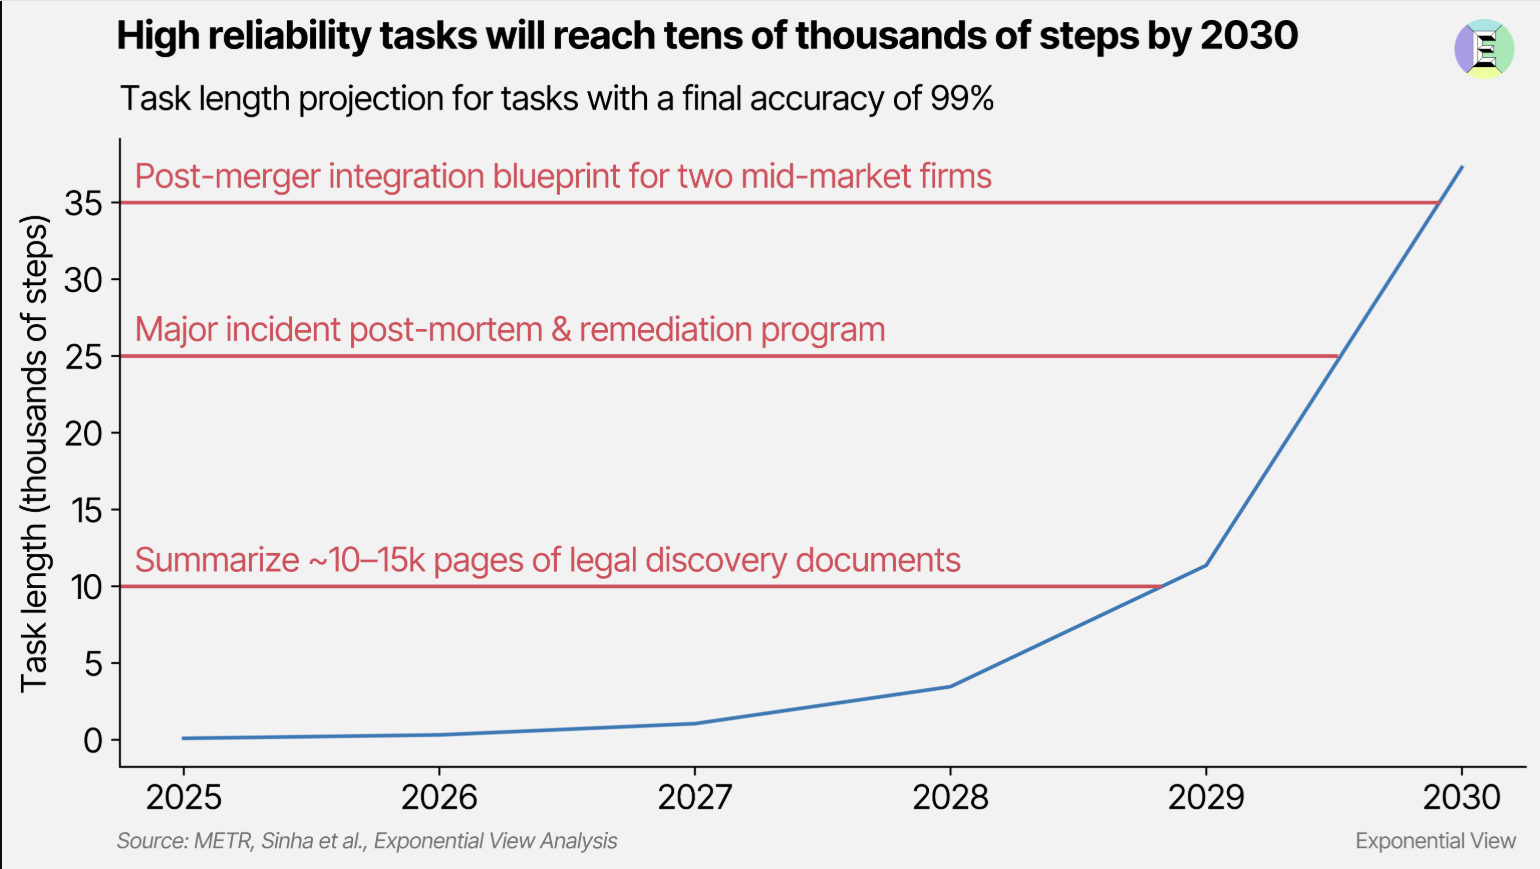
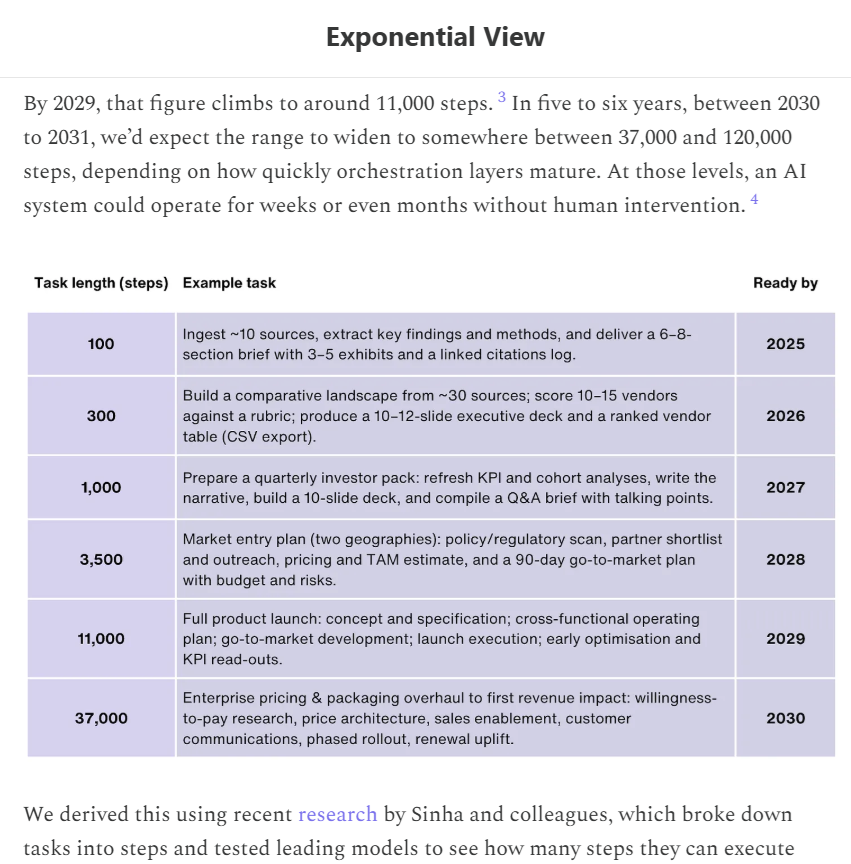
In this excellent article, Azheem Azah and Hannah Petrovic explain that what we commonly think of as AGI or artificial general intelligence, aka “Jarvis” or “Samantha from Her,” can be thought of as human-level expertise in complex tasks, specifically 99% accuracy.
Right now, the best AIs can do about 100 steps at 99% accuracy, but at the rate of improvement they believe by 2029 we’ll be at 10,000 steps, and within a few years after that, 30,000 to 100,000 steps.
At that scale, an AI system could operate for weeks – potentially months – without supervision.
Now you understand the potential for this technology and why the big tech giants are spending trillions on it.
By 2040, GNG Can Be Run By AI! Salvation! Or At Least Vacations Without Thinking About Work!
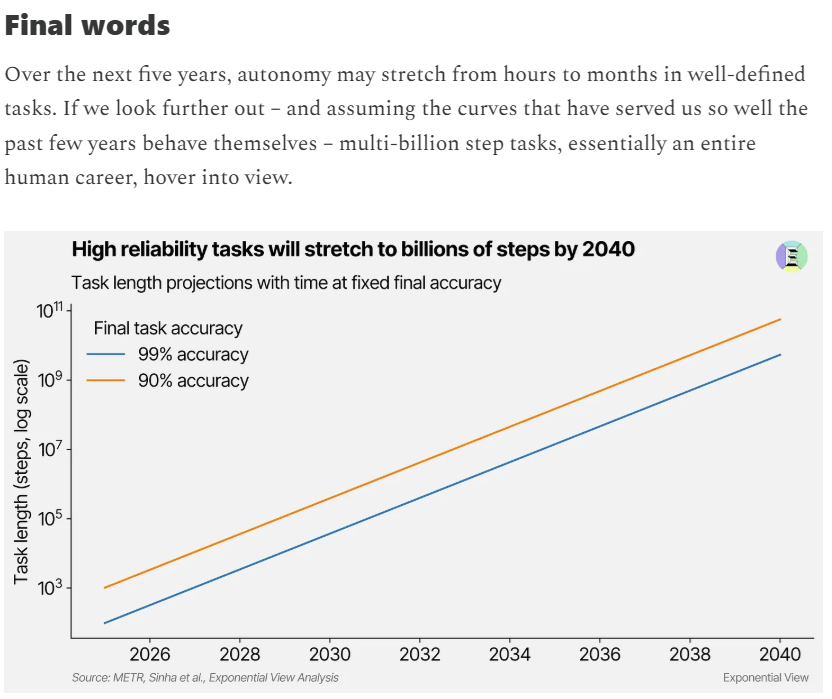
Of course, the cynical amongst us would use this chart to estimate that 2040 is the year when all humans can be replaced entirely by teams of AI double-checking each other’s work😂
Don't worry, GNG team members! You are never going to be replaced, your Robot partners and you, you are a team.
Just like me and AGIOS.
No one gets fired just because today's work can be done by machines in 2040.
By 2040, we'll all be better than we are today🤗
OK, but show us the “Sane” GDP forecasts please😉
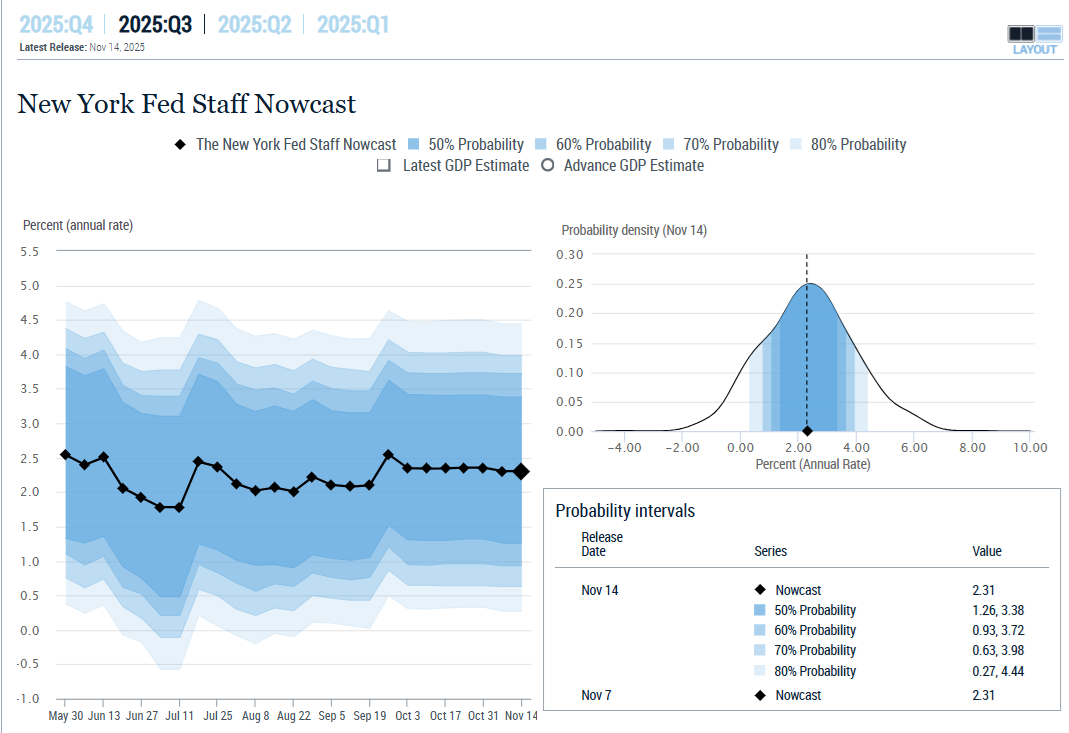
Q3 (not out yet due to the shutdown) at 2.3% for the NY Fed, and what about Q4?
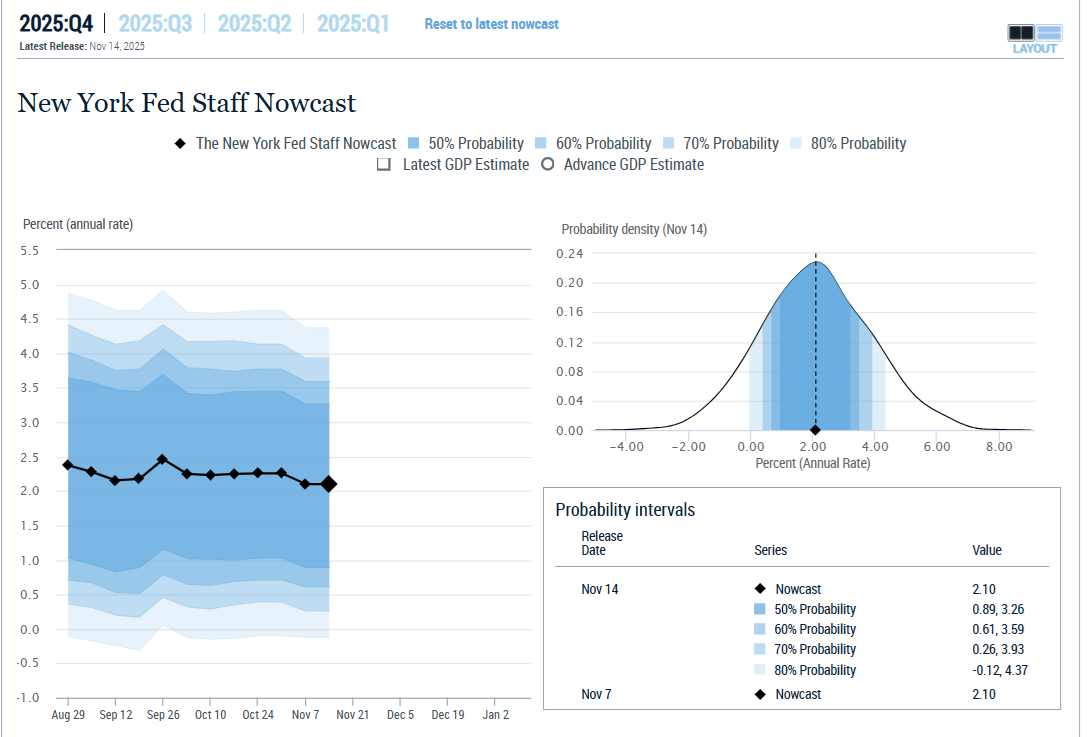
2.1% real-time growth in Q4.
What about the gold standard?
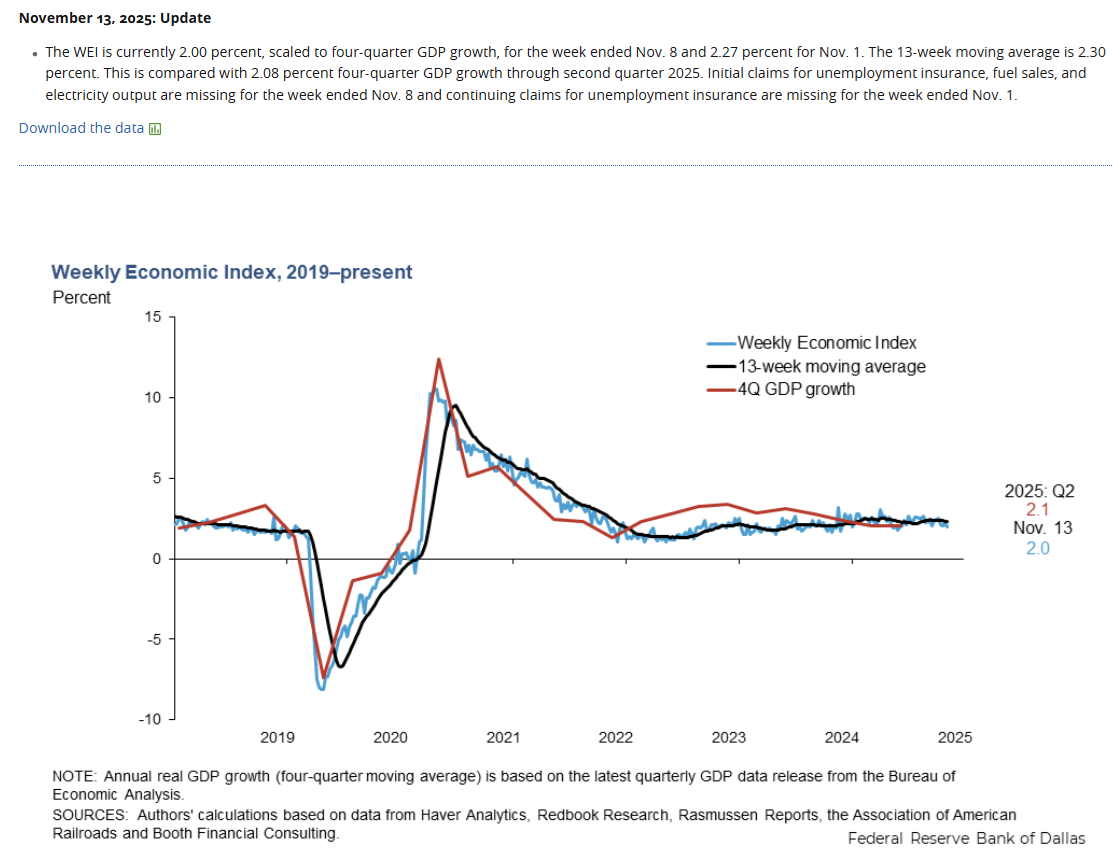
The weekly economic index from the Dallas Fed is 100% daily and weekly time series, nothing but hard data, no soft surveys of what people THINK might happen, but what they are doing right now.
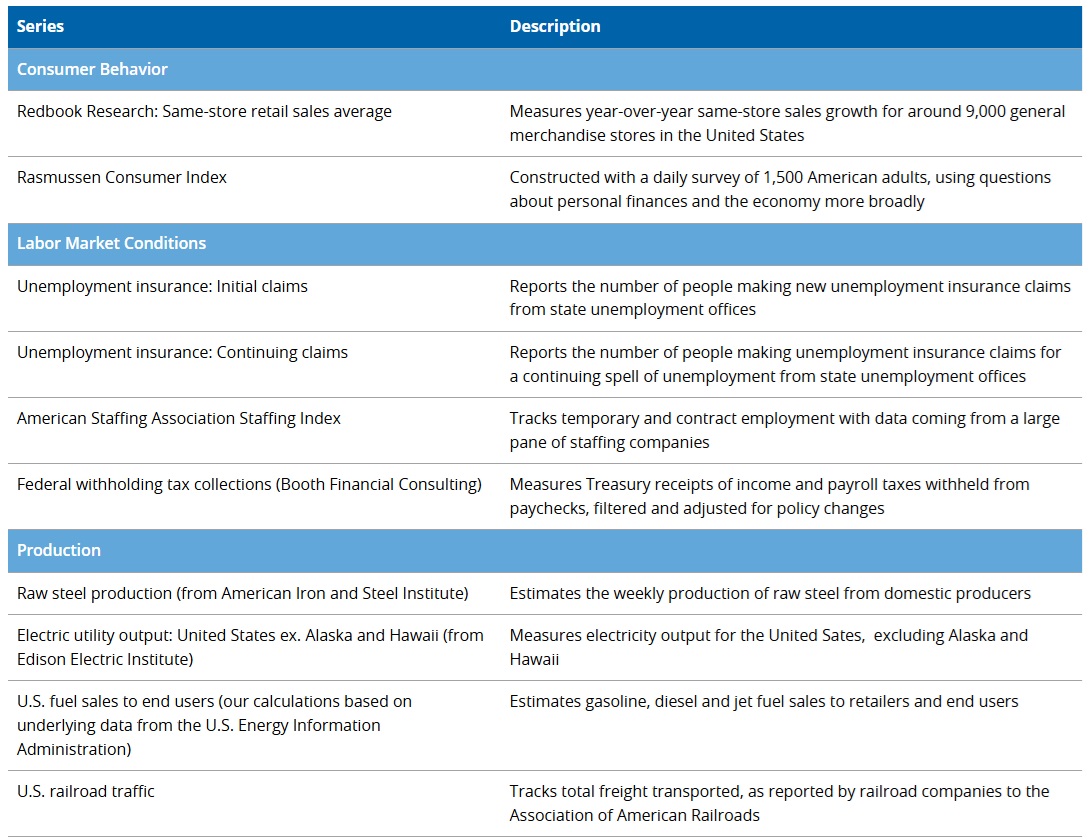
Understanding people’s feelings is essential to understanding their well-being and happiness. As far as estimating the economy? Sentiment surveys are entirely worthless. When you can see DAILY treasury payroll tax receipts, what consumers FEEL about the future of the job market is irrelevant. If they have jobs, the payroll taxes will tell the story, and the sentiment surveys are only ever mentioned in the context of “here’s why sentiment surveys are broken when it comes to the economy, BUT 100% completely valid in terms of tracking anxiety and overall well-being of Americans”.
Your portfolio doesn’t care about surveys, and for the foreseeable future, won’t care about surveys (not even business sentiment!).
More Incredible (But True) Econ Charts!
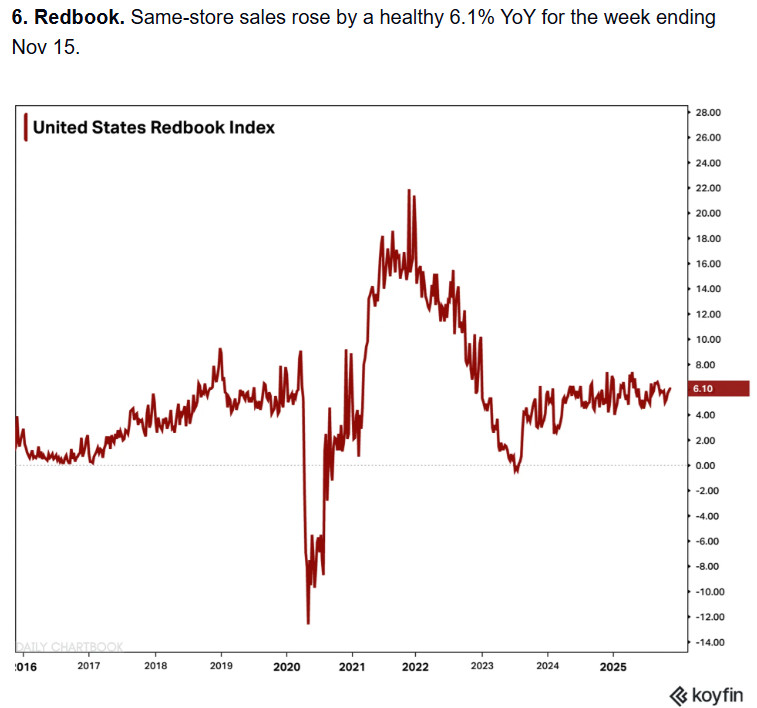
Retail spending up 6.1% YOY in the past week.
Signs of recession are everywhere! Except for the consumer spending or hard data!😉
Last week, this was 5.9% and I expect the WEI on Thursday to rally to around 2.2% to 2.4%.
Is that really that different from 2%? No, BUT remember that the difference between a 10% to 15% correction (10.6% base-case) and 15% to 20% is whether or not growth is above or below 2% and stable/rising or falling.
Growth above 2% and rising? It won’t matter what headlines you see; if the fundamental GDP and corporate profit facts are strong, headlines are irrelevant noise, and purely a buying opportunity.
Let the fearful look upon their social media-driven headlines and weep in despair, we shall buy their cheap shares from them, and then during the V-shaped recovery, they shall weep in despair for a different reason😂😉🤣
Not as mean as it sounds, I promise😉
How Do We Know It’s Not All About To Fall Apart? Because of Charts Of Course!😉
The Chicago, Kansas City, and St. Louis Financial Stress indices make up around 122 weekly financial reports that collectively look over every part of the economy’s financial markets. Zero = the average level of financial stress since inception (1972 for the Chicago Fed indicator).
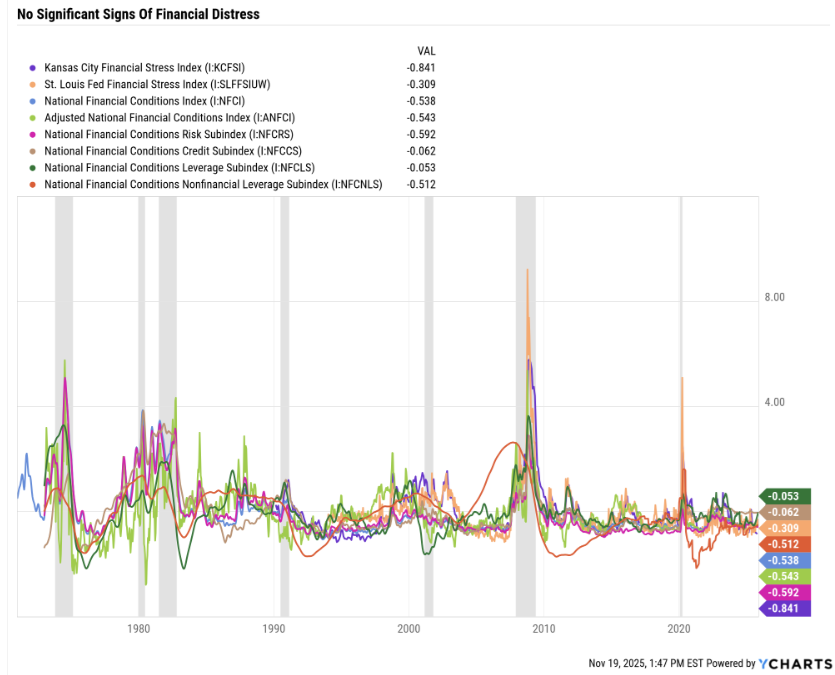
Negative numbers mean below-average financial stress. And right now, every single metric and submetric is negative.
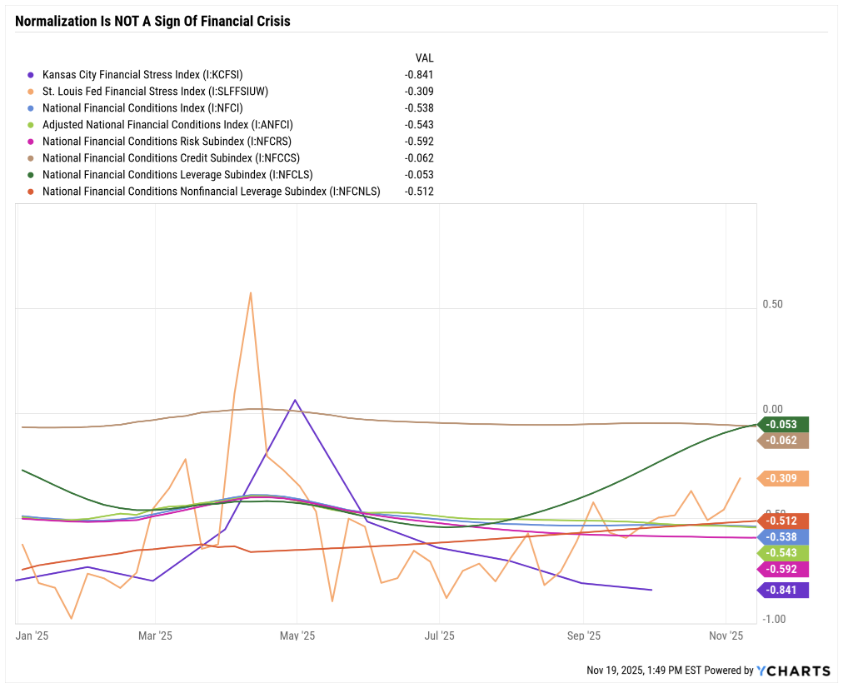
Some of the metrics have gone up significantly in recent months, BUT remember that zero = average stress levels.
By definition, if something is below average and then returns to average, that is called reversion to the mean, normalization. It’s not a sign of an impending financial crisis or stock market decline.
OK, but what about the stock market? Isn’t that overvalued?
Fact 5: The Market Is Now 15% Undervalued
We (by which I mean me😉) have a lot of fun at GNG Research because in the absurd age of AI, you have to laugh at the absurdity to keep from crying😂
I appreciate everyone tolerating my humor…because technically I’m the boss🤣
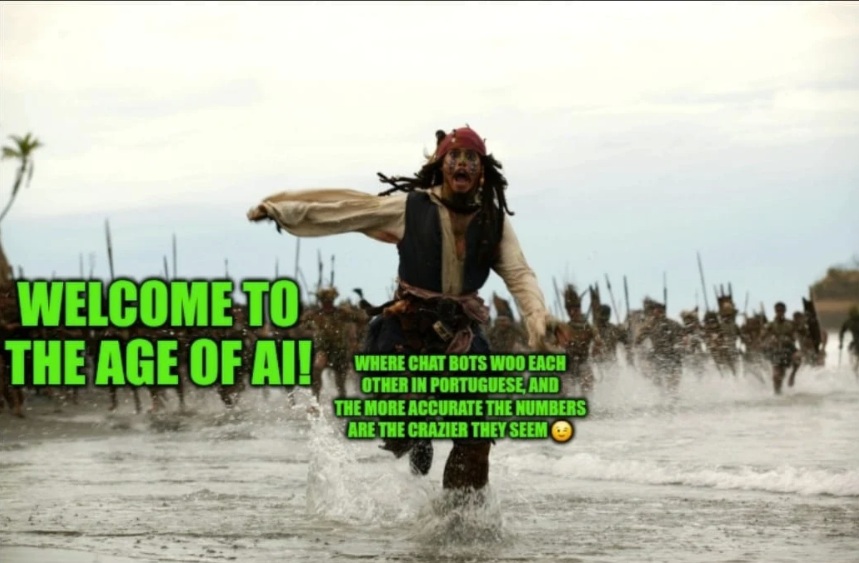
That’s why I love to show memes like this, poking fun at a lot of the outrageous things we’ve seen, heard, and felt in the last 3 years.

THIS MUST BE A BUBBLE!
I understand investors are nervous given that Nvidia is larger than consumer staples, energy, utilities, real estate, or material sectors. In fact, it’s larger than utilities, real estate, and materials combined!
Nvidia is worth more than Japan’s stock market and worth almost as much as France and Germany's stocks combined!
Fun trivia facts do not a bubble make😉
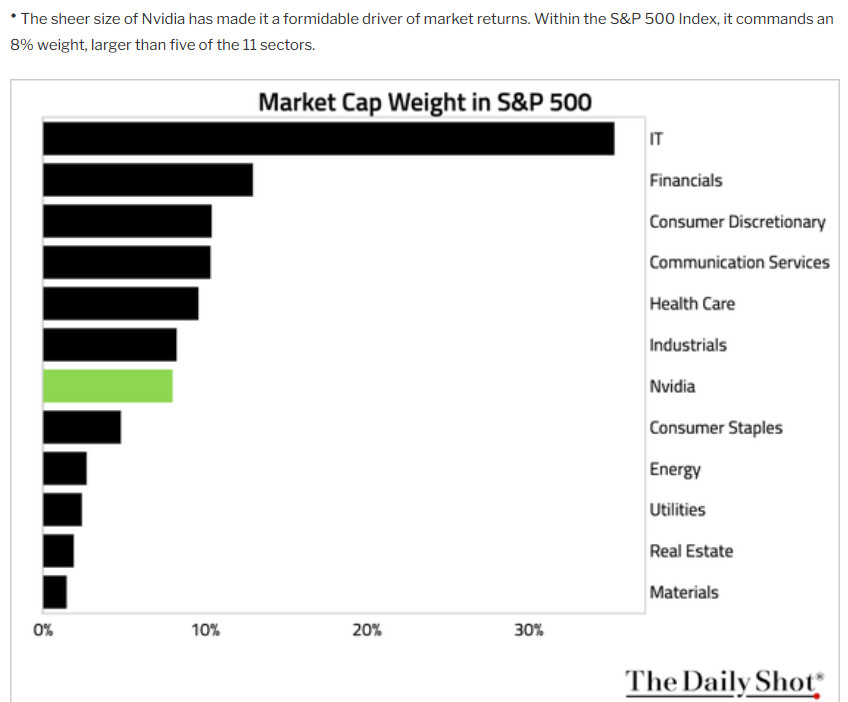
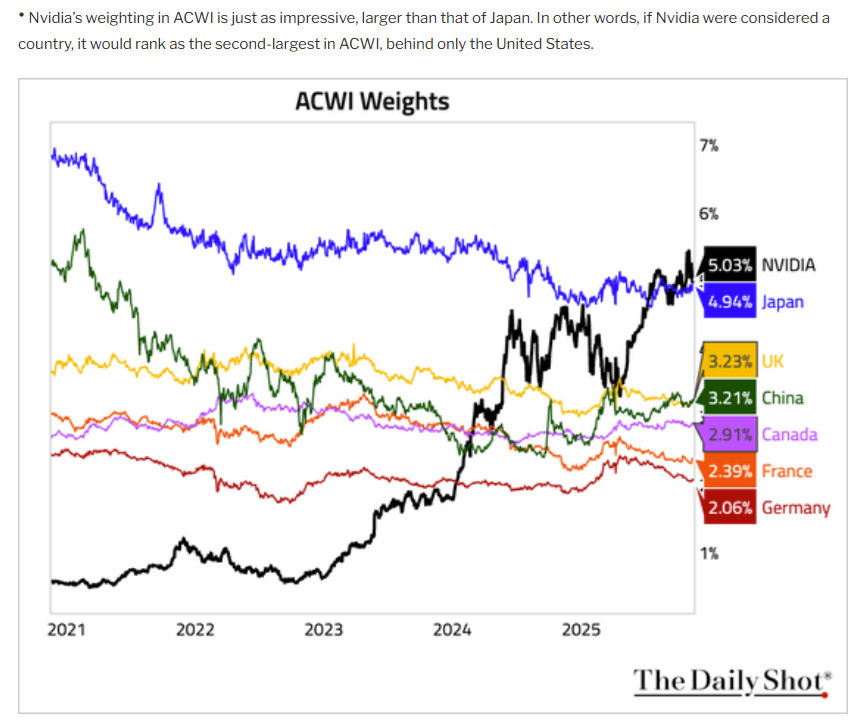
But when it comes to what we buy for ZEUS, or recommend to members, we’re stone cold sober, because money is a cruel mistress and only cares that your math is correct.
How We Know It’s Not A Bubble!
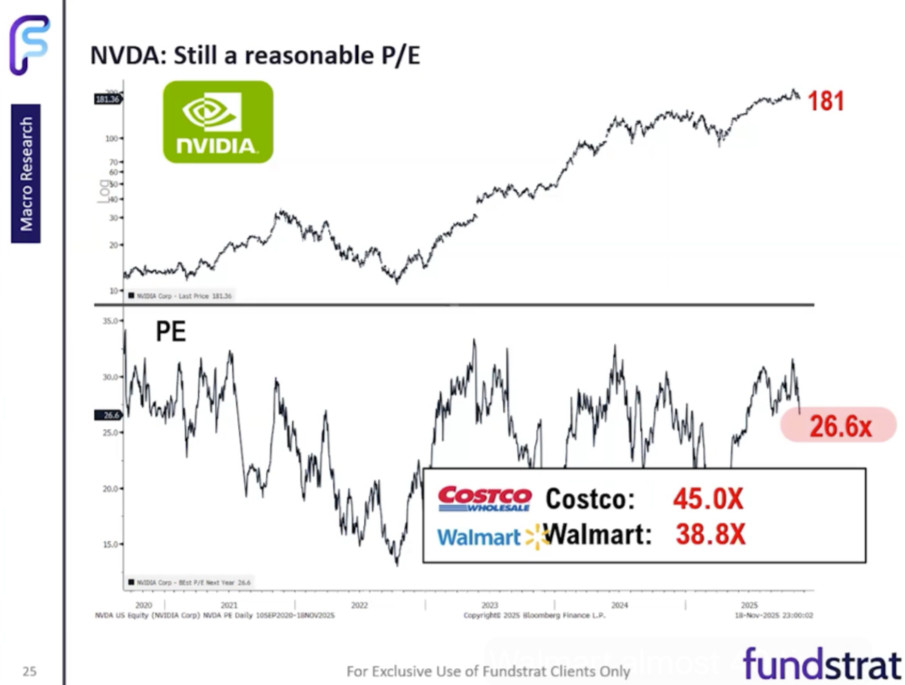
Thank you, Tom Lee of Fundstrat, for pointing out that Nvidia isn’t absurdly priced, but perhaps Walmart and Costco are.😉
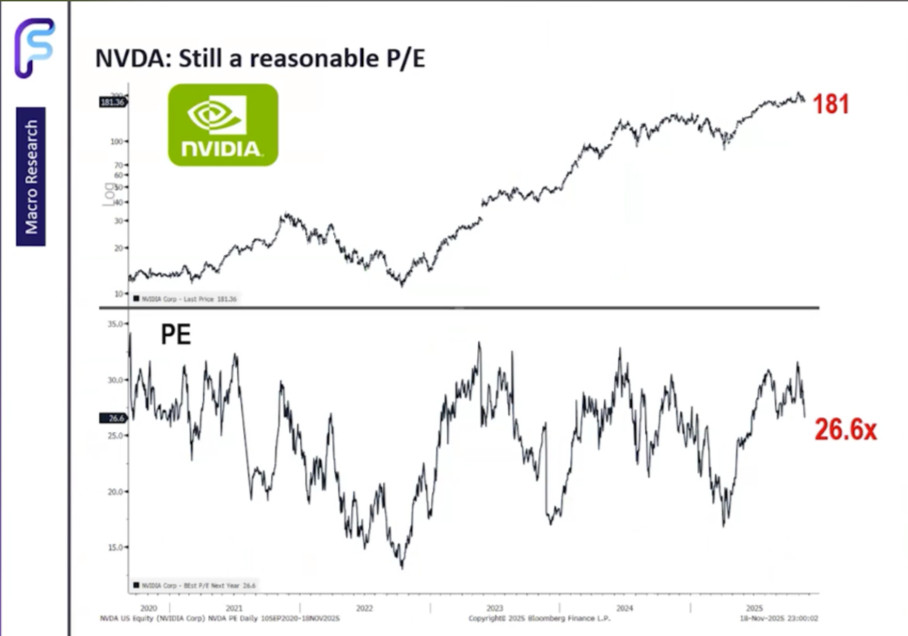
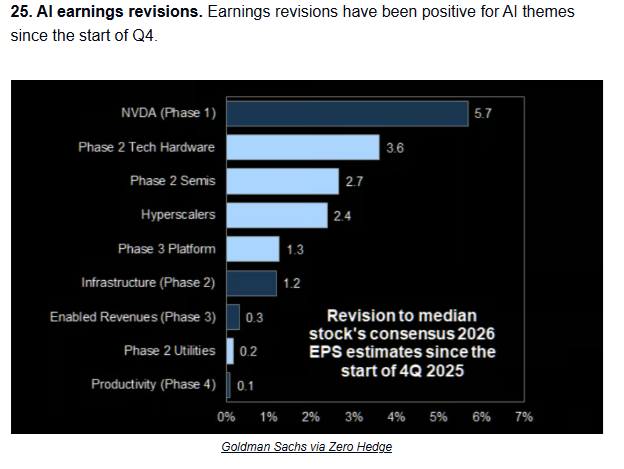
NVDA estimates keep rising by the week, for the same reasons the economy keeps surprising to the upside. The AI boom is so strong that NO ONE CAN BELIEVE IT! Not even the analysts. So we all sandbag our REAL estimates, and then quietly keep raising estimates just enough to look like we’re right, because plugging in the actual numbers makes us seem like lunatics😉.
In fact, Nvidia, despite rising about 15X over 3 years, has not seen its P/E expand at all.
Plug in Jensen’s latest guidance, and NVDA could see EPS up 13X in the next 5 years.
I’m the only analyst with the job security to run those numbers and tell you about them😂
Not a forecast, of course, I am not brave/”crazy” enough to predict Jensen can pull off his guidance. 🤣
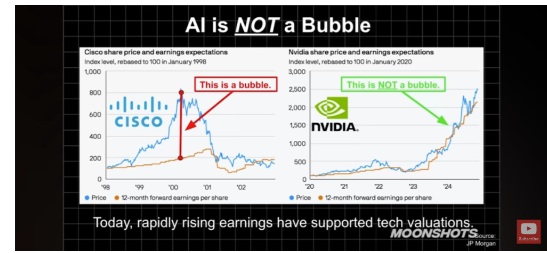
A bubble can’t be priced going up quickly if fundamentals go up quickly. That’s not a bubble, it’s math.😉

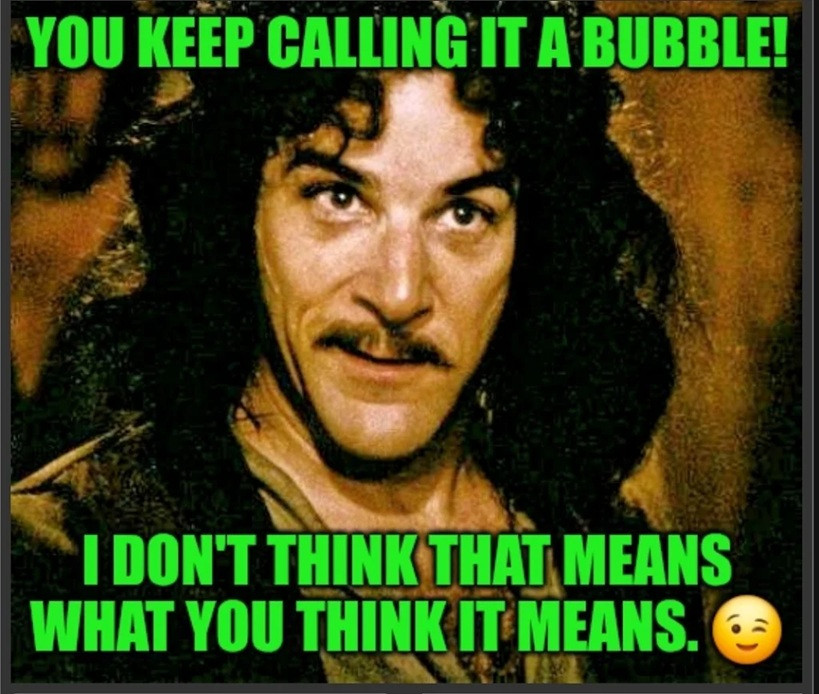
Well, what about the broader market? We keep hearing about how historical measures overvalue the market.
S&P PEGY Valuation Update
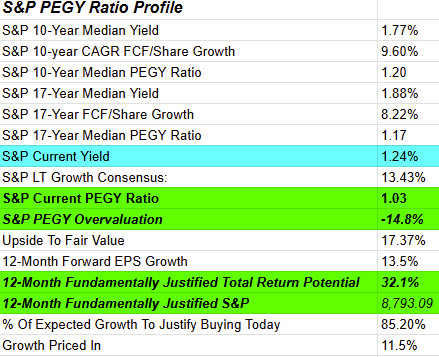
The market is about 15% undervalued and priced for 11.5% growth vs. 15% this quarter and 13.5% expected next year.
For context, at the October 2022 and April 7th lows, the S&P was about 20% historically undervalued (Morningstar estimate 17%).
In other words, if the 7% further decline from here (10.6% peak decline) that GNG is expecting occurs, what will happen? Then the S&P will become 20% undervalued, the same precise undervaluation we saw at bear market lows in April and 2022.
Bottom Line: The Economy (Might) Be Booming, Corporate Earnings Are Booming, and the AI Boom is Booming More Boomingly Than Ever😉
I warned GNG members about 2 weeks ago that a correction could be coming by the end of the year. I thought it would be a potential growth scare over the Government Shutdown, but instead it’s turning into a completely ho-hum, run-of-the-mill correction during a period of strong fundamentals.
A strong economy, strong earnings, and an AI boom driving it all, which continues to accelerate.
This is what I jokingly refer to as a “Pearl clutching” correction, in which everyone kind of admits that “Everything is awesome…right now!…BUT everything could fall apart at any time!”.
Yes, and that’s how the world has always been. We’ve always climbed a Wall of Worry, and that will never change.
Today’s markets are faster-moving because they are algorithm-driven. The algos are all slightly different, BUT they are fundamentally watching the same news feeds, headlines, and the same data. And so they are generating the same buy and sell signals. That’s why corrections that used to average 4 months are happening in weeks.
That’s why we had a Bear market at the start of the year, which went from Feb 17th (high) to April 7th (low).
V-shaped recoveries are what happen in a good economy, where people clutch their pearls and lament about what MIGHT go wrong with great fundamentals. As long as the fundamentals stay great, the lamantions always sound smart, BUT the actual smart move is to buy more, or if you can’t afford to buy, sit tight and trust your companies.
Don’t be a gambler. Don’t try to buy the next 100 bagger, or even the next 10 bagger. Trust that disciplined financial science, safety and quality first, and prudent valuation and sound risk management always, will help you generate 10X, 100X, and even 1000X returns over decades.
That’s how you can stop praying for luck on Wall Street and start making your own.

Sign in to leave a comment and join the discussion.
Sign Up Free