

How DGRO, VIG, VYM and TBG compare on the income you receive, the growth you might get and the risk you still own.
The Schwab U.S. Dividend Equity ETF (SCHD) pays the highest starting yield of the five funds I compared, 2.95% on trailing income at the October 30 close. It also returned 23.36% on NAV in the year to September 30, and none of the SCHD alternatives here matched either number.
Then there's the payout. SCHD's dividend growth for January through September 2026 was just 0.8% over the same months of 2025, the slowest of the group. Is it fading? One partial year can't say, and I wouldn't wave it off either.
What gets better after I make the change?
SCHD alternatives can improve diversification, change the companies supplying your dividends or shift the balance between income and capital growth. Switching to a lower-yielding fund also opens an immediate income gap, and faster dividend growth can take far longer to close it than most investors expect. My first comparison would be the iShares Core Dividend Growth ETF (DGRO) for broader dividend-growth exposure, then the Vanguard Dividend Appreciation ETF (VIG) for its stricter streak rule and the Vanguard High Dividend Yield ETF (VYM) for breadth. The TBG Dividend Focus ETF (TBG) deserves a closer look as an active option with a much shorter record.
For anyone spending the dividends now, SCHD is still a credible place to start.
And if the only answer to my question is that another ETF has done better lately, I don't think we've done enough work.
What do you want a SCHD alternative to improve?
Let me start with how I'm judging this, because it shapes every table below: dividend growth total return, or DGTR.
Starting income matters. So does the ability to grow it. Then there's the quality and price of the businesses behind it and what happens to your capital along the way. It's the same balancing act behind my dividend-sleeve framework.
People use "dividend growth" to mean three different things. A fund can pay more per share. You can collect more dollars because reinvested dividends bought extra shares. Or the fund can climb in value while paying out fairly little cash.
Those can work together, but they answer different questions.
Someone using dividends to cover bills cares about cash showing up without selling shares. Someone reinvesting for another 15 years can reasonably take less income today if the overall result looks better. Both are sensible. Neither one is helped by a comparison that quietly swaps goals halfway through.
Here is where the five funds start.
ETF | Annual expense ratio | Trailing income yield | Annual cash on $10,000 at that trailing rate |
|---|---|---|---|
SCHD | 0.06% | 2.95% | $295 |
DGRO | 0.08% | 1.84% | $184 |
VIG | 0.04% | 1.47% | $147 |
VYM | 0.04% | 2.24% | $224 |
TBG | 0.45% | 2.41% | $241 |
GNG calculations: trailing income through October 30, 2026 divided by that day's close. TBG excludes identified capital gains. Backward-looking rates, not promised payments.
Notice anything about VYM's number, given a name that promises high dividend yield? It pays less than SCHD on this trailing calculation.
The standardized 30-day SEC yields look different. SCHD showed 3.09% as of October 29. DGRO showed 2.07%, VIG 1.51%, VYM 2.35% and TBG 3.55% as of September 30. That measure annualizes a recent month of net investment income, so it isn't the cash shareholders received over the past year, and the dates don't line up exactly.
Be especially careful with TBG's 3.55%, because swapping it in for the 2.41% trailing ordinary-income yield would change the comparison before you've touched a single investment input.
SCHD dividend growth rate: what the history shows
SCHD's dividend grew about 10.6% a year from 2015 to 2025 and roughly 9.2% annually over the last five years, with the split-adjusted annual payout climbing from about $0.382 a share to $1.048.
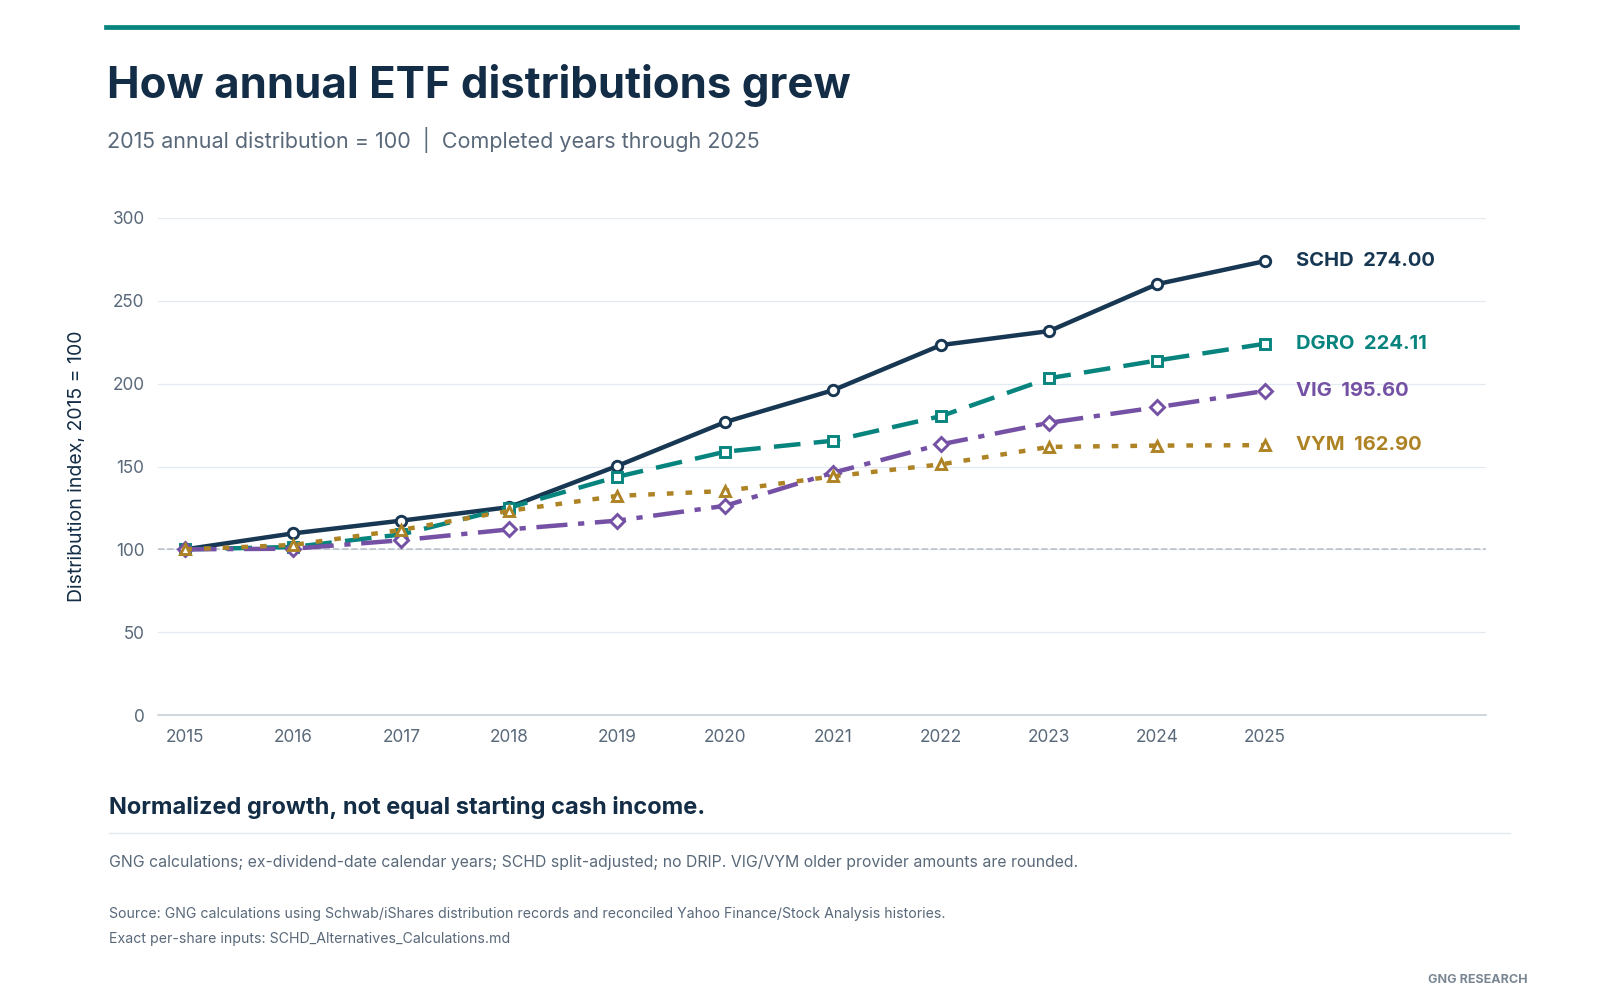
The recent pace is slower.
ETF | Five-year annualized distribution growth, 2020-2025 | 2025 growth over 2024 | Jan-Sep 2026 versus Jan-Sep 2025 |
|---|---|---|---|
SCHD | 9.2% | 5.4% | 0.8% |
DGRO | 7.1% | 4.7% | 4.3% |
VIG | 9.1% | 5.3% | 3.3% |
VYM | 3.8% | 0.2% | 6.8% |
TBG | Not available | 16.1% | 12.6% |
Ex-dividend-date basis, no reinvestment. TBG counts income only. 2026 is a partial year.
Two things jump out. SCHD and VIG grew payouts at almost the same five-year pace from very different starting yields. And VYM barely raised its full-year payout in 2025. Yet it has the fastest 2026 year-to-date growth of the four established funds.
So which one is the dividend grower?
The names won't tell you. Underlying companies can raise dividends while the ETF's payout grows more slowly. Holdings change, weights shift, and cash receipts and fund expenses don't land in matching quarters. One unusually large payment can skew the whole comparison.
SCHD's three-for-one split in October 2024 needs one more adjustment. Older per-share payments have to be restated on today's share count. A split changes the share count and the per-share payment without touching your total income. The figures here make that adjustment once, using Schwab's distribution history and split notice.
I wouldn't read SCHD's 0.8% year-to-date gain as proof its dividend-growth strategy is broken. I also wouldn't plug its historical 10.6% into a retirement plan without testing something slower. For updated payments, GNG maintains separate SCHD and DGRO dividend histories.
When does faster dividend growth catch a higher starting yield?
Let's put dollars on the tradeoff.
Start with $10,000 in each fund at the trailing income rates above. Spend every payout. No new money, no share sales, no reinvestment. For this example I'll assume annual income growth of 4% for SCHD and VYM, 7% for DGRO and VIG, and 6% for TBG.
Those growth rates are my scenario inputs, not ETF forecasts, and I'm deliberately handing the lower-yielding growth funds a big edge on growth to see what it buys them.
ETF | Year 1 income | Year 5 income | Year 10 income |
|---|---|---|---|
SCHD | $295 | $345 | $419 |
DGRO | $184 | $242 | $339 |
VIG | $147 | $193 | $271 |
VYM | $224 | $263 | $319 |
TBG | $241 | $304 | $407 |
ETF | Total cash through year 5 | Total cash through year 10 |
|---|---|---|
SCHD | $1,596 | $3,537 |
DGRO | $1,060 | $2,547 |
VIG | $846 | $2,033 |
VYM | $1,216 | $2,695 |
TBG | $1,358 | $3,176 |
GNG illustrative math. Year 1 is the starting income year. Nominal dollars, before investor taxes. Capital values not modeled.
Even after a decade of 7% growth, DGRO's annual check would still trail SCHD's in this example. It wouldn't catch SCHD's annual income until year 18. Making up all the cash it gave up in the early years would take until year 28. Year 28.
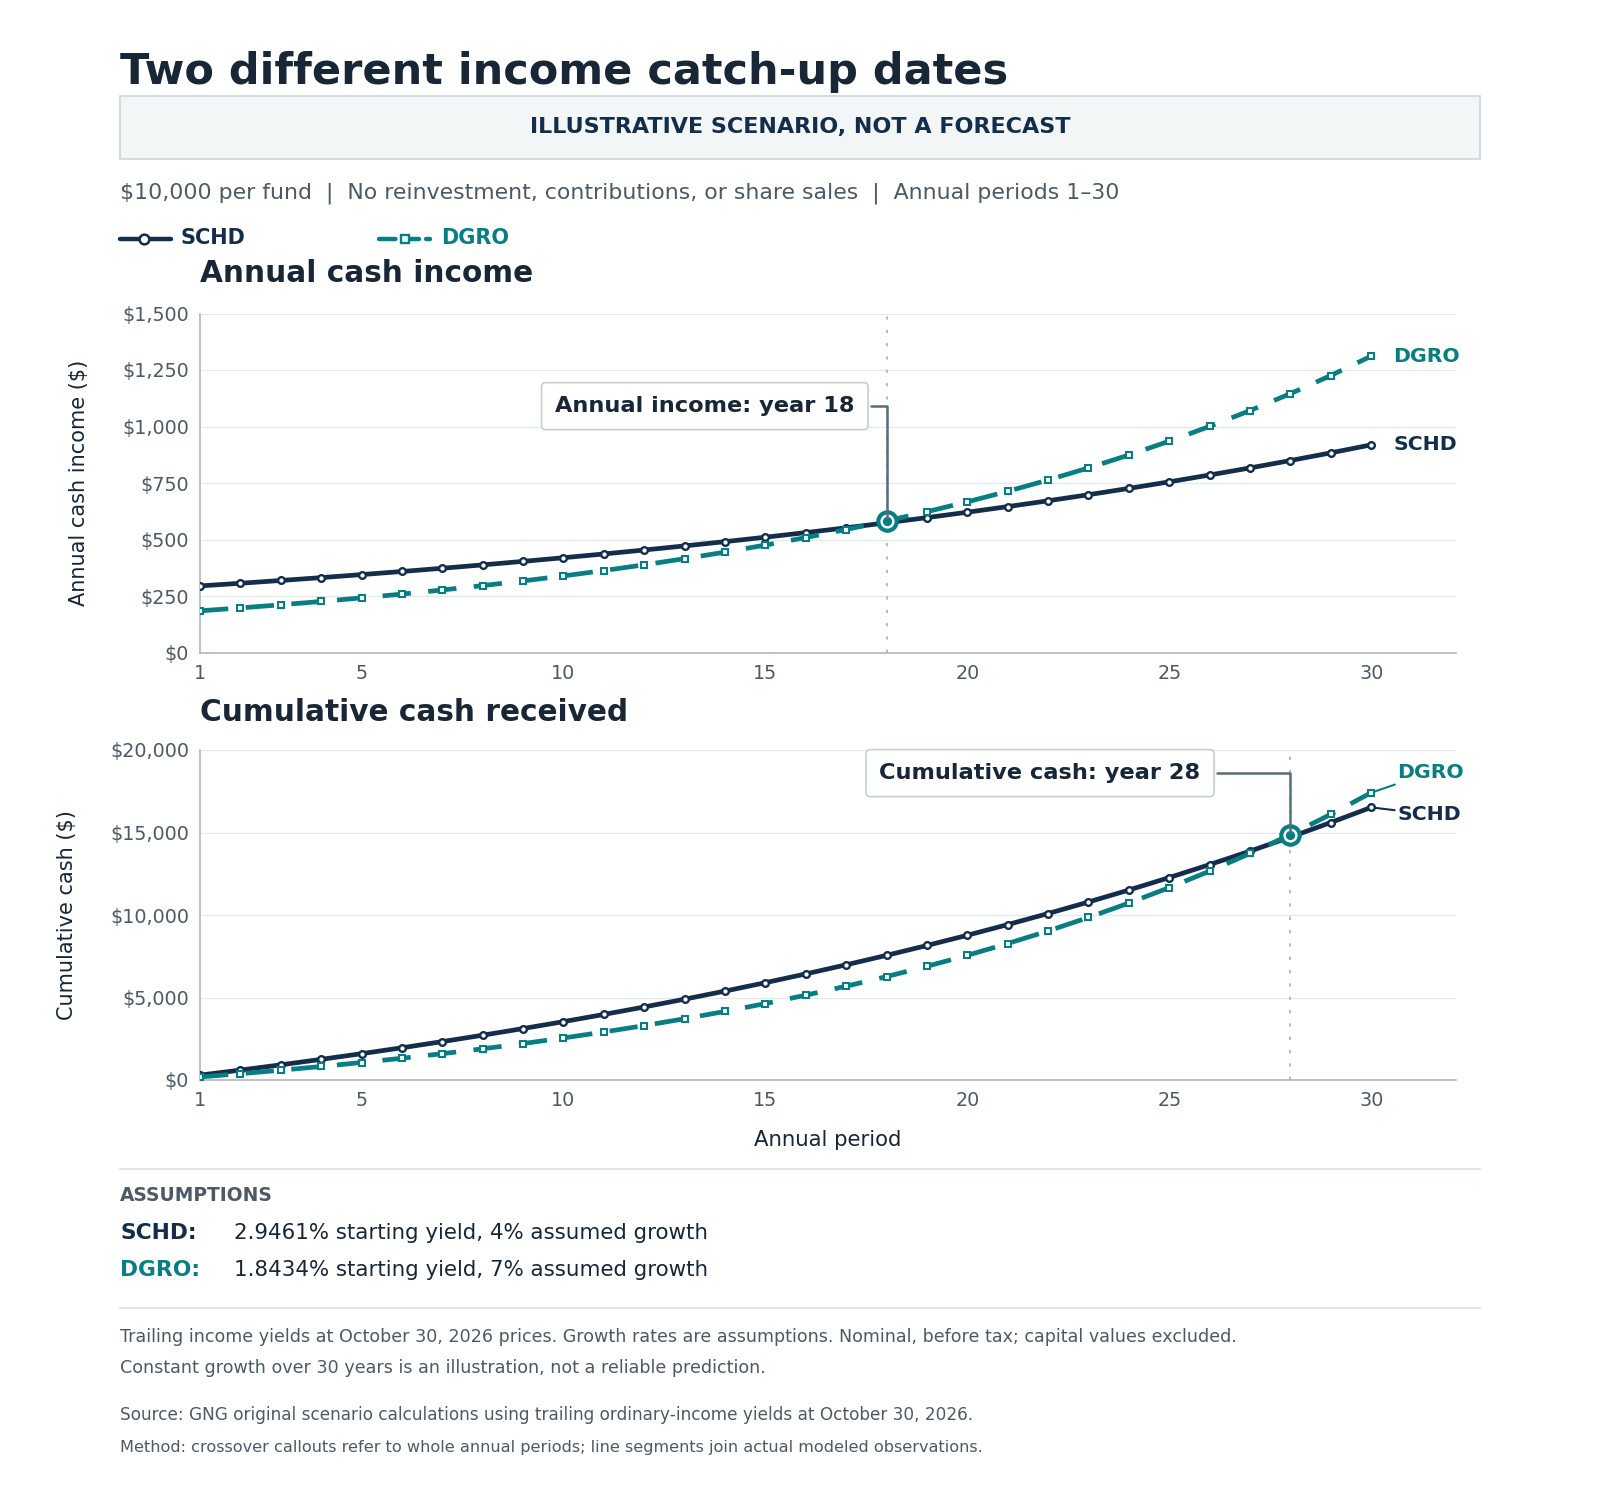
That's what a 1.1-point yield gap costs, even against a three-point growth edge.
VIG's smaller starting check pushes those dates out to years 26 and 38, which is just what constant-growth arithmetic produces that far out, so I wouldn't treat either date as a forecast.
Now flip the inputs. Give SCHD only 2% growth while DGRO keeps 7%, and DGRO would catch the annual payment in year 11 and the cumulative cash in year 19. Give DGRO 5% against SCHD's 4%, and the annual crossover slides to year 50. Cumulative cash is still behind after the full 60-year test.
You might be thinking nobody holds one fund untouched for 28 years. Fair enough. The point is narrower than that. If you're spending this money, a faster growth rate can look attractive and still miss your near-term income needs for a long time.
Inflation chips away too, since at 3% a year the $419 SCHD pays in year 10 buys roughly what $321 bought in year one, which means growing nominal income and growing purchasing power aren't the same thing.
And this cash-only math leaves out a big piece. What happened to the money still invested? A lower-yielding fund could build more total wealth and fund spending through occasional sales. Nothing in this example rules that out, and it can't tell you a sustainable withdrawal rate.
SCHD alternatives compared: what changes inside the fund?
SCHD needs ten years of dividend payments to get in the door, which is a lower bar than ten straight annual raises. Its index ranks eligible companies on cash flow to debt, return on equity, yield and five-year dividend growth. That process left about 41.8% of the fund in its ten largest stocks on October 29, against 27.1% for DGRO. Quality screens still leave plenty of concentration, as the Dow Jones methodology show.
DGRO: my first comparison for broader dividend-growth exposure
DGRO's index generally requires five years of uninterrupted dividend growth and an earnings payout ratio under 75%, drops the highest-yielding tenth of eligible stocks before applying those screens and weights companies by dividend dollars, as laid out in the DGRO index description.
That's a different selection process from SCHD's mix of yield, financial strength and growth measures.
The October 29 holdings files show what that does. DGRO had about 19.4% in financials and 7.0% in utilities, versus about 9% and 0.1% for SCHD. Energy runs the other way at roughly 5.8% against 16.2%. These are calculated equity weights from the SCHD holdings and DGRO holdings files, with small cash and derivative balances left out.
That's a tangible reason to own DGRO, since it changes where your dividend income comes from and leans less on SCHD's particular mix.
What does it cost you? A smaller check up front. DGRO's actual five-year payout growth also trailed SCHD's, so I can't sell the switch on proven faster income growth. I'd pick it for the broader portfolio and the different exposures, then keep an eye on the income.
VIG: a longer dividend-growth requirement, with less current income
VIG's index requires ten straight years of dividend increases. It cuts the highest-yielding 25% of otherwise eligible companies, with a buffer that lets existing holdings stay. It also caps market-cap weights under the S&P methodology. Those rules deliberately steer it away from chasing the biggest yields.
At September 30, Microsoft (MSFT) and Apple (AAPL) were each about 4.9% of the fund, with Broadcom (AVGO) another 4.3%, according to the VIG fact sheet. Those names can swing the fund's capital returns a lot while supplying far less of its cash income than the same weights in higher-yielding stocks would.
I get the appeal for an investor who wants dividend discipline and doesn't need much cash yet, but for someone swapping out SCHD to pay bills, the hit is steep at about half the cash per $10,000 in the trailing comparison.
One more wrinkle: VIG changed benchmarks in September 2021, so its ten-year live record is real but wasn't all earned under today's exact rules.
VYM: breadth does not guarantee faster income growth
VYM held 593 stocks at September 30, with 26.2% in its ten largest, per the VYM fact sheet. It picks companies by forecast dividend yield, and a streak of annual raises isn't the defining test under the FTSE methodology. That breadth appeals to me as a way to spread out single-company risk. It doesn't erase concentration, though, since Broadcom alone was 6.9% of the fund on that date.
The same September fact sheets put VYM at 19.5 times earnings versus 24.4 for VIG. Sector mix explains part of that gap. A lower multiple on its own doesn't make VYM a bargain. And the price of the underlying businesses is a separate question from whether the ETF trades a hair above or below its NAV.
Here's the odd part. VYM posted the best five-year total return of the established group, 11.63% a year against SCHD's 9.48%. It did that with the slowest five-year payout growth. Payout growth and total return need their own columns for exactly that reason.
I'd consider VYM for a broad, cheap dividend-paying stock allocation, but I wouldn't buy it assuming the name means more income than SCHD, or that this year's payout rebound keeps going at the same pace.
TBG: an active challenger that still needs time
TBG's website uses Dividend Growth branding, but its legal name in the July 20, 2026 summary prospectus is TBG Dividend Focus ETF. It launched on November 6, 2023. Its manager generally expects to hold about 30 to 40 companies, possibly including REITs and MLPs. Dividend growth gets weighed alongside balance-sheet strength and capital allocation.
The current expense ratio is 0.45%. The cut became permanent in July 2026, so the older 0.59% figure no longer applies. Against SCHD's 0.06%, that's about $39 a year on a steady $10,000 balance before compounding. Published fund returns already reflect expenses, so don't subtract that gap a second time.
If 0.45% sounds like a lot to pay for 30 to 40 stocks, I had the same reaction.
Here's what the fee buys. A manager can dig into an exception or sell when the case changes. There's no waiting for the next index review. The same freedom brings manager risk, since you're depending on those calls staying useful after costs.
TBG's income payouts rose 16.1% in 2025 and then 12.6% over the comparable first nine months of 2026. That's encouraging, though it's only one completed full-year comparison and the small launch-period payment isn't a normal base year.
One detail I'd insist on keeping straight. The December 2025 payment included capital gains along with income. Counting all of it as recurring dividend growth would overstate the evidence. Its ordinary-income yield on a trailing basis was about 2.41% at the October 30 close, versus roughly 2.58% with that gain included, per the fund's distribution breakdown.
For me, TBG belongs on the research list as an active alternative. I'd want more completed years showing income growth holds up through portfolio changes and a weaker market, with competitive returns after the higher fee. A promising short record earns attention. It hasn't proven manager skill yet.
What can we reasonably expect from future dividends?
The companies inside these funds offer clues. Each one matters in proportion to the income it supplies. A 3% holding yielding 1% sends far less cash than a 3% holding yielding 5%. Weight dividend-growth estimates by asset value alone and you miss that.
Recent raises show why one blanket growth rate is risky. PepsiCo (PEP) raised its dividend about 4% in 2026. Microsoft went from $0.91 to $0.98 a quarter, about 8%, and Texas Instruments (TXN) from $1.42 to $1.52, roughly 7%. Each raise helps a fund only in proportion to the cash that holding supplies, and only once the money reaches the fund.
Our holdings-level cross-check gives a reason to look into a growth edge for DGRO. The inputs aren't strong enough to publish a reliable forecast for all five funds, though. Turnover, payout coverage, corporate decisions and payment timing all still matter. That's why the 4%, 6% and 7% rates above stay labeled as scenario inputs.
I'd sooner show you how the decision shifts under slower growth than hand you a precise forecast the evidence can't back up.
SCHD total return with dividends reinvested
SCHD returned 23.36% over the year to September 30, 2026, on NAV with dividends reinvested. Over five years it returned 9.48% annually, and over ten, 12.44%. That's the separate wealth-building test. NAV is the fund's assets minus liabilities per share, and these issuer-reported returns already reflect fund expenses.
Fund | One year | Five years, annualized | Ten years, annualized |
|---|---|---|---|
SCHD | 23.36% | 9.48% | 12.44% |
DGRO | 12.95% | 10.96% | 13.16% |
VIG | 9.77% | 10.72% | 12.86% |
VYM | 12.72% | 11.63% | 11.28% |
VOO, S&P 500 context | 15.70% | 13.75% | 15.29% |
Periods ended September 30, 2026. Longer periods annualized. Sources: SCHD, DGRO, VIG, VYM, VOO. Past returns don't predict future results.
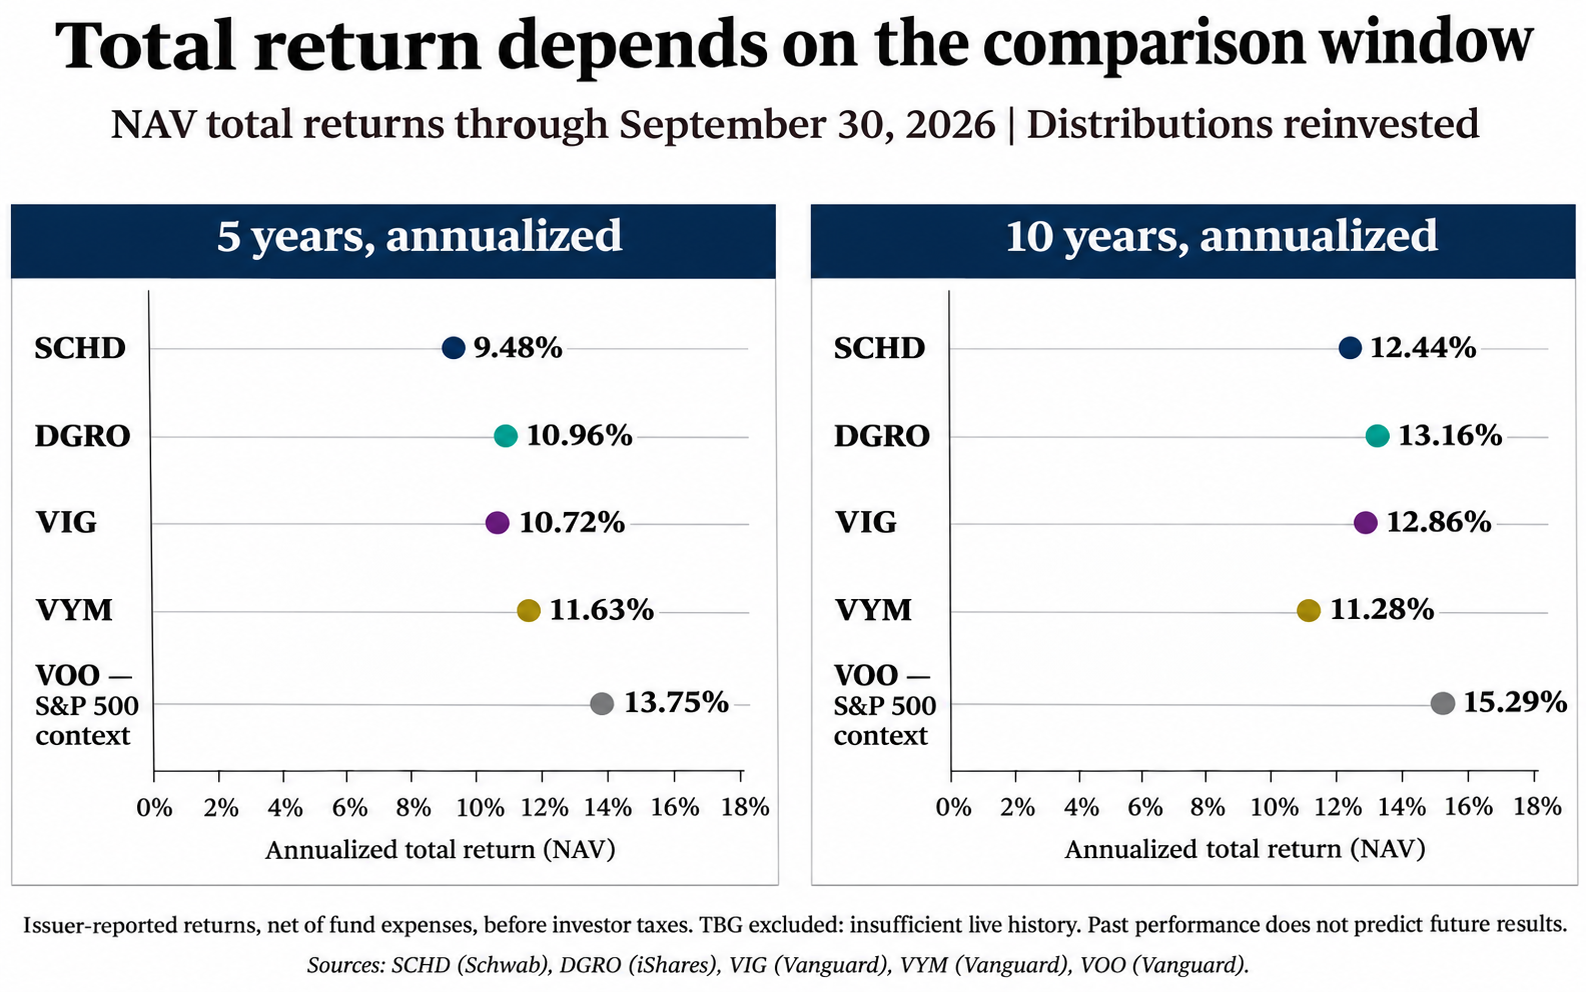
SCHD led over the latest year. Over five years every established alternative beat it, and over ten years DGRO and VIG did too while VYM didn't. The Vanguard S&P 500 ETF (VOO) beat all four over five and ten years. Dividend investors should look that opportunity cost in the eye, even if they still prefer the income profile.
TBG only has a one-year record on this basis, and its 11.99% NAV return was competitive with VIG's 9.77% but behind the other three established funds, according to TBG performance data.
Across the full shared trading window from November 7, 2023 through September 30, 2026, TBG gained about 56.8%. SCHD gained 56.2% and DGRO 62.1%. Those are cumulative market-price returns with distributions included, calculated separately from the NAV table. A window that short can't separate skill from a good stretch.
And these are still stock funds. From September 30, 2016 through September 30, 2026, the four established dividend ETFs fell roughly 32% to 35% at their worst, all during the 2020 selloff, and each recovered to its prior peak between August and December of that year, as the appendix shows. Collecting dividends can help you stay invested through a drop like that. It won't make a one-third decline in your account disappear.
Replace SCHD or combine it with another dividend ETF?
Owning two dividend funds isn't automatically redundant. Using full equity holdings from October 29, I calculate about 20.8% weighted overlap between SCHD and DGRO. That sums the smaller weight of each shared stock. It's a different measure from the share of names on both lists.
A simple 50/50 split would start at about a 2.39% trailing yield, or $239 a year per $10,000, which is roughly $55 less than SCHD alone in exchange for a different mix of exposures.
There's a wrinkle that's easy to miss. SCHD would still supply about 61.5% of the blend's starting income on half the capital. So even with my assumed 4% and 7% growth rates, the blend's first raise would be about 5.2%, below the simple 5.5% average. Income growth has to be weighted by the dollars producing it.
I'd look at SCHD plus DGRO before adding all five. VIG could also shift the exposure. I couldn't get complete current holdings for the same overlap math, though, so I'm not putting a comparable number on it. Every extra ticker should earn its spot by improving something specific.
Taxes can change the call too. In a taxable account, selling an appreciated position can trigger a gain, and dividends create a tax bill even when reinvested. Qualified dividends, other income payouts and capital gains each get different treatment under IRS dividend guidance. Inside an IRA, fund payouts generally aren't taxed year to year, while withdrawals depend on the account type and the rules for IRA distributions.
TBG can hold MLPs, but that doesn't make you a direct partner in them, since the TBG prospectus describes regulated-investment-company treatment and the fund's own tax reporting is what you'd go by.
Where I land
If you're spending dividends now, I'd need a specific reason to swap SCHD for a much lower-yielding fund. Its income edge is real at these prices. My worry would be treating its older growth record as a sure thing. I'd watch full-year payouts and the stocks producing the cash.
If you're reinvesting for ten years or more, DGRO is where I'd start for a wider spread of dividend payers and VIG deserves a look when its stricter selection fits your goals, though both mean accepting less income up front.
What would change my mind? For SCHD, a sustained slide in full-year payouts or weakening coverage at the companies supplying the cash. For DGRO or VIG, a spending timeline that moves up. Or holdings that mostly duplicate what you already own.
VYM fits an investor who wants a broad, inexpensive basket of dividend payers, while TBG fits someone willing to keep testing whether an active manager earns the higher fee over several more full years, including a rough market.
Before you change funds, write down the improvement you expect. Write down the drawback you're accepting, too. Then check both against the evidence a year from now. That beats another round of arguing over which dividend ETF is best.
Frequently asked questions
Does VIG's ten-year dividend-growth requirement guarantee a rising ETF payout?
No, because the ten-year rule applies to the companies in its index, while turnover and payment timing can make the ETF's own payout behave differently.
Is SCHD's dividend yield the same as its total return?
They measure different things. Yield is income divided by price, and total return adds price changes to distributions. The historical returns in this article assume reinvestment.
Is a higher SEC yield a promise of more cash next year?
Not necessarily. It annualizes net investment income from a recent standardized period and can differ a lot from trailing payouts when timing or portfolio mix changes.
Does dividend reinvestment make the income crossover happen sooner?
Reinvestment changes the math. It buys more shares, so future income depends on the prices you pay for them as well as payout growth. The spending example leaves it out on purpose so the income gap stays visible.
Are option-income funds direct substitutes for these dividend ETFs?
Their payouts can include option premiums and other components, so compare where the payout comes from, how long it can last, how much upside you keep and its tax character before treating a bigger check as a dividend-growth upgrade.
Sources and method
GNG rebuilt annual distributions by ex-dividend date, restated SCHD's pre-split payments once and separated TBG's identified capital gains. Issuer records support SCHD, DGRO and TBG. VIG and VYM histories use Yahoo Finance and S&P Global-sourced distribution records, spot-checked against Vanguard where possible. The full annual series, crossover sensitivity and risk tables are in the appendix.
Fund design and returns come from the linked issuer and index documents. Daily risk figures use Yahoo Finance adjusted market prices, separate from issuer NAV returns. Full holdings overlap was checked for SCHD and DGRO only. TBG data dated after the cutoff were left out.
For a closer look inside SCHD, see our holdings analysis. To explore reinvestment assumptions separately, use GNG's free DRIP calculator.
Appendix
These tables back up the numbers in the article, in US dollars and on the same dates as the sections above.
Annual dividend payments per share, 2015-2025
Year | SCHD | DGRO | VIG | VYM | TBG |
|---|---|---|---|---|---|
2015 | $0.382 | $0.647 | $1.819 | $2.149 | N/A |
2016 | $0.419 | $0.657 | $1.826 | $2.206 | N/A |
2017 | $0.449 | $0.705 | $1.919 | $2.401 | N/A |
2018 | $0.480 | $0.810 | $2.038 | $2.649 | N/A |
2019 | $0.575 | $0.931 | $2.134 | $2.842 | N/A |
2020 | $0.676 | $1.029 | $2.297 | $2.906 | N/A |
2021 | $0.750 | $1.072 | $2.661 | $3.096 | N/A |
2022 | $0.854 | $1.168 | $2.973 | $3.252 | N/A |
2023 | $0.886 | $1.316 | $3.208 | $3.478 | $0.130 |
2024 | $0.994 | $1.385 | $3.379 | $3.495 | $0.746 |
2025 | $1.048 | $1.451 | $3.558 | $3.501 | $0.867 |
Calendar years by ex-dividend date. SCHD split-adjusted. TBG income only, with 2023 a partial launch period. Older VIG and VYM inputs are rounded.
Annualized dividend growth through 2025
ETF | 1 year | 3 years | 5 years | 10 years |
|---|---|---|---|---|
SCHD | 5.35% | 7.06% | 9.15% | 10.61% |
DGRO | 4.73% | 7.49% | 7.11% | 8.40% |
VIG | 5.29% | 6.18% | 9.15% | 6.94% |
VYM | 0.18% | 2.49% | 3.79% | 5.00% |
TBG | 16.14% | N/A | N/A | N/A |
Compound annual growth from each start year to 2025. The four established funds had no annual decline from 2015 to 2025.
When each alternative catches SCHD in the spending example
Alternative vs SCHD at 4% growth | Assumed growth | First year annual income catches up | First year cumulative cash catches up |
|---|---|---|---|
DGRO | 7% | 18 | 28 |
VIG | 7% | 26 | 38 |
TBG | 6% | 12 | 20 |
VYM | 4% | None in 60 years | None in 60 years |
$10,000 in each fund at October 30 trailing yields, payouts spent, no sales or reinvestment. Growth rates are scenario inputs.
SCHD versus DGRO under different growth inputs
SCHD growth | DGRO growth | Annual income crossover | Cumulative cash crossover |
|---|---|---|---|
2% | 7% | Year 11 | Year 19 |
4% | 7% | Year 18 | Year 28 |
4% | 5% | Year 50 | None in 60 years |
4% | 4% | None in 60 years | None in 60 years |
6% | 7% | Year 51 | None in 60 years |
Ten-year cash at lower growth inputs
ETF | Lower assumed growth | Year 10 income | Total cash through year 10 |
|---|---|---|---|
SCHD | 2% | $352 | $3,226 |
DGRO | 4% | $262 | $2,213 |
VIG | 4% | $209 | $1,767 |
VYM | 2% | $268 | $2,458 |
TBG | 3% | $314 | $2,762 |
Growth of $10,000 at published NAV returns
Fund | After five years | After ten years |
|---|---|---|
SCHD | $15,728 | $32,300 |
DGRO | $16,820 | $34,429 |
VIG | $16,639 | $33,527 |
VYM | $17,334 | $29,119 |
VOO | $19,044 | $41,487 |
Built from rounded annualized returns ended September 30, 2026, so these approximate the issuers' own growth charts.
Shared trading window, November 7, 2023 to September 30, 2026
ETF | Cumulative total return | Annualized total return | Annualized volatility | Maximum drawdown |
|---|---|---|---|---|
SCHD | 56.21% | 16.65% | 13.13% | -16.12% |
DGRO | 62.11% | 18.15% | 11.71% | -14.03% |
VIG | 55.70% | 16.52% | 12.24% | -14.95% |
VYM | 63.64% | 18.53% | 12.43% | -14.46% |
TBG | 56.83% | 16.81% | 12.08% | -14.76% |
VOO | 81.40% | 22.83% | 14.91% | -18.69% |
Daily distribution-adjusted market prices, separate from the NAV returns above.
Worst ten-year drawdowns and recoveries
ETF | Annualized volatility | Maximum drawdown | Prior peak | Low | Recovered |
|---|---|---|---|---|---|
SCHD | 16.72% | -33.37% | Jan 23, 2020 | Mar 23, 2020 | Sep 2, 2020 |
DGRO | 16.56% | -35.10% | Feb 12, 2020 | Mar 23, 2020 | Nov 9, 2020 |
VIG | 16.00% | -31.72% | Feb 14, 2020 | Mar 23, 2020 | Aug 26, 2020 |
VYM | 16.27% | -35.21% | Jan 17, 2020 | Mar 23, 2020 | Dec 31, 2020 |
VOO | 18.01% | -33.99% | Feb 19, 2020 | Mar 23, 2020 | Aug 10, 2020 |
September 30, 2016 to September 30, 2026, daily adjusted closes. Recovery is the first close at or above the prior peak.
Disclosure: This article is educational research, not individualized investment or tax advice. The $10,000 examples are hypothetical. Investments can lose value, and distributions can change.
Sign in to leave a comment and join the discussion.
Sign Up Free