
GNG Research | October 10, 2026 | Holdings of the Schwab U.S. Dividend Equity exchange-traded fund (ETF) as of October 8, 2026
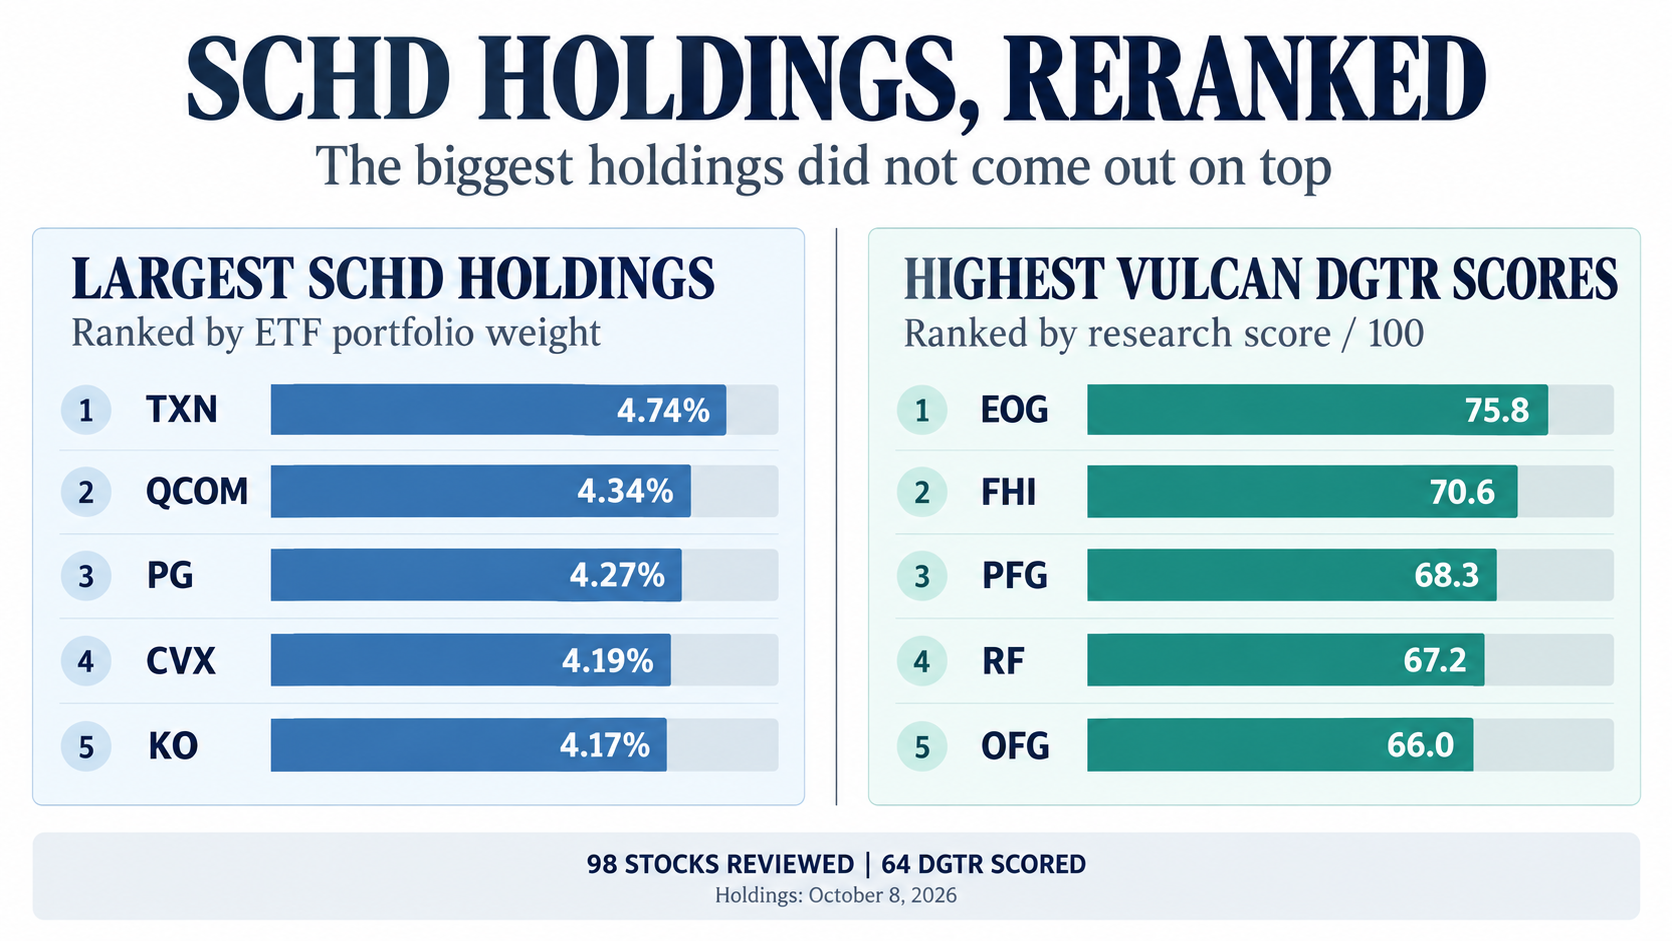
As of October 8, the five largest stocks in the Schwab U.S. Dividend Equity ETF (SCHD) were Texas Instruments (TXN), Qualcomm (QCOM), Procter & Gamble (PG), Chevron (CVX) and Coca-Cola (KO). All five have long dividend records, and together they hold 21.7% of the fund.
I ran all 98 SCHD holdings through Vulcan's Dividend Growth Total Return [DGTR] model. Those five finished 43rd, 40th, 53rd, 18th and 52nd.
"Schwab owns the wrong stocks" is the lazy conclusion, and I don't buy it. So let me ask a sharper question instead.
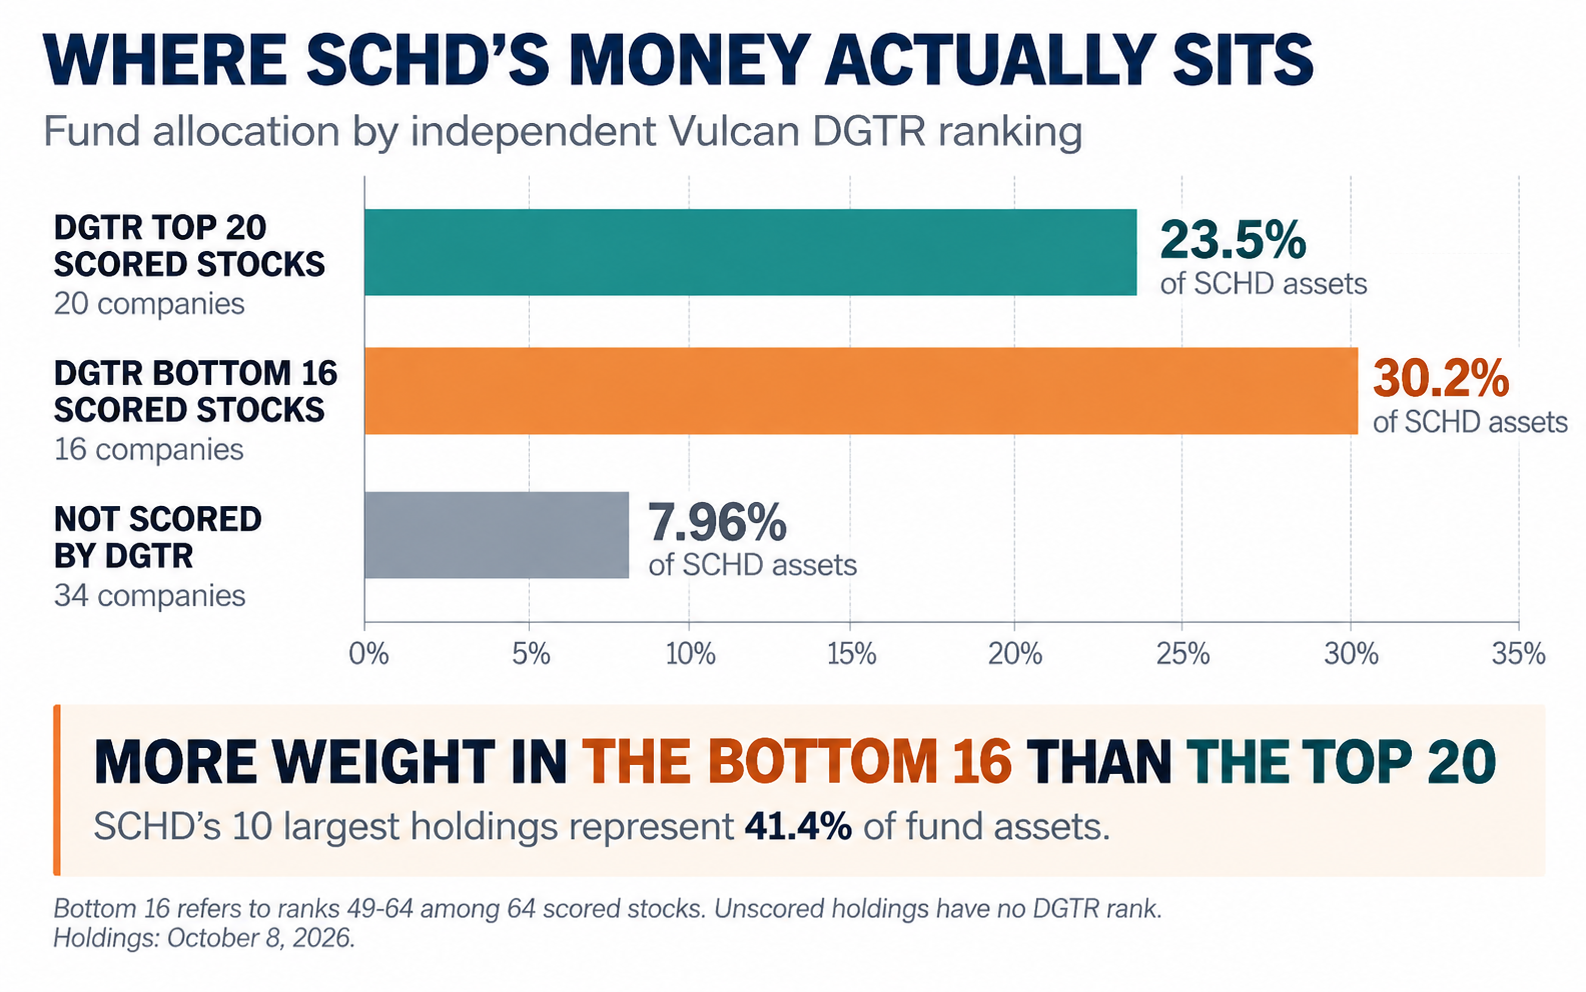
How much of SCHD's money sits in DGTR's top 20?
The answer is 23.5%. The 20 stocks DGTR scores highest make up less than a quarter of the fund, while the 16 lowest-ranked scored names carry 30.2%. That bottom group includes Coca-Cola, Procter & Gamble, Home Depot (HD), PepsiCo (PEP) and Amgen (AMGN), three of which sit in SCHD's top ten. Put another way, a dollar in SCHD buys more of DGTR's bottom 16 than its top 20.
SCHD holdings at a glance (October 8, 2026) | Value |
|---|---|
Stocks held | 98 |
Stocks scored by DGTR | 64 |
Screening exclusions | 34 (7.96% of assets) |
Weight of SCHD's 10 largest holdings | 41.4% |
Weight of DGTR's top 20 | 23.5% |
Weight of DGTR's 16 lowest-ranked scored stocks | 30.2% |
One number to keep in mind as you read: across the 64 stocks DGTR could score, the correlation between SCHD weight and DGTR score is -0.08. Statistically, that's about as close to no relationship as you'll find. The fund's biggest bets and my model's favorite names are close to independent of each other.
Before we go further, I want to be clear about what this exercise is. It's a second opinion on the same 98 stocks, built to answer a forward-looking question that SCHD's rules weren't designed to ask.
What SCHD is built to do
SCHD tracks the Dow Jones U.S. Dividend 100 Index. The index starts with companies that have a record of consistent dividend payments, then selects using four measures: indicated dividend yield, five-year dividend growth, return on equity and cash flow relative to total debt. Position sizes come from the index's construction rules, which is a different thing from a claim that the largest holding has the best expected return.
The index rebuilds itself once a year in March and re-weights its holdings every quarter in between. Schwab's own reconstitution report shows the March 20, 2026 rebuild added 25 stocks and removed 22, for 31% turnover, and cut energy from 23.5% of the fund to 16.3% while health care and technology gained the most. Then the late-September quarterly rebalance pushed Texas Instruments and Qualcomm to the top without adding or removing a single name. Same stocks, new pecking order.
That sequence matters for everything below. March's four largest additions, UnitedHealth Group (UNH), Abbott Laboratories (ABT), Procter & Gamble and Qualcomm, rank 30th, 49th, 53rd and 40th on DGTR. Some of the smaller additions landed near the top instead, with Principal Financial Group (PFG) third and Korn Ferry (KFY) sixth.
In plain terms, SCHD rewards a company for what it has already done. DGTR asks whether the growth, the valuation and the capital allocation still justify the next dollar you put in. The two questions overlap a lot, and the space between them is what this article is about.
The obvious objection is that SCHD's rules have a long public track record and my model doesn't. I can't point to years of live results yet. That's a fair hit, and it's the reason I'd treat everything below as a list of research priorities and nothing more.
How DGTR scores a dividend stock
Let's get the mechanics out of the way.
The results only make sense once you see what's being measured, so here are the five pillars DGTR combines, each scored out of 100.
DGTR pillar | Weight |
|---|---|
Dividend growth, funding and durability | 20% |
Fundamental and capital appreciation | 25% |
Business quality and economic value creation | 20% |
Transparent valuation and expectations | 20% |
Balance sheet, risk and capital allocation | 15% |
The inputs include forward estimates for dividends, earnings per share (EPS) and revenue, payout coverage measured against both earnings and free cash flow (FCF), return on invested capital (ROIC) or a sector-appropriate profitability measure, and conventional valuation multiples like forward price-to-earnings (P/E) and FCF yield. Dilution, leverage, volatility and shareholder yield round it out. Banks and insurers get their own quality and funding map, since an industrial-style cash flow test doesn't fit a lending business.
Growth credit is capped, so one recovery year can't run away with the score. A few things are deliberately left out, too. Wall Street price targets don't enter the score. Neither do proprietary fair-value or return-forecast models, and SCHD's position weights contribute exactly zero.
One clarification on terms. SCHD's dividend growth rate, the figure most people quote for the fund, measures its own past distributions. DGTR's dividend pillar looks forward, company by company, at whether each payout can keep growing.
I'll admit my first attempt was cruder. I blended a Chowder Rule score (current yield plus the five-year dividend growth rate) 65/35 with a forward-upside score, and it worked fine as a sketch. It just had no way to tell whether a dividend was funded or what I'd be paying for the growth, so I set it aside for the production model.
For the bigger picture of why dividend growth matters to me at all, I wrote about living on portfolio income in I Thought I Understood Income Investing. Then I Started Living On It.
The top 20 DGTR names inside SCHD
Let's look at the top of the list.
Rank | Company | Ticker | DGTR score | Yield | SCHD weight | Sector |
|---|---|---|---|---|---|---|
1 | EOG Resources | EOG | 75.8 | 2.9% | 1.98% | Energy |
2 | Federated Hermes | FHI | 70.6 | 2.7% | 0.10% | Financials |
3 | Principal Financial Group | PFG | 68.3 | 3.0% | 0.54% | Financials |
4 | Regions Financial | RF | 67.2 | 4.5% | 0.59% | Financials |
5 | OFG Bancorp | OFG | 66.0 | 2.8% | 0.05% | Financials |
6 | Korn Ferry | KFY | 65.9 | 3.0% | 0.09% | Industrials |
7 | Lockheed Martin | LMT | 65.4 | 2.7% | 2.62% | Industrials |
8 | Autoliv | ALV | 64.3 | 3.1% | 0.19% | Consumer Discretionary |
9 | Best Buy | BBY | 64.1 | 4.4% | 0.44% | Consumer Discretionary |
10 | Fifth Third Bancorp | FITB | 63.7 | 3.3% | 1.17% | Financials |
11 | Accenture | ACN | 62.7 | 3.1% | 3.24% | Information Technology |
12 | HF Sinclair | DINO | 62.7 | 1.9% | 0.47% | Energy |
13 | Banner Corp | BANR | 62.4 | 3.1% | 0.06% | Financials |
14 | ConocoPhillips | COP | 61.8 | 2.6% | 4.09% | Energy |
15 | CVB Financial | CVBF | 61.1 | 3.6% | 0.09% | Financials |
16 | East West Bancorp | EWBC | 61.0 | 2.6% | 0.44% | Financials |
17 | Blackstone | BX | 60.4 | 4.6% | 2.15% | Financials |
18 | Chevron | CVX | 60.4 | 3.4% | 4.19% | Energy |
19 | APA Corp | APA | 59.9 | 2.3% | 0.40% | Energy |
20 | Hershey | HSY | 59.6 | 3.6% | 0.60% | Consumer Staples |
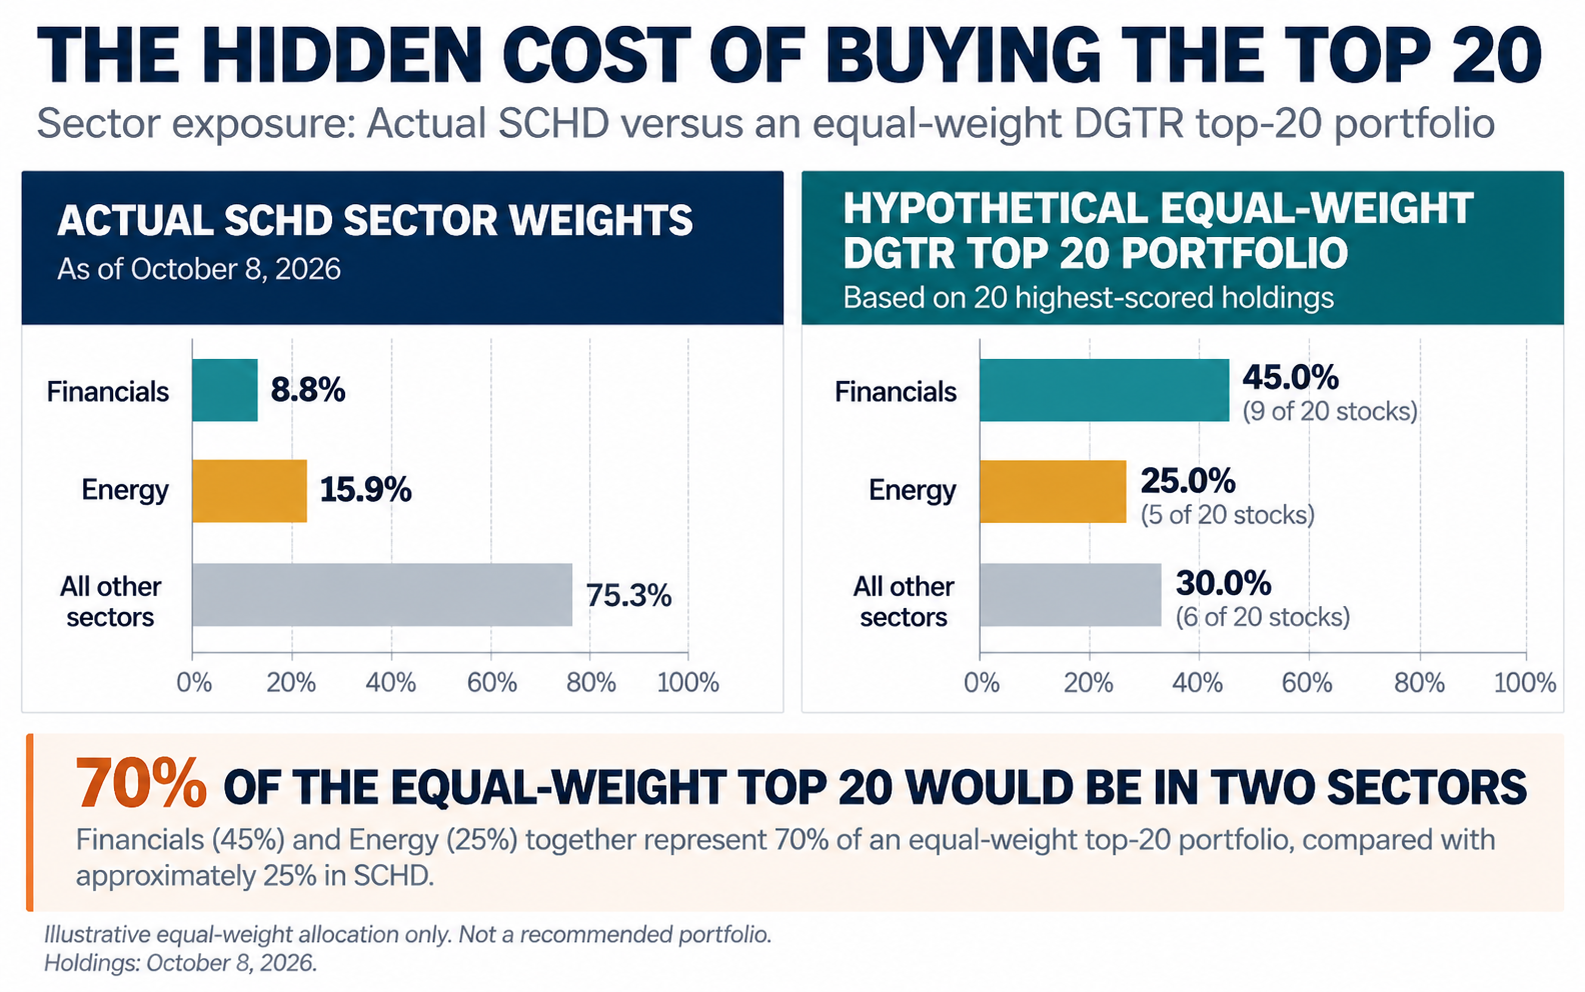
Nine of the 20 are financials and five are energy companies.
That's lopsided next to the fund itself. Financials account for 39 of SCHD's 98 stocks but only about 9% of its weight, and 21 of them are regional banks. Energy is roughly 16% of the fund, spread across just nine names.
Equal-weight this top 20 and you'd have 45% in financials and 25% in energy. I wouldn't own it that way, and I'll come back to sizing near the end.
EOG Resources (EOG) is the clearest leader.
It scored 75.8 and ranked in the top 13 on all five pillars, including third on dividends and fourth on valuation. The catch is that consensus expects roughly 40% EPS growth from here, a recovery estimate tied to oil and gas prices. Its 31% earnings payout leaves a lot of room if that recovery stalls. A high DGTR score won't protect anyone from a commodity cycle.
The financials, led by Federated Hermes (FHI), Principal Financial Group (PFG), Regions Financial (RF) and OFG Bancorp (OFG), rise because DGTR grades them on forward earnings, profitability, conventional valuation and capital returns. Run an industrial cash flow test on a bank and you'd penalize it for the way banks are built. OFG and Regions also placed in the top eight for valuation among the 64 scored names.
You might be wondering why a staffing firm and an auto-parts maker made the top ten. Korn Ferry (KFY) and Autoliv (ALV) both scored above 87 on the dividend pillar and above 65 on valuation, which is a combination the bigger household names couldn't match. Lockheed Martin (LMT) got there differently, ranking first of all 64 scored stocks on business quality.
I'd treat every name here as a research priority. None of them is an automatic purchase.
SCHD's top holdings lose on price
So why do SCHD's heaviest stocks rank where they do? I expected weak dividend growth to be the culprit, and I was wrong.
DGTR pillar (average score / 100) | Ten largest scored SCHD holdings | Other 54 scored holdings |
|---|---|---|
Dividend growth, funding and durability | 75.9 | 72.4 |
Fundamental and capital appreciation | 54.1 | 49.9 |
Business quality | 52.7 | 49.7 |
Valuation and expectations | 33.3 | 54.6 |
Balance sheet and risk | 47.7 | 51.1 |
Total DGTR score | 53.1 | 55.5 |
The ten largest scored holdings average slightly better on dividends than the rest of the fund, 75.9 against 72.4. They're also a touch ahead on appreciation and business quality. Almost all of the shortfall shows up in one pillar, valuation, where they average 33.3 against 54.6.
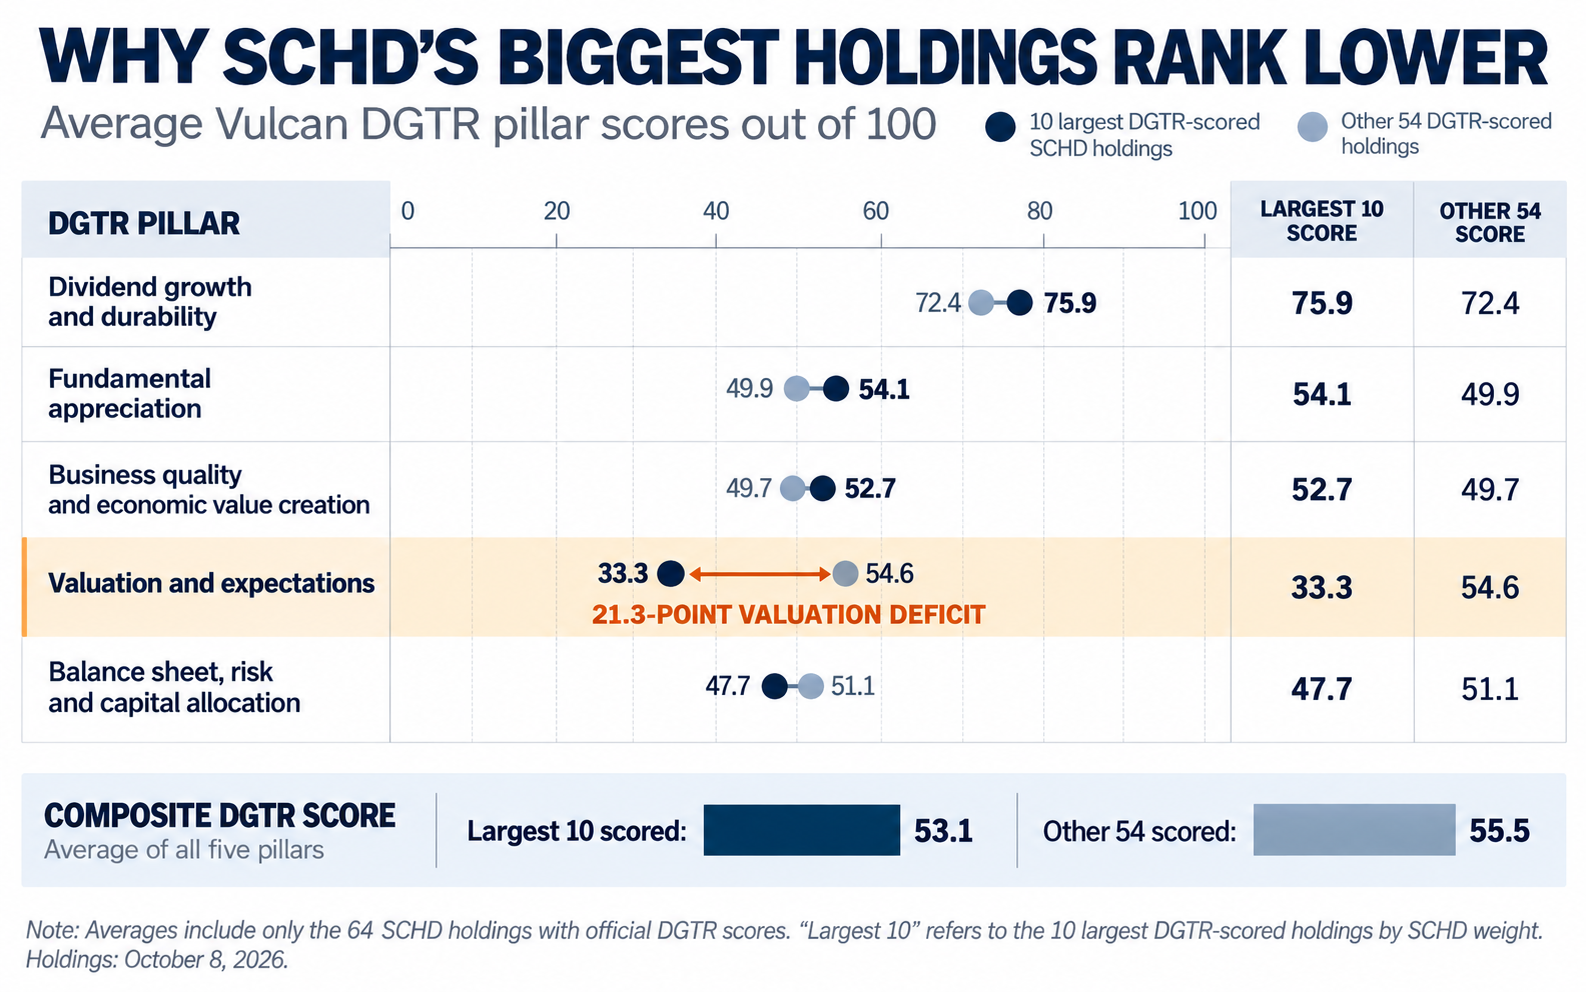
My read is that the market already knows these are excellent dividend payers and prices them that way.
Texas Instruments is the extreme case.
It ranked first of 64 on appreciation, because consensus expects 43.5% EPS growth, and dead last on valuation with a pillar score of 2.6. My guess, and I'd flag it as a guess, is that the stock is priced on earnings that haven't recovered yet, so its multiples look stretched today and could look ordinary if those estimates land. Coca-Cola ranked 62nd on valuation and Procter & Gamble 60th. Procter & Gamble also ranked fifth on balance sheet and risk, a steadiness that a single ranking undersells.
Here's the same lens across SCHD's top 25 holdings by weight.
SCHD weight rank | Holding | SCHD weight | DGTR rank | DGTR score | Dividend pillar rank | Valuation pillar rank |
|---|---|---|---|---|---|---|
1 | Texas Instruments (TXN) | 4.74% | 43 | 51.6 | 49 of 64 | 64 of 64 |
2 | Qualcomm (QCOM) | 4.34% | 40 | 52.8 | 27 of 64 | 51 of 64 |
3 | Procter & Gamble (PG) | 4.27% | 53 | 48.9 | 31 of 64 | 60 of 64 |
4 | Chevron (CVX) | 4.19% | 18 | 60.4 | 26 of 64 | 29 of 64 |
5 | Coca-Cola (KO) | 4.17% | 52 | 48.9 | 19 of 64 | 62 of 64 |
6 | ConocoPhillips (COP) | 4.09% | 14 | 61.8 | 14 of 64 | 28 of 64 |
7 | Merck (MRK) | 3.93% | Not scored | - | - | - |
8 | UnitedHealth Group (UNH) | 3.89% | 30 | 56.3 | 17 of 64 | 40 of 64 |
9 | Home Depot (HD) | 3.89% | 55 | 48.0 | 35 of 64 | 52 of 64 |
10 | Verizon Communications (VZ) | 3.87% | 36 | 54.1 | 48 of 64 | 11 of 64 |
11 | Amgen (AMGN) | 3.86% | 56 | 47.9 | 22 of 64 | 56 of 64 |
12 | PepsiCo (PEP) | 3.83% | 50 | 49.4 | 46 of 64 | 42 of 64 |
13 | Abbott Laboratories (ABT) | 3.74% | 49 | 49.5 | 28 of 64 | 57 of 64 |
14 | Accenture (ACN) | 3.24% | 11 | 62.7 | 34 of 64 | 18 of 64 |
15 | Bristol-Myers Squibb (BMY) | 3.09% | 44 | 51.6 | 41 of 64 | 16 of 64 |
16 | Altria Group (MO) | 3.03% | 35 | 54.2 | 61 of 64 | 27 of 64 |
17 | Automatic Data Processing (ADP) | 2.73% | 21 | 59.5 | 11 of 64 | 58 of 64 |
18 | Lockheed Martin (LMT) | 2.62% | 7 | 65.4 | 21 of 64 | 33 of 64 |
19 | Blackstone (BX) | 2.15% | 17 | 60.4 | 2 of 64 | 50 of 64 |
20 | EOG Resources (EOG) | 1.98% | 1 | 75.8 | 3 of 64 | 4 of 64 |
21 | Comcast (CMCSA) | 1.91% | 28 | 56.4 | 47 of 64 | 1 of 64 |
22 | Schlumberger (SLB) | 1.85% | 54 | 48.2 | 25 of 64 | 38 of 64 |
23 | United Parcel Service (UPS) | 1.79% | Not scored | - | - | - |
24 | Target (TGT) | 1.78% | 33 | 55.7 | 39 of 64 | 35 of 64 |
25 | Fastenal (FAST) | 1.47% | 45 | 50.6 | 56 of 64 | 63 of 64 |
Does that mean an SCHD holder should sell Coca-Cola? I wouldn't read it that way. Defensive franchises bring lower earnings cyclicality and diversification that a cross-sectional score doesn't capture. The ranking only suggests that new money buys less future growth per dollar there than it might at Fifth Third Bancorp (FITB), which scored 77.4 on valuation.
ConocoPhillips (COP) at 14th and Chevron at 18th are the big holdings that do rank well, and I'd handle both with care. Consensus expects Chevron's EPS to grow about 72% and ConocoPhillips' about 38%, and recovery estimates like those can look excellent near a cyclical trough before disappointing if crude and gas prices turn. The growth cap limits how much credit they earn, but I would still normalize mid-cycle earnings and FCF before putting real money behind either.
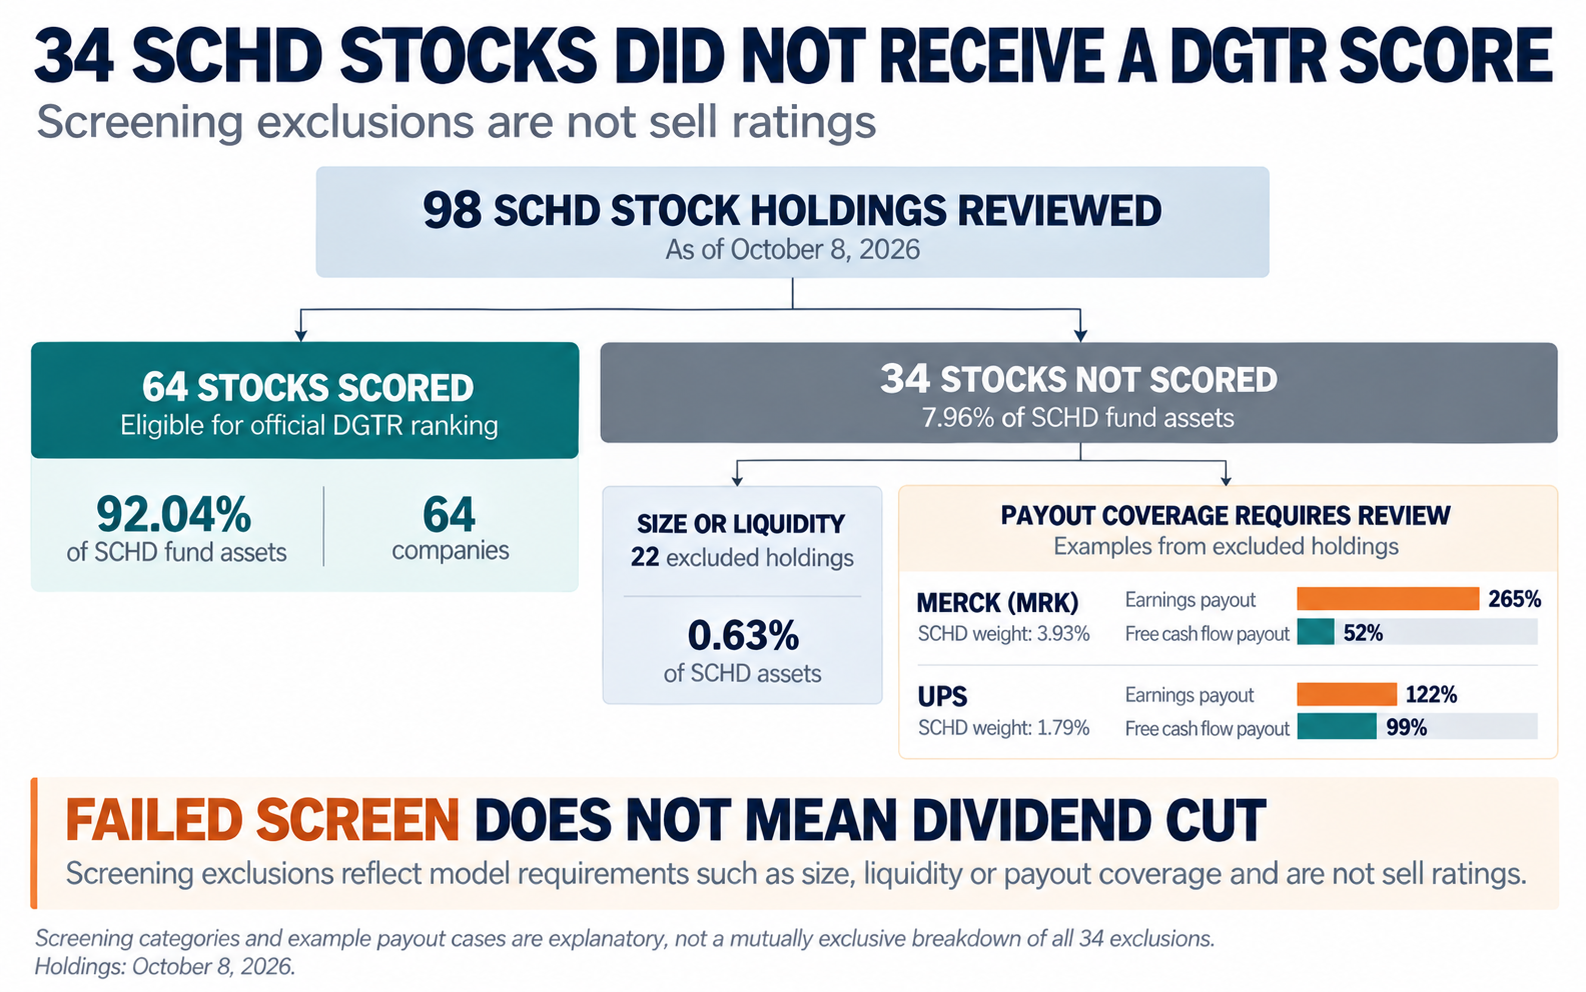
The 34 stocks DGTR won't score
The 34 unscored names hold 7.96% of fund assets, and they aren't 34 sell ratings. DGTR requires at least $2 billion in market cap, $10 million in average daily dollar volume where that's known, a yield between 1% and 8%, sustainable payout coverage, and enough core data to score. Most of the exclusions are tiny. Twenty-two names fail on size or liquidity, 13 of them regional banks, and together they're only 0.63% of the fund.
If you own SCHD partly for Merck (MRK), you'd reasonably want to know whether its exclusion is a warning. At 3.93% of SCHD it's the fund's seventh-largest position, and it fails because its reported earnings payout sits at roughly 265%. Its dividends absorb only about 52% of free cash flow, though, which is why I'd treat this as a research stop. Nothing in the data says the dividend is about to be cut.
United Parcel Service (UPS), at 1.79% of the fund, fails the same earnings-payout gate at about 122%, and its cash picture is tighter, with dividends consuming roughly 99% of free cash flow. Of the two, UPS is the one I'd look at harder. DGTR does allow a documented normalized-earnings exception, but I'm not going to invent one to get a familiar name over the line.
Dividend history needs the same care. A drop in a variable or supplemental dividend isn't a cut to the regular rate, so I checked the regular dividend history for EOG and the fixed-versus-variable payments for Devon Energy (DVN) by hand before letting either keep its score. Ford Motor (F) still carries a REVIEW status, because its flags for a recent reported cut and a cash flow funding conflict haven't been resolved. Any other apparent cuts in the data stay on the review list until someone checks them.
Five risks that could reshuffle the ranking
Let me be specific about what would change my mind, since a ranking without triggers is only half useful.
Oil and gas prices. Five of the top 20 are energy companies, and their scores lean on recovery estimates, with consensus expecting about 40% EPS growth for EOG and 72% for Chevron. If those estimates get cut in half, I think several energy names lose their top-20 spots on the next run.
Financial-sector earnings. Nine of the top 20 are financials, and the hard line is an earnings payout above 100%, which removes a name from scoring entirely. Today the highest payout among those nine is CVB Financial (CVBF) at about 68%, so a credit cycle would need to bite hard before anyone crosses it.
Thin estimate coverage. Four scored financials carry a thin-consensus flag: Federal Agricultural Mortgage (AGM), Old Republic International (ORI), Cohen & Steers (CNS) and Erie Indemnity (ERIE). With few estimates behind their forward numbers, a single revision may move them several places in either direction. I'd treat their ranks as softer than the rest.
Valuation catching up to the big defensives. Texas Instruments sits at 2.6 on valuation. If the 43.5% EPS growth that consensus expects shows up, its forward multiple compresses and its rank could climb well into the top half without the share price moving at all.
Dividend-data errors. Ford is already flagged, and EOG and Devon kept their scores only after manual checks. A confirmed cut to the regular dividend at any top-20 name would remove it, and raw data doesn't reliably separate regular payments from variable ones without a human looking. That's why every top-20 name still gets a manual dividend check from me before any purchase.
Is SCHD still worth owning? How I'd use this list
I'd give three different readers three different answers.
If you own SCHD for simplicity, keep owning it. It's a coherent dividend-quality strategy that spares you 98 separate company reviews, and nothing in this ranking argues that the index is broken. I suspect plenty of readers can stop right there, and that's a perfectly good outcome.
If you're building an income sleeve from individual names, the top 20 offers yields from 1.9% to 4.6%, with Blackstone (BX) at 4.6%, Regions Financial at 4.5% and Best Buy (BBY) at 4.4% at the high end. Keep in mind that Blackstone's dividend floats with its distributable earnings, so that yield moves around. Best Buy also brings retail cyclicality, which argues for a smaller position.
If dividend growth is the priority, consensus expects the fastest increases in the top 20 from East West Bancorp (EWBC) at about 24%, Blackstone and APA Corp (APA) at about 15% each, and OFG at about 14%. Those are estimates, and estimates for a single year can swing.
Whichever group you're in, size it like a research list. My own rule caps any single stock at 1% to 2% of the portfolio, and with 45% of an equal-weight top 20 sitting in financials, I'd set a sector ceiling before buying anything.
One more honest limit. DGTR is a screen, so it doesn't produce buy zones or invalidation prices, and any name I act on gets a full Vulcan valuation run first. That's where the entry levels come from.
How DGTR fits inside a whole portfolio is a bigger topic, and I'm working through it in a series on my own dividend sleeve that includes The Barbell Behind My Dividend Sleeve.
The complete SCHD holdings list, with DGTR ranks
DGTR ranks are official only for the 64 scored companies, so entries 65 through 98 are sorted by SCHD weight and carry no rank because they're screening exclusions and shouldn't be read as a bottom-34 list.
# | DGTR rank | Ticker | Company | Score | Yield | SCHD weight | Sector | Industry | Status |
|---|---|---|---|---|---|---|---|---|---|
1 | 1 | EOG | EOG Resources | 75.8 | 2.9% | 1.98% | Energy | Oil & Gas Exploration & Production | PASS |
2 | 2 | FHI | Federated Hermes | 70.6 | 2.7% | 0.10% | Financials | Asset Management | PASS |
3 | 3 | PFG | Principal Financial Group | 68.3 | 3.0% | 0.54% | Financials | Asset Management | PASS |
4 | 4 | RF | Regions Financial | 67.2 | 4.5% | 0.59% | Financials | Banks - Regional | PASS |
5 | 5 | OFG | OFG Bancorp | 66.0 | 2.8% | 0.05% | Financials | Banks - Regional | PASS |
6 | 6 | KFY | Korn Ferry | 65.9 | 3.0% | 0.09% | Industrials | Staffing & Employment Services | PASS |
7 | 7 | LMT | Lockheed Martin | 65.4 | 2.7% | 2.62% | Industrials | Aerospace & Defense | PASS |
8 | 8 | ALV | Autoliv | 64.3 | 3.1% | 0.19% | Consumer Discretionary | Auto Parts | PASS |
9 | 9 | BBY | Best Buy | 64.1 | 4.4% | 0.44% | Consumer Discretionary | Specialty Retail | PASS |
10 | 10 | FITB | Fifth Third Bancorp | 63.7 | 3.3% | 1.17% | Financials | Banks - Regional | PASS |
11 | 11 | ACN | Accenture | 62.7 | 3.1% | 3.24% | Information Technology | Information Technology Services | PASS |
12 | 12 | DINO | HF Sinclair | 62.7 | 1.9% | 0.47% | Energy | Oil & Gas Refining & Marketing | PASS |
13 | 13 | BANR | Banner Corp | 62.4 | 3.1% | 0.06% | Financials | Banks - Regional | PASS |
14 | 14 | COP | ConocoPhillips | 61.8 | 2.6% | 4.09% | Energy | Oil & Gas Exploration & Production | PASS |
15 | 15 | CVBF | CVB Financial | 61.1 | 3.6% | 0.09% | Financials | Banks - Regional | PASS |
16 | 16 | EWBC | East West Bancorp | 61.0 | 2.6% | 0.44% | Financials | Banks - Regional | PASS |
17 | 17 | BX | Blackstone | 60.4 | 4.6% | 2.15% | Financials | Asset Management | PASS |
18 | 18 | CVX | Chevron | 60.4 | 3.4% | 4.19% | Energy | Oil & Gas Integrated | PASS |
19 | 19 | APA | APA Corp | 59.9 | 2.3% | 0.40% | Energy | Oil & Gas Exploration & Production | PASS |
20 | 20 | HSY | Hershey | 59.6 | 3.6% | 0.60% | Consumer Staples | Confectioners | PASS |
21 | 21 | ADP | Automatic Data Processing | 59.5 | 2.6% | 2.73% | Industrials | Software - Application | PASS |
22 | 22 | BR | Broadridge Financial Solutions | 59.5 | 2.7% | 0.48% | Industrials | Information Technology Services | PASS |
23 | 23 | DVN | Devon Energy | 58.7 | 2.7% | 1.37% | Energy | Oil & Gas Exploration & Production | PASS |
24 | 24 | AGM | Federal Agricultural Mortgage | 58.6 | 3.1% | 0.05% | Financials | Credit Services | PASS |
25 | 25 | ORI | Old Republic International | 57.3 | 3.4% | 0.22% | Financials | Insurance - Property & Casualty | PASS |
26 | 26 | BAH | Booz Allen Hamilton | 57.2 | 3.4% | 0.22% | Industrials | Consulting Services | PASS |
27 | 27 | CINF | Cincinnati Financial | 56.5 | 2.3% | 0.64% | Financials | Insurance - Property & Casualty | PASS |
28 | 28 | CMCSA | Comcast | 56.4 | 6.1% | 1.91% | Communication Services | Telecom Services | PASS |
29 | 29 | COLB | Columbia Banking System | 56.3 | 5.2% | 0.20% | Financials | Banks - Regional | PASS |
30 | 30 | UNH | UnitedHealth Group | 56.3 | 2.5% | 3.89% | Health Care | Healthcare Plans | PASS |
31 | 31 | DRI | Darden Restaurants | 56.0 | 3.3% | 0.58% | Consumer Discretionary | Restaurants | PASS |
32 | 32 | MUR | Murphy Oil | 55.7 | 3.7% | 0.13% | Energy | Oil & Gas Exploration & Production | PASS |
33 | 33 | TGT | Target | 55.7 | 3.0% | 1.78% | Consumer Staples | Discount Stores | PASS |
34 | 34 | MC | Moelis & Co | 54.8 | 4.6% | 0.11% | Financials | Capital Markets | PASS |
35 | 35 | MO | Altria Group | 54.2 | 6.6% | 3.03% | Consumer Staples | Tobacco | PASS |
36 | 36 | VZ | Verizon Communications | 54.1 | 6.2% | 3.87% | Communication Services | Telecom Services | PASS |
37 | 37 | TROW | T. Rowe Price Group | 54.1 | 4.9% | 0.56% | Financials | Asset Management | PASS |
38 | 38 | CNS | Cohen & Steers | 53.5 | 3.7% | 0.05% | Financials | Asset Management | PASS |
39 | 39 | SNA | Snap-on | 53.0 | 2.6% | 0.47% | Industrials | Tools & Accessories | PASS |
40 | 40 | QCOM | Qualcomm | 52.8 | 2.0% | 4.34% | Information Technology | Semiconductors | PASS |
41 | 41 | OZK | Bank OZK | 52.1 | 4.1% | 0.12% | Financials | Banks - Regional | PASS |
42 | 42 | MZTI | The Marzetti Company | 51.8 | 4.0% | 0.05% | Consumer Staples | Packaged Foods | PASS |
43 | 43 | TXN | Texas Instruments | 51.6 | 2.0% | 4.74% | Information Technology | Semiconductors | PASS |
44 | 44 | BMY | Bristol-Myers Squibb | 51.6 | 4.1% | 3.09% | Health Care | Drug Manufacturers - General | PASS |
45 | 45 | FAST | Fastenal | 50.6 | 2.1% | 1.47% | Industrials | Industrial Distribution | PASS |
46 | 46 | IPAR | Inter Parfums | 49.7 | 2.9% | 0.05% | Consumer Staples | Household & Personal Products | PASS |
47 | 47 | F | Ford Motor | 49.6 | 4.9% | 1.22% | Consumer Discretionary | Auto Manufacturers | REVIEW |
48 | 48 | PAYX | Paychex | 49.6 | 4.7% | 0.85% | Industrials | Software - Application | PASS |
49 | 49 | ABT | Abbott Laboratories | 49.5 | 2.6% | 3.74% | Health Care | Medical Devices | PASS |
50 | 50 | PEP | PepsiCo | 49.4 | 4.7% | 3.83% | Consumer Staples | Beverages - Non-Alcoholic | PASS |
51 | 51 | FNF | Fidelity National Financial | 49.3 | 5.3% | 0.26% | Financials | Insurance - Specialty | PASS |
52 | 52 | KO | Coca-Cola | 48.9 | 2.5% | 4.17% | Consumer Staples | Beverages - Non-Alcoholic | PASS |
53 | 53 | PG | Procter & Gamble | 48.9 | 3.0% | 4.27% | Consumer Staples | Household & Personal Products | PASS |
54 | 54 | SLB | Schlumberger | 48.2 | 2.4% | 1.85% | Energy | Oil & Gas Equipment & Services | PASS |
55 | 55 | HD | Home Depot | 48.0 | 3.3% | 3.89% | Consumer Discretionary | Home Improvement Retail | PASS |
56 | 56 | AMGN | Amgen | 47.9 | 2.5% | 3.86% | Health Care | Drug Manufacturers - General | PASS |
57 | 57 | KMB | Kimberly-Clark | 47.4 | 5.4% | 0.83% | Consumer Staples | Household & Personal Products | PASS |
58 | 58 | ERIE | Erie Indemnity | 43.6 | 2.6% | 0.15% | Financials | Insurance Brokers | PASS |
59 | 59 | WSO | Watsco | 43.6 | 4.4% | 0.25% | Industrials | Industrial Distribution | PASS |
60 | 60 | ADM | Archer-Daniels-Midland | 42.3 | 2.6% | 1.01% | Consumer Staples | Farm Products | PASS |
61 | 61 | MSM | MSC Industrial Direct | 39.9 | 2.7% | 0.15% | Industrials | Industrial Distribution | PASS |
62 | 62 | OKE | ONEOK | 38.1 | 4.9% | 1.45% | Energy | Oil & Gas Midstream | PASS |
63 | 63 | PAG | Penske Automotive Group | 37.0 | 2.8% | 0.09% | Consumer Discretionary | Auto & Truck Dealerships | PASS |
64 | 64 | GIS | General Mills | 35.2 | 7.7% | 0.44% | Consumer Staples | Packaged Foods | PASS |
65 | - | MRK | Merck | - | 2.4% | 3.93% | Health Care | Drug Manufacturers - General | OUT |
66 | - | UPS | United Parcel Service | - | 7.0% | 1.79% | Industrials | Integrated Freight & Logistics | OUT |
67 | - | ARES | Ares Management | - | 4.6% | 0.66% | Financials | Asset Management | OUT |
68 | - | AFG | American Financial Group | - | N/A | 0.25% | Financials | No GNG data | OUT |
69 | - | M | Macy's | - | N/A | 0.15% | Consumer Discretionary | No GNG data | OUT |
70 | - | MTN | Vail Resorts | - | 6.4% | 0.13% | Consumer Discretionary | Resorts & Casinos | OUT |
71 | - | NXST | Nexstar Media Group | - | 4.7% | 0.12% | Communication Services | Broadcasting | OUT |
72 | - | CWEN | Clearway Energy (Class C) | - | 6.5% | 0.09% | Utilities | Utilities - Renewable | OUT |
73 | - | RHI | Robert Half | - | 6.2% | 0.09% | Industrials | Staffing & Employment Services | OUT |
74 | - | APAM | Artisan Partners Asset Management | - | 8.9% | 0.06% | Financials | Asset Management | OUT |
75 | - | WU | Western Union | - | 15.6% | 0.05% | Financials | Credit Services | OUT |
76 | - | CHCO | City Holding | - | 2.5% | 0.05% | Financials | Banks - Regional | OUT |
77 | - | GABC | German American Bancorp | - | 2.5% | 0.05% | Financials | Banks - Regional | OUT |
78 | - | NSP | Insperity | - | 4.9% | 0.05% | Industrials | Staffing & Employment Services | OUT |
79 | - | STBA | S&T Bancorp | - | 3.0% | 0.04% | Financials | Banks - Regional | OUT |
80 | - | NBHC | National Bank Holdings | - | 3.3% | 0.04% | Financials | Banks - Regional | OUT |
81 | - | SRCE | 1st Source | - | 2.1% | 0.04% | Financials | Banks - Regional | OUT |
82 | - | LKFN | Lakeland Financial | - | 3.6% | 0.04% | Financials | Banks - Regional | OUT |
83 | - | BKE | Buckle | - | 3.3% | 0.03% | Consumer Discretionary | Apparel Retail | OUT |
84 | - | FLO | Flowers Foods | - | 9.0% | 0.03% | Consumer Staples | Packaged Foods | OUT |
85 | - | PFBC | Preferred Bank | - | 3.0% | 0.03% | Financials | Banks - Regional | OUT |
86 | - | CNA | CNA Financial | - | 4.2% | 0.03% | Financials | Insurance - Property & Casualty | OUT |
87 | - | WEN | Wendy's | - | 4.5% | 0.03% | Consumer Discretionary | Restaurants | OUT |
88 | - | CPF | Central Pacific Financial | - | 3.3% | 0.02% | Financials | Banks - Regional | OUT |
89 | - | HAFC | Hanmi Financial | - | 3.6% | 0.02% | Financials | Banks - Regional | OUT |
90 | - | ORRF | Orrstown Financial Services | - | 2.9% | 0.02% | Financials | Banks - Regional | OUT |
91 | - | VRTS | Virtus Investment Partners | - | 7.2% | 0.02% | Financials | Asset Management | OUT |
92 | - | IBCP | Independent Bank Corp | - | 3.1% | 0.02% | Financials | Banks - Regional | OUT |
93 | - | THFF | First Financial Corp (Indiana) | - | 3.0% | 0.02% | Financials | Banks - Regional | OUT |
94 | - | CCBG | Capital City Bank Group | - | 2.2% | 0.02% | Financials | Banks - Regional | OUT |
95 | - | EBF | Ennis | - | 4.4% | 0.01% | Industrials | Specialty Business Services | OUT |
96 | - | AMSF | AMERISAFE | - | 6.9% | 0.01% | Financials | Insurance - Specialty | OUT |
97 | - | ETD | Ethan Allen Interiors | - | 7.4% | 0.01% | Consumer Discretionary | Furnishings, Fixtures & Appliances | OUT |
98 | - | OXM | Oxford Industries | - | 11.0% | 0.01% | Consumer Discretionary | Apparel Manufacturing | OUT |
PASS means the stock cleared production screening and the available dividend-evidence checks. REVIEW means the score is valid but dividend-data normalization is unresolved, and OUT means ineligible or insufficient data, with no score assigned. A PASS is not a full security-level approval or an action rating.
Final perspective
I went in expecting the gap between SCHD and DGTR to come from dividend growth. It came from price, with the fund's ten largest scored holdings beating the rest on dividends and trailing by more than 20 points on valuation. The fair question is whether any of this beats simply holding SCHD. I can't answer that yet, because without archived historical estimates nobody can show these ranks would have outperformed the fund.
That gap gives me a list of questions worth researching.
It doesn't give me permission to skip the research.
Quick answers on SCHD holdings
How many stocks does SCHD hold?
As of October 8, 2026, SCHD held 98 stocks plus four cash, money market and futures positions. Its 10 largest holdings made up about 41.4% of the fund.
What are SCHD's top 10 holdings?
By weight on October 8, they were Texas Instruments, Qualcomm, Procter & Gamble, Chevron, Coca-Cola, ConocoPhillips, Merck, UnitedHealth Group, Home Depot and Verizon Communications (VZ). Their weights ran from 4.74% down to 3.87%.
Which SCHD stocks rank highest on Vulcan DGTR?
The top five were EOG Resources, Federated Hermes, Principal Financial Group, Regions Financial and OFG Bancorp. DGTR is a research screen, so a high rank is a reason to dig in and not a buy signal on its own.
When does SCHD change its holdings?
The index behind SCHD reconstitutes once a year, and the 2026 rebuild took place on March 20, adding 25 stocks and removing 22. Weights are reset each quarter in between, most recently in late September, without adding or removing names.
Data, methodology and disclosures
Item | Detail |
|---|---|
SCHD holdings | Schwab Asset Management, holdings as of October 8, 2026: https://www.schwabassetmanagement.com/allholdings/schd |
Index methodology | S&P Dow Jones Indices, Dow Jones U.S. Dividend 100: https://www.spglobal.com/spdji/en/education/article/reflecting-on-15-years-with-15-facts-the-dow-jones-us-dividend-100-index/ |
DGTR specification | Vulcan Income and DGTR Runbook v2.3.3-391, DGTR v1.3 production Total Return profile, five pillars weighted 20/25/20/20/15 |
Source data | GNG Research 391-column research export, processed October 10, 2026 |
EOG dividend cross-check | |
2026 reconstitution | Schwab Asset Management, SCHD & SCHY Annual 2026 Reconstitution (March 2026) |
September 2026 rebalance | Third-party holdings comparisons, cross-checked against each other: https://topdividendetfs.com/schd-q3-2026-rebalance and https://stockwirex.com/?p=46627 |
Sector labels | Schwab holdings file sectors (GICS). Industry labels come from the GNG Research data set. |
Devon dividend cross-check | https://investors.devonenergy.com/investors/stock-information/dividend-history/default.aspx |
Universe | 98 stock holdings scored or screened. Four non-equity positions (cash, money market and futures) were not evaluated. |
Forward figures are consensus estimates from the GNG Research data set. They're forecasts, and they aren't management guidance or reported results. Ranks and scores are relative to the 98 SCHD stocks only and shouldn't be compared numerically with a DGTR run on a different universe without re-normalizing.
A screen result is not an issuer-specific valuation, buy-zone or action analysis. Payout, dividend-event and earnings normalization require security-level research before any decision, and none of the returns, dividends or estimates discussed here is a promise.
Sign in to leave a comment and join the discussion.
Sign Up Free