

Microsoft, Amazon, Taiwan Semiconductor, Mastercard, and Intuitive Surgical are five candidates I would research when looking for the best growth stocks for the next 10 years. Each has an established business, a plausible path to further expansion, and a different question that could undermine the investment case. The price you pay still decides how much of that growth reaches your portfolio.
Finding the best stocks for the next 10 years starts with deciding what could keep a business growing after its current success. I used GNG's stock database and a repeatable screen, then selected five businesses for closer examination across cloud computing, semiconductor manufacturing, payments, and healthcare. These are research candidates, not a claim that they will be the five best performers or that all five are buys at today's prices.
The useful part is being able to repeat the work yourself. You can compare the companies in GNG Analyst, open a ticker from its widgets, and move an AI-generated screen into the Research Terminal with its filters and columns.
Five growth stocks worth researching for a decade
Company | Ticker | Long-term opportunity | Question I would investigate first |
|---|---|---|---|
Microsoft | MSFT | Cloud services and enterprise software | Will returns on AI infrastructure justify the investment? |
Amazon | AMZN | AWS, advertising, and retail efficiency | When will expanding operating profits translate into stronger free cash flow? |
Taiwan Semiconductor | TSM | Manufacturing advanced chips | How much growth survives industry cycles, capital demands, and geopolitical risk? |
Mastercard | MA | Digital payments and related services | Can transaction growth and services offset competitive and regulatory pressure? |
Intuitive Surgical | ISRG | Robotic procedures and recurring instrument demand | Can procedure growth support the expectations in its valuation? |
This is a quality-growth shortlist. It deliberately favors established businesses over companies whose survival depends on raising more capital. It also remains exposed to shared risks: Microsoft, Amazon, and TSM all participate in the same broad technology investment cycle.
Try the comparison: Open GNG Analyst and paste this prompt. If you are new to GNG, create a free account first. New accounts receive welcome credits; AI requests use GNG credits.
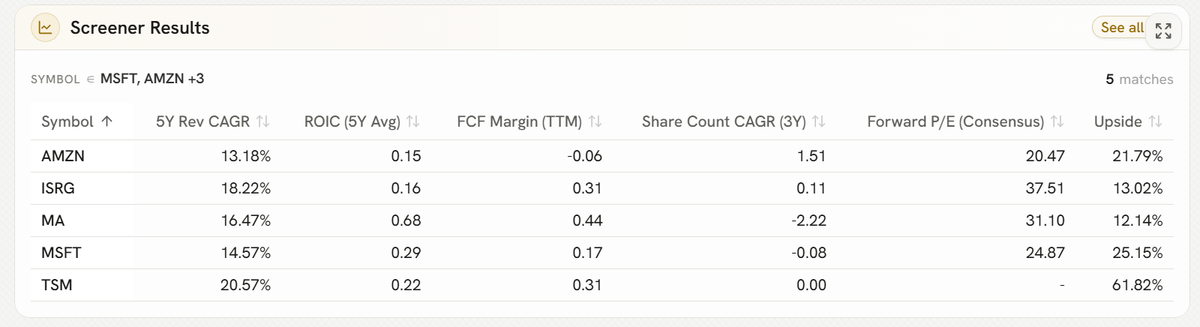
Compare MSFT, AMZN, TSM, MA, and ISRG in a clickable Screener Results table with a symbol filter for these five tickers. Show Revenue CAGR (5Y), ROIC (5Y Avg), FCF Margin (TTM), Share Count CAGR (3Y), and Forward P/E (Consensus). Use available GNG data, label its date, and keep missing values as N/A. Explain the most important tradeoff for each company. Do not rank them solely by one metric.
How I evaluate the best long-term stocks
A decade is too long to treat an analyst estimate as a reliable forecast. Good stocks for long-term growth need customers who keep coming back, opportunities to reinvest profitably, and enough financial strength to withstand setbacks. Shareholders also need that expansion to translate into growth per share.
I want evidence that a business has already grown, earned worthwhile returns on its capital, and limited dilution. Then I investigate whether those economics are likely to persist. The screen handles the measurable starting conditions; understanding demand and competition requires reading beyond the results table.
Using the November 6, 2026 GNG export, I applied the following criteria to equity listings. The thresholds are my starting research rules, not an optimized strategy or an official Vulcan rating.
GNG field | Starting rule | Why it is here |
|---|---|---|
Type | equity | Excludes ETFs, preferred shares, and bonds |
Market Cap | At least $10 billion | Focuses this article on established businesses |
Revenue CAGR (5Y) | At least 10% | Looks for a multiyear growth record |
ROIC (5Y Avg) | At least 10% | Checks the history of returns on invested capital |
Operating Margin (TTM) | Greater than 0% | Requires reported operating profitability |
Share Count CAGR (3Y) | No more than 2% | Limits the rate at which ownership has been diluted |
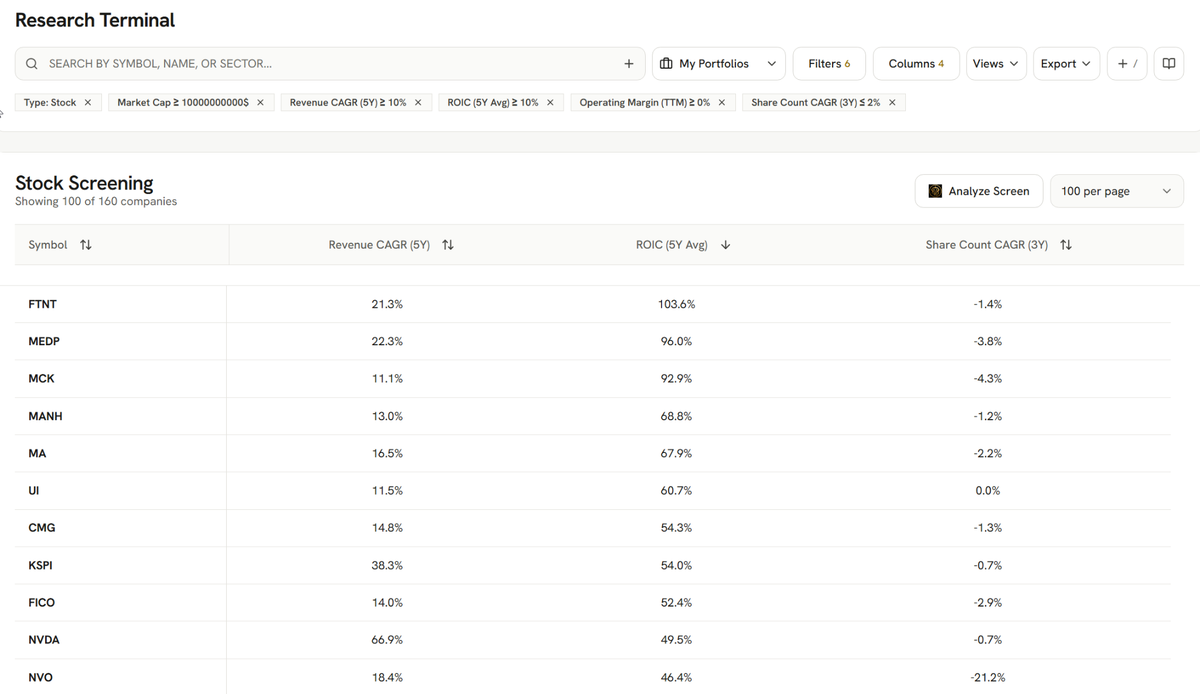
The file contained 5,914 securities, including 4,782 equities. 157 equity listings passed all six conditions. That is a pool for investigation, not 157 recommendations. Multiple share classes can represent the same business, and a missing required value excludes a listing from this mechanical screen.
The five companies in this article all passed. I selected them for their business models, different sources of demand, and useful research tradeoffs, rather than taking the five highest ROIC readings.
There are limits to this approach. A five-year growth rate can benefit from a depressed starting year, while acquisitions can lift sales without producing attractive returns for shareholders. ROIC also depends on accounting and industry structure; an unusually high number needs inspection rather than an automatic first-place ranking.
Here is the prompt to run the screen yourself:
Screen GNG equities using these exact fields: Type = equity; Market Cap >= $10 billion; Revenue CAGR (5Y) >= 10%; ROIC (5Y Avg) >= 10%; Operating Margin (TTM) > 0%; Share Count CAGR (3Y) <= 2%. Exclude missing values only for required filter fields. Show a screener widget with Symbol, Company Name, Revenue CAGR (5Y), ROIC (5Y Avg), and Share Count CAGR (3Y). Sort by ROIC (5Y Avg), descending, and show up to 10 rows. State the total match count separately from displayed rows. If a field is unavailable, identify it rather than silently substituting another.
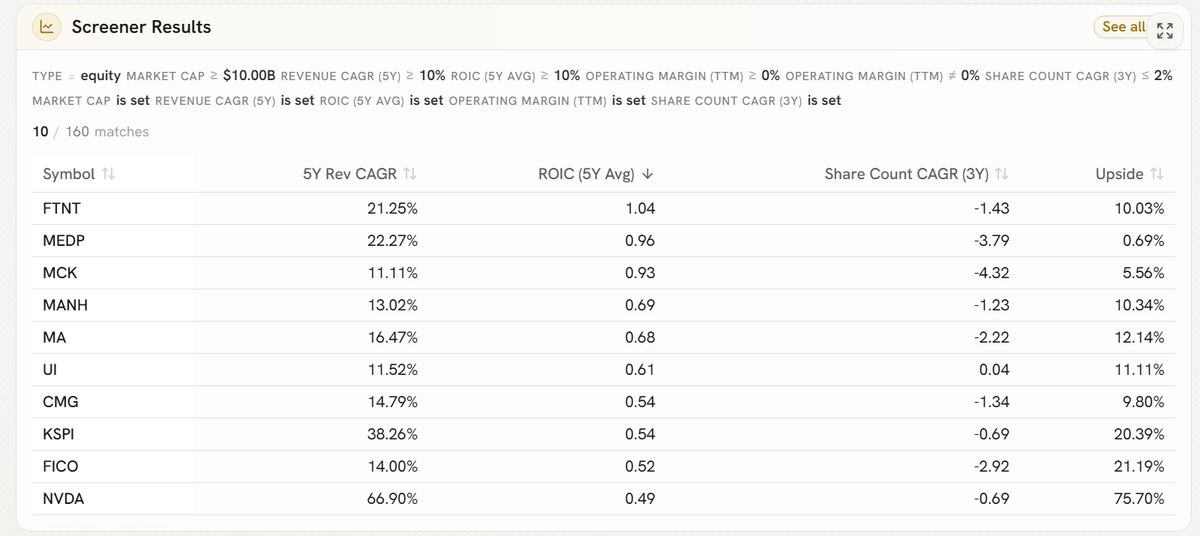
Click See all in the widget header to open the Research Terminal with the screen carried across. From there, add cash-flow and valuation columns and inspect individual companies. Live results can differ from the dated export used here.
What the five candidates show
The November 6 table below preserves the figures used to select the shortlist. The November 19 widget above updates the comparison. For example, ISRG moved from 40.94x to 37.51x next-fiscal-year consensus earnings. Growth and ROIC figures describe history. The final column uses next-fiscal-year consensus earnings and is a dated valuation observation, not a current quote.
Ticker | 5-year revenue CAGR | 5-year average ROIC | TTM FCF margin | Next-fiscal-year consensus P/E |
|---|---|---|---|---|
MSFT | 14.6% | 28.8% | 17.3% | 26.70x |
AMZN | 13.2% | 14.9% | -5.9% | 19.96x |
TSM | 20.6% | 22.4% | 30.9% | N/A |
MA | 16.5% | 67.9% | 44.3% | 31.92x |
ISRG | 18.2% | 15.7% | 31.1% | 40.94x |
TSM's missing consensus P/E stays blank. The export contains a separate generic forward P/E field, but substituting it here would mix valuation conventions. It is better to resolve the missing figure than make the comparison look complete.
Microsoft: watch the return on the spending
Microsoft's appeal is the combination of enterprise software and cloud demand. For fiscal 2026, it reported 18% revenue growth and 21% operating income growth. Azure and other cloud services revenue grew 41%, while investment in AI infrastructure weighed on Intelligent Cloud's gross margin percentage. Source: Microsoft annual report
That leaves a more useful question than whether AI demand is growing. How much additional capital will Microsoft need to serve it, and what cash return will that investment produce?
I would track operating cash flow, capital expenditure, and margins together. Revenue can keep growing while the economics become less attractive. For a long-term holder, evidence that capital spending is persistently outrunning the cash it generates deserves attention even when the next earnings headline looks strong.
Amazon: why I did not require positive free cash flow
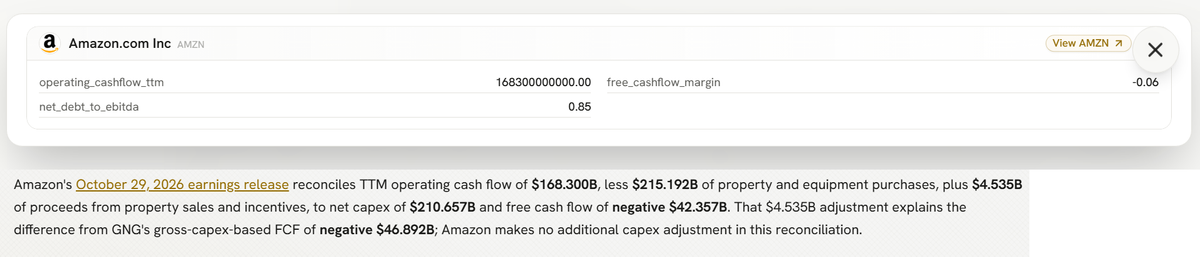
Amazon is the awkward result that makes this screen useful. Its negative free-cash-flow margin would fail a positive-FCF filter, yet it passes the historical growth and profitability tests.
The company's third-quarter 2026 release helps explain the tension. AWS sales rose 39% year over year to $46.0 billion, while trailing operating cash flow reached $168.3 billion. Reported trailing free cash flow was a $42.4 billion outflow, reflecting substantial investment in property and equipment, primarily for AI. Source: Amazon results
Heavy investment can create future earning power. It can also disappoint. I would examine capacity utilization, investment commitments, and the cash generation of the businesses funding that expansion before deciding which explanation deserves more weight.
A negative FCF reading therefore creates a research obligation. Removing it from the screen does not make the risk disappear.
Taiwan Semiconductor: strong demand with risks outside the spreadsheet
TSMC manufactures advanced chips for other companies, giving it exposure to demand across customers and chip designs. In its third-quarter 2026 release, advanced technologies of 7 nanometers and below represented 79% of wafer revenue, illustrating the importance of leading-edge production. Source: TSMC results
For a decade-long investment, the challenge is to separate a durable manufacturing advantage from an unusually strong part of the semiconductor cycle. I would examine capacity spending, customer concentration, and margins through weaker demand periods.
Taiwan-related geopolitical exposure requires a separate judgment. A compelling growth estimate or a low multiple cannot turn a severe disruption scenario into an ordinary earnings miss. Position sizing needs to reflect that distinction.
Mastercard: growth beyond the AI spending cycle
Mastercard offers a different source of growth. More payment activity and demand for related services can expand its business without relying on the next round of data-center construction.
In the third quarter of 2026, net revenue grew 14%, switched transactions increased 9%, and value-added services and solutions revenue grew 19%. Customer rebates and incentives within the payment network also increased, which is a reminder to examine what the company keeps from that growth. Source: Mastercard results
The attraction is a business that can expand on an established network. The questions are whether competing payment methods, customer bargaining power, or regulation weaken its economics. I would monitor transaction growth alongside revenue growth and incentives rather than assuming every additional payment produces the same benefit.
Intuitive Surgical: follow procedures, then inspect the price
Intuitive's business extends beyond placing surgical systems. Instruments and accessories create recurring revenue as customers perform procedures.
In the third quarter of 2026, da Vinci procedures grew approximately 14%, while instruments and accessories revenue increased 18%. The company also reported a decline in GAAP operating income alongside an increase in adjusted operating income, making the reconciliation part of the research. Source: Intuitive results
The operating question is whether procedure growth and usage can keep supporting expansion. The investment question adds price: the November 19 widget's 37.51x next-fiscal-year consensus P/E leaves more room for disappointment than the word "growth" suggests.
I would examine procedure trends, recurring revenue, competing systems, and the gap between reported and adjusted earnings before setting an entry valuation.
Does a ten-year holding period justify a high valuation?
A long holding period gives a business time to grow, but it does not erase the price paid for those earnings. Choosing the best stocks to buy for long-term growth requires testing what happens if the business expands more slowly, or investors eventually pay a lower earnings multiple.
Suppose a hypothetical company earns $5 a share and trades at $200, or 40 times earnings. Earnings then grow 12% annually for ten years, reaching approximately $15.53 a share.
If investors still pay 40 times earnings, the share price reaches about $621. If they pay 25 times, it reaches about $388. The business delivered the same earnings growth in both cases.
Illustrative assumption | Year-10 share price | Annualized price return |
|---|---|---|
12% EPS growth; exit P/E of 40x | $621 | 12.0% |
12% EPS growth; exit P/E of 25x | $388 | 6.9% |
8% EPS growth; exit P/E of 25x | $270 | 3.0% |
These are scenarios, not forecasts for any company in the shortlist. They exclude dividends, taxes, and fees. Earnings are modeled per share, so any dilution or repurchases must already be reflected in the assumed EPS growth.
That is why I would not rank the best long-term growth stocks by revenue growth alone. Entry valuation and the durability of per-share earnings both influence the result.
To try this with Intuitive Surgical, open GNG Advanced Charting and hold the FY2027 earnings estimate fixed. Set the custom P/E to 38.6x, the blended multiple shown in the chart, then compare the result with the five-year historical normal. The screener’s forward P/E uses next fiscal year’s consensus earnings. Here I’m asking a different question: how much does my valuation depend on investors paying the old multiple again?
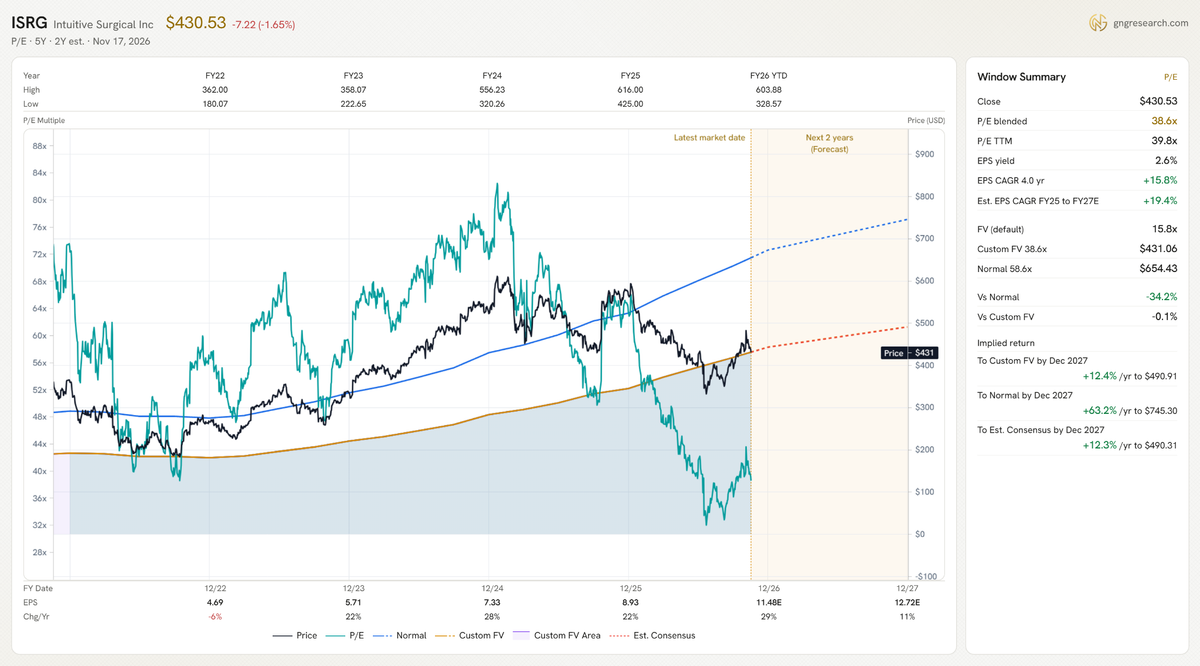
For an existing subscriber, a worthwhile follow-up is to compare the next few years of estimates with the assumptions required for your investment case. The GNG schema includes estimate horizons and analyst coverage. A distant forecast supported by only a few analysts should not carry the same confidence as a well-covered near-term estimate, and neither is a ten-year guarantee.
What would make me reconsider a ten-year holding?
A long holding period still requires review. I would revisit the business after earnings and reassess valuation after a material change in price or expectations.
A temporary slowdown can leave the long-term case intact if customers remain loyal, the balance sheet is sound, and reinvestment opportunities remain attractive. Persistent market-share losses, weakening unit economics, or repeated dilution to fund operating shortfalls call for a deeper reassessment. A falling share price alone does not distinguish between those situations.
Company | Evidence to monitor | Reason to reassess |
|---|---|---|
Microsoft | Cloud growth, margins, capex, and operating cash flow | Investment needs rise without convincing improvement in cash returns |
Amazon | AWS profitability, operating cash flow, capex, and funding commitments | Expansion repeatedly consumes cash without progress toward adequate returns |
TSM | Advanced-node demand, utilization, margins, and geographic exposure | Capacity economics weaken or disruption risk changes materially |
Mastercard | Transactions, services growth, incentives, and regulatory developments | Volume growth translates into progressively weaker economics |
Intuitive | Procedure growth, recurring revenue, and GAAP/adjusted earnings | Adoption or profitability falls short of the expectations supporting its price |
A historical backtest of these names can show the drawdowns an investor would have experienced. It cannot establish that selecting today's survivors was a repeatable winning strategy ten years ago. I would use it to understand risk, not to validate this shortlist.
Common questions about growth stocks for the next 10 years
Which growth stocks are worth researching for the next decade?
Microsoft, Amazon, TSMC, Mastercard, and Intuitive Surgical are the candidates examined here. All passed the dated GNG screen, but the shortlist also reflects business-level judgment. The strongest candidate at one price may be unattractive at another.
Are the best stocks to buy and hold investments you can ignore?
No. Buy and hold still requires checking whether the business is meeting the expectations behind the investment. Review competitive position, cash generation, debt, and dilution after results, and distinguish temporary setbacks from lasting damage to the business. A ten-year horizon is a reason to look beyond one quarter, not a commitment to hold through any change.
Should I only consider small companies?
Small companies may have more room to expand, but size alone does not establish an advantage. This screen intentionally favors established businesses with multiyear records. It will miss younger companies that eventually become exceptional investments.
Is positive free cash flow essential?
Positive free cash flow is valuable evidence, but a hard filter can exclude businesses making large investments. Amazon illustrates why an exception needs a funding and returns analysis. Persistent cash consumption without credible future returns is a different proposition.
Can I find these stocks with a screener?
A screener can narrow the universe and make the process repeatable. It cannot establish a durable competitive advantage or tell you what a business will earn ten years from now. Use the results to decide where to investigate next.
My next step would be to choose one company from this list and write down the assumption its investment case depends on most. Then look for evidence that could disprove it.
Sign in to leave a comment and join the discussion.
Sign Up Free