

Nvidia hit an all time high closing price of $239.24 on October 6th. It closed at $168.89 on Tuesday after trading as low as $165.89. Thats a drop of 29.4% from that high (30.7% at the days low) and down 26.3% over the past month. About $1.7 Trillion wiped off the company in just 5 weeks and they report earnings next week.. Let’s talk about it
I
Historical Drops
Nvidia dropping 15% or more in a month. How often has it happened?
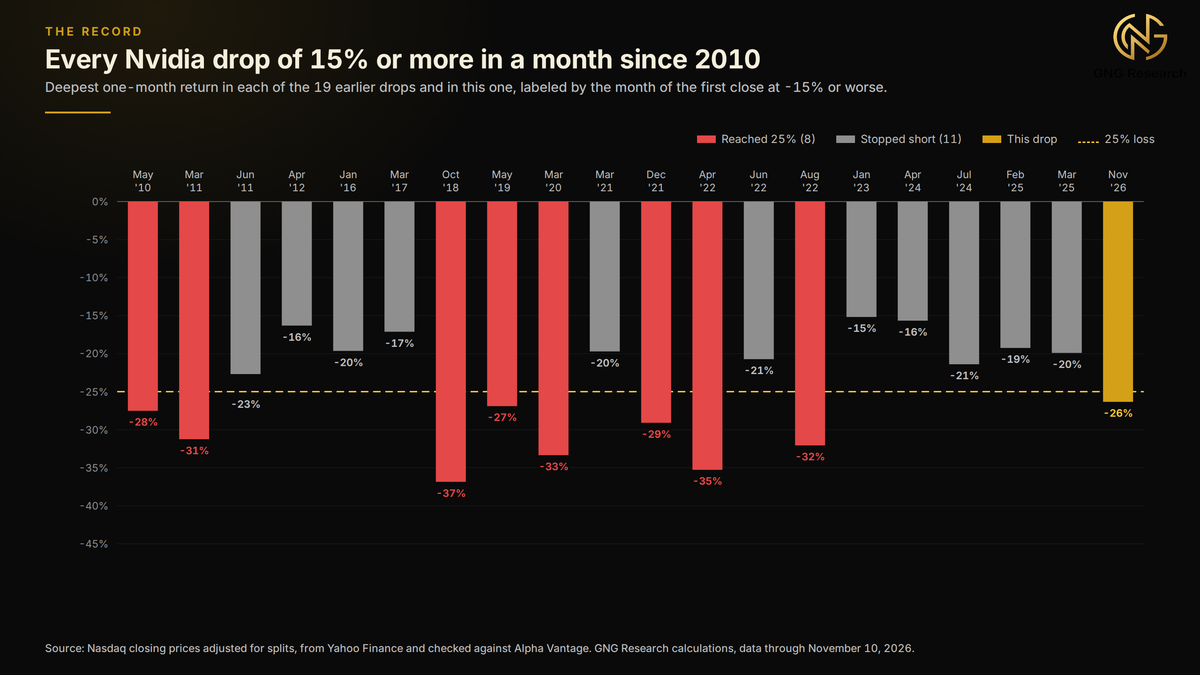
19 since 2010 up until this current decline. I only start counting when it hasn't closed that far down in a month. So one extended decline isn't going to be counted more than once. 8 of those 19 kept falling until they were down 25% or more. This one became the 20th on Nov 5th when it closed down 24.0% on the month. On Tuesday it closed down 26.3% which makes it the 9th to reach 25%. There have been 245 out of the 4,240 trading days since 2010 that ended down 15% or more on the month. That's roughly 5.8% of them. Only 55 ended down 25% or more.
There have been clusters of them. 4 between 2010-2012 and then none for over 3.5 years. Had 3 in 2022. The 5 before this one all came up short of the 25% mark. The last one to get there before now began in Aug 2022.
First close at -15% or worse | Deepest one-month return | Main driver | What was happening |
|---|---|---|---|
May 5, 2010 | -27.5% | Mixed | The European debt crisis and the flash crash, then guidance below estimates on May 13. |
Mar 2, 2011 | -31.3% | Mixed | A Citigroup downgrade over competition in mobile chips, a market slide on the Libya uprising and the CFO's resignation. |
Jun 27, 2011 | -22.7% | Market | Global growth and debt fears hit tech stocks, then the market crash of August 4. No Nvidia-specific news found. |
Apr 30, 2012 | -16.3% | Company | Fears ahead of its May report that a 28nm chip shortage at TSMC would limit sales of its new graphics cards, as reported by Reuters. |
Jan 15, 2016 | -19.6% | Market | A broad selloff to start 2016 that left the Nasdaq at its lowest since October 2014. No Nvidia-specific news found. |
Mar 6, 2017 | -17.1% | Company | A run of analyst downgrades, led by Nomura's cut to Reduce on February 23 on talk of slowing gaming growth. |
Oct 19, 2018 | -36.9% | Mixed | A chip selloff on tariffs and weak chip outlooks, then a guidance cut on November 15 blamed on excess inventory after the crypto boom. |
May 13, 2019 | -26.9% | Chips | The trade war with China escalated and Huawei was blacklisted. Chip stocks had their worst month since the financial crisis. |
Mar 12, 2020 | -33.3% | Market | The pandemic crash. The S&P 500 fell about 12% on March 16 alone. |
Mar 8, 2021 | -19.7% | Mixed | Supply warnings and a rich valuation after its February 24 report, as a jump in bond yields sank tech stocks. |
Dec 20, 2021 | -29.1% | Market | The Fed signaled rate hikes and growth stocks sold off. Its $40 billion Arm deal was also falling apart. |
Apr 18, 2022 | -35.3% | Market | The Nasdaq's worst month since 2008 on inflation and rate fears, with falling graphics card prices on top. |
Jun 28, 2022 | -20.7% | Mixed | Hot May inflation pushed the S&P 500 into a bear market on June 13. Micron's weak outlook and a price target cut followed. |
Aug 31, 2022 | -32.1% | Mixed | A revenue warning on August 8, new limits on chip exports to China on August 31 and a hot inflation report. |
Jan 3, 2023 | -15.2% | Chips | Recession fears and a weak outlook from Micron that sank chip stocks on December 22, with selling into year end. |
Apr 22, 2024 | -15.7% | Chips | Super Micro skipped its usual preliminary results and TSMC cut its chip market outlook. Nvidia fell 10% on April 19. |
Jul 30, 2024 | -21.4% | Mixed | The slide ran into early August, when weak U.S. jobs data, the yen carry-trade unwind and reports of a delay to its Blackwell chip landed within days of each other. |
Feb 3, 2025 | -19.2% | Chips | DeepSeek's low-cost AI model raised doubts about AI chip demand. Nvidia fell 17% on January 27. |
Mar 10, 2025 | -19.9% | Mixed | A weaker margin outlook after its February 26 report, then tariff and recession fears that ran into April. |
Nov 5, 2026 (this drop, through Nov 10) | -26.3% | Mixed | A chip selloff on AI spending and financing worries, the midterm result, then the investigation into the CEO. |
The main driver in that table is whatever did most of the damage even if there was other news. Only 2 of the 19 were Nvidia specific. Chip supply worries in 2012 and downgrades from analysts in 2017. 4 were about chip stocks as a group. 5 were from the broader market falling such as Mar 2020 and Apr 2022. The other 8 were some combo of those. Typically the market or chip sell off and something Nvidia related as well. Like cutting guidance in Nov 2018 and warning on revenues in Aug 2022.
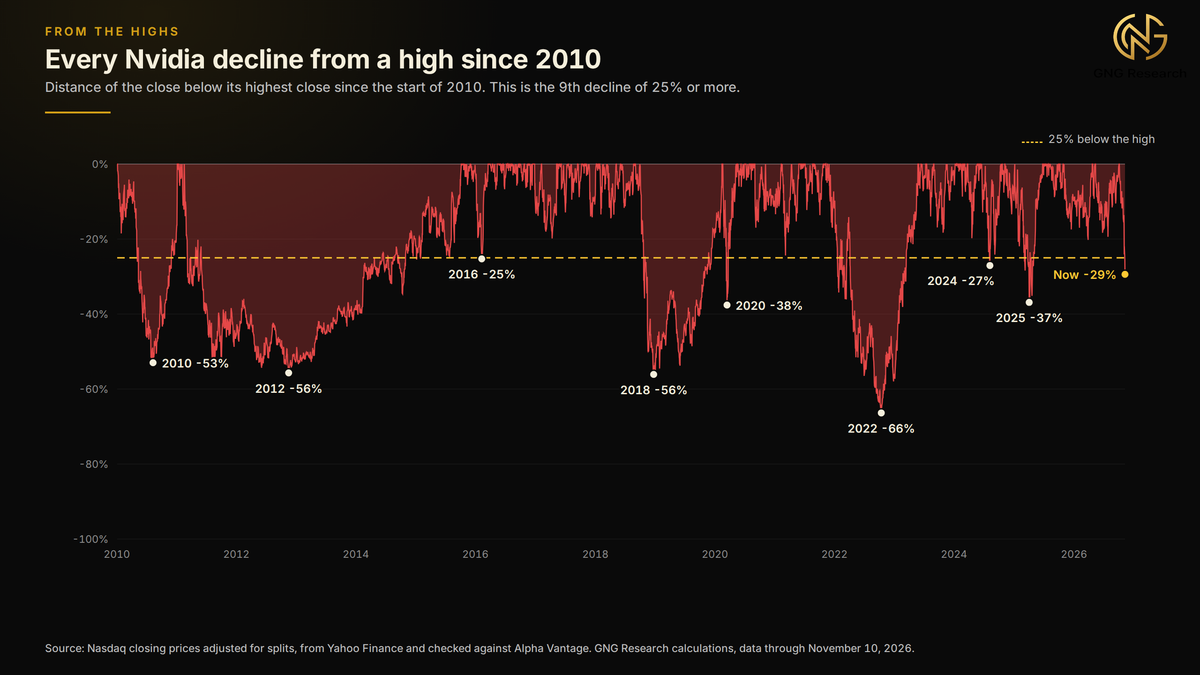
Off its highest close since the beginning of 2010. This is now the 9th decline of 25% or more from a high. The other 8 ranged from 25.3% to 66.4% lower with 2022 being the most. Every one of those 8 went on to pass the high it fell from. In 7 of the 8 it took less than 14 months from the bottom to get back there. 2012 was the long one taking close to 3 years.
What Came Next
What happened after that first close down 15%?
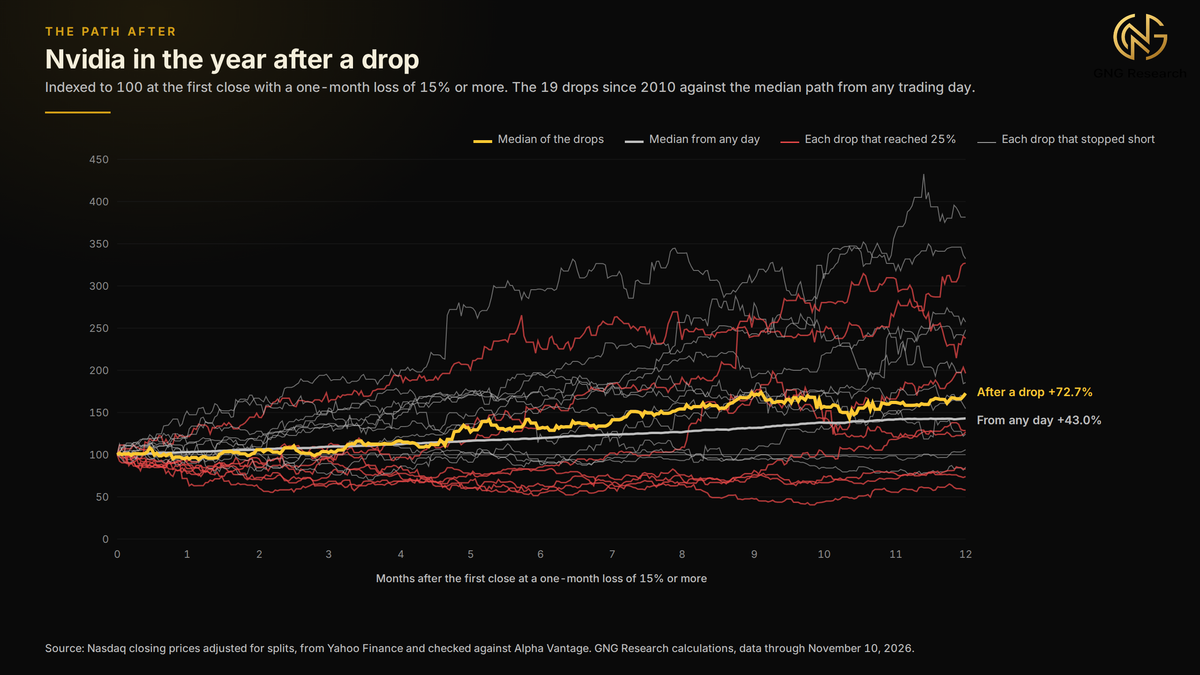
The first month was typically rough. In only 8 out of the 19 was Nvidia up after one month with a median return of -3.3%. Any month selected since 2010 has a median of +2.9%.
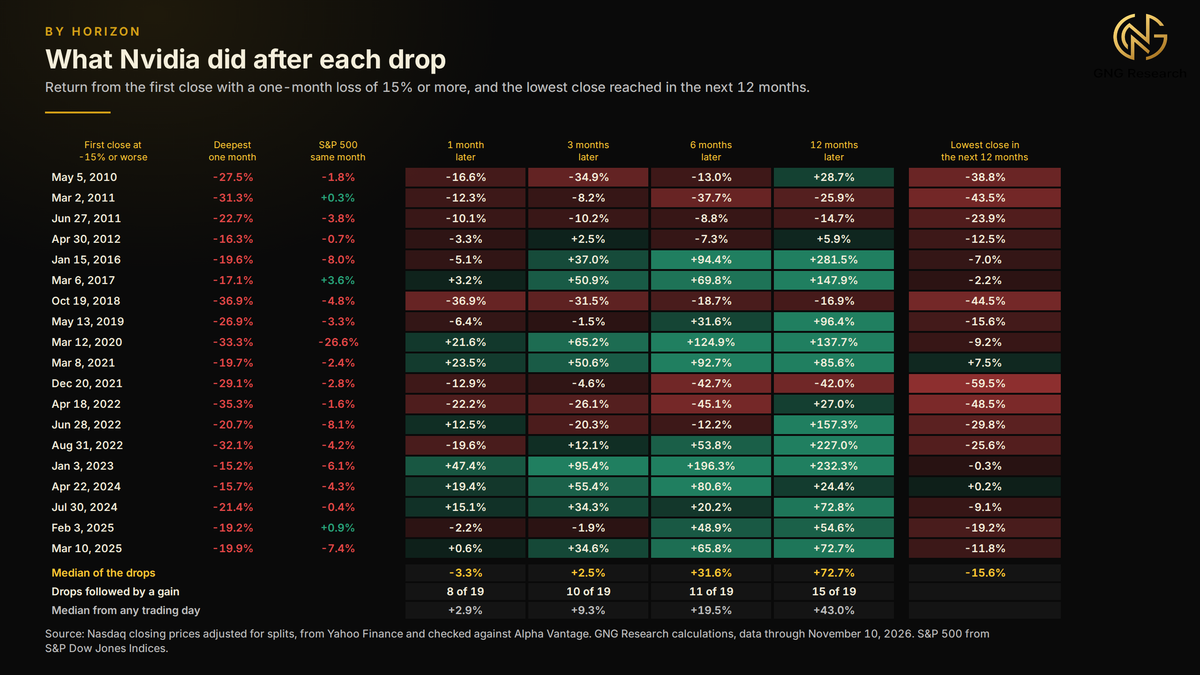
After 3 months it was up in 10 out of the 19 with a median return of +2.5%. Which is well under its typical 3 month return of +9.3%. After 6 months the median starts to pull ahead. It had a median return of +31.6% vs +19.5% for any given day. But only 11 of the 19 were higher which is 58% vs 76% for any given 6 months.
It was higher in 15 of the 19 after a year. With a median gain of 72.7%. Over any 12 month period since 2010 it has a median return of 43.0% and is up 81% of the time. So at 79% it was higher about as often as normal, just with a higher return. 4 of the 19 were lower after a year. They started in Mar 2011, Jun 2011, Oct 2018 and Dec 2021.
How far it fell played a role. The 11 that didn't make it to 25% were up in 10 of 11 cases after a year. Median return was 72.8%. They were up after 6 months in 8 of the 11. Those that did hit the 25% mark fared worse. Only 3 of 8 were higher after 6 months and had a median return of -15.9%. 5 of 8 were up after a year and had a median of 27.9%. Nvidia closed Tuesday down 26.3% on the month so those 8 are the ones to compare it to.
For those 8 I used the date it first closed down 25% to reset my timeline. Which is where Nvidia is as of Tuesday's close.
First close at -25% or worse | 1 month later | 3 months later | 6 months later | 12 months later | Lowest close in the next 12 months |
|---|---|---|---|---|---|
May 14, 2010 | -12.3% | -27.5% | +2.3% | +40.9% | -31.5% |
Mar 16, 2011 | +6.7% | -7.6% | -11.8% | -16.7% | -33.1% |
Oct 26, 2018 | -22.8% | -19.2% | -10.2% | +3.2% | -35.9% |
May 31, 2019 | +21.2% | +23.7% | +60.0% | +162.1% | -1.2% |
Mar 16, 2020 | +50.1% | +84.7% | +154.9% | +170.7% | +3.3% |
Jan 27, 2022 | +10.1% | -16.1% | -18.9% | -7.2% | -48.8% |
Apr 22, 2022 | -14.5% | -11.3% | -36.1% | +39.0% | -42.5% |
Sep 2, 2022 | -11.1% | +23.7% | +70.8% | +255.5% | -17.7% |
Median | -2.2% | -9.4% | -3.9% | +39.9% | -32.3% |
From that point it was up a year later in 6 of the 8 with a median of +39.9%. 1 month out and 6 months out it was up in 4 of the 8 and 3 months out in 3 of the 8. 5 out of the 8 dropped at least another 30% before they recovered. There were 3 that didnt drop another 30% May 2019, March 2020 and Sept 2022.
The more recent ones did better. 13 of the 19 drops have come since 2018 and it was up 12 months later in 11 of those 13 with a median of +72.8%. Only missed on Oct 2018 and Dec 2021. The 6 before 2018 were up in 4 with a median of +17.3%.
The first close down 15% has seldom been the bottom. In 12 of the 19 the stock went at least another 10% lower in the next 12 months. 8 of them went another 20% lower. The median low was 15.6% below that first close and came about 8 weeks later. It only came within a few days and/or points in 5 of them.
Every time it went back to where it was before the drop. Median amount of time was 90 trading days or a little over 4 months. Only 2 took longer than 2 years and both started in 2011. The longest was March 2011 at about 4 1/2 years.
I wanted to see if this was all just a fluke. So I generated 20,000 sets of 19 random days, 6 from before 2018 and 13 from 2018 on like the real ones, and found the median return. Comparing it to our actual numbers. We can say the poor first month is true. 99% of the random sets beat our number. The slow 3 months probably holds up too with 91% beating ours. The 6 and 12 month numbers are better than most random sets but about 1 in 5 did just as well. So I wouldn't call those proven.
Rest of the Market
Did Nvidia fall by itself in those 19 or did everything fall?
Pretty much never. The S&P 500 was also down on the month in 16 of the 19 with a median of -3.3%. The Philadelphia Semiconductor Index (SOX) was down in 17 with a median of -9.8%.
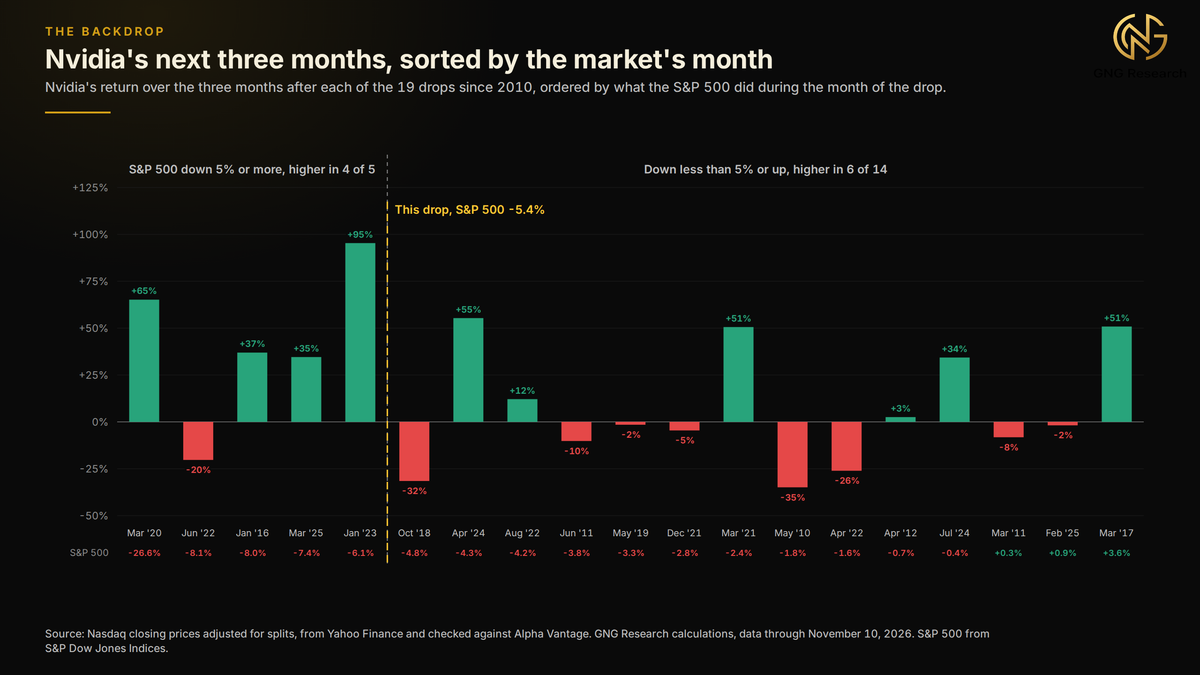
If you look at how the market did during that month it seems to line up with the following months. If the S&P 500 was also down 5%+ Nvidia was up 3 months later in 4 out of the 5 with a median of +37.0%. It was up 12 months later in all 5. When the S&P 500 was down less than 5% or up Nvidia was only up 3 months later in 6 of the 14 with a median of -1.7%. It was up 12 months later in 10 of those 14. So when the S&P 500 itself fell 5% or more that month Nvidia recovered faster than when the S&P 500 fell less. Its only 5 so I wouldnt put too much stock in that.
This one just barely falls under the first category. When Nvidia first closed down 15% on Nov 5th the S&P 500 was down 5.4% for the month and the SOX was down 31.6%. As of Tuesday's close the S&P 500 is down 3.7% since Oct 9th and the SOX is down 20.5%.
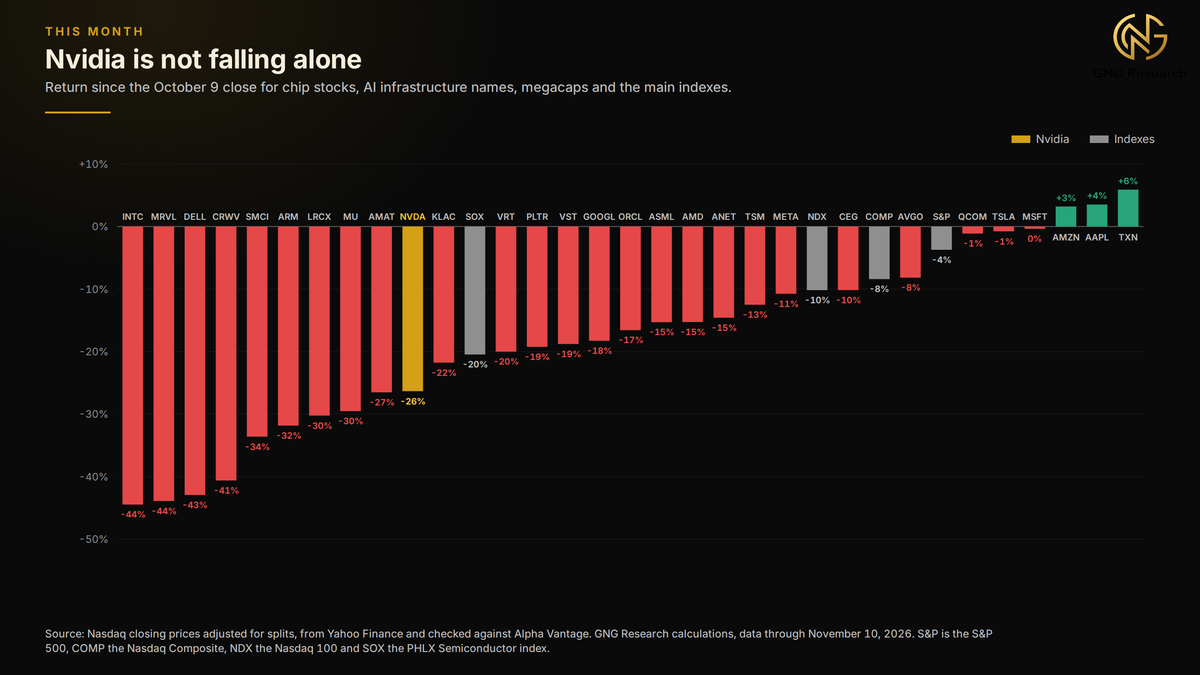
Nvidia is also not the biggest decliner in that group. Of the other 28 names I looked at 9 were down more over that same month. Intel at -44.5%, Marvell at -43.9%, Dell at -43.0% and CoreWeave at -40.6% lead that group. MSFT, AMZN and AAPL have been flat to up.
There are 2 periods here. From Nvidia's high on Oct 6th through the close on Nov 6th Nvidia was down 22.0% and the SOX was down 29.0%. So Nvidia was outperforming the group. Since then Nvidia is down another 9.5% and the SOX is up 6.5%. AMD is up 14.7%.
Why?
Three stories played out here and each took a bite out of the stock. October was about money. October 8 the Financial Times said OpenAI was doing close to $50 billion in annualized revenue when an earlier report had put it around $70 billion. We saw September CPI come in at 3.7% on October 14 after the Fed hiked on September 16th and 10yr yield was over 5%. Then we got the AI spenders. None of them cut their AI spending plans but we saw negative FCF from Alphabet, Amazon and Meta. On October 30 we saw the SOX drop 7.2%.
Democrats won the house and senate on November 3. The winner for Texas Governor campaigned on halting new data centers right away. The SOX dropped 12.2% on November 5 along with Nvidia falling 9.3% and the S&P down 4.4%.
Adam wrote that same afternoon that the market was pricing in data center bans with almost no path past a Senate filibuster, a presidential veto and the Supreme Court, and that consensus estimates still showed no decline in AI spending. The chip stocks have sided with him so far.. (I think Adam is spot on BTW..)
When (ET) | What happened | Source |
|---|---|---|
Thu Oct 29, by 5:12 AM | The New York Times reports that U.S. officials believe a businesswoman close to Jensen Huang was a Chinese intelligence asset. She was an executive at Megaspeed, an Nvidia customer in Singapore. | New York Times |
Thu Oct 29, 11:59 AM | Nvidia responds through CNBC, saying Huang's interactions with Megaspeed's officials "are not unusual." | CNBC |
Thu Oct 29, 2:50 PM | Huang tells Bloomberg the relationship was tied to Megaspeed and was "completely normal and not unusual." | Bloomberg |
Fri Oct 30 | China's foreign ministry calls the report "groundless speculation." | BBC |
Thu Nov 5 | Three House committee chairs release a letter asking Huang for a closed-door briefing on November 18. | Reuters, Punchbowl |
Fri Nov 6, 9:33 PM | The Financial Times reports that a U.S. government memo described the relationship as romantic. | Financial Times |
Sun Nov 8, 3:00 PM | Nvidia's board announces an independent investigation overseen by a committee of independent directors with outside counsel. It says it has "no reason to believe that either national security or NVIDIA secrets were compromised" and that it has confidence in Huang. | Nvidia |
Sun Nov 8, 3:05 PM | Axios reports that Huang admitted an affair in an email to employees. The Financial Times follows at 3:19 PM, and Nvidia posts the full email by 5:07 PM. "I was unfaithful to my wife," he writes. | Axios, Financial Times, Nvidia |
Mon Nov 9, 9:30 AM | Nvidia opens about 7% lower and trades down to $170.24. It closes at $178.67, down 4.3%, on about 460 million shares. | GNG data |
Mon Nov 9, 5:06 PM | President Trump says "the FBI is looking into it in terms of something else" and that Huang told him he "had absolutely no idea that the person in question was a spy." | Bloomberg, CNBC |
Mon Nov 9, 9:39 PM | The Rosen Law Firm announces a shareholder class action filed that day in federal court in San Jose. | GlobeNewswire |
Tue Nov 10, about 3:22 AM | Reuters, citing the South China Morning Post, reports that Huang had been in talks to join President Trump's delegation to the APEC summit in Shenzhen on November 18 and 19 and that his participation is now in doubt. | Reuters, South China Morning Post |
Tue Nov 10, 5:32 AM | Citi lowers its price target to $285 from $315. Wells Fargo follows at $300 from $315 and keeps its Overweight rating. | MT Newswires |
Tue Nov 10, 8:36 AM | Yahoo Finance relays a report from The Information that a network linked to the woman helped at least $7.5 billion of Nvidia hardware reach Chinese companies. Reuters said it could not verify the report. | The Information via Yahoo Finance, Reuters |
Tue Nov 10, before 9:00 AM | Rep. John Moolenaar, who chairs the House select committee on China, tells CNBC that Congress needs to "get to the bottom" of the matter and that an internal investigation that becomes "more of damage control" is "not going to work." | CNBC |
Tue Nov 10, by 12:50 PM | Senate Democratic Leader Chuck Schumer says on the Senate floor that Congress must have a full accounting of President Trump's defense of Huang and calls on lawmakers to quickly approve new restrictions on chip exports to China. | Reuters, Bloomberg |
Tue Nov 10, about 2:07 PM | Nvidia's independent directors say they have retained Joon H. Kim, a former acting U.S. attorney for the Southern District of New York, and his firm Wachtell, Lipton, Rosen & Katz to conduct the investigation. | Nvidia |
Tue Nov 10, by 2:38 PM | House Foreign Affairs Chairman Brian Mast tells ABC News he is prepared to subpoena Huang if he does not respond by Wednesday to the request for a closed-door briefing. | ABC News |
Tue Nov 10, afternoon | The New York Times reports, per NBC News, that Secretary of State Marco Rubio told President Trump aboard Air Force One in May, on the way to China, that U.S. intelligence showed Huang was in a relationship with a woman believed to be a Chinese spy. Asked Monday whether he knew about it at the time, Trump had said "No, I didn't hear about it then." The White House disputed the report, and NBC says it has not confirmed it. | New York Times via NBC News, Raw Story |
Tue Nov 10, 4:00 PM | Nvidia closes at $168.89, down 5.5%, after trading as low as $165.89, on about 416 million shares. | GNG data |
The last rows of that table are the latest as of Tuesday's close. Huang remains CEO and the board has not given a timeline for its investigation.
Two things in that table come from Nvidia itself, the email and the board's investigation. The intelligence claims come from news reports citing people briefed on them, and China's foreign ministry denies them. None of the 19 earlier drops involved a question about the person running the company, so the history above cannot speak to this part.
Earnings
Where does this all tie into the earnings announcement on the 17th?
They report after market close on Tuesday Nov 17th for the quarter ending Oct 25th. They gave guidance in August for revenue of $108.0b +/- 2%. Consensus analyst estimates have them making $111.4b in revenue and $2.53 per share. About 95% higher than last year. The closed-door briefing that house committee chairs asked Huang for would be the next day.
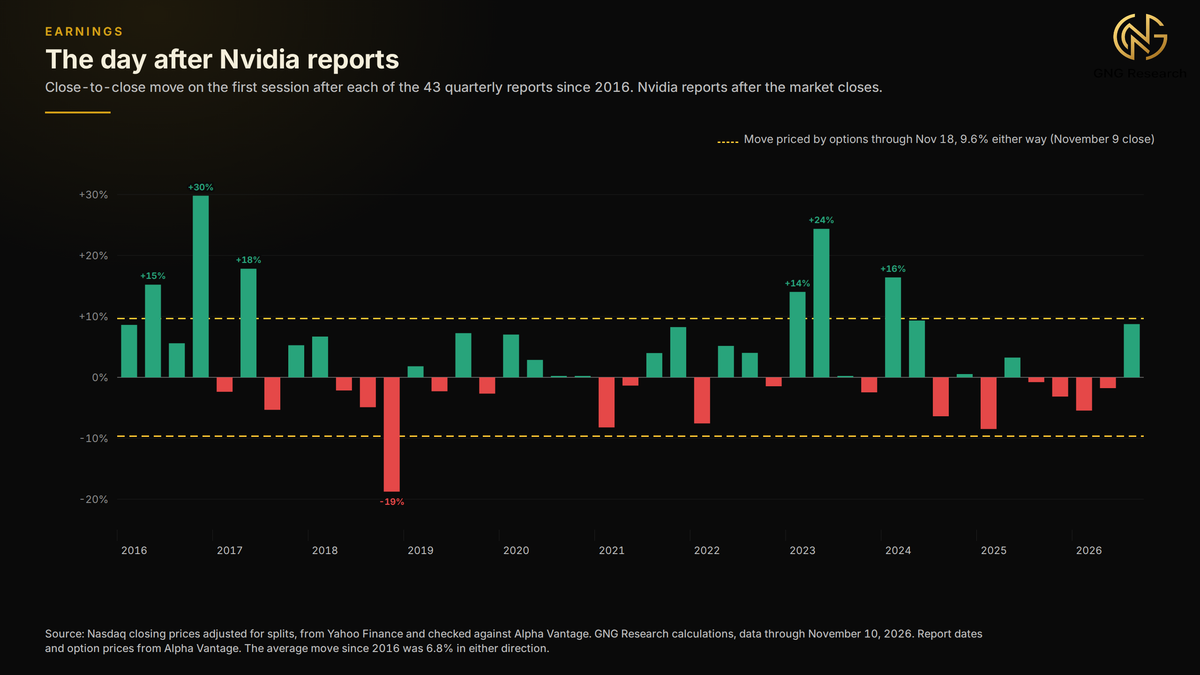
The stock has averaged a 6.8% move in either direction the day after since 2016. Going up in 25 out of 43. As of the close on Monday the options implied move is 9.6% for the stock by Nov 18th.
There was a report during that down month in 6 of the 19. This time the drop came first. The report will be 8 trading days after that first close down 15%. There was a report within about a month after that first close down 15% in 8 of the 19. Nvidia dropped in the first session after the report in 5 of those 8. They were May 2010 -11.5% May 2012 +6.4% Feb 2016 +8.6% Nov 2018 -18.8% May 2019 -2.3% May 2024 +9.3% Aug 2024 -6.4% Feb 2025 -8.5%.
Since 2010 the most Nvidia has been down on the month going into a report was 17.0% in May 2010. Aug 2010, Nov 2018, May 2019 and May 2022 were all between 14% and 15% down. At Tuesday's close it would go into this one down about 21%. Anything under $177.64 on the 17th would be the most since 2010.
Wall Street
What are analysts doing?
Firm | Rating | Last action | Date |
|---|---|---|---|
Citigroup | Buy | Maintained, target cut to $285 | Nov 10, 2026 |
Wells Fargo | Overweight | Maintained, target cut to $300 | Nov 10, 2026 |
Aletheia Capital | Hold | Downgraded from Buy | Nov 9, 2026 |
Goldman Sachs | Buy | Reiterated | Nov 9, 2026 |
Mizuho | Outperform | Maintained, target cut to $250 | Nov 9, 2026 |
RBC Capital | Outperform | Reiterated | Nov 9, 2026 |
Melius Research | Buy | Maintained, target cut to $315 | Nov 2, 2026 |
Needham | Buy | Reiterated | Oct 22, 2026 |
Cantor Fitzgerald | Overweight | Reiterated | Oct 1, 2026 |
Rosenblatt | Buy | Maintained | Sep 29, 2026 |
Piper Sandler | Overweight | Initiated | Sep 10, 2026 |
Benchmark | Buy | Reiterated | Aug 27, 2026 |
Bernstein | Outperform | Maintained | Aug 27, 2026 |
DA Davidson | Buy | Maintained | Aug 27, 2026 |
Evercore ISI Group | Outperform | Maintained | Aug 27, 2026 |
JP Morgan | Overweight | Maintained | Aug 27, 2026 |
Keybanc | Overweight | Reiterated | Aug 27, 2026 |
Morgan Stanley | Overweight | Maintained | Aug 27, 2026 |
Oppenheimer | Outperform | Maintained | Aug 27, 2026 |
Raymond James | Strong Buy | Maintained | Aug 27, 2026 |
Truist Securities | Buy | Maintained | Aug 27, 2026 |
UBS | Buy | Maintained | Aug 27, 2026 |
Wedbush | Outperform | Maintained | Aug 27, 2026 |
BMO Capital | Outperform | Initiated | Aug 21, 2026 |
China Renaissance | Buy | Initiated | Jun 5, 2026 |
Tigress Financial | Strong Buy | Maintained | May 27, 2026 |
B of A Securities | Buy | Maintained | May 21, 2026 |
Baird | Outperform | Maintained | May 21, 2026 |
Jefferies | Buy | Maintained | May 21, 2026 |
Stifel | Buy | Maintained | May 21, 2026 |
HSBC | Buy | Maintained | May 19, 2026 |
TD Cowen | Buy | Maintained | May 15, 2026 |
Argus Research | Buy | Reiterated | Nov 20, 2025 |
Barclays | Overweight | Maintained | Nov 20, 2025 |
Deutsche Bank | Hold | Maintained | Nov 20, 2025 |
Susquehanna | Positive | Maintained | Nov 20, 2025 |
Loop Capital | Buy | Maintained | Nov 3, 2025 |
Craig-Hallum | Buy | Maintained | Aug 28, 2025 |
Seaport Global | Sell | Initiated | Apr 30, 2025 |
Phillip Securities | Accumulate | Downgraded | Nov 22, 2024 |
Redburn Atlantic | Buy | Initiated | Nov 12, 2024 |
William Blair | Outperform | Initiated | Sep 18, 2024 |
WestPark Capital | Buy | Maintained | Aug 29, 2024 |
New Street Research | Buy | Upgraded | Aug 6, 2024 |
Wolfe Research | Outperform | Maintained | May 23, 2024 |
CICC | Outperform | Initiated | Mar 6, 2024 |
Edward Jones | Hold | Downgraded | Nov 22, 2023 |
Exane BNP Paribas | Outperform | Upgraded | Aug 24, 2023 |
Daiwa Capital | Outperform | Upgraded | Jun 30, 2023 |
Erste Group | Buy | Upgraded | Apr 25, 2023 |
DZ Bank | Sell | Downgraded | Feb 16, 2023 |
There were 69 analysts in the Nov 1st consensus count. 25 strong buys, 41 buys, 2 holds and 1 sell. Price targets have started to drop as well. Since Nov 2nd 4 companies have lowered their price target. Melius, Mizuho, Citi and Wells Fargo. The new targets range from $250-$315. All of them are in the table above.
The consensus price target as of Nov 6th was $330.30. Before most of the cuts listed above. The lowest price target was $181.80. Nvidia is trading under all of these price targets.
Its the estimates I find interesting.
Consensus analysts are estimating earnings of $9.48 per share for this year (end of January) and $16.16 next year.
That would put Nvidia at 17.8x this years earnings and 10.5x next years. Zacks has the estimate for the coming quarter trending slightly higher over the last 30 days.
A Bubble?
Chip index is down 31.7% from it's highs set on June 22nd. Nvidia has now followed it down. What I can measure is how much people are willing to pay. TIKR showed nvidia to be 15.4x forward 12 mo earnings as of Nov 6th compared to a 5 year average of around 36x. Revenue increased 106% from a year earlier in the last reported quarter. When “bubbles” burst they typically start off with elevated multiples and declining numbers. This seems to be the opposite, lower multiple and increasing numbers. Which reads to me as the market pricing in uncertainty more than a “bubble” bursting.
The downside to this thesis would be if the largest of those that Nvidia sells to cut their AI spending. Then we will see the estimates decrease and that multiple will not look low.
Conclusion
Calm down.. This is the 20th time since 2010 that Nvidia has dropped 15% or more in a month and as of Tuesday's close it's the 9th of those to reach 25% on the month. It's made it back to it's pre-drop price after all 19 prior ones. Normally in a little over 4 months.

Thanks for reading and being a part of our community here at GNG!
Sign in to leave a comment and join the discussion.
Sign Up Free