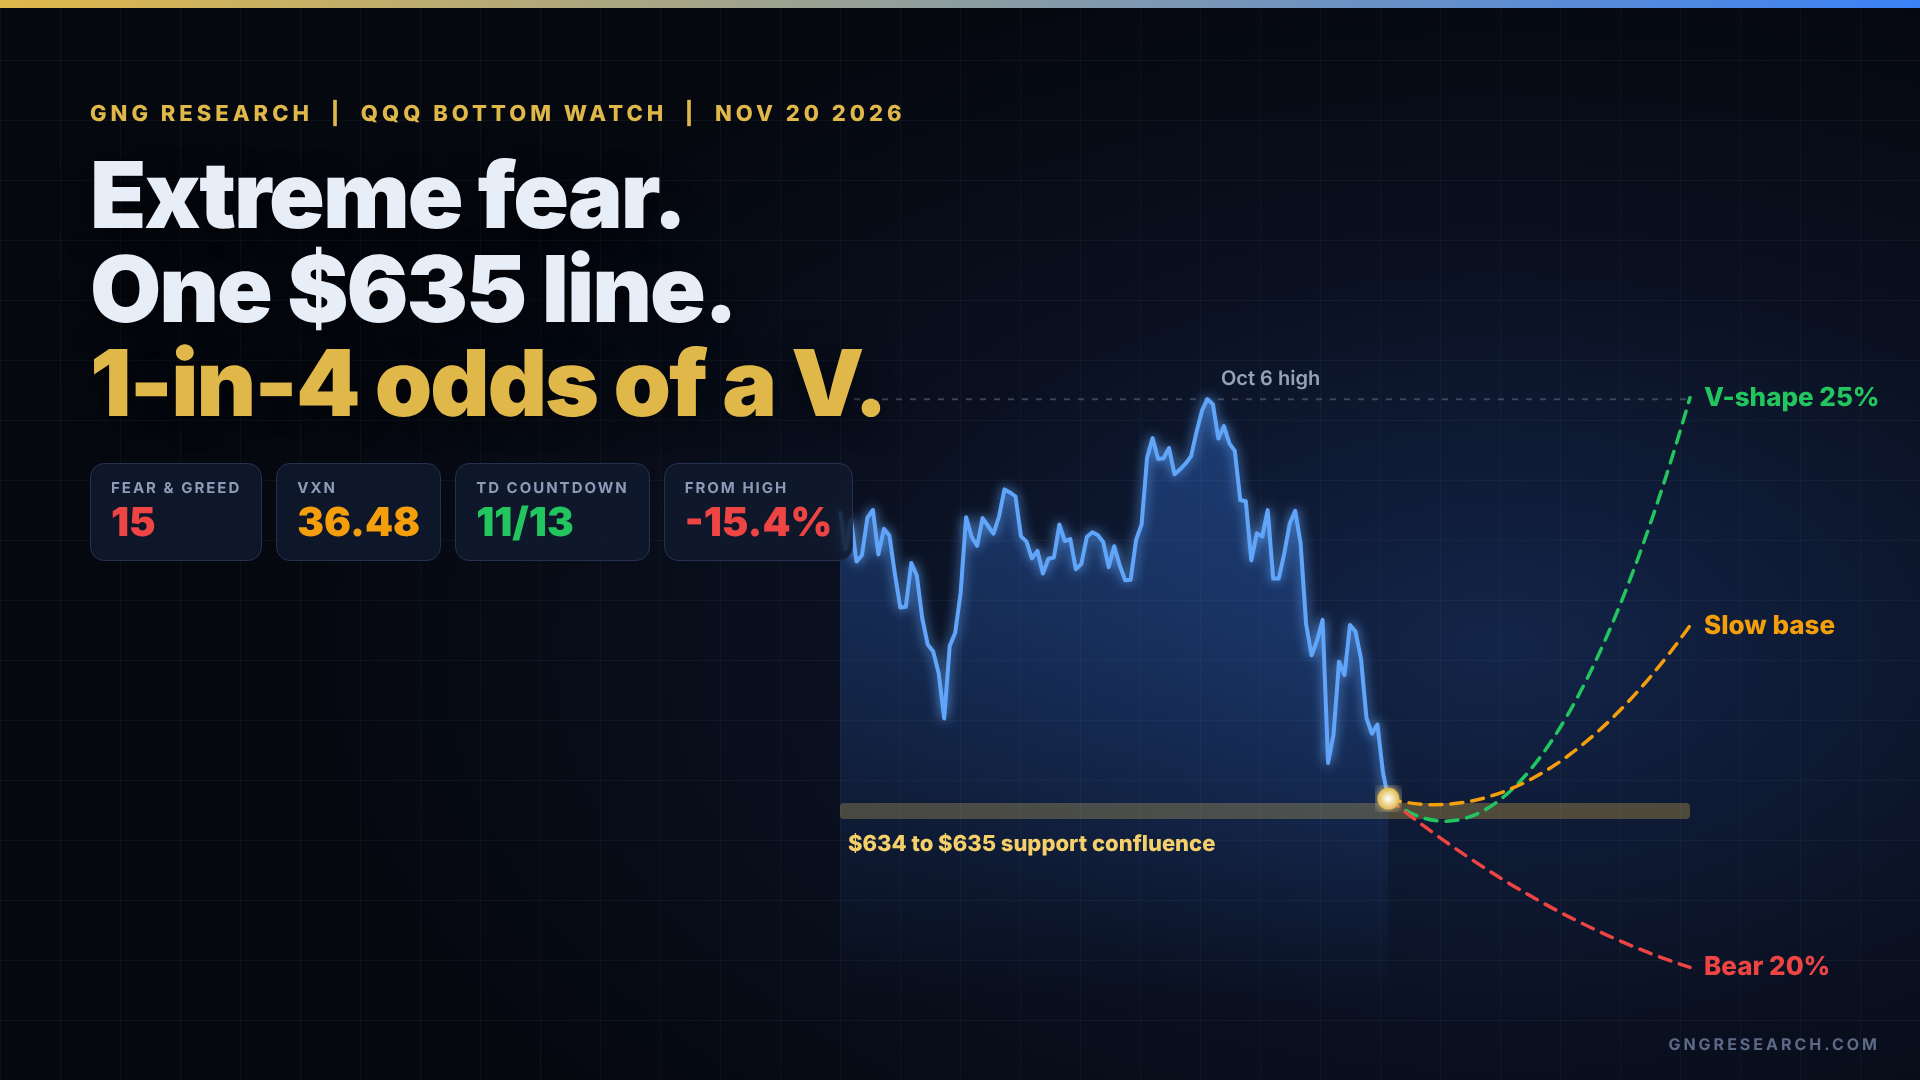

Fear & Greed read 15 this morning. The Nasdaq-100 volatility index closed Thursday at 36.48, roughly the 99th percentile of the past year, and the daily TD buy countdown on the Invesco QQQ Trust (QQQ) sits at 11 of 13. Those are the readings you usually see near the end of a selloff.
Then Thursday happened. QQQ ran to $676.49 intraday and closed at $645.04, the lowest close of this leg, and premarket trading pushed it to roughly $637.
I'm not ready to call that the low. I'm not ready to call it a crash either.
So which is it: a QQQ bottom forming, or the middle of the slide?
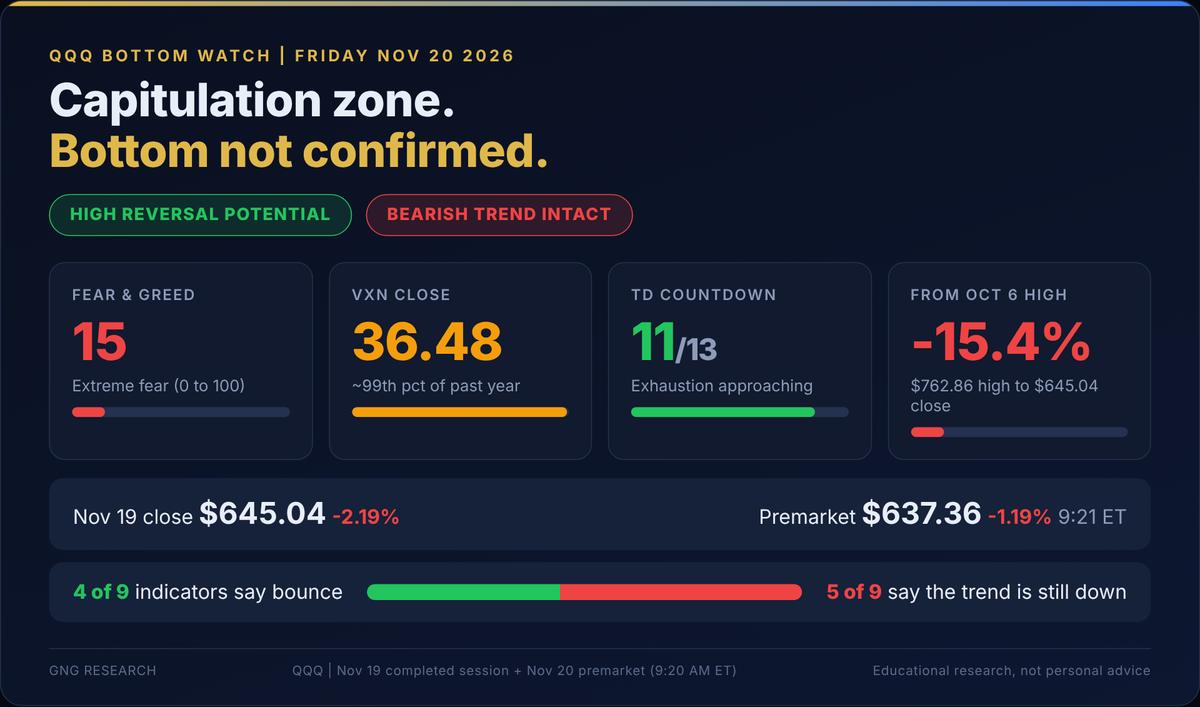
Free preview verdict: capitulation zone with high reversal potential, bearish trend still intact.
Here's the short version. The oversold and sentiment gauges argue for a sharp bounce soon. The trend tools argue the downtrend is still in charge, and on my nine-indicator count it's 4 against 5.
Two things made me stop scrolling before the open. Three tools that have nothing to do with each other (a volatility band, a Fibonacci retracement and a floor-trader pivot) land inside the same 92-cent window, and premarket has already tested it.
The second is history. Thursday was the 21st time since 1985 that the Nasdaq-100 closed 15% below its high for the first time. Only some of those turned into V-shaped recoveries, and one in five turned into something much worse.
GNG Research Pro members get the full breakdown below: the exact support level, the V-shape odds from all 20 prior episodes, the TD Sequential calendar into Thanksgiving week and a seven-level QQQ roadmap. Then three closing scenarios and a staged buying plan with hard invalidation points.
Sign in to leave a comment and join the discussion.
Sign Up Free