

Introduction
What do you do when the market stops making sense?
I have a simple answer. I go back to the basics. And when it comes to market basics, there's one list I keep coming back to.
It's a list of ten rules written by Bob Farrell, one of the most respected market analysts Wall Street has ever produced.
A big thank you to Kerby Roberson, who recently reminded me of these rules on X (Twitter). It was perfect timing, because I can't think of a better moment to revisit them than this market.
In October, the Nasdaq 100 had its worst month since March 2025. Semiconductor stocks went through one of their longest losing streaks in nearly two decades. Meanwhile, the "boring" part of the market had its best month relative to the S&P 500 in more than 15 years.
Fascinating, right?
To me, that's Farrell's rules playing out in real time.
However, in this article, I won't just list his ten rules, as that would be boring.
I'll group them into three pillars, show you where we stand on each rule, and give you six ideas (three for income, three for growth) that fit each pillar. I'll also show you where Farrell's rules fall short, add one rule of my own, and finish with a 10-question checklist you can apply to your own portfolio.
So, let's dive in!
Who Is Bob Farrell?
Bob Farrell joined Merrill Lynch (now part of Bank of America (BAC)) in 1957 after studying at Columbia under Benjamin Graham and David Dodd. Most of you know that these are the fathers of value investing.
Not a bad start, right?
He became the firm's chief market analyst in 1967 and held that title for more than 25 years. Moreover, in 16 of his last 17 years in that role, Institutional Investor voted him the best analyst in America at forecasting the direction of the stock market. And as we all know how tough it is to forecast the market, that is quite impressive.
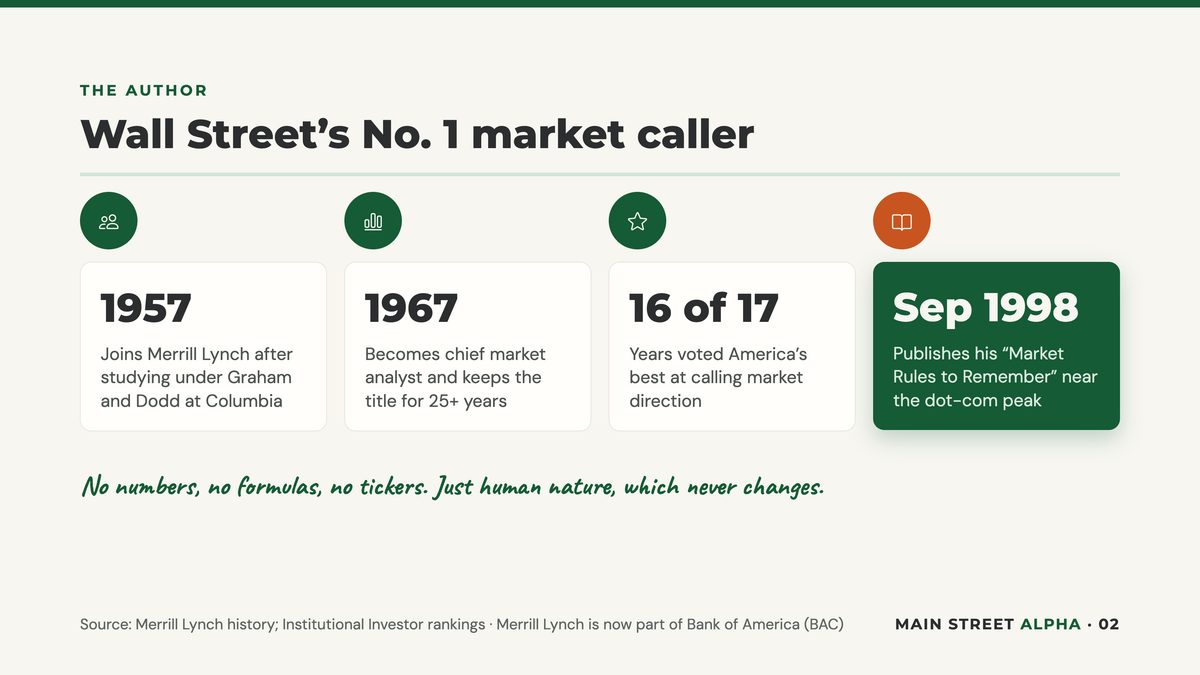
In September 1998, with the dot-com bubble approaching its peak, he published his "Market Rules to Remember."
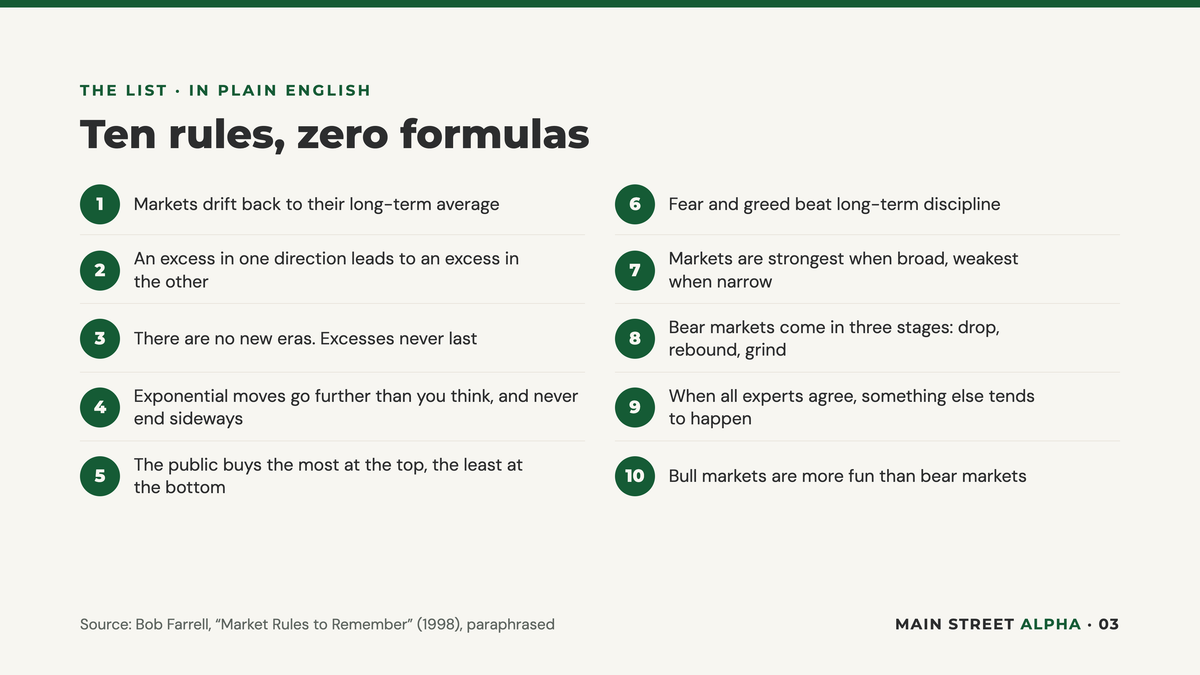
Here they are in plain English:
Markets tend to drift back to their long-term average over time.
An excess in one direction leads to an excess in the other direction.
There are no new eras. Excesses never last.
Exponential moves (up or down) usually go further than you think, and they don't end by moving sideways.
The public buys the most at the top and the least at the bottom.
Fear and greed beat long-term discipline.
Markets are strongest when they're broad and weakest when they narrow down to a handful of big names.
Bear markets have three stages: a sharp drop, a reflex rebound, and a long, grinding decline driven by fundamentals.
When all experts and forecasts agree, something else tends to happen.
Bull markets are more fun than bear markets.
Here's the sheet in case you want to copy and paste it:
What I love about this list is that it doesn't contain a single number, formula, or ticker. And if you know me, you know I like to keep things simple.
In fact, it's all about human nature. And human nature doesn't change.
The Farrell Dashboard
Before we get to the pillars, here's where I believe we stood on each rule going into this month:
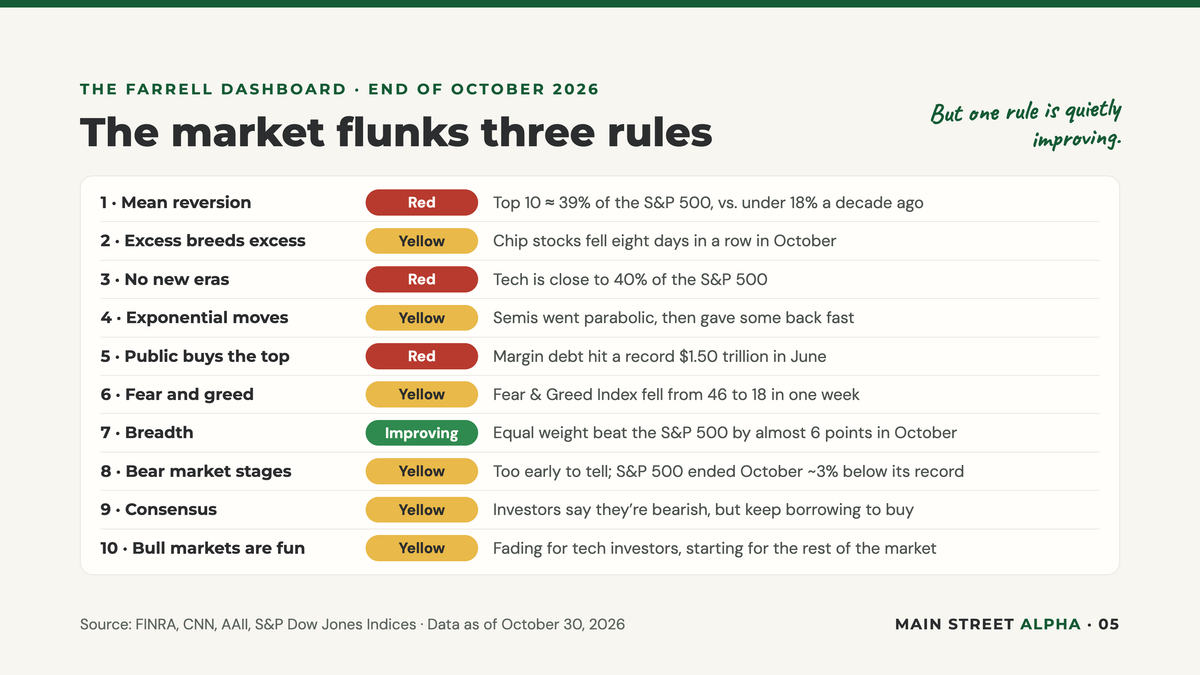
As you can see, we are dealing with three red lights.
No green light on the "danger" side.
And one rule (breadth) that is slowly improving.
I don't see a crash signal here. But I do see a very clear signal that the easy, one-way market of the past few years is over, as I have mentioned in a lot of articles in the past few months.
Now, let's look at what that means (read: could mean) for your money.
Pillar 1: The Pendulum (Rules 1, 2, and 3)
The first three rules all say the same thing in different ways.
Markets behave like a pendulum. They swing too far in one direction, then too far in the other. And they never stay at the extremes forever.
Farrell compared it to a rubber band. The further you stretch it, the harder it snaps back.
Right now, the most stretched rubber band in the market is concentration. The ten largest companies make up roughly 39% of the S&P 500. In the 2000 dot-com bubble, that number peaked at around 26%. One analysis published in October showed that without Nvidia (NVDA) and Micron (MU), projected 3Q26 earnings growth for the S&P 500 would drop from 29% to 20%.
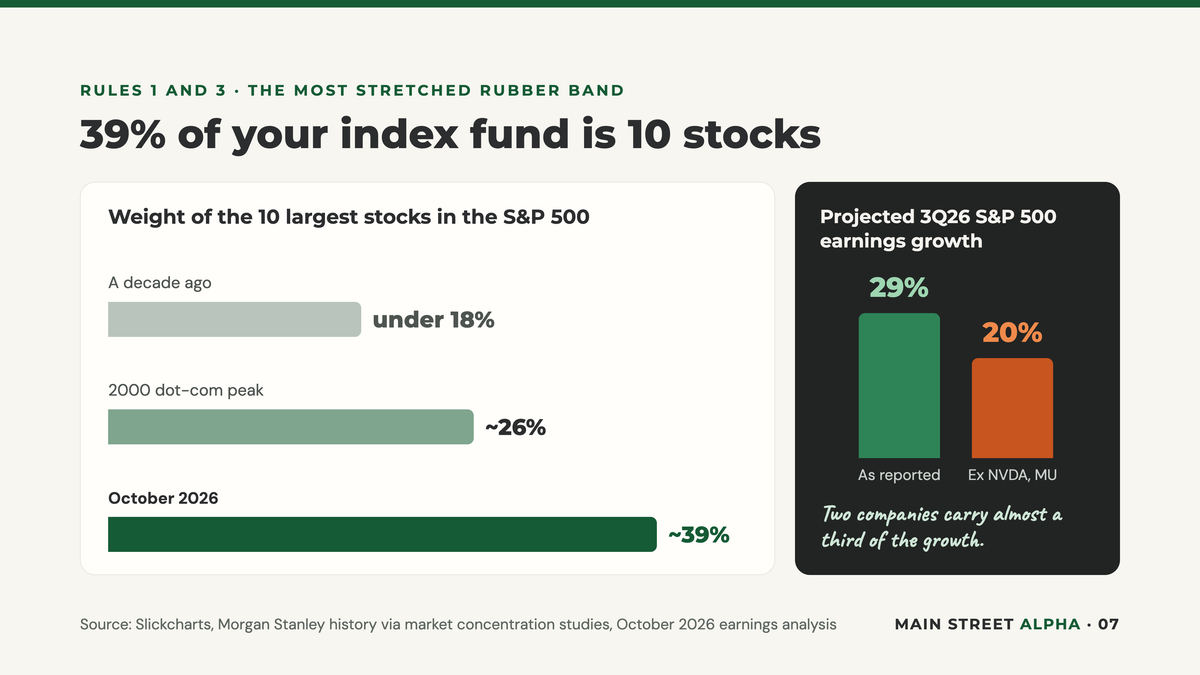
It sounds so dramatic, but essentially, the index you think of as "diversified" is a concentrated bet on AI. That can be good and bad, depending on what the market's perception is of AI growth opportunities.
Am I saying AI is a bubble? No.
I own Amazon (AMZN), and I believe AI is one of the biggest economic shifts of my lifetime. But that's exactly what Rule 3 warns about. The technology can be real while the prices people pay for it are not.
Now, here's the part most people miss.
Pendulums swing both ways. When one part of the market is stretched to the upside, another part is usually stretched to the downside. That's where I'm looking.
Sign in to leave a comment and join the discussion.
Sign Up Free