
Introduction
I love masterclasses. That is mostly because I get to spend days researching some of my favorite topics through an educational lens. Not only do we discuss America's best companies in specific areas, but we also dive into critical supply chains. This teaches us about the economy, megatrends, and (if I do my job well) gives you something you can apply in your own research process. You know what they say about teaching a man how to fish.
Today is very special to me. As most of you know, freight is one of my favorite topics in the entire market.
Think about it: almost everything you own spent time on a truck, a train, or a delivery van before it reached you.
And, as many of you know as well, I'm a big fan of the ISM Manufacturing Index. And right now, it's telling a story that transportation stocks have not fully priced in yet.
After our masterclasses on aerospace, Class I railroads, and the power grid, today is all about freight. We'll walk through how a shipment actually moves, which business models have pricing power, why 2026 has been one of the strangest freight cycles in years, and which stocks I like for both income and growth.
Many of you have asked for fresh names, and freight has plenty of them.
So, as we have a lot on our plate today, let's dive right in!
The ISM Is Booming - Transports Are Lagging
Let's start with the chart that triggered this article.
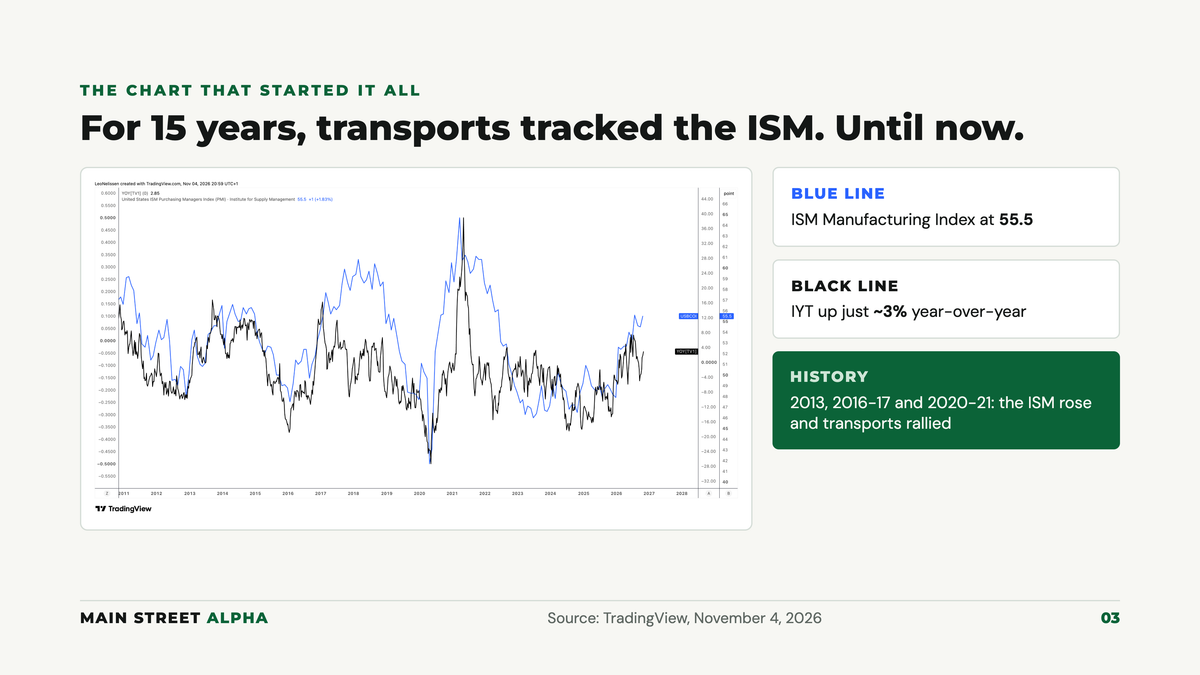
It may be slightly hard to see the details (sorry!), but what you're looking at are two lines. The blue line is the ISM Manufacturing Index. The black line is the year-over-year performance of the iShares U.S. Transportation ETF (IYT).
For most of the past 15 years, these lines moved together. When the ISM rose in 2013, 2016-2017, and 2020-2021, transportation stocks rallied. That makes sense. More manufacturing means more goods to move.
Now look at the right side of the chart.
The ISM is at 55.5, up 1.0 point from September. That's one of its strongest readings since 2022, and it caps a strong manufacturing rebound in 2026.
Meanwhile, IYT is up roughly 3% year-over-year.
There are two ways to read this:
Transports are lagging and have room to catch up.
Transports are telling us something the ISM isn't.
I believe it's a bit of both, and part of it comes down to what's inside IYT. Union Pacific (UNP) and Uber (UBER) account for roughly a third of the fund, and airlines like Delta (DAL) and United (UAL) make up another big chunk. Uber has nothing to do with the ISM, and airlines have their own set of problems.
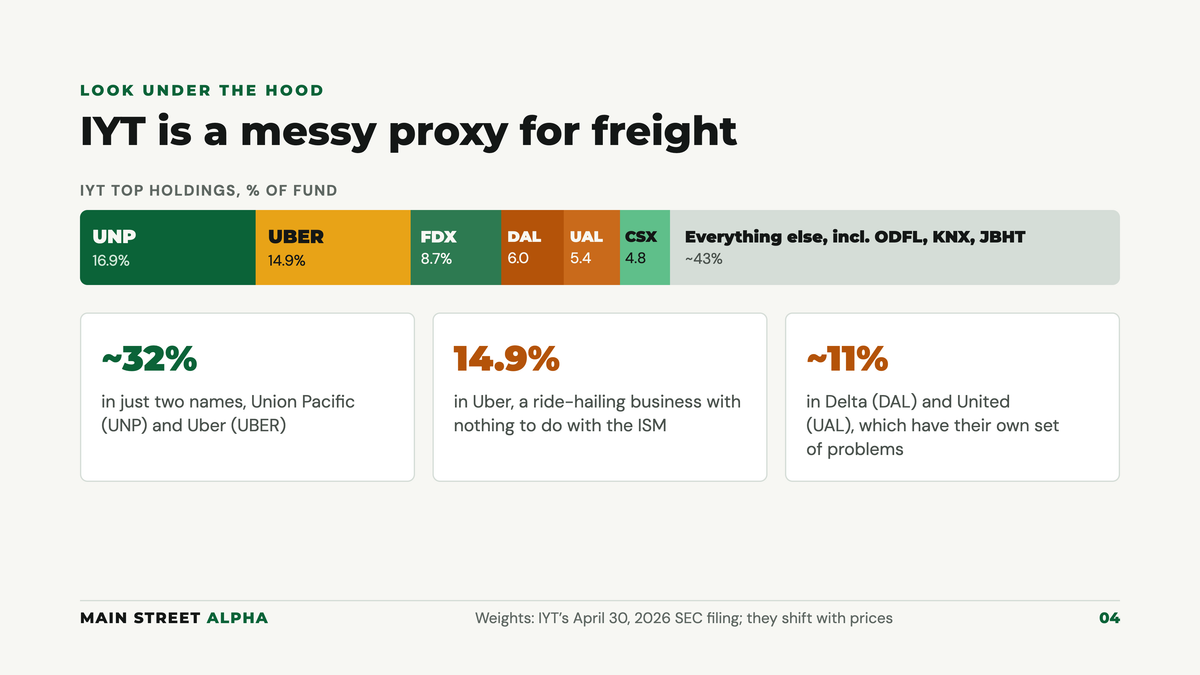
What I'm getting at is that IYT is a messy proxy for freight. When we look at the actual freight companies, the picture becomes much more interesting.
How A Pallet Actually Moves
My professors used to say that you don't understand a business until you can follow one unit of product through the system. And that was coming from a professor who spent decades in the automotive industry, which is one of the most complex supply chains you can imagine.
So, let's follow a pallet of industrial parts from Ohio to Texas.
The shipper (the factory) has freight to move.
The broker (also called a third-party logistics provider or 3PL) often finds a truck for it. Brokers like C.H. Robinson (CHRW) own almost no trucks. They match shippers with more than 780,000 motor carriers in the U.S. and earn the spread between what the shipper pays and what the carrier gets.
The carrier moves it, and here the shipper has to choose a mode.
Simple, right?
Let's make this slightly more complex.
There are four main modes:
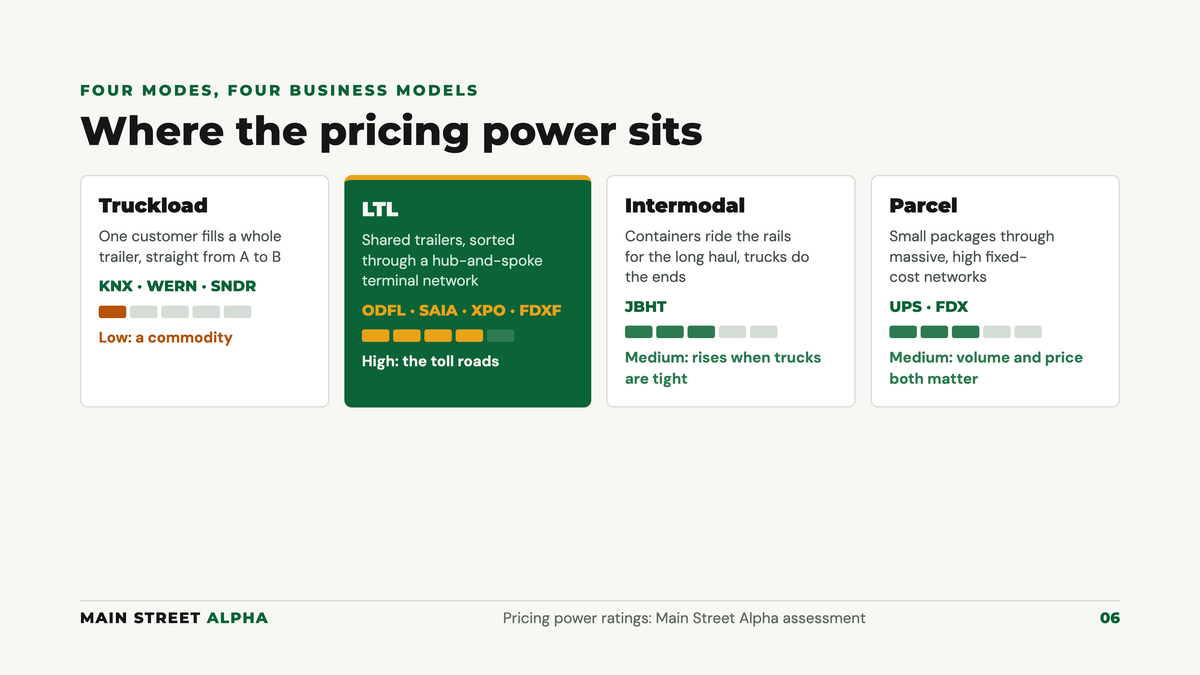
Truckload (TL): One customer fills an entire trailer. The truck goes straight from A to B. Think Knight-Swift (KNX), Werner (WERN), and Schneider (SNDR).
Less-than-truckload (LTL): Our pallet only fills a fraction of a trailer. So, it gets picked up, brought to a terminal, sorted, combined with freight from other customers, and sent through a hub-and-spoke network. Think Old Dominion (ODFL), Saia (SAIA), XPO (XPO), and FedEx Freight (FDXF).
Intermodal: The freight is loaded into a container that travels most of the distance by rail and the first and last miles by truck. It's cheaper than trucking on long routes but slower. J.B. Hunt (JBHT) is the leader here.
Parcel: Small packages. United Parcel Service (UPS) and FedEx (FDX).
And then there's the company that builds the trucks everyone above depends on: PACCAR (PCAR), the maker of Kenworth, Peterbilt, and DAF trucks.
Needless to say, each of these businesses has completely different economics.
The Number That Rules Freight
One of the most important numbers in transportation is the operating ratio.
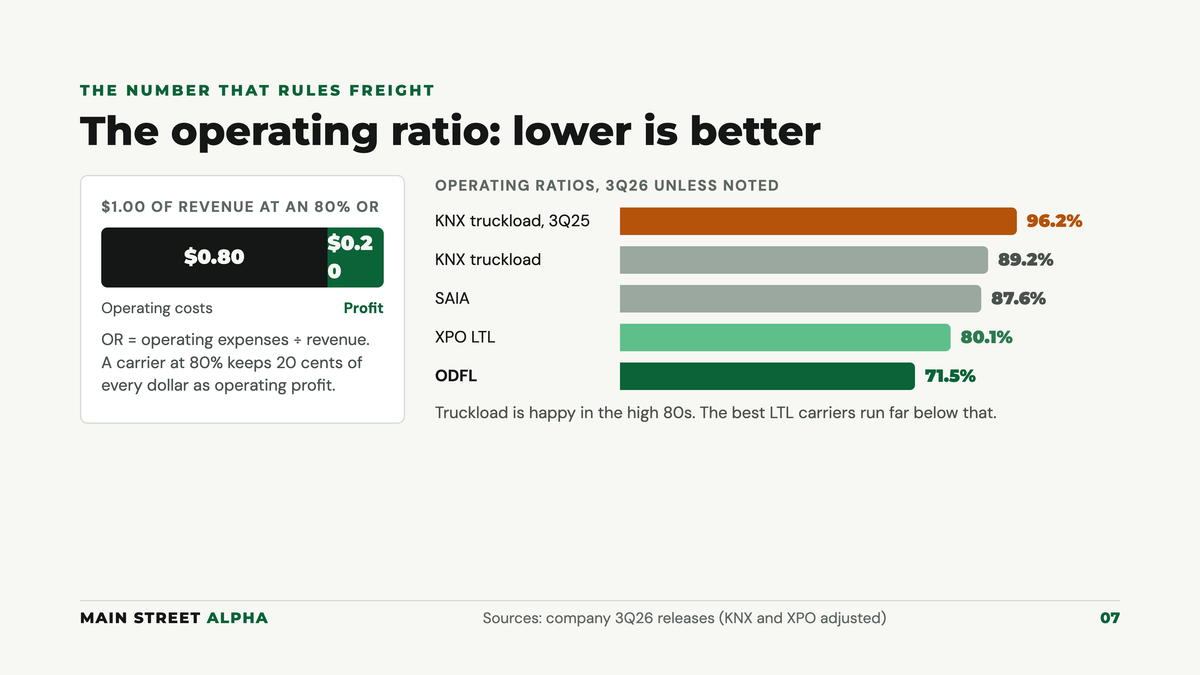
The operating ratio ("OR") is operating expenses divided by revenue. So, an OR of 80% means a company spends $0.80 to generate $1.00 of revenue, keeping $0.20 as operating profit. Lower is obviously better.
This number tells you almost everything about freight quality:
Most truckload carriers are happy with an OR in the high-80s. In bad years, it can go above 95%. Numbers above 100% aren't uncommon, either.
A good LTL carrier runs in the 80s, and the best ones get below 80%.
Old Dominion ran at 71.5% in 3Q26.
Why such a big gap?
Truckload is a commodity. Anyone with a CDL (commercial driver's license), a truck, and insurance can compete, which is why rates collapse when capacity floods in.
LTL is different. To compete, you need hundreds of terminals with thousands of doors in the right locations, sorting technology, linehaul schedules, and density (enough freight in every market to fill trucks efficiently). Try getting a new truck terminal permitted near a major city in 2026. Good luck.
That's why I often call LTL terminals the toll booths of trucking. It's the closest thing freight has to my TOLL+M framework: tangible assets, a consolidated industry, and pricing power that lasts through the cycle.
The one weakness is capital intensity. LTL carriers need to keep investing in terminals and equipment. But the best ones earn excellent returns on that capital.
Why 2026 Is A Strange Freight Cycle
Normally, freight cycles are driven by demand. The economy picks up, rates rise, carriers buy more trucks, and rates collapse again.
This cycle is different. It's driven by supply.
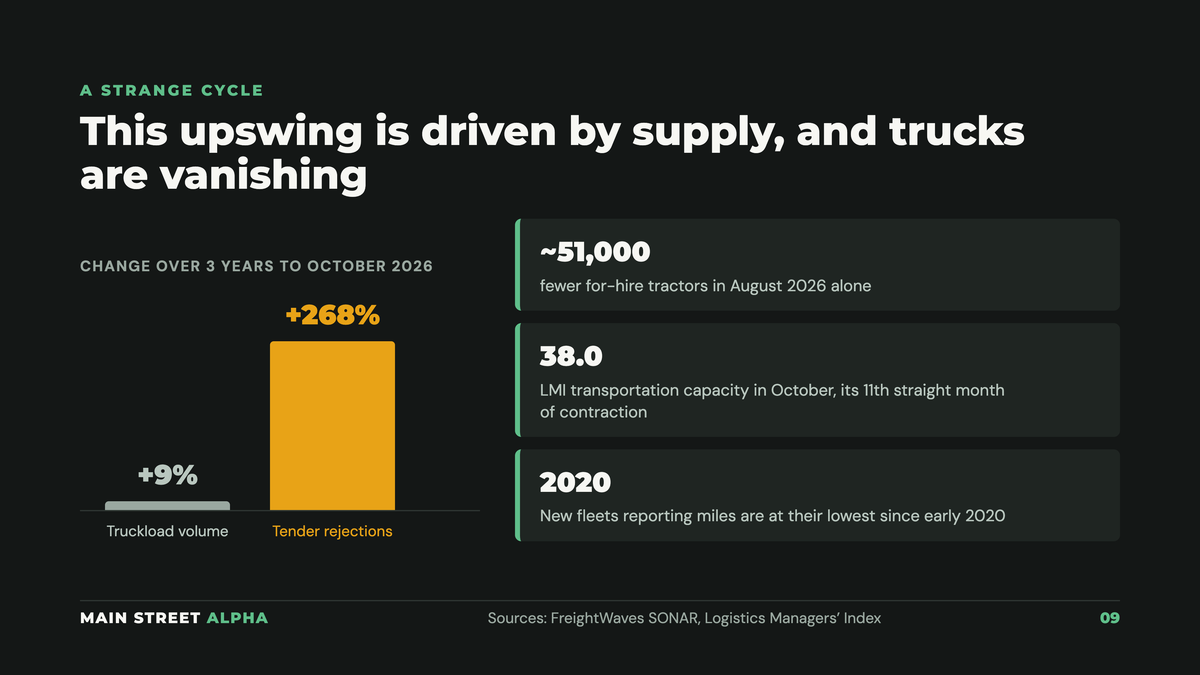
Over the three years ending October 2026, the SONAR Truckload Volume Index rose 9%. Over the same period, truckload tender rejections (the share of contracted loads carriers turn down because they can get better rates elsewhere) rose 268%.
Moreover, total for-hire tractors fell by about 51,000 in August alone, and new fleets reporting miles are at their lowest level since early 2020. The Logistics Managers' Index shows transportation capacity contracted for the eleventh consecutive month in October, at 38.0.
What's driving this?
Three things:
Driver rules. The federal government's crackdown on English proficiency and a final rule on non-domiciled CDLs (licenses for foreign-domiciled drivers), which took effect on March 16, 2026. FMCSA estimated that roughly 194,000 drivers could ultimately exit the market as their licenses expire.
Insurance and operating costs. Rising premiums and legal costs are pushing smaller carriers out and keeping new ones from entering.
Broker liability. On May 14, 2026, the Supreme Court unanimously ruled in Montgomery v. Caribe Transport II that federal law does not shield brokers from state negligent-hiring lawsuits. Brokers are now forced to vet carriers much more carefully, which squeezes out weaker operators.
The result is that freight has repriced before demand has fully recovered. And here's the good news: demand is now starting to show up. One industry LTL volume gauge turned positive heading into October for the first time in 42 months, and ODFL saw positive year-over-year tonnage in September.
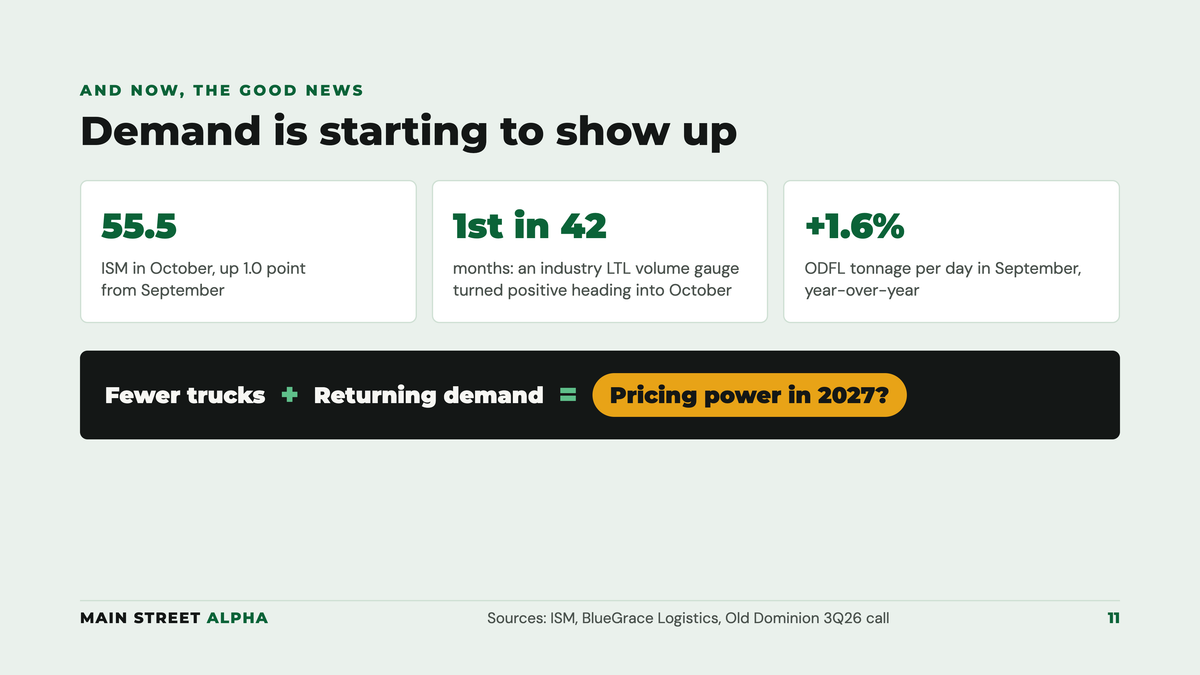
If demand keeps improving into a market with fewer trucks, pricing could get very interesting in 2027.
Sign in to leave a comment and join the discussion.
Sign Up Free