
Updated November 7, 2026 with the post-election policy picture. Screen data as of the November 6 close.
Vertiv (VRT) grew third-quarter sales 61% and its organic orders more than doubled. GE Vernova (GEV) now holds 122 GW of gas turbine backlog and slot reservations. Modine (MOD) nearly doubled its data center sales.
At the November 6 close Vertiv sat ~52% below its 52-week high. Modine sat ~72% below. Constellation (CEG) was ~34% off its high. Then election week delivered three governors-elect who ran on promises of data center moratoriums or pauses.
The easy read says the AI power trade finished. The backlogs disagree, and so does the grid.
Who can turn data center power demand into operating megawatts and cash flow, on what schedule and at whose cost?
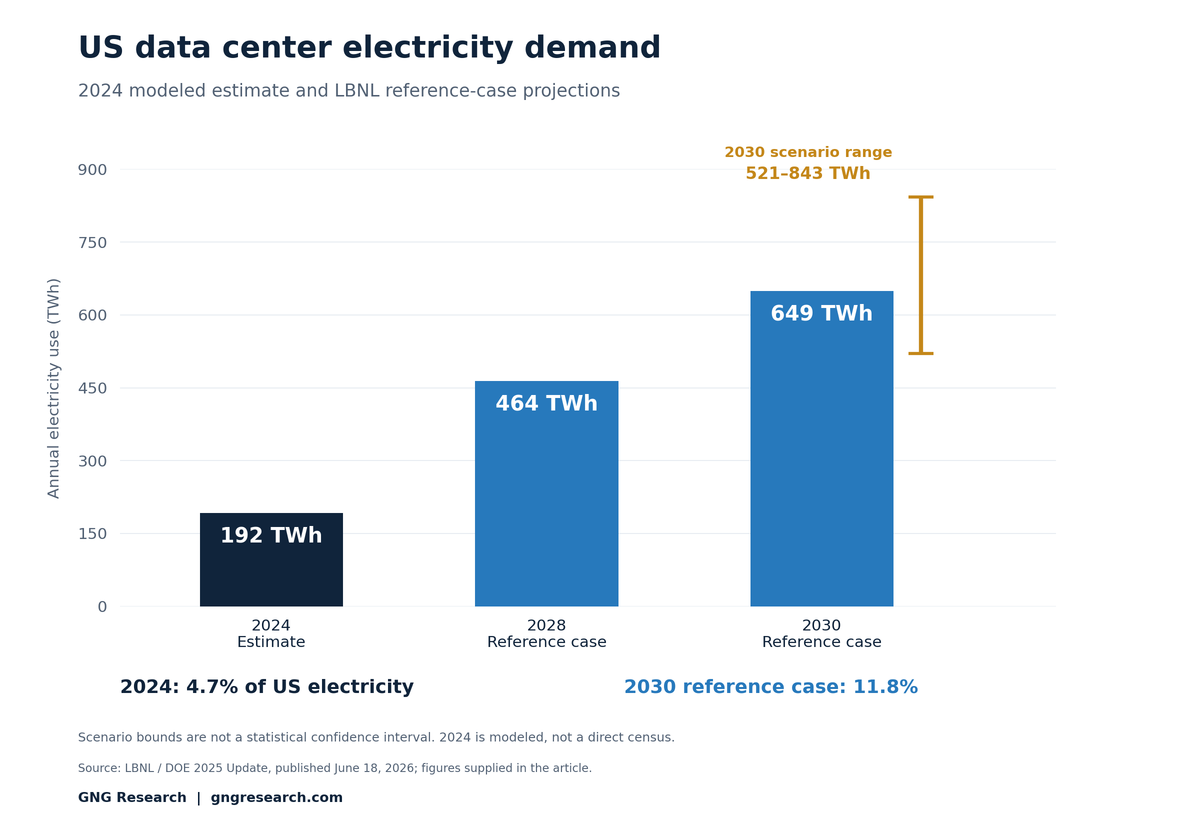
The short answer. US data centers used an estimated 192 TWh of electricity in 2024, 4.7% of the US total, per Lawrence Berkeley National Laboratory. Its reference case reaches 649 TWh and 11.8% by 2030. Usable megawatts are the bottleneck. Grid connections, equipment, cooling and permits decide who gets paid first.
What data center power demand means for investors
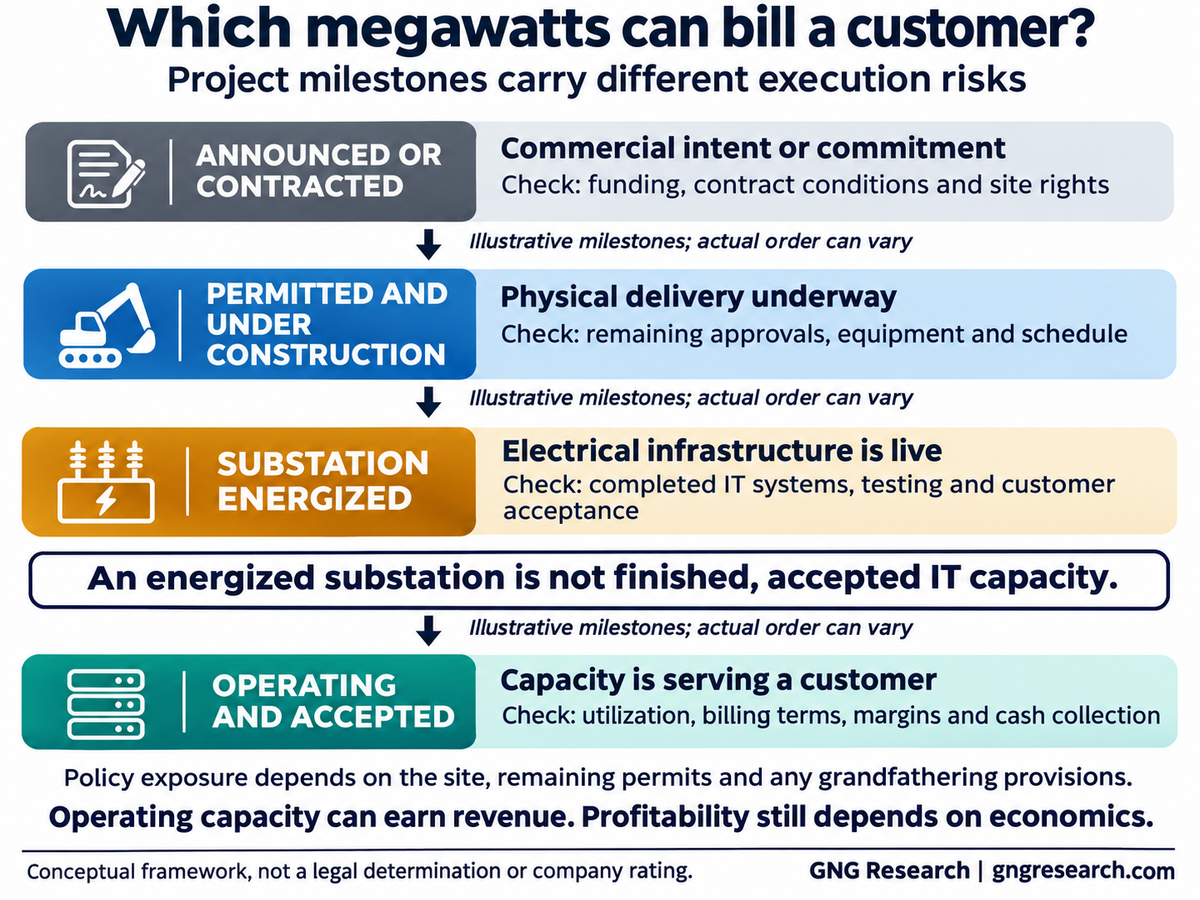
Data center power demand is the electricity a facility draws to run its servers plus everything that keeps them alive: cooling and power conversion plus lighting and backup systems. For investors the useful unit is the operating megawatt. A signed contract, a grid application and an announced campus are all promises. Only energized capacity bills a customer.
Let me flag that distinction now because I'll come back to it in every section. It separates the companies already collecting cash from the ones still waiting on a utility, a turbine or a permit.
IT load vs facility load
IT load is what the servers, storage arrays and network gear consume. Facility load is IT load plus the overhead around it.
The Department of Energy calls the ratio between the two PUE (power usage effectiveness) and defines it as total facility annual energy divided by IT equipment annual energy. A building running at a PUE of 1.2 that hosts 100 MW of IT load draws ~120 MW in total. Cooling is only part of those extra 20 MW, with power conversion losses and other systems mixed in.
One number to keep in your head for every headline you'll read: a 1 GW load running all year uses 8.76 TWh. A 1 GW grid application falls well short of 8.76 TWh of real demand once load factor and redundancy cut into it and the ramp-up takes its time.
Why AI packs megawatts into less floor space
AI training and inference racks pull far more power per square foot than the enterprise servers most data centers were built for. NVIDIA (NVDA) puts its GB200 NVL72 rack at ~120 kW. Its GB300 NVL72 reference architecture calls for up to 142 kW per rack.
Same building and footprint with several times the heat, and that's why power and cooling now move together.
Key terms
Term | What it means |
|---|---|
Operating megawatt | Capacity that is built, energized and serving a customer. |
PUE | Total facility energy divided by IT equipment energy, measured over the same period. |
Direct-to-chip cooling | Liquid flows through cold plates mounted on the hottest processors and carries heat away. |
Immersion cooling | Servers sit submerged in a dielectric fluid that absorbs heat directly. |
CDU (coolant distribution unit) | Equipment that controls coolant temperature, flow and pressure and can separate the facility water loop from the IT loop. |
Interconnection queue | The line of projects waiting for a utility or grid operator to study and approve a grid connection. |
Capacity price | What a grid operator pays generators to be available at peak, quoted per MW-day. It is separate from the energy price per MWh. |
Offtake agreement (PPA) | A long-term contract to buy a plant's output. |
The demand stack: where the megawatts show up
The three most cited forecasts measure different things. LBNL puts US data center consumption at 192 TWh in 2024 and 649 TWh by 2030 in its reference case. EIA tracks server electricity inside the commercial sector. The IEA projects global data center use roughly doubling from 485 TWh in 2025 to 950 TWh in 2030.
Which of these should you trust? Each one answers a different question, and the common mistake is stacking them on top of each other as if they shared a denominator.
The national estimates, dated and sourced
Source (published) | What it measures | Figure |
|---|---|---|
LBNL / DOE 2025 Update (June 18, 2026) | US data center electricity, 2024 estimate | 192 TWh, 4.7% of US electricity |
LBNL / DOE 2025 Update | US reference case, 2028 | 464 TWh |
LBNL / DOE 2025 Update | US reference case, 2030 | 649 TWh, 11.8% |
LBNL / DOE 2025 Update | US scenario bounds, 2030 | 521 to 843 TWh, 9.5% to 15.3% |
EIA AEO2026 (Today in Energy, May 19, 2026) | Servers as a share of commercial-sector electricity | 7% in 2025, 22% to 33% by 2050 |
IEA Key Questions on Energy and AI (April 16, 2026) | Global data center electricity | 485 TWh in 2025 to 950 TWh in 2030, ~3% of world electricity |
Before you quote any of these, a few cautions. LBNL's 2024 number comes out of a model. Its range combines several uncertainties, so don't read it as a statistical confidence band. EIA's share covers servers inside commercial buildings only, which means it can't stand in for a share of all US electricity.
The IEA's global figure comes from a different model again, so dividing it into LBNL's US forecast gives you a number neither source published.
Utility forecasts are a different animal
Grid operators plan for peak demand across the whole system. PJM is the largest US grid operator. Its 2026 long-term forecast projects summer peak reaching 183,008 MW in 2030 and ~222,000 MW in 2036, which works out to ~3.6% a year over ten years.
PJM's revision says more than the headline. It trimmed near-term load growth compared with last year after vetting large-load requests more carefully. ERCOT is doing the same thing in Texas, adjusting utility-submitted peak forecasts because raw requests overstate what will actually connect.
I think better filtering shrinks the paper demand. I don't think it proves the underlying demand went away, and I'd want to see energized megawatts fall before believing that.
For the grid-wide economics of who earns money from a power shortage, see our Power Grid Masterclass (free registration).
The grid bottleneck: queues, transformers and turbines
A data center needs a grid connection and the transformers and switchgear to use it, plus enough generation behind it. Each piece has its own waiting line. The median power project completed in 2025 took more than five years from interconnection request to operation, per LBNL. Transformer and switchgear lead times ran 31 to 54 weeks in early 2026.
Interconnection queues
LBNL's Queued Up 2026 edition counted more than 8,200 projects and ~2,060 GW of generation and storage waiting for grid connections at the end of 2025. Only ~13% of the capacity requested from 2000 to 2020 was operating by the end of 2025. These are queues for power plants and batteries, separate from data center load requests. The supply side has to clear them before new demand can be served, which is why I track them alongside the load forecasts.
Capacity prices
PJM's auction for the 2028/29 delivery year cleared at the $325 per MW-day price cap and came in 6,831 MW short of its reliability requirement. The two prior auctions cleared at $333.44 and $329.17.
A capacity price pays plants to be available at peak, and it sits apart from the per-MWh price on your power bill. The obvious objection is that a 6,831 MW shortfall means blackouts are coming. It means the system is tight at the price ceiling regulators set, which is a narrower claim.
Equipment lead times and turbine backlogs
Gilbane's Q1 2026 market survey put pad-mounted transformers at 31 to 51 weeks and low-voltage switchgear at 32 to 54 weeks. Large engineered transformers are a separate and slower product class.
On the generation side the backlogs run deep.
Company (period) | Disclosed backlog |
|---|---|
GE Vernova (Q3, Sept 30, 2026) | Gas power: 64 GW firm backlog plus 58 GW slot reservations = 122 GW, targeting at least 130 GW by year-end |
Siemens Energy (Q3 FY26, June 30, 2026) | Gas Services backlog EUR 73 billion, book-to-bill 2.65 |
Mitsubishi Heavy Industries (Sept 30, 2026) | Large-frame gas turbine backlog 83 units, 37 GW |
Read the GE Vernova line carefully. Nearly half of that 122 GW is reservations, which hold a factory slot and can still lapse. Siemens Energy's figure includes service work, so it can't be compared with GE Vernova's gigawatts. No company's backlog divided by factory output gives you a reliable delivery date either.
Gas turbines for data centers as bridge power
When the grid can't connect a campus fast enough, developers look at on-site gas generation. That can shorten the wait but brings its own constraints: an air permit, a gas pipeline agreement and a turbine slot that may itself be years out.
In my view bridge power just moves the bottleneck.
Liquid cooling: when air runs out of room
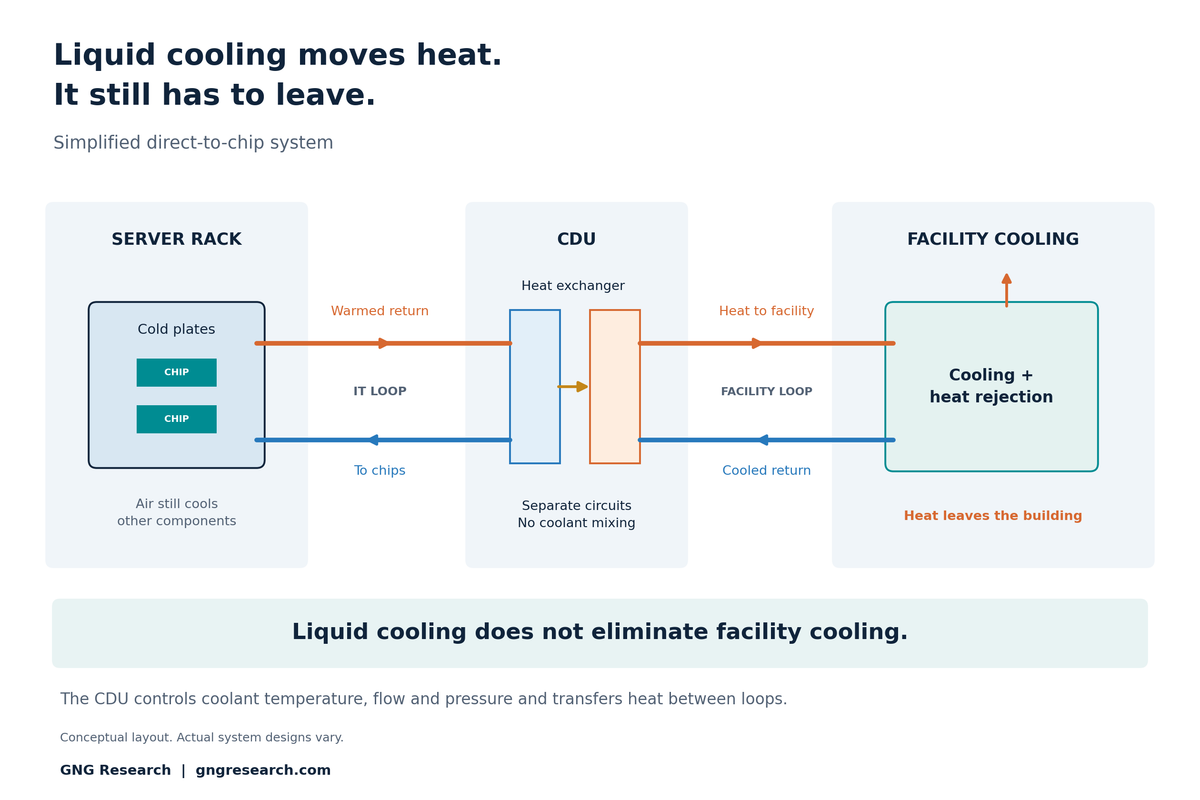
Dense AI racks produce more heat than moving air can carry away efficiently, so NVIDIA's rack-scale systems are designed for liquid cooling. Direct-to-chip cooling pipes liquid to cold plates on the processors, while immersion submerges hardware in dielectric fluid. A CDU controls the coolant loop. DOE said in 2023 that cooling can reach up to 40% of facility energy.
Rack density by NVIDIA platform
Platform | NVIDIA figure | What it means |
|---|---|---|
GB200 NVL72 | ~120 kW per rack | NVIDIA's stated platform demand |
GB300 NVL72 | Up to 142 kW per rack | Official reference architecture |
Vera Rubin NVL72 | Liquid-cooled compute, four power shelves rated 110 kW each | Shelf ratings are capacity and do not add up to actual rack demand |
You'll see 190 to 230 kW figures for Rubin racks in trade coverage, but those are third-party estimates and NVIDIA hasn't published an official operating-demand number for that rack.
Before we go further, a caution on thresholds. No single kW level marks the point where air cooling stops working everywhere, because it depends on heat flux, airflow, inlet temperatures and the building. The densest AI systems ship with liquid in mind either way.
Direct-to-chip vs immersion vs CDU
Direct-to-chip cooling runs coolant through cold plates bolted to the high-power processors. Fans and room air still handle the lower-heat components.
Immersion cooling submerges suitable hardware in a dielectric fluid. That changes how technicians service the equipment and narrows which hardware can go in the tank.
A CDU sits between the two worlds. It delivers controlled, clean coolant to direct-to-chip or immersion equipment and keeps the IT loop separate from facility water.
None of these removes the final step because heat still has to leave the building through chillers, dry coolers or towers. Liquid at the chip makes the system more efficient while every watt of that heat still has to go somewhere.
How far can efficiency go? DOE's 2023 COOLERCHIPS announcement said cooling can account for up to 40% of a data center's energy use. ARPA-E's research target for the same program is cooling energy below 5% of IT load. Treat the first as an old upper bound and the second as a goal, and use neither as today's industry average.
What cooling growth looks like in supplier results
Company (quarter) | Result |
|---|---|
Vertiv (Q3 2026, Sept 30) | Sales $4.313 billion, up 61% reported and 55% organic. Organic orders more than doubled. Adjusted operating margin 25.2% |
Modine (Q2 FY2027, Sept 30) | Data center sales $439.7 million, up 95%. Data Centers segment gross margin 19.7%, down 470 basis points, with record orders and backlog |
Two points for investors. Vertiv's growth includes more than liquid cooling, so the headline sales number overstates pure liquid exposure. Modine shows what fast growth can cost, with data center sales up 95% while segment gross margin fell 470 basis points. Growth that dilutes margins needs a payoff later, and I want to see Modine's margin recover over the next few quarters as proof.
Neither company disclosed a numerical backlog for the September quarter in the sources we used, so this guide doesn't cite one.
Nuclear power for data centers: firm power on slow timelines
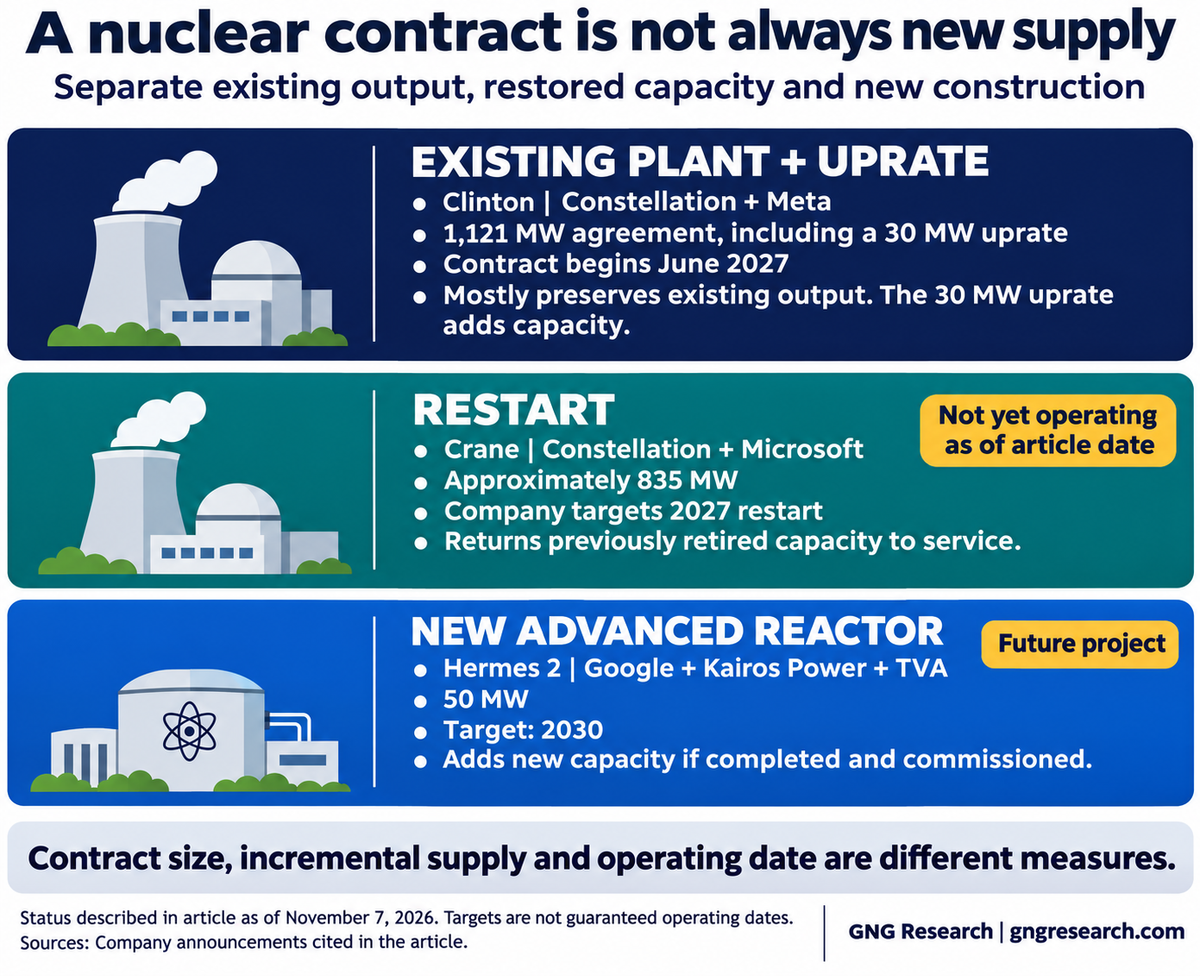
Nuclear plants run 24/7 outside refueling outages, which suits data centers with constant load. Near-term deals mostly restart or extend existing reactors. Newly built advanced reactors and SMRs look like a 2030s story, according to the Office of Nuclear Energy at DOE. A signed offtake agreement is not an operating reactor, and an existing-plant contract often preserves output without adding new supply.
Restarts and existing plants
Deal | Size | Status as of Nov 7, 2026 |
|---|---|---|
Constellation and Microsoft, Crane (Three Mile Island Unit 1) restart | ~835 MW, 20 years | Company targets a 2027 restart after FERC and NRC milestones in August. Not yet operating |
Constellation and Meta, Clinton (Illinois) | 1,121 MW including a 30 MW uprate, 20 years from June 2027 | Mostly preserves existing output. The uprate is the new capacity |
Talen (TLN) and Amazon, Susquehanna | Up to 1,920 MW through 2042 | Full contracted amount no later than 2032, moving toward front-of-meter supply |
Meta with Vistra (VST), TerraPower and Oklo | Up to 6.6 GW of new and existing power by 2035 | Mixes existing plants, uprates and future projects |
A 20-year nuclear contract sounds like new supply, and you'd be forgiven for reading it that way. For each line ask whether the contract creates new megawatts or locks in megawatts that already exist. Both can be good business, but only the first adds supply to the grid.
For a deeper look at the nuclear fuel chain and its listed names, see The Nuclear Stack (GNG Pro).
Advanced reactors and SMRs are mostly a 2030s story
The named advanced projects have real sponsors and long timelines. Google (GOOG) with Kairos Power and TVA target the 50 MW Hermes 2 plant for 2030 inside a broader goal of up to 500 MW by 2035. X-energy's Cascade project with Energy Northwest starts at 320 MWe and could expand to 960 MWe. In October 2026 Amazon (AMZN), X-energy and American Electric Power (AEP) announced plans to explore 12 Xe-100 reactors targeting 960 MW in Indiana.
The NRC's current generic schedule allows 18 months for a construction permit review, and that's only the review deadline. The review is only one step: financing, construction and the approvals needed to load fuel also matter. Can nuclear power data centers next year then? Existing plants already do, and new reactors mostly need until the 2030s.
Co-location and who pays for the grid
Putting a data center next to a power plant sounds like a way around the grid, but federal regulators haven't let it work that simply. In December 2025 FERC told PJM to write clearer co-location rules. In June 2026 it opened large-load proceedings covering cost allocation and transparency along with stranded-cost protection, with responses due November 16 for five grid operators and November 20 for SPP.
FERC itself says these show-cause orders neither make final findings nor impose new rates. I'll be reading those filings closely.
After the election: whose power is already usable?
Dated update, November 7, 2026.
Governors-elect in Texas and Ohio campaigned on data center moratoriums or conditions, and Georgia's governor-elect campaigned on a pause. Campaign platforms are not enacted orders, and the scope and grandfathering rules don't exist yet. The useful split runs between capacity already operating and capacity still waiting on approvals.
What was actually promised
State | What is established | Status |
|---|---|---|
Texas | Governor-elect Gina Hinojosa's platform calls for an immediate moratorium until legislative protections and community input are in place, plus an end to tax giveaways | Campaign platform. No new statewide order yet |
Ohio | Governor-elect Amy Acton backed a conditional moratorium: developers cover utility costs, meet labor, environmental and transparency standards and support community benefits | Conditions on new projects. Not a ban on all projects |
Georgia | Governor-elect Keisha Lance Bottoms campaigned on a pause and a review of incentives, per post-election reporting | Proposal. Operative text not yet available |
New York (before the election) | A July 14 executive action pauses certain state environmental permits for up to one year while standards are developed | In effect. Does not shut operating facilities |
The obvious worry for anyone holding a supplier is that every campaign promise turns into a cancelled order. You may have seen an estimate that ~45% of planned US capacity is exposed to possible restrictions. This guide skips it because the underlying project list and its treatment of grandfathered projects weren't available to check, and exposure to a proposal still isn't cancelled capacity.
We also aren't claiming voters rejected AI, since reporting supports rising political resistance to data centers but can't isolate why people voted the way they did.
Operating megawatts vs pipeline megawatts
Restrictions can make existing, permitted capacity scarcer and more valuable. They can also delay unbuilt campuses while interest and holding costs keep running. The same company can sit on both sides.
IREN (IREN) shows how that works. Its November 5 results say Horizon 1 was delivered to Microsoft (MSFT) while Horizons 2 through 4 were in late-stage construction. Its 2 GW Sweetwater hub in Texas carries a conditional ERCOT classification, and its high-voltage substation is energized with 300 MW gross of data center construction targeted for Q4 2027. An energized substation is not finished, accepted IT capacity.
IREN also pushed its target of more than $4 billion in annualized revenue run-rate from November to January, possibly February 2027. The company tied that to design changes and supplier timing. That delay predates the election.
Who gains and who gets hurt, by business type
Business | Possible benefit | Possible harm | What decides it |
|---|---|---|---|
Operating, permitted compute | Scarcity can support pricing at renewal | Fixed-price contracts capture little near-term upside | Contract repricing dates, actual exemptions |
Unbuilt campuses and pipelines | A secured approval becomes more valuable | Delays push revenue out while costs continue | Energization rights, remaining permits, funding runway |
Existing nuclear owners (CEG, VST, TLN) | Dependable supply gains contract value | Slower local load growth or cost allocation can cut new contracting | Signed terms, permitted uprates |
Regulated utilities (AEP, D, SO) | Deposits and minimum bills cut stranded-asset risk | Less realized demand means less rate-base growth | Approved tariffs, allowed returns |
Grid equipment (ETN, HUBB, NVT) and transmission builders (PWR) | Grid upgrades still needed; demand relocates | Cancellations and longer permits defer orders | Firm orders, cancellation clauses, geography |
Cooling (VRT, MOD, TT) and installers (FIX, EME) | Retrofitting permitted buildings for density gains appeal | Fewer new builds cut volume | Retrofit share, backlog conversion, margins |
Gas turbines (GEV, Siemens Energy, MHI) | Longer grid waits raise interest in on-site power | Air permits and pipelines still bind. Weaker load can cut reservations | Firm orders vs reservations, cancellations |
Hyperscalers (MSFT, AMZN, GOOG, META) | Slower capex could lift near-term cash flow | Less compute supply limits cloud and AI revenue | Revenue foregone vs capex saved |
Treat the table as scenario analysis. The post-election proposals are not enacted law, and the table assigns no probabilities. New York's existing executive action is a separate measure.
The GNG exposure map: screen data, not recommendations
The listed companies tied to data center power fall into six groups: utilities, owners of nuclear and independent power, gas turbine makers, grid equipment suppliers, cooling suppliers and builders. The table shows each name's GNG screen data at the November 6 close. Several popular power names screen as Hold or Sell today.
Ticker | Group | GNG Quant | Wall Street rating | Fwd P/E | 90-day EPS estimate change | 12-month return | From 52-week high |
|---|---|---|---|---|---|---|---|
(AEP) | Utility | Hold | Buy | 18.8 | +1.2% | +7.3% | -9.3% |
(D) | Utility | Hold | Hold | 18.2 | +0.3% | +20.0% | -3.6% |
(SO) | Utility | Hold | Hold | 18.9 | +0.3% | +2.6% | -6.2% |
(CEG) | Nuclear / IPP | Hold | Buy | 19.3 | +3.8% | -30.9% | -34.1% |
(VST) | Nuclear / IPP | Hold | Buy | 13.5 | -6.3% | -33.8% | -36.2% |
(TLN) | Nuclear / IPP | Sell | Buy | 11.4 | +10.3% | -16.1% | -24.7% |
(GEV) | Gas turbines | Strong Buy | Buy | 37.7 | +3.0% | +38.6% | -35.2% |
(ETN) | Grid equipment | Buy | Buy | 22.2 | +1.9% | -10.8% | -28.5% |
(HUBB) | Grid equipment | Hold | Buy | 19.6 | +0.7% | -7.4% | -23.6% |
(NVT) | Grid equipment | Strong Buy | Buy | 20.0 | +12.1% | -5.1% | -42.3% |
(VRT) | Cooling | Buy | Buy | 24.2 | +7.1% | -4.1% | -51.9% |
(MOD) | Cooling | Hold | Buy | 14.4 | -13.6% | -32.1% | -71.7% |
(TT) | Cooling | Buy | Buy | 23.3 | +0.1% | -7.4% | -20.4% |
(FIX) | Builder / contractor | Strong Buy | Buy | 16.2 | +4.2% | +3.1% | -50.9% |
(PWR) | Builder / contractor | Strong Buy | Buy | 27.2 | +8.5% | +19.3% | -31.4% |
(EME) | Builder / contractor | Buy | Buy | 15.3 | +9.2% | -9.9% | -36.0% |
(STRL) | Builder / contractor | Strong Buy | Buy | 10.7 | +7.6% | -38.5% | -74.9% |
How to read it. GNG Quant is GNG's quantitative screen, separate from the Wall Street rating column and from any Vulcan MK5 rating. Forward P/E and EPS estimate changes come from Finnhub's crowdsourced estimates, so treat them as estimates. Talen (TLN) is the only Sell in the table even with Wall Street at Buy.
Data is from the GNG database at the November 6 close and isn't a live quote. CEG and Vistra (VST) still show June 30 as their latest quarter in the dataset, and so does Southern (SO).
Siemens Energy and Mitsubishi Heavy Industries trade outside the US and aren't in the GNG dataset, so they have no row.
Notice what the table says as a whole. You might expect names with rising estimates to trade near their highs. Yet Vertiv plus four builders with rising estimates sit ~31% to ~75% below theirs: Comfort Systems (FIX), Quanta (PWR), EMCOR (EME) and Sterling (STRL). The grid equipment group of Eaton (ETN), Hubbell (HUBB) and nVent (NVT) sits ~24% to ~42% off its highs, with Trane (TT) ~20% off.
The three utilities show small estimate changes and sit within 10% of their highs, led by Dominion (D) at ~4% off. I read that as the market pricing execution and policy risk into the suppliers and treating regulated utilities as the safer seat. Rising estimates on falling prices is exactly the setup the falsifiers below are built to test.
If you want our earlier ranked list of AI power and utility names, see My 2026 Top 10 AI Power and Utilities Refresh (free registration). This guide builds on that list without replacing it.
Seven things that would break the power thesis
The "power is the binding constraint" thesis fails if efficiency outruns workload growth, customers cut spending, queue reform reveals much less real demand, new supply catches up, equipment shortages ease, policy blocks enough projects, or suppliers can't turn growth into cash.
What would weaken the thesis | What to watch | Where to find it |
|---|---|---|
Efficiency outruns workload growth | Facility electricity flattens while delivered AI workloads keep rising | LBNL and IEA updates, customer utilization disclosures |
Customers run out of budget before power runs out | Capex guidance cuts, contract cancellations, falling utilization | Hyperscaler 10-Qs, IREN, Nebius and CoreWeave results |
Queue reform removes much of the apparent demand | Deposit-backed requests and energized MW vs raw requests | ERCOT Batch Zero, PJM load forecasts, utility tariffs |
New supply catches up | Better reserve margins and lower capacity prices alongside real plant openings | PJM auction reports, ERCOT resource forecasts |
Equipment scarcity unwinds | Shorter lead times, supplier book-to-bill below one, turbine reservation lapses | GE Vernova, Siemens Energy and MHI results, contractor surveys |
Policy blocks enough projects | Signed orders, affected permits, cancelled contracted projects | State orders, PUC dockets, FERC filings |
Growth fails to become cash | Working capital and capex absorbing earnings, falling margins | VRT, MOD, FIX and PWR cash-flow statements |
Two cautions on reading these. A smaller queue can mean better filtering with the same real demand underneath. Capacity prices that fall only because of a regulatory cap don't prove supply is adequate either.
If you only track one falsifier, make it the last one. Power can stay physically scarce while a supplier's stock still disappoints because scarcity helps only the companies that convert it into free cash flow.
The Vulcan checklist for the power trade
Before you treat any company as a data center power winner, run it through these questions in order.
Is the megawatt operating? Energized and accepted capacity that's billing beats contracted, which beats announced.
Who pays for the grid connection? Check the tariff, the deposits and any minimum bill. Cost allocation is where regulators are focused right now.
Is the backlog firm? Separate firm orders from reservations and options.
Does growth convert to cash? Compare revenue growth with operating cash flow and margins.
Which timeline applies? Grid equipment runs in quarters and turbines in years, while new reactors run into the 2030s.
What is the policy exposure by site? A state headline can't tell you which projects are grandfathered.
What does the screen say today? Estimates and revisions move. Recheck before acting on anything here.
For a cash-flow case study on hyperscaler spending, see Google Doubled Its Cloud Business and Lost 10% Overnight. For the financing side of the AI capital cycle, see AI Stocks Are Selling Off. I Added to Nebius Anyway.
FAQ
How much electricity do US data centers use?
Lawrence Berkeley National Laboratory estimates US data centers used 192 TWh in 2024, 4.7% of US electricity. The figure is a modeled estimate and excludes crypto mining.
How much power will data centers need by 2030?
LBNL's reference case puts US data center use at 649 TWh in 2030, 11.8% of US electricity, with a range of 521 to 843 TWh. Globally the IEA projects 950 TWh in 2030, up from 485 TWh in 2025.
Is AI electricity demand the same as data center power demand?
No. AI is a growing share of data center demand. Data centers also run cloud, storage, streaming and enterprise workloads. The IEA expects AI-focused data center demand to roughly triple between 2025 and 2030.
Why do AI data centers need liquid cooling?
AI racks pack far more power into the same space. NVIDIA rates its GB300 NVL72 rack at up to 142 kW and designs its rack-scale systems for liquid cooling. Air alone can't carry that much heat away efficiently.
What is the difference between direct-to-chip and immersion cooling?
Direct-to-chip cooling pumps liquid through cold plates mounted on processors. Immersion cooling submerges servers in a dielectric fluid. They need different hardware, maintenance and building designs.
What is a CDU in data center cooling?
A coolant distribution unit controls coolant temperature, flow and pressure and can isolate the IT cooling loop from facility water. It supports direct-to-chip and immersion systems. It doesn't generate cooling on its own.
Can nuclear power data centers soon?
Existing reactors already do, through long-term contracts and restarts like Constellation's Crane project, targeted for 2027. New advanced reactors and SMRs are mostly expected in the 2030s, per DOE's Office of Nuclear Energy.
Does a nuclear power purchase agreement create new electricity?
Sometimes. A restart like Crane adds supply back to the grid. A contract on an existing plant like Clinton mostly preserves output that already exists. Clinton's new capacity is a 30 MW uprate.
Why are gas turbines used for data centers?
On-site gas turbines can power a campus while it waits for a grid connection. They need air permits, a gas supply and a turbine slot. GE Vernova alone reports 122 GW of gas backlog and reservations.
Will data center projects be cancelled after the 2026 election?
Some may be delayed, moved or cancelled. It depends on the orders and laws that actually pass and on each project's stage. Campaign platforms in Texas, Ohio and Georgia show intent. They are not enacted rules yet.
Sources
All sources retrieved November 7, 2026.
LBNL / DOE, United States Data Center Energy Usage Report: 2025 Update, June 18, 2026
EIA, Today in Energy (AEO2026 server electricity), May 19, 2026
IEA, Key Questions on Energy and AI, April 16, 2026
ERCOT market notice M-B051826-01, May 18, 2026
LBNL, Queued Up: 2026 Edition, June 2026
PJM, 2028/2029 capacity auction results, July 14, 2026
NJ BPU, investigation of PJM's capacity market, August 12, 2026
GE Vernova, Q3 2026 results, October 28, 2026
Siemens Energy, Q3 FY2026 earnings release, August 5, 2026
Mitsubishi Heavy Industries, 1H FY2026 presentation, November 6, 2026
NVIDIA, GB300 NVL72 reference architecture, March 2026
DOE, COOLERCHIPS announcement, May 9, 2023
Vertiv, Q3 2026 results (SEC exhibit 99.1), October 28, 2026
Modine, Q2 FY2027 results, November 3, 2026
Constellation, Crane Clean Energy Center and Q2 2026 results
Constellation and Meta, Clinton agreement, June 3, 2025
Talen Energy and Amazon, Susquehanna, June 11, 2025
Google, Kairos Power and TVA, Hermes 2, August 18, 2025
Amazon, X-energy and AEP in Indiana, October 2026
Meta, nuclear agreements with Vistra, TerraPower and Oklo, January 2026
DOE Office of Nuclear Energy, advantages and challenges of nuclear-powered data centers, April 8, 2025
FERC, PJM co-location order, December 18, 2025
Amy Acton campaign, conditional moratorium, July 27, 2026
Fortune, anti-data-center governors, November 4, 2026
Reuters via Fidelity, election results, November 4, 2026
New York Governor, data center permit pause, July 14, 2026
IREN, Q1 FY27 results (SEC), November 5, 2026, and Sweetwater Batch Zero release, September 8, 2026
GNG Research database, November 6, 2026 close. Forward estimates from Finnhub (crowdsourced)
This guide is educational research. It is not a recommendation to buy or sell any security.
Sign in to leave a comment and join the discussion.
Sign Up Free